 An official website of the United States government

Reclassification of Federally Funded Research and Development Centers as Federal Intramural Performers of R&D
As of federal FY 2021, the federal government’s obligations for research and development (R&D) totaled over $190 billion (table 1). Federal obligations for R&D originate from over 33 different departments and agencies for different missions, programs, and projects. These obligations are directed toward a variety of R&D performers, such as higher education institutions, businesses, and federal agencies themselves. The Survey of Federal Funds for Research and Development (Federal Funds Survey), sponsored by the National Center for Science and Engineering Statistics (NCSES) within the National Science Foundation (NSF), classifies performers of R&D as either extramural or intramural. Extramural performers are organizations outside the federal government that perform R&D with federal funds under contract, grant, or cooperative agreement. Intramural performers are agencies of the federal government, including federal employees who work on R&D both onsite and offsite.
Historically, the Federal Funds Survey has published data for six types of extramural performers: businesses (or industrial firms), higher education institutions (or universities and colleges), nonprofit organizations, state and local governments, non-U.S. (foreign) performers, and federally funded research and development centers (FFRDCs). However, with the release of Volume 71 (FYs 2021–22) of the Federal Funds Survey, data users should note a change in the classification of FFRDCs from extramural performers to intramural performers of R&D. This InfoBrief discusses the reclassification of FFRDCs and provides context for the change.
Federal obligations for R&D, by agency and performer: FY 2021
* = amount greater than $0 but less than $500,000.
FFRDC = federally funded research and development center.
a Federal agencies' activities cover costs associated with the administration of federal R&D performance and R&D procurements from nonfederal performers by federal personnel, transfers of funds to other federal agencies for purposes related to R&D, and actual federal performance.
b Higher education includes both public and private institutions as well as University Affiliated Research Centers.
Note(s):
Because of rounding, detail may not add to total. As of volume 71 (FYs 2021–22), FFRDCs are presented as intramural R&D, whereas they were presented as extramural in previous survey data. Data in trend tables have been revised to reflect the new classification. Only those agencies and subdivisions that had obligations in variables represented by this table appear in the table. FY 2021 obligations include additional funding provided by supplemental COVID-19 pandemic-related appropriations (e.g., Coronavirus Aid, Relief, and Economic Security [CARES] Act).
Source(s):
National Center for Science and Engineering Statistics, Survey of Federal Funds for Research and Development, FYs 2021–22.
Reclassification of FFRDCs as Federal Intramural Performers of R&D
In the 1940s, the federal government established FFRDCs to provide federal agencies with R&D capabilities that could not be met effectively by the federal government or the private sector alone. FFRDCS are owned but not administered by the federal government. The administrators include universities, nonprofit organizations, and businesses. Because FFRDCs are owned by the federal government but administered by others, they straddle a line between being both intramural (federally owned) and extramural (operated by others under federal contract or other agreement).
The Federal Funds Survey collects data on agency obligations for R&D by type of performer. The survey has historically presented FFRDCs in the category of extramural performers, based on the type of administrator: because the administrators were classified as extramural performers so too were the FFRDCs they administered. However, while FFRDCs may be administered by types of extramural performers, they are both reliant on federal funding for their R&D activities and the R&D they perform is directed by federal agencies’ needs and mission objectives or is similar to that of federally administered laboratories.
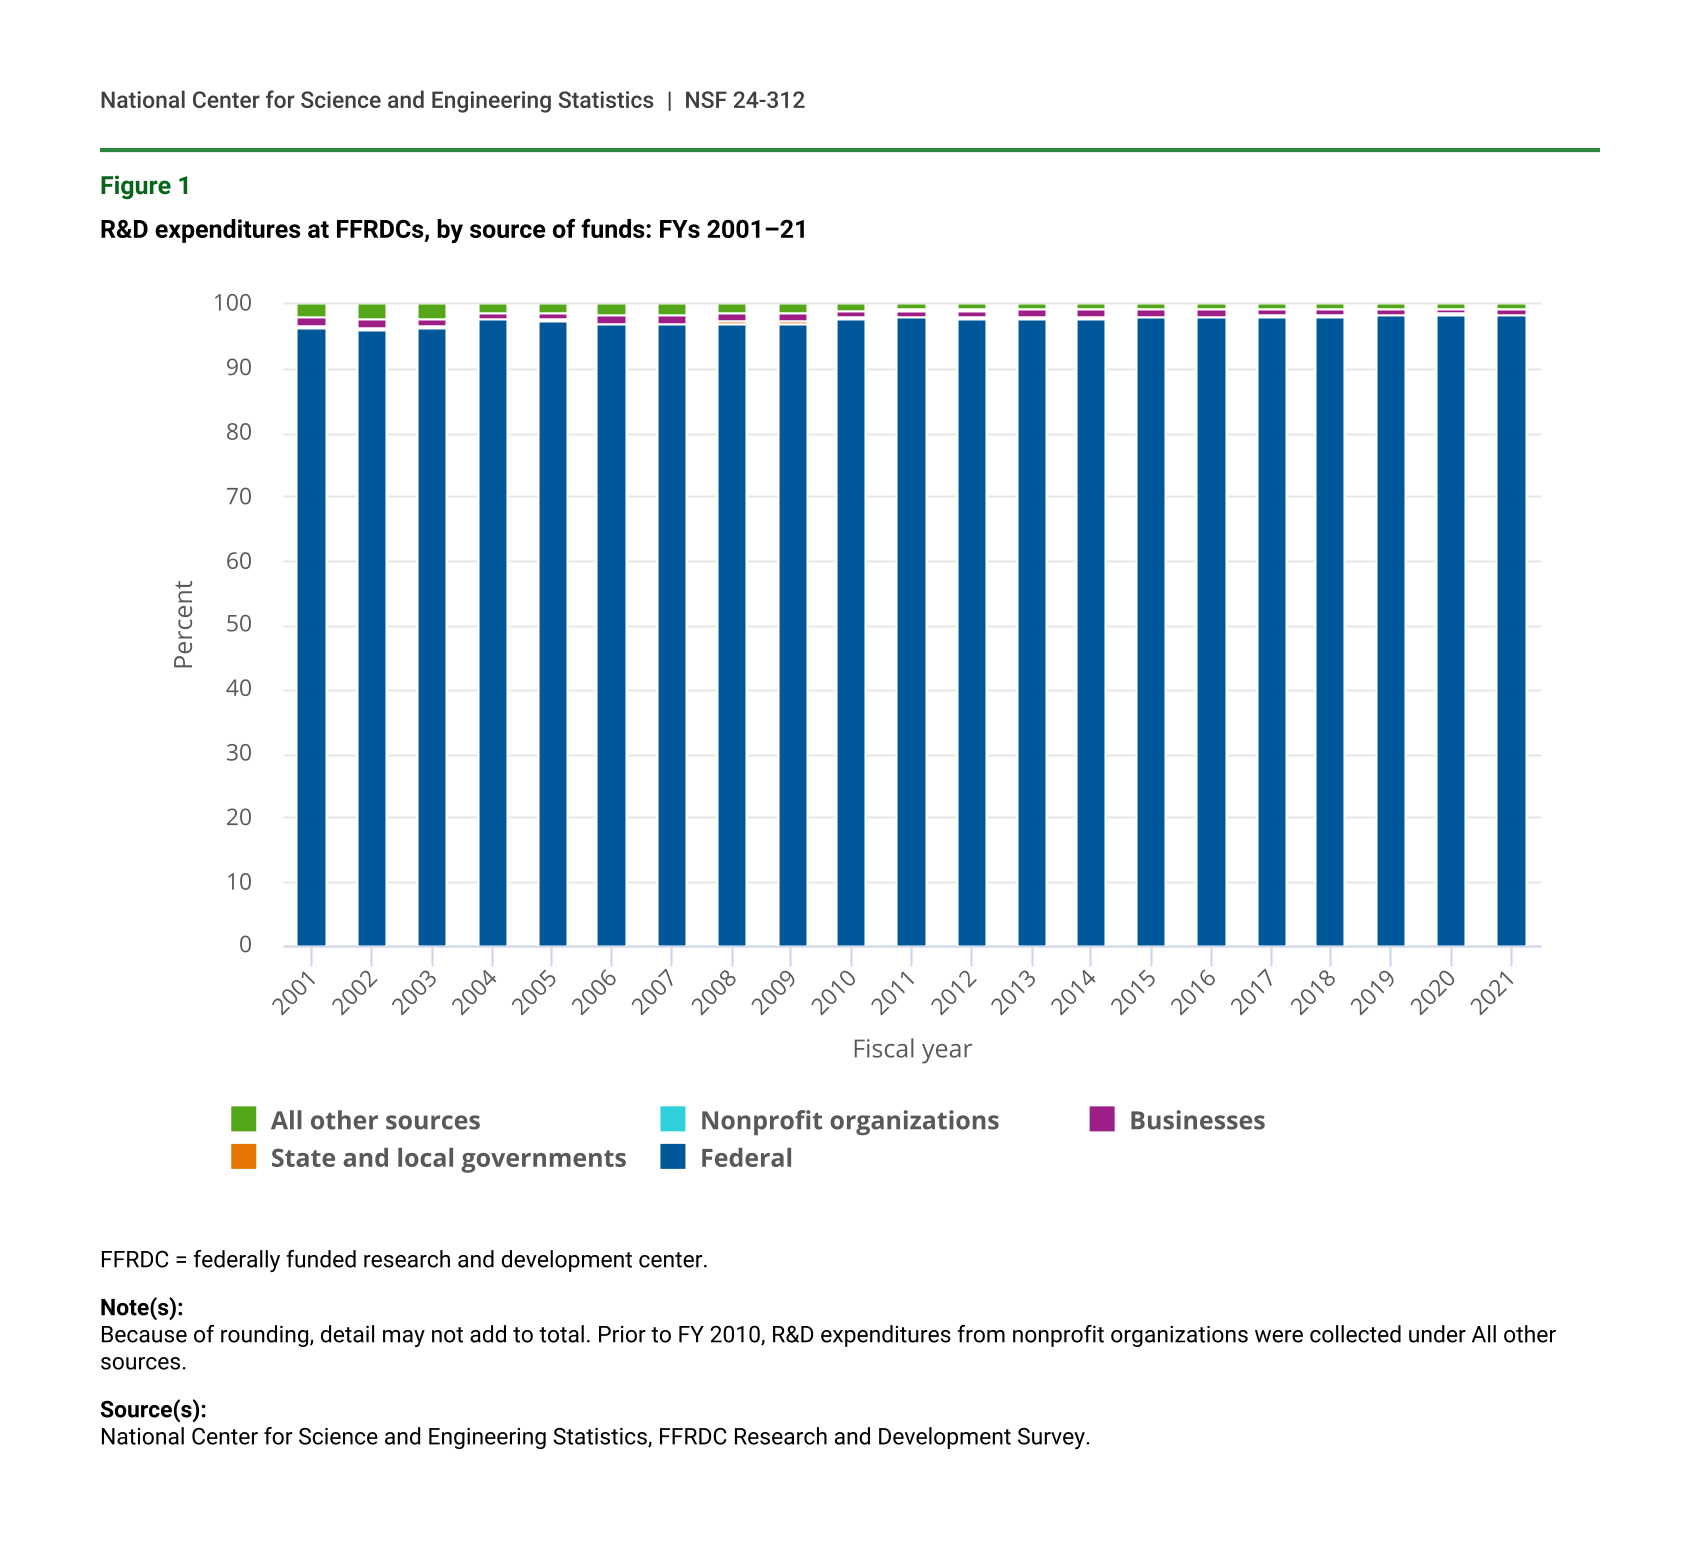
The FFRDC Research and Development Survey (FFRDC Survey), also sponsored by NCSES, collects expenditures for R&D performed directly by FFRDCs. Data from the FFRDC Survey show how dependent FFRDCs are on federal agency funding. As of FY 2021, 98.3% ($24.5 billion) of all FFRDC expenditures ($24.9 billion) were from federal funds, and the federal government’s share of funds has increased since 2001 (figure 1) when it was 96.4%.
In addition to financial dependence, control is another factor to consider in the classification of FFRDCs. The Organisation for Economic Co-operation and Development’s Frascati Manual—the international standard for collecting and reporting data on R&D—notes critical elements for the identification of government-sector units should include all nonmarket institutions controlled by a governmental unit. FFRDCs’ projects and program activities are directed by sponsoring federal agencies’ missions and needs, and FFRDCs rely on federal funding for their R&D. Therefore, by the international standard for measuring R&D, they are part of the government sector.
In summary, because FFRDCs are reliant on federal funding and are controlled by a governmental unit, as of FY 2021, the Federal Funds Survey treats federal agency obligations to FFRDCs as a type of intramural performer, instead of extramural performers as they had been previously classified. Because the data for the FFRDCs have not changed aside from the classification change from extramural to intramural performance, past years in the trend tables of the Volume 71 survey results forward have been adjusted to reflect the current classification of FFRDCs. Not only is this change in alignment with existing standards of control and financial dependence, but it also will bring the Federal Funds Survey in line with other existing classifications of FFRDCs as part of the government sector.
R&D expenditures at FFRDCs, by source of funds: FYs 2001–21
| Fiscal year | Federal | State and local governments | Businesses | Nonprofit organizations | All other sources |
|---|---|---|---|---|---|
| 2001 | 96.4 | 0.2 | 1.4 | na | 2.0 |
| 2002 | 96.2 | 0.3 | 1.2 | na | 2.4 |
| 2003 | 96.3 | 0.3 | 1.1 | na | 2.3 |
| 2004 | 97.5 | 0.2 | 0.9 | na | 1.3 |
| 2005 | 97.5 | 0.2 | 1.0 | na | 1.3 |
| 2006 | 97.0 | 0.2 | 1.3 | na | 1.5 |
| 2007 | 96.9 | 0.2 | 1.2 | na | 1.6 |
| 2008 | 97.2 | 0.2 | 1.3 | na | 1.3 |
| 2009 | 97.3 | 0.2 | 1.2 | na | 1.4 |
| 2010 | 97.7 | 0.3 | 0.9 | 0.1 | 1.0 |
| 2011 | 97.9 | 0.1 | 1.0 | 0.2 | 0.7 |
| 2012 | 97.8 | 0.2 | 1.0 | 0.3 | 0.7 |
| 2013 | 97.8 | 0.3 | 1.1 | 0.2 | 0.6 |
| 2014 | 97.8 | 0.2 | 1.2 | 0.2 | 0.6 |
| 2015 | 98.0 | 0.1 | 1.1 | 0.2 | 0.6 |
| 2016 | 98.1 | 0.1 | 1.0 | 0.2 | 0.6 |
| 2017 | 98.2 | 0.1 | 1.0 | 0.2 | 0.5 |
| 2018 | 98.1 | 0.2 | 0.9 | 0.2 | 0.5 |
| 2019 | 98.2 | 0.2 | 0.8 | 0.2 | 0.5 |
| 2020 | 98.4 | 0.2 | 0.7 | 0.2 | 0.5 |
| 2021 | 98.3 | 0.2 | 0.8 | 0.2 | 0.5 |
FFRDC = federally funded research and development center.
Note(s):
Because of rounding, detail may not add to total. Prior to FY 2010, R&D expenditures from nonprofit organizations were collected under All other sources.
Source(s):
National Center for Science and Engineering Statistics, FFRDC Research and Development Survey.
Treatments of FFRDCs as Governmental Entities in Other Classification Systems
Though NCSES had presented FFRDCs as extramural performers of R&D on the Federal Funds Survey until FY 2021, several data users have long treated FFRDCs as an intramural component of the federal R&D enterprise.
As part of their investigation on the classification of R&D in the System of National Accounts (SNA) as investment rather than consumption expenditures, the Bureau of Economic Analysis (BEA) reached out to NSF in November 2004 to better understand how to classify R&D performed by FFRDCs. BEA sought to determine if FFRDCs should be part of the government sector or within the sectors of the administrating entities under the SNA. The SNA is the internationally agreed standard set of recommendations on how to compile measures of economic activity. To empirically address this question, in January 2005 NSF’s Science Resource Studies Division (the predecessor to NCSES) asked FFRDCs whether the R&D they perform is more similar to that performed by federally administered laboratories or more similar to that performed by industry, universities, or nonprofit organizations. “Of the $12.1 billion in expenditures at the surveyed labs, 87% was reported by the FFRDCs to be more similar to that performed in federally administered labs, 10% was reported as more similar to that performed in other labs, and 3% was reported as either a mix of the two or nonresponse.” Subsequently, BEA determined that because FFRDCs are owned or otherwise controlled and financed by the federal government and administered under government contracts, they would classify all FFRDCs as part of the general government sector, regardless of who administers them. This assignment was consistent with the SNA guidelines on control and finance of organizations’ economic activity.
Other NCSES reports also have included FFRDCs as part of the federal intramural totals. Specifically, the National Patterns of R&D Resources (National Patterns) series, which is the primary source of information on the U.S. portfolio of R&D performance, presents data on the overall R&D effort in the United States. Information includes R&D expenditures by performing sector, source of funds, type of R&D, and R&D-to-GDP ratio. The results of the National Patterns report are used to develop international comparisons of R&D. Prior to 1995, R&D expenditures of FFRDCs generally were collected and reported in the sectors of their administrators. This classification methodology became problematic when individual FFRDC administrators changed and were part of different sectors. For example, due to a contract recompete, management of an industry-administered FFRDC could change to a university consortium and thus change sectors even though the FFRDC was still government-owned, government-financed, and performing government-directed R&D. Since 1995—with the availability of separate statistics for university-administered, industry-administered, and nonprofit-administered FFRDCs—the National Patterns report has classified FFRDCs as a component of the federal performing sector.
In addition, the Federal Laboratory Consortium for Technology Transfer (FLC) includes FFRDCs as part of the intramural categorization of federal labs. The National Institute of Standards and Technology (NIST) calculates an assessment of federal agency budgets that are contributed to the FLC. The formula for assessing agency contributions is based on the amount of federal intramural R&D obligated and reported on the Federal Funds Survey. For the purposes of its assessment, NIST includes FFRDCs as part of the intramural category along with other federal performance obligations.
Effect of FFRDC Reclassification on Federal Funds Survey
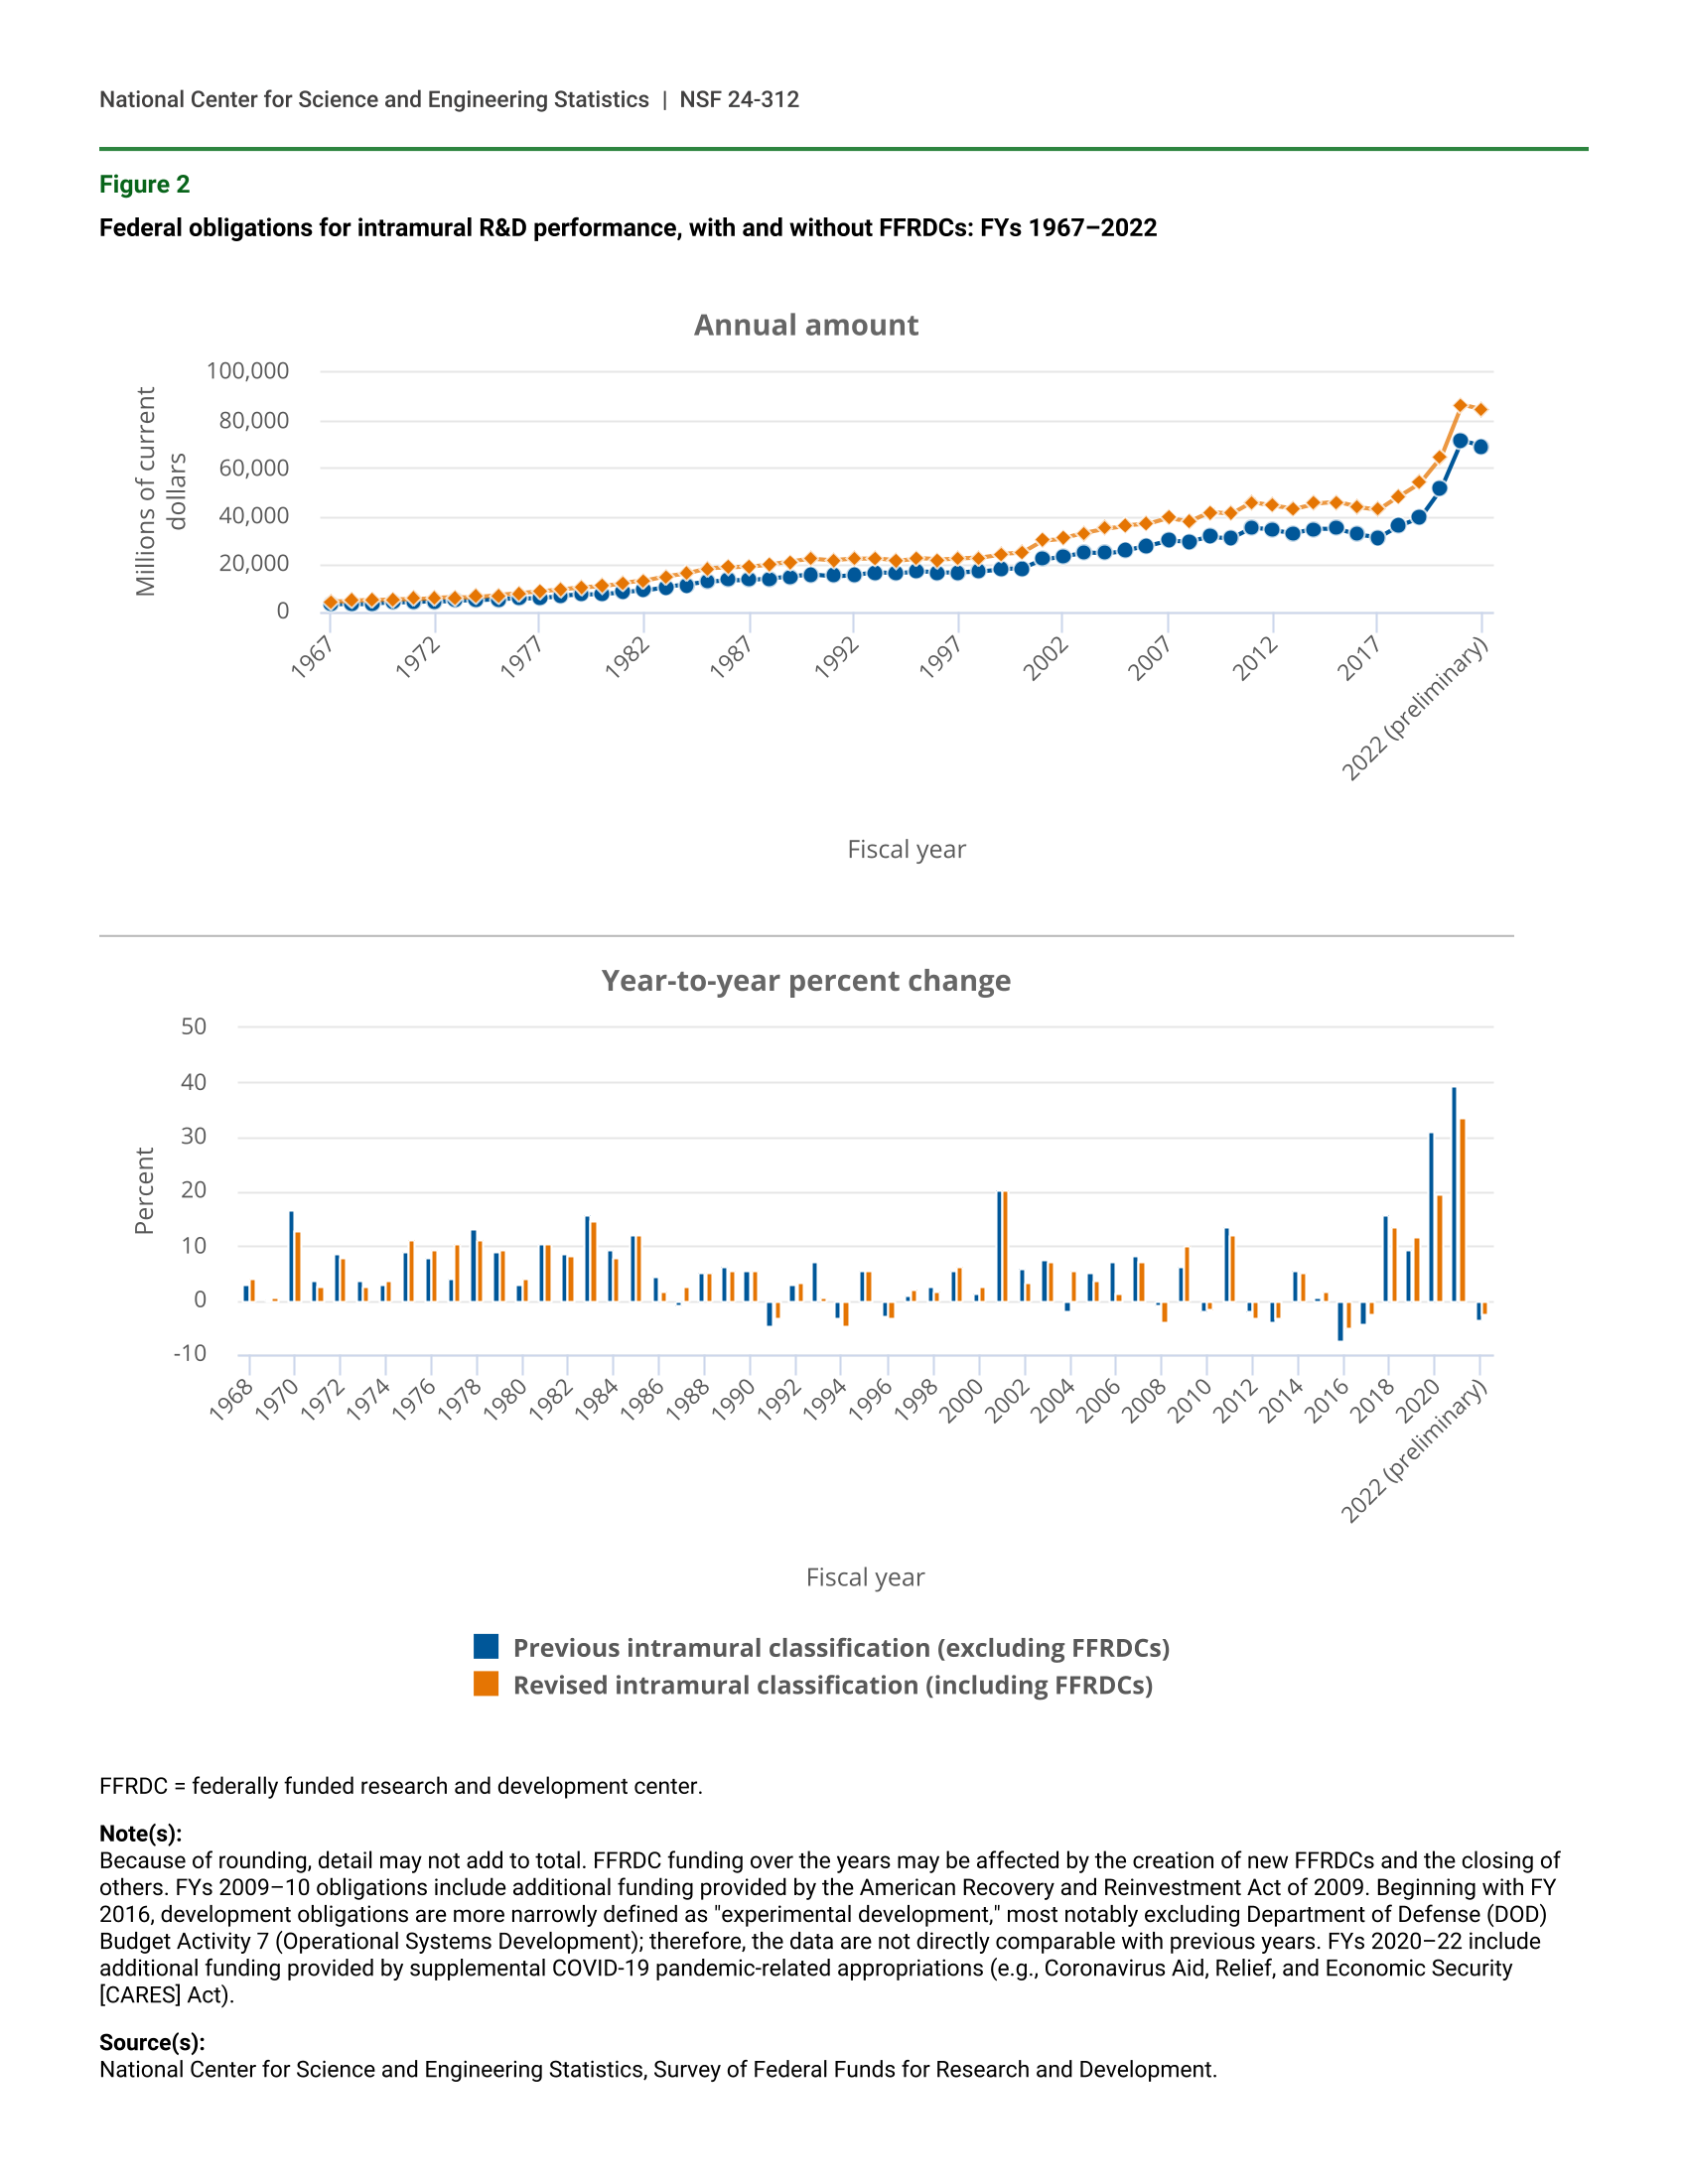
Just as the SNA, National Patterns report, and the FLC all treat FFRDCs as part of the federal government, it is appropriate for NCSES to reclassify FFRDCs in the Federal Funds Survey as intramural performers of R&D rather than extramural. Nonetheless, data users may ask what this change means for the Federal Funds Survey results. With the FFRDC reclassification to intramural performers, the FY 2021 federal intramural total was $86.5 billion; under the previous classification where FFRDCs were external performers, the federal intramural total would have been $14.8 billion less (figure 2). In trend data, adjusting prior years to reclassify obligations to FFRDCs as intramural raises the overall level of intramural R&D obligations while reducing year-to-year percent changes. For example, the year-to-year percent change for FY 2021 excluding FFRDCs would have been 39.2%; under the new classification that includes FFRDCs, the FY 2021 percent change is 33.8%. Data users should note that while the FY 2020 and FY 2021 percent changes for federal intramural obligations appear large compared to previous years, they are affected by COVID-19 pandemic-related stimulus funds.
Federal obligations for intramural R&D performance, with and without FFRDCs: FYs 1967–2022
| Fiscal year | Previous intramural classification (excluding FFRDCs) | Revised intramural classification (including FFRDCs) |
|---|---|---|
| 1967 | 3,396 | 4,671 |
| 1968 | 3,493 | 4,855 |
| 1969 | 3,501 | 4,891 |
| 1970 | 4,079 | 5,508 |
| 1971 | 4,228 | 5,647 |
| 1972 | 4,589 | 6,095 |
| 1973 | 4,762 | 6,253 |
| 1974 | 4,911 | 6,492 |
| 1975 | 5,354 | 7,213 |
| 1976 | 5,769 | 7,875 |
| 1977 | 6,012 | 8,702 |
| 1978 | 6,810 | 9,680 |
| 1979 | 7,418 | 10,593 |
| 1980 | 7,632 | 11,015 |
| 1981 | 8,426 | 12,156 |
| 1982 | 9,141 | 13,145 |
| 1983 | 10,582 | 15,058 |
| 1984 | 11,572 | 16,263 |
| 1985 | 12,945 | 18,241 |
| 1986 | 13,535 | 18,551 |
| 1987 | 13,413 | 18,993 |
| 1988 | 14,115 | 20,006 |
| 1989 | 15,025 | 21,100 |
| 1990 | 15,849 | 22,247 |
| 1991 | 15,138 | 21,589 |
| 1992 | 15,583 | 22,301 |
| 1993 | 16,663 | 22,482 |
| 1994 | 16,132 | 21,454 |
| 1995 | 17,025 | 22,613 |
| 1996 | 16,540 | 21,879 |
| 1997 | 16,718 | 22,368 |
| 1998 | 17,122 | 22,804 |
| 1999 | 18,085 | 24,223 |
| 2000 | 18,313 | 24,813 |
| 2001 | 22,047 | 29,872 |
| 2002 | 23,357 | 30,874 |
| 2003 | 25,118 | 33,099 |
| 2004 | 24,573 | 34,947 |
| 2005 | 25,871 | 36,246 |
| 2006 | 27,675 | 36,793 |
| 2007 | 29,933 | 39,316 |
| 2008 | 29,638 | 37,830 |
| 2009 | 31,544 | 41,744 |
| 2010 | 30,912 | 41,013 |
| 2011 | 35,145 | 45,931 |
| 2012 | 34,366 | 44,424 |
| 2013 | 32,963 | 43,043 |
| 2014 | 34,736 | 45,301 |
| 2015 | 34,925 | 46,044 |
| 2016 | 32,351 | 43,774 |
| 2017 | 30,990 | 42,684 |
| 2018 | 35,953 | 48,408 |
| 2019 | 39,313 | 54,004 |
| 2020 | 51,472 | 64,622 |
| 2021 | 71,665 | 86,456 |
| 2022 (preliminary) | 69,232 | 84,394 |
| Fiscal year | Previous intramural classification (excluding FFRDCs) | Revised intramural classification (including FFRDCs) |
|---|---|---|
| 1968 | 2.9 | 3.9 |
| 1969 | 0.2 | 0.7 |
| 1970 | 16.5 | 12.6 |
| 1971 | 3.7 | 2.5 |
| 1972 | 8.5 | 7.9 |
| 1973 | 3.8 | 2.6 |
| 1974 | 3.1 | 3.8 |
| 1975 | 9.0 | 11.1 |
| 1976 | 7.8 | 9.2 |
| 1977 | 4.2 | 10.5 |
| 1978 | 13.3 | 11.2 |
| 1979 | 8.9 | 9.4 |
| 1980 | 2.9 | 4.0 |
| 1981 | 10.4 | 10.4 |
| 1982 | 8.5 | 8.1 |
| 1983 | 15.8 | 14.6 |
| 1984 | 9.4 | 8.0 |
| 1985 | 11.9 | 12.2 |
| 1986 | 4.6 | 1.7 |
| 1987 | -0.9 | 2.4 |
| 1988 | 5.2 | 5.3 |
| 1989 | 6.4 | 5.5 |
| 1990 | 5.5 | 5.4 |
| 1991 | -4.5 | -3.0 |
| 1992 | 2.9 | 3.3 |
| 1993 | 6.9 | 0.8 |
| 1994 | -3.2 | -4.6 |
| 1995 | 5.5 | 5.4 |
| 1996 | -2.8 | -3.2 |
| 1997 | 1.1 | 2.2 |
| 1998 | 2.4 | 1.9 |
| 1999 | 5.6 | 6.2 |
| 2000 | 1.3 | 2.4 |
| 2001 | 20.4 | 20.4 |
| 2002 | 5.9 | 3.4 |
| 2003 | 7.5 | 7.2 |
| 2004 | -2.2 | 5.6 |
| 2005 | 5.3 | 3.7 |
| 2006 | 7.0 | 1.5 |
| 2007 | 8.2 | 6.9 |
| 2008 | -1.0 | -3.8 |
| 2009 | 6.4 | 10.3 |
| 2010 | -2.0 | -1.8 |
| 2011 | 13.7 | 12.0 |
| 2012 | -2.2 | -3.3 |
| 2013 | -4.1 | -3.1 |
| 2014 | 5.4 | 5.2 |
| 2015 | 0.5 | 1.6 |
| 2016 | -7.4 | -4.9 |
| 2017 | -4.2 | -2.5 |
| 2018 | 16.0 | 13.4 |
| 2019 | 9.3 | 11.6 |
| 2020 | 30.9 | 19.7 |
| 2021 | 39.2 | 33.8 |
| 2022 (preliminary) | -3.4 | -2.4 |
FFRDC = federally funded research and development center.
Note(s):
Because of rounding, detail may not add to total. FFRDC funding over the years may be affected by the creation of new FFRDCs and the closing of others. FYs 2009–10 obligations include additional funding provided by the American Recovery and Reinvestment Act of 2009. Beginning with FY 2016, development obligations are more narrowly defined as "experimental development," most notably excluding Department of Defense (DOD) Budget Activity 7 (Operational Systems Development); therefore, the data are not directly comparable with previous years. FYs 2020–22 include additional funding provided by supplemental COVID-19 pandemic-related appropriations (e.g., Coronavirus Aid, Relief, and Economic Security [CARES] Act).
Source(s):
National Center for Science and Engineering Statistics, Survey of Federal Funds for Research and Development.
Redesign of the Federal Funds Survey
Between 2018 and 2021 NCSES engaged in a redesign of the Federal Funds Survey and the Survey of Federal Science and Engineering Support to Universities, Colleges, and Nonprofit Institutions (Federal Support Survey). The goals of the redesign were to (1) update the survey instruments to reflect best practices in survey design principles and transform the surveys from a series of tables to a series of questions that would integrate definitions and instructions with each question, and (2) expand the current survey items to collect additional detail most often requested by data users. The redesign also presented the ideal opportunity to revise the Federal Funds survey’s treatment of FFRDCs to align with the international standard and other existing treatments.
As part of the redesign effort, NCSES held a data user workshop, assembled an expert panel for consultation, worked with survey methodology experts, visited multiple federal agency respondents to receive and test input on changes to the survey, held a series of cognitive interviews with agency respondents, and conducted usability testing on the new survey design. The redesigned Federal Funds Survey was fielded in May 2022 for Volume 71 canvassing federal FYs 2021 and 2022.
Changes associated with the redesign include the integration of the Federal Support Survey as a module within the Federal Funds Survey. (NCSES will continue to publish these data separately, at their respective homepages.) Other new questions were added to the standard and the Department of Defense versions of the questionnaire. These new questions cover the following for the fiscal year just completed:
- R&D deobligation.
- Nonfederal R&D obligations by type of agreement (e.g., grants and contracts).
- R&D obligations provided to other federal agencies in the form of intergovernmental transfers.
- R&D and R&D plant obligations to university-affiliated research centers.
One new question added solely to the DOD questionnaire was for obligations associated with Small Business Innovation Research and Small Business Technology Transfer programs, for the fiscal year just completed and the current fiscal year at the time of collection. Many of the other survey questions were reorganized and revised.
Some changes made within the questions were for consistency with other NCSES surveys. The survey redesign provided an opportunity for NCSES to reclassify FFRDCs as intramural performers rather than extramural performers. Other changes include retitling of certain performer categories, where “industry” was changed to “businesses” and “universities and colleges” was changed to “higher education.” For additional details see the survey Technical Notes and the report Federal Obligations for R&D Increased Nearly 14% in FY 2021, Supported by COVID-19 Pandemic-Related Funding.
Data Sources, Limitations, and Data Availability
The statistics on federal agency obligations presented in this report come from Volume 71 of the Survey of Federal Funds for Research and Development. This survey is completed by federal agencies that fund R&D programs, and it collects data on federal agency R&D obligations by type of R&D (i.e., basic research, applied research, and experimental development), type of R&D by field of R&D (e.g., computer sciences, geosciences, life sciences, engineering), type of R&D by type of performer (i.e., federal agencies, FFRDCs, businesses, higher education, nonprofit organizations, state and local governments, and non-U.S. performers), and type of performer by geography (i.e., state or country). The survey is a census completed by federal agencies that conduct R&D programs and has been conducted continuously since 1952 (Volume 1). Actual data are collected for the fiscal year just completed; estimates are collected for the current fiscal year at the time of collection. The full set of data tables from this survey and more information on the survey methodology are available at https://ncses.nsf.gov/surveys/federal-funds-research-development/2021-2022#methodology. Although the Federal Funds Survey is a census of federal agencies that fund R&D and there is no sampling error, survey data are still subject to some degree of unmeasurable nonsampling error, which may include errors in classification or measurement of certain aspects of agency R&D. For additional information see the “Survey Quality Measures” within the Technical Notes.
The statistics on FFRDC R&D expenditures presented in this InfoBrief come from the FY 2021 FFRDC Research and Development Survey. This annual survey is completed by FFRDC administrators and collects data from FFRDCs on R&D expenditures by source of funds (federal government, state and local governments, businesses, nonprofit organizations, or other); federal agency source; type of R&D (basic research, applied research, or experimental development); type of cost (salaries, software, equipment, subcontracts, other direct costs, and indirect costs); and total operating budget. This survey has been a census of the full population of FFRDCs since FY 2001. For a list of criteria used to define the set of FFRDCs, see the general guidelines of the Master Government List of FFRDCs at https://www.nsf.gov/statistics/ffrdclist/#guide&gennotes.
Notes
1Obligations represent the amount for orders placed, contracts awarded, services received, and similar transactions during a given period, regardless of when the funds were appropriated or when future payment of money is required.
2Federally Funded Research and Development Centers (FFRDCs): Background and issues for Congress. Congressional Research Service, R44629, version 8, Updated 27 August 2021. Summary. Available at https://crsreports.congress.gov/product/pdf/R/R44629/8. See also Federal Acquisition Regulation, 35.017 at https://www.acquisition.gov/far/35.017.
3Expenditures for R&D are actual payments of funds in a given fiscal year for work performed during that time that liquidates outstanding obligations made over several fiscal periods.
4Organisation for Economic Co-operation and Development (OECD). Frascati Manual: Guidelines for Collecting and Reporting Data on Research and Experimental Development (2015), See §3.60 through 3.64, Figure 3.1, §8.12, §8.15, and Box 8.1.
5As of volume 71 (FYs 2021–22), FFRDCs are classified as intramural R&D performers, whereas they were extramural in previous volumes; therefore, data are not directly comparable across volumes. Past years in the trend tables have been adjusted to reflect the current classification of FFRDCs. See tables 84 through 89 in the full set of data tables.
6For more information see https://unstats.un.org/unsd/nationalaccount/sna.asp.
7Robbins, Carol A. Linking Frascati-based R&D Spending to the System of National Accounts. 17 March 2006. Bureau of Economic Analysis, page 15. https://www.bea.gov/system/files/papers/WP2006-3.pdf.
8Robbins 2006, page 15, https://www.bea.gov/system/files/papers/WP2006-3.pdf.
9FFRDCs were presented to the public as part of the National Patterns classification as federal intramural R&D for the first time in: Jankowski J. U.S. R&D Spending Will Not Pick Up in '95, NSF 95-335; 18 October 1995. http:/www.nsf.gov/statistics/databrf/sdb95335.pdf.
10The Federal Laboratory Consortium for Technology Transfer is the formally chartered, nationwide network of over 300 federal laboratories, agencies, and research centers that fosters commercialization, best practice strategies, and opportunities, for accelerating federal technologies out of the labs and into the marketplace. https://federallabs.org/about/who-we-are/mission-vision.
11In accordance with Chapter 63 USC Annotated Title 15 Section 3710, an amount equal to 0.008 percent (0.008%) of the budget of each federal agency from any federal source, included related overhead, that is to be utilized by or on behalf of the laboratories of such agency during each fiscal year shall be transferred by such agency to the National Institute of Standards and Technology at the beginning of the fiscal year involved. A transfer shall be made by any federal agency for any fiscal year only if the amount so transferred would exceed $10,000. Amounts so transferred shall be provided by the Institute to the Consortium for the purpose of carrying out the activities of the Consortium. Bylaws Federal Laboratory Consortium for Technology Transfer, Article III, Section 4.a. https://federallabs.org/getmedia/f20ef1ac-d916-4fef-af64-8d5e9e7fb6b6/FLC-Bylaws-June-2022-Final.pdf.
12There is no assumption or belief that specific reporting conventions of NCSES guide the implementation of FLC-related legislation.
13For additional information on the effect of COVID-19 pandemic-related stimulus funds on federal intramural R&D see Pece CV; National Center for Science and Engineering Statistics (NCSES). 2022. Driven by Stimulus Funding, Federal R&D Obligations Increased 18% in 2020; Largest Year-to-Year Change since 1963. NSF 22-324. Alexandria, VA: National Science Foundation. Available at https://ncses.nsf.gov/pubs/nsf22324. In addition, also see Pece CV; National Center for Science and Engineering Statistics (NCSES). 2023. Federal Obligations for R&D Increased Nearly 14% in FY 2021, Supported by COVID-19 Pandemic-Related Funding. NSF 23-35. Alexandria, VA: National Science Foundation. https://ncses.nsf.gov/pubs/nsf23352.
14Federal Funds Survey products are available at https://ncses.nsf.gov/surveys/federal-funds-research-development/ and Federal Support Survey products at https://ncses.nsf.gov/surveys/federal-support-survey/.
Suggested Citation
Pece CV.; National Center for Science and Engineering Statistics (NCSES). 2024. Reclassification of Federally Funded Research and Development Centers as Federal Intramural Performers of R&D. NSF 24-312. Alexandria, VA: National Science Foundation. Available at https://ncses.nsf.gov/pubs/nsf24312.
Contact Us
NCSES
National Center for Science and Engineering Statistics
Directorate for Social, Behavioral and Economic Sciences
National Science Foundation
2415 Eisenhower Avenue, Suite W14200
Alexandria, VA 22314
Tel: (703) 292-8780
FIRS: (800) 877-8339
TDD: (800) 281-8749
E-mail: ncsesweb@nsf.gov
NSF 24-312
|January 4, 2024