 An official website of the United States government

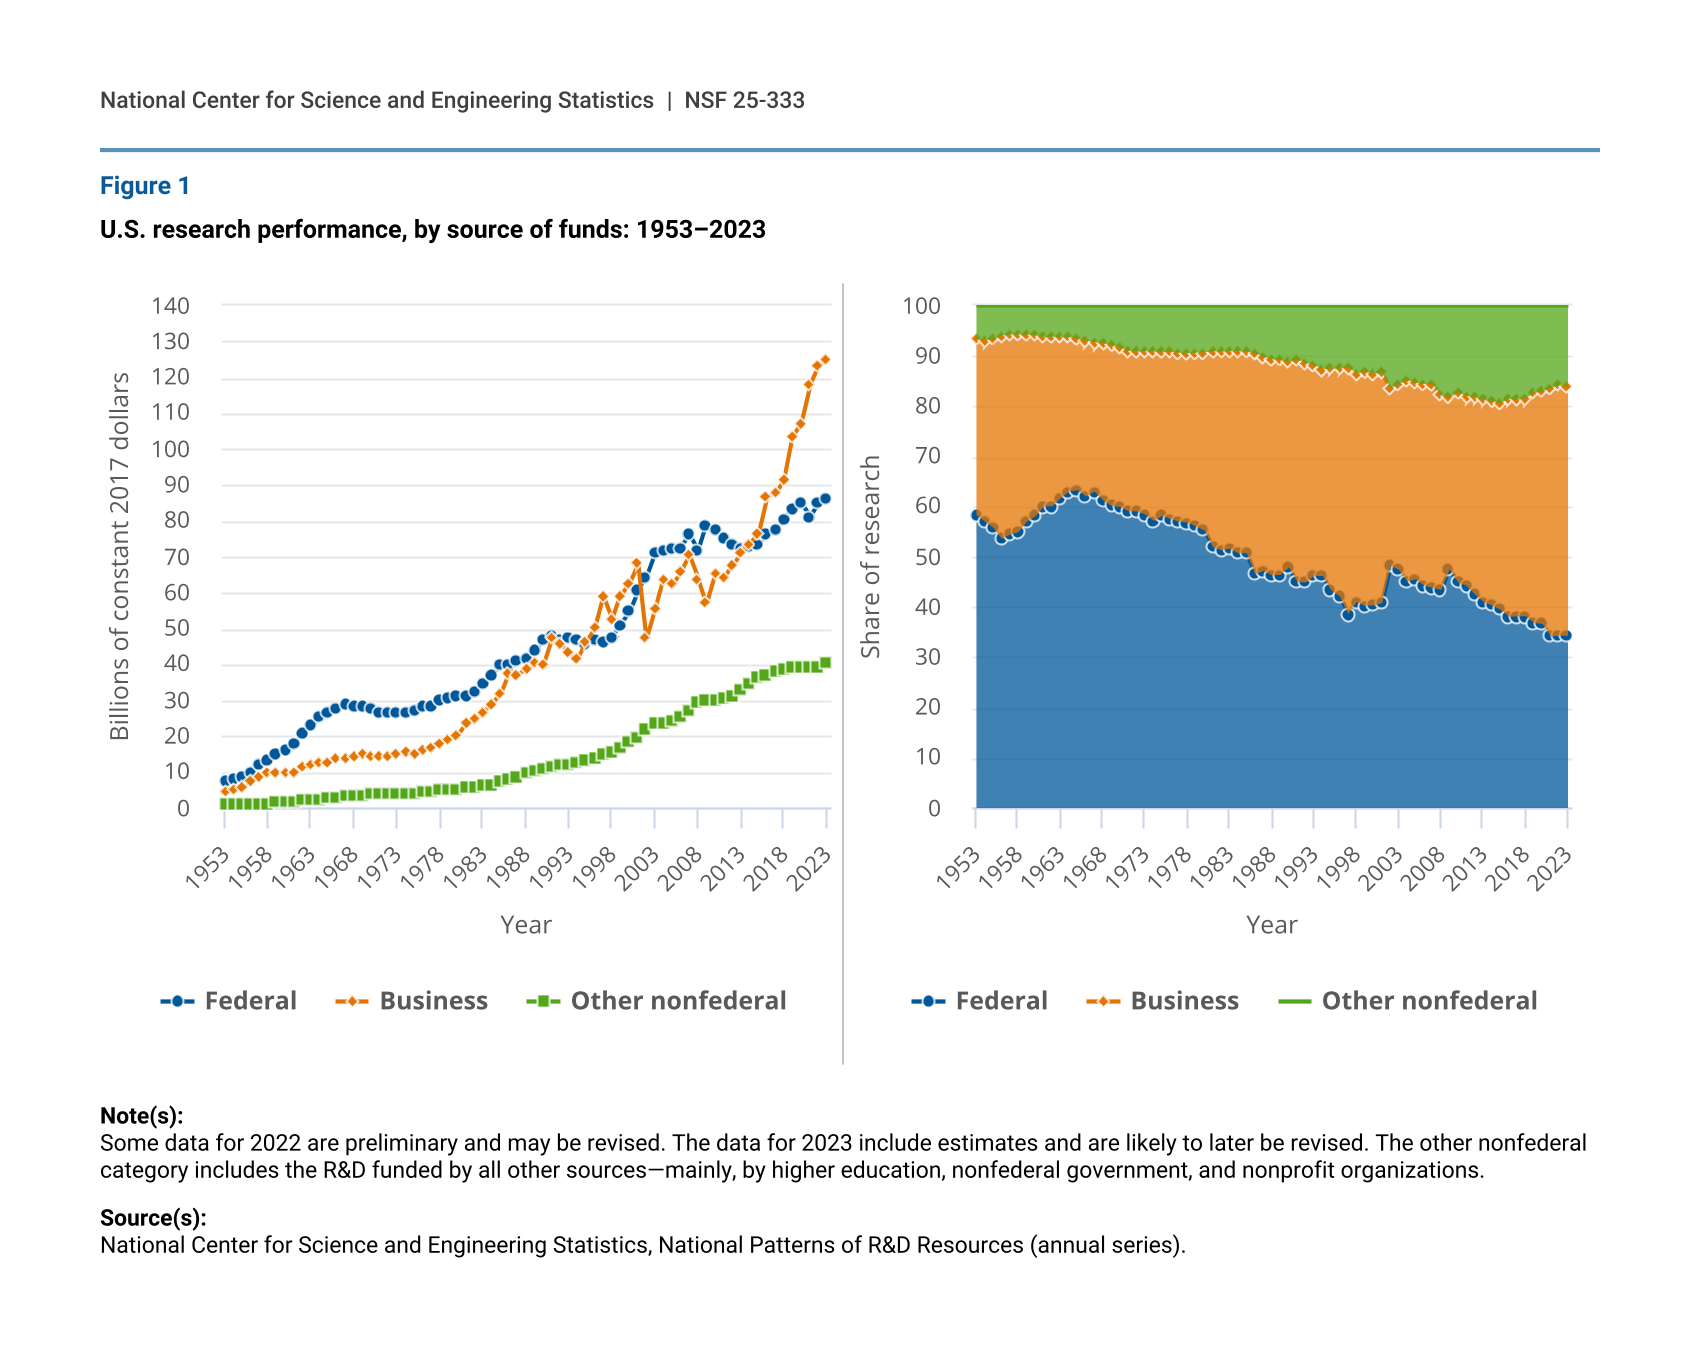
Business Sector Funded Half of U.S. Research Performance in 2022
U.S. research performance, by source of funds: 1953–2023
| Year | Federal | Business | Other nonfederal |
|---|---|---|---|
| 1953 | 7.6 | 4.5 | 0.9 |
| 1954 | 7.9 | 5.0 | 1.0 |
| 1955 | 8.4 | 5.6 | 1.0 |
| 1956 | 9.9 | 7.5 | 1.1 |
| 1957 | 11.9 | 8.7 | 1.3 |
| 1958 | 13.5 | 9.6 | 1.4 |
| 1959 | 15.0 | 9.8 | 1.5 |
| 1960 | 16.3 | 10.1 | 1.7 |
| 1961 | 17.8 | 9.9 | 1.9 |
| 1962 | 20.9 | 11.8 | 2.2 |
| 1963 | 23.0 | 11.9 | 2.4 |
| 1964 | 25.5 | 12.5 | 2.6 |
| 1965 | 26.9 | 12.8 | 2.8 |
| 1966 | 27.6 | 13.8 | 3.1 |
| 1967 | 28.8 | 13.6 | 3.4 |
| 1968 | 28.5 | 14.6 | 3.5 |
| 1969 | 28.1 | 14.9 | 3.7 |
| 1970 | 27.7 | 14.7 | 3.9 |
| 1971 | 26.6 | 14.3 | 4.1 |
| 1972 | 26.7 | 14.4 | 4.1 |
| 1973 | 26.9 | 15.0 | 4.2 |
| 1974 | 26.7 | 15.7 | 4.3 |
| 1975 | 27.1 | 15.2 | 4.3 |
| 1976 | 28.2 | 16.3 | 4.5 |
| 1977 | 28.6 | 16.9 | 4.8 |
| 1978 | 30.1 | 17.9 | 5.0 |
| 1979 | 30.9 | 19.1 | 5.2 |
| 1980 | 31.5 | 20.3 | 5.3 |
| 1981 | 31.3 | 23.5 | 5.5 |
| 1982 | 32.4 | 24.9 | 5.8 |
| 1983 | 34.9 | 26.6 | 6.2 |
| 1984 | 36.8 | 29.2 | 6.6 |
| 1985 | 40.0 | 31.7 | 7.3 |
| 1986 | 39.8 | 37.7 | 8.2 |
| 1987 | 41.3 | 37.2 | 8.9 |
| 1988 | 41.5 | 38.6 | 9.6 |
| 1989 | 44.0 | 40.5 | 10.3 |
| 1990 | 46.8 | 39.9 | 11.0 |
| 1991 | 48.2 | 47.5 | 11.6 |
| 1992 | 46.9 | 45.7 | 11.9 |
| 1993 | 47.5 | 43.1 | 12.3 |
| 1994 | 46.6 | 41.7 | 12.8 |
| 1995 | 45.6 | 46.5 | 13.3 |
| 1996 | 47.0 | 50.4 | 14.0 |
| 1997 | 46.3 | 59.0 | 14.8 |
| 1998 | 47.4 | 52.6 | 15.6 |
| 1999 | 51.0 | 59.1 | 16.7 |
| 2000 | 54.7 | 62.5 | 18.4 |
| 2001 | 60.7 | 68.1 | 19.9 |
| 2002 | 64.5 | 47.2 | 22.0 |
| 2003 | 71.3 | 55.5 | 23.6 |
| 2004 | 71.7 | 63.7 | 23.6 |
| 2005 | 72.3 | 62.2 | 24.5 |
| 2006 | 72.6 | 65.9 | 25.7 |
| 2007 | 76.1 | 70.4 | 27.3 |
| 2008 | 71.7 | 63.8 | 29.5 |
| 2009 | 78.9 | 57.0 | 30.2 |
| 2010 | 77.7 | 65.4 | 30.2 |
| 2011 | 75.1 | 64.2 | 30.6 |
| 2012 | 73.3 | 67.6 | 31.5 |
| 2013 | 72.4 | 70.9 | 33.2 |
| 2014 | 72.9 | 73.6 | 34.5 |
| 2015 | 73.7 | 76.5 | 36.3 |
| 2016 | 76.3 | 86.9 | 37.3 |
| 2017 | 77.5 | 87.7 | 38.2 |
| 2018 | 80.7 | 91.6 | 38.9 |
| 2019 | 83.3 | 103.3 | 39.4 |
| 2020 | 84.8 | 107.3 | 39.5 |
| 2021 | 81.1 | 117.9 | 39.1 |
| 2022 | 84.9 | 123.1 | 39.4 |
| 2023 | 86.4 | 125.2 | 40.7 |
| Year | Federal | Business | Other nonfederal |
|---|---|---|---|
| 1953 | 58.4 | 34.9 | 6.8 |
| 1954 | 57.0 | 36.1 | 6.9 |
| 1955 | 55.8 | 37.4 | 6.8 |
| 1956 | 53.6 | 40.4 | 6.0 |
| 1957 | 54.4 | 39.8 | 5.8 |
| 1958 | 54.9 | 39.3 | 5.8 |
| 1959 | 57.0 | 37.1 | 5.8 |
| 1960 | 58.0 | 36.0 | 5.9 |
| 1961 | 60.1 | 33.6 | 6.4 |
| 1962 | 60.1 | 33.8 | 6.2 |
| 1963 | 61.7 | 31.9 | 6.4 |
| 1964 | 63.0 | 30.7 | 6.3 |
| 1965 | 63.3 | 30.1 | 6.7 |
| 1966 | 62.0 | 31.0 | 7.0 |
| 1967 | 62.9 | 29.7 | 7.3 |
| 1968 | 61.2 | 31.3 | 7.5 |
| 1969 | 60.2 | 32.0 | 7.9 |
| 1970 | 59.9 | 31.7 | 8.4 |
| 1971 | 59.1 | 31.9 | 9.0 |
| 1972 | 59.0 | 31.8 | 9.2 |
| 1973 | 58.4 | 32.5 | 9.1 |
| 1974 | 57.2 | 33.7 | 9.2 |
| 1975 | 58.2 | 32.6 | 9.3 |
| 1976 | 57.5 | 33.3 | 9.2 |
| 1977 | 56.9 | 33.6 | 9.4 |
| 1978 | 56.8 | 33.7 | 9.5 |
| 1979 | 56.0 | 34.6 | 9.4 |
| 1980 | 55.2 | 35.5 | 9.3 |
| 1981 | 51.9 | 39.0 | 9.1 |
| 1982 | 51.3 | 39.5 | 9.2 |
| 1983 | 51.6 | 39.3 | 9.1 |
| 1984 | 50.7 | 40.2 | 9.1 |
| 1985 | 50.7 | 40.1 | 9.2 |
| 1986 | 46.5 | 44.0 | 9.5 |
| 1987 | 47.2 | 42.6 | 10.2 |
| 1988 | 46.3 | 43.0 | 10.7 |
| 1989 | 46.4 | 42.7 | 10.9 |
| 1990 | 47.9 | 40.8 | 11.3 |
| 1991 | 44.9 | 44.2 | 10.8 |
| 1992 | 44.9 | 43.7 | 11.4 |
| 1993 | 46.2 | 41.9 | 11.9 |
| 1994 | 46.1 | 41.2 | 12.6 |
| 1995 | 43.3 | 44.1 | 12.6 |
| 1996 | 42.1 | 45.3 | 12.6 |
| 1997 | 38.6 | 49.1 | 12.3 |
| 1998 | 41.0 | 45.5 | 13.5 |
| 1999 | 40.2 | 46.6 | 13.2 |
| 2000 | 40.3 | 46.1 | 13.6 |
| 2001 | 40.8 | 45.8 | 13.4 |
| 2002 | 48.2 | 35.3 | 16.5 |
| 2003 | 47.4 | 36.9 | 15.7 |
| 2004 | 45.1 | 40.1 | 14.8 |
| 2005 | 45.5 | 39.1 | 15.4 |
| 2006 | 44.2 | 40.1 | 15.6 |
| 2007 | 43.8 | 40.5 | 15.7 |
| 2008 | 43.4 | 38.7 | 17.9 |
| 2009 | 47.5 | 34.3 | 18.2 |
| 2010 | 44.9 | 37.7 | 17.4 |
| 2011 | 44.2 | 37.8 | 18.0 |
| 2012 | 42.5 | 39.2 | 18.3 |
| 2013 | 41.0 | 40.2 | 18.8 |
| 2014 | 40.3 | 40.6 | 19.1 |
| 2015 | 39.5 | 41.0 | 19.5 |
| 2016 | 38.1 | 43.3 | 18.6 |
| 2017 | 38.1 | 43.1 | 18.8 |
| 2018 | 38.2 | 43.4 | 18.4 |
| 2019 | 36.8 | 45.7 | 17.4 |
| 2020 | 36.6 | 46.3 | 17.1 |
| 2021 | 34.1 | 49.5 | 16.4 |
| 2022 | 34.3 | 49.8 | 15.9 |
| 2023 | 34.2 | 49.6 | 16.1 |
Note(s):
Some data for 2022 are preliminary and may be revised. The data for 2023 include estimates and are likely to later be revised. The other nonfederal category includes the R&D funded by all other sources—mainly, by higher education, nonfederal government, and nonprofit organizations.
Source(s):
National Center for Science and Engineering Statistics, National Patterns of R&D Resources (annual series).
U.S. research expenditures, the combined expenditures for basic research and applied research, reached $247 billion in 2022 (using constant 2017 dollars). Research expenditures are estimated to climb to $252 billion in 2023. Business sector funding continues to be the main driver of U.S. research expenditures, increasing from $65 billion (38% of total) in 2010 to $123 billion (50% of total) in 2022. During that same period, federal government research funding increased from $78 billion to $85 billion in constant 2017 dollars, though its share of total funding decreased from 45% to 34%. The federal government’s share of research funding peaked in the mid-1960s at 63% and has steadily declined in the decades since. Other nonfederal sources (including the higher education, nonprofit, and nonfederal government sectors) funded more research in 2022 ($39 billion) than in 2010 ($30 billion), though their combined share of research funding declined from 17% to 16%.
The National Center for Science and Engineering Statistics (NCSES) has reviewed this product for unauthorized disclosure of confidential information and approved its release (NCSES-DRN25-009).
Suggested citation: National Center for Science and Engineering Statistics (NCSES). 2025. Business Sector Funded Half of U.S. Research Performance in 2022. NSF 25-333. Alexandria, VA: U.S. National Science Foundation. Available at https://ncses.nsf.gov/pubs/nsf25333.
NSF 25-333
|May 29, 2025