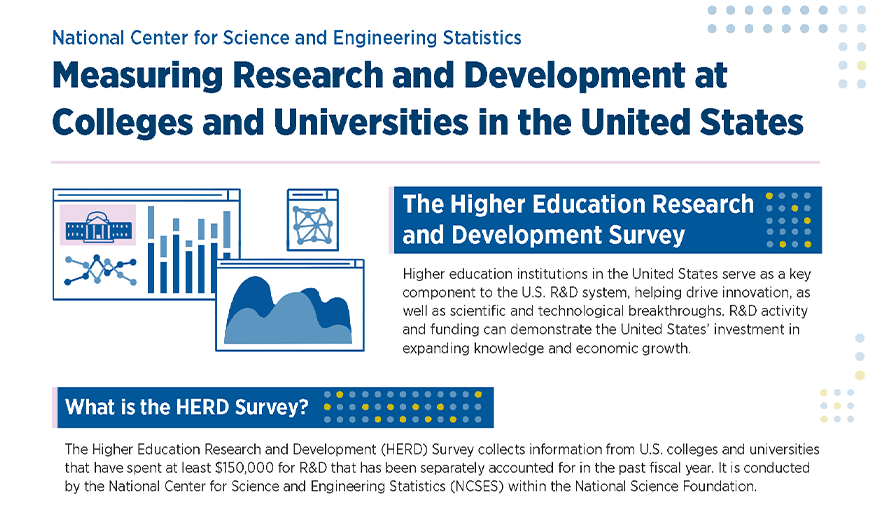
The HERD Survey is the primary source of information on research and development expenditures at U.S. colleges and universities.
The HERD Survey is an annual census of U.S. colleges and universities that expended at least $150,000 in separately accounted-for R&D in the fiscal year. The survey collects information on R&D expenditures by field of research and source of funds and also gathers information on types of research, expenses, and headcounts of R&D personnel.
The FY 2022 survey was conducted by ICF under contract to the National Center for Science and Engineering Statistics.
Status | Active |
---|---|
Frequency | Annual |
Reference Period | FY 2022 |
Next Release Date | November 2024 |
The Higher Education Research and Development (HERD) Survey is the primary source of information on separately accounted-for research and development (R&D) expenditures within higher education institutions in the United States and outlying areas.
None.
Annual.
In 2010, the HERD Survey replaced a previous annual collection, the NSF Survey of Research and Development Expenditures at Universities and Colleges (Academic R&D Expenditures Survey), which was conducted from FY 1972 through FY 2009.
The academic fiscal year ending in 2022; for most institutions this was 1 July 2021 to 30 June 2022.
Establishment; U.S. academic institutions reporting at least $150,000 in R&D expenditures in the previous fiscal year.
Census.
A total of 900 institutions.
The survey was a census of all known eligible universities and colleges.
Key variables of interest are listed below.
Public and private nonprofit postsecondary institutions in the United States, Guam, Puerto Rico, and the U.S. Virgin Islands that granted a bachelor’s degree or higher in any field, expended at least $150,000 in separately accounted-for R&D in FY 2022, and were geographically separate campuses headed by a president, chancellor, or equivalent.
The survey is a census of all eligible institutions as defined above. In the FY 2022 cycle, there were 900 academic institutions surveyed.
Not applicable.
The FY 2022 survey was conducted by ICF under contract to NCSES. Surveys were distributed to designated contacts at each institution. The data collection period was from November 2022 through July 2023. Respondents submitted their data using a Web-based questionnaire. Telephone and e-mail were used for follow-up contacts with respondents.
Questionnaires were carefully examined by survey staff upon receipt. Reviews focused on unexplained missing data and explanations provided for changes in reporting patterns. If additional explanations or data revisions were needed, respondents were sent personalized e-mail messages asking them to provide any necessary revisions before the final processing and tabulation of data.
Missing values were imputed based on the previous year’s data and the reported data of peer institutions in the current cycle.
Not applicable.
Coverage error of large research institutions is minimal because comprehensive lists exist. These institutions are easily identified using the NCSES Survey of Federal Science and Engineering Support to Universities, Colleges, and Nonprofit Institutions. However, institutions with smaller amounts of R&D expenditures have been more difficult to identify because they often do not receive federal funding for R&D.
NCSES annually screens all 4-year and above institutions reporting nonzero amounts of research expenses to the Department of Education Integrated Postsecondary Education Data System (IPEDS) to determine if new institutions qualify for inclusion in the survey.
The unit nonresponse was 4.0% in FY 2022. Nonresponse rates were less than 5.0% for all but three questions. Question 6, R&D expenditures by type of R&D (basic research, applied research, and experimental development); Question 15, R&D personnel headcount; and Question 16, R&D full-time equivalents (FTEs) had nonresponse rates of 6.3%, 11.8%, and 29.5%, respectively.
Potential sources of measurement errors include incomplete administrative data or differing categories used by the institutions to identify R&D.
Annual data are available for FYs 1972–2022.
When the review for consistency between each year’s data and submissions in prior years reveals discrepancies, it is sometimes necessary to modify prior years’ data. This is especially likely to affect trends for certain institutions that fail to report every year, because current-year data are used to impute prior-year data.
For accurate historical data, use only the most recently released data tables. Individuals wishing to analyze trends other than those in the most recent data tables are encouraged to contact the Survey Manager for more information about comparability of data over time.
NCSES publishes data from this survey annually in detailed tables and analytic reports available at the HERD Survey page. Information from this survey is also included in Science and Engineering Indicators.
Microdata beginning with the FY 2010 survey are available in NCSES’s interactive data tool. Public use files beginning with the FY 1972 are available at http://www.nsf.gov/statistics/herd/pub_data.cfm.
Purpose. The Higher Education Research and Development (HERD) Survey is the primary source of information on separately accounted-for R&D expenditures within higher education institutions in the United States and outlying areas.
Data collection authority. The information is solicited under the authority of the National Science Foundation Act of 1950, as amended, and the America COMPETES Reauthorization Act of 2010. The Office of Management and Budget control number is 3145-0100, with an expiration date of 31 July 2025.
Survey contractor. ICF.
Survey sponsor. The HERD Survey is sponsored by the National Center for Science and Engineering Statistics (NCSES) within the National Science Foundation.
Frequency. Annual.
Initial survey year. In 2010, the HERD Survey replaced a previous annual collection, the Survey of Research and Development Expenditures at Universities and Colleges (Academic R&D Expenditures Survey), which was conducted from FY 1972 through FY 2009.
Reference period. The academic fiscal year ending in 2022; for most institutions, this was 1 July 2021 to 30 June 2022.
Response unit. Establishment; U.S. academic institutions reporting at least $150,000 in R&D expenditures in the previous fiscal year.
Sample or census. Census.
Population size. A total of 900 institutions.
Sample size. The survey was a census of all known eligible universities and colleges.
Target population. Public and private nonprofit postsecondary institutions in the United States, Guam, Puerto Rico, and the U.S. Virgin Islands that granted a bachelor’s degree or higher in any field; expended at least $150,000 in separately accounted-for R&D in FY 2022; and were geographically separate campuses headed by a president, chancellor, or equivalent. A list of all accredited, degree-granting institutions in the United States (the Higher Education Directory) was obtained from Higher Education Publications (HEP). More information about HEP and its sources can be found at https://hepinc.com/about/.
The survey population was reviewed before data collection began to ensure that each institutional classification was accurate. Characteristics of the schools were reviewed before and during the survey to determine whether changes had occurred (e.g., name; highest degree granted; school openings, closings, or mergers). Table A-1 shows all institution name changes or mergers between the FY 2021 and FY 2022 surveys.
After data collection closed, institutions were reviewed to verify that only those reporting at least $150,000 in separately accounted-for R&D were included in the population. Of the 919 institutions surveyed, 19 completed the survey but reported total R&D expenditures of less than $150,000. These institutions were excluded from the population, and their data are not included in the FY 2022 survey totals. The total and federally funded R&D expenditures for these 19 institutions are listed in table A-2.
Sampling frame. The frame for the FY 2022 HERD Survey included (1) all institutions considered in scope for the FY 2021 survey, (2) institutions that granted a bachelor’s degree or higher and reported an amount greater than $0 for research on the Integrated Postsecondary Education Data System (IPEDS) 2020 Finance Survey, (3) all U.S. service institutions that granted a bachelor’s degree or higher and were not already part of the HERD Survey population, and (4) institutions that granted doctoral degrees but did not report to IPEDS and were not already part of the HERD Survey population. The information in the Higher Education Directory was used to locate institutions meeting the conditions listed in 3 and 4. When FY 2021 R&D expenditures were not known, institutions in the frame were sent a brief questionnaire asking whether the institution had R&D expenditures during FY 2021 and FY 2022 and whether those expenditures were less than $150,000, were $150,000 to $999,999, or were $1 million or more.
The population review screener was sent to 106 institutions. A total of 22 institutions were added to the survey population during the population review. One other institution was added when representatives of university systems contacted data collection staff about a campus that newly qualified for the survey. During data collection, 31 institutions were removed from the population after they indicated that their R&D expenditures were less than $150,000 for FY 2022, or that they did not qualify for the survey for another reason. After accounting for these additions and subtractions, the number of academic institutions in the final population decreased from 908 in FY 2021 to 900 in FY 2022 (table A-3).
Sample design. The FY 1997 survey was the last one conducted as a sample survey. Since FY 1998, the survey has been a census of all known eligible universities and colleges.
Data collection. The FY 2022 questionnaires were sent by e-mail in November 2022. Respondents could choose to submit a questionnaire downloaded from the Web or use the Web-based data collection system. Every effort was made to maintain close contact with respondents to preserve both the consistency and continuity of the resulting data. Survey data reports for each institution were available on the survey website; these showed comparisons between the current and 2 prior years of data and noted any substantive disparities. Questionnaires were carefully examined for completeness upon receipt. Respondents were sent personalized e-mail messages asking them to provide any necessary revisions before the final processing and tabulation of data. These e-mail messages included a link to the HERD Survey Web-based data collection system, allowing respondents to view and correct their data online.
Respondents were asked to explain significant differences between current-year reporting and established patterns of reporting verified for prior years. They were encouraged to correct prior-year data, if necessary. When respondents updated or amended figures from past years, NCSES made corresponding changes to trend data in the 2022 data tables and to the underlying microdata. For accurate historical data, use only the most recently released data tables.
Mode. Respondents could choose to submit a questionnaire downloaded from the Web or use the Web-based questionnaire. All institutions submitted data using the Web-based questionnaire.
Response rates. By the survey’s closing date in July 2023, forms had been received from 864 universities and colleges out of a population of 900—a response rate of 96.0%. Responses were received from 98.4% of all doctorate-granting institutions. The R&D expenditures reported by these doctoral institutions constituted 99.1% of the estimated national R&D expenditures for FY 2022. Table A-4 displays a detailed breakdown of response rates by survey form and highest degree granted, and table A-5 displays a breakdown of response rates for each survey question.
Data editing. The HERD Survey was subject to very little editing. Respondents were contacted and asked to resolve possible self-reporting issues themselves. Questionnaires were carefully examined by survey staff upon receipt. Reviews focused on unexplained missing data, expenditures that were outliers compared to those of peer institutions, and explanations provided for changes in reporting patterns. If additional explanations or data revisions were needed, respondents were sent personalized e-mail messages asking them to provide any necessary revisions before the final processing and tabulation of data.
Imputation. Missing values were imputed based on the previous year’s data and the reported data of peer institutions in the current cycle. For the 34 institutions that had not responded by the closing date of the survey and had been included in the FY 2021 HERD Survey population, R&D expenditures were imputed by applying inflator and deflator factors to the prior year’s key totals. The key totals for FY 2022 included total R&D expenditures, federal R&D expenditures, expenditures received as a subrecipient from higher education sources, expenditures received as a subrecipient from non-higher education sources, expenditures passed through to higher education entities, and expenditures passed through to non-higher education entities. Imputation factors were ratios derived from the 2-year-trend data of responding institutions with similar characteristics, including highest degree granted, type of institutional control (public or private), and level of total R&D expenditures. Other values that were not identified as key totals were imputed by applying ratios from the previous year’s data.
For two institutions that were new to the survey population, no past-year data were available. For these institutions, total R&D expenditures were assumed to be $150,000 or $1,000,000 based on the institutions’ responses to the population review screener. Other values were then imputed as a proportion of total R&D expenditures based on the data of institutions with similar characteristics. Data for partial nonresponse were imputed using similar techniques.
Table A-6 through table A-18 present imputed amounts for each applicable survey variable. The dollar amount imputed is displayed, along with the percentage it represents of the national estimate for universities and colleges for a variable. The imputed total R&D was $87.5 million, or 0.1%, of the $97.8 billion in total R&D expenditures (table A-6).
Several surveyed institutions have responded intermittently in past years. For years in which no response was received, data have been imputed as previously described. Although the imputation algorithm accurately reflects national trends, it cannot account for specific trends at individual institutions. For this reason, a re-imputation of institutional data for prior years is also performed. For each institution, previously imputed values from the HERD Survey (FYs 2010–21) were recomputed to ensure that the imputed data are consistent with reporting patterns from the FY 2022 survey. These procedures result in much more consistent reporting trends for individual institutions but have little effect on aggregate figures reflecting national totals. In the data tables, the letter i is used to identify imputed data.
R&D expenditures from unspecified federal agencies (Question 10) and capitalization thresholds for software and equipment (Question 13) were not imputed. Response summaries for these questions can be found in table A-19 and table A-20.
Weighting. Survey data were not weighted.
Variance estimation. No variance estimation techniques were used.
Sampling error. Because the FY 2022 survey was a census of all eligible institutions, there was no sampling error.
Coverage error. Coverage error of large research institutions is minimal because of comprehensive lists. These institutions are easily identified using the NCSES Survey of Federal Science and Engineering Support to Universities, Colleges, and Nonprofit Institutions. However, institutions with smaller amounts of R&D expenditures have been more difficult to identify because they often do not receive federal funding for science and engineering (S&E) R&D.
Nonresponse error. Thirty-six universities and colleges did not respond in FY 2022, out of a total of 900 eligible institutions, for a nonresponse rate of 4.0%. Table A-4 displays a detailed breakdown of response rates by survey population and highest degree granted.
Nonresponse rates were less than 5.0% for all but three questions. Question 6, R&D expenditures by type of R&D (basic research, applied research, and experimental development); Question 15, R&D personnel headcount; and Question 16, R&D full-time equivalents (FTEs) had nonresponse rates of 6.3%, 11.8%, and 29.5%, respectively. Table A-5 displays a breakdown of response rates for each question in each of the two surveys. See section “Imputation” for mitigation of item nonresponses. Table A-6 through table A-18 present imputed amounts for each applicable survey variable.
Measurement error. The most likely source of measurement error is institutional records containing categories different from those on the survey. For example, institutions were asked to report all R&D expenditures by field. The NCSES-designed fields do not always translate to an institution’s departmental structure, and adjustments must be made by the institution to complete the survey. Fields were revised for the FY 2016 survey to better reflect the R&D currently being conducted at universities and colleges and make HERD Survey fields more consistent with those used by other NCSES surveys as well as with the National Center for Education Statistics Classification of Instructional Programs (CIP) codes. Details of this change are included in the methodology report and technical notes for the FY 2016 survey. Minor revisions were also made in FY 2020.
Another source of error is the survey’s category of institutionally funded research. The survey requests that institutions report discretionary internal funds used for research. NCSES discovered through debriefings conducted at the conclusion of the FY 2010 survey that there were varying definitions of what should be included on the HERD Survey as institutionally funded research. Some institutions included all expenditures from separate accounts designated for research; others included only internal R&D projects that are competitively awarded and have detailed budgets. A workshop was held in summer 2012 to discuss these differences in definitional interpretation. Based on the findings from the workshop, the FY 2012 survey was modified to clarify that all expenditures designated for research can be included in this category. This includes expenditures for organized research and expenditures of other funds designated for research but not categorized as organized research. A checklist question (Question 1.1) was also added to encourage the inclusion of all eligible expenditures and to determine the full extent of the variations in reporting across institutions. This question has been on the survey since FY 2012. An analysis of Question 1.1 responses from FY 2022 indicated that some institutions still could not report institutionally funded research that was not organized research (6.3% could not report startup packages, bridge funding, or seed funding and 8.1% were unable to identify other departmental funds designated for research). Therefore, survey totals are missing expenditures for R&D that come from multipurpose accounts, and as such, they represent an undercount of the total amount of internal discretionary funding that institutions make available to conduct R&D.
The reporting of unrecovered indirect costs is another known source of error. The survey requests that the total amount of indirect costs associated with a research grant or contract be calculated and reported, including costs that were not reimbursed by the external funding source. The unrecovered indirect cost is calculated by multiplying the institution’s negotiated indirect cost rate by the corresponding base and then subtracting the actual indirect cost recovery, preferably on a project-by-project basis. In FY 2022, 5.1% of respondents reported unrecovered indirect costs as unavailable. Respondents who were unable to provide values were asked to provide information on their nonresponse. Based on the collected information, survey guidance is revised to encourage response.
The reporting of expenditures from projects that are not R&D is another possible source of error. The R&D definition in the HERD Survey excludes public service and outreach programs, curriculum development (unless included as part of an overall research project), and training grants supporting work on non-research projects. As part of a federal government effort to reduce administrative burdens associated with research grants and contracts, agencies began adopting Research Terms and Conditions (RTC) to be consistent with Uniform Administrative Requirements, Cost Principles, and Audit Requirements for Federal Awards issued by the U.S. Office of Management and Budget (OMB) in the Federal Register [80 FR 61849, October 14, 2015]. In these RTCs, agencies employed a broader definition of research, resulting in many institutions reporting projects as research that do not match HERD Survey definitions. Additionally, in recent years R&D expenditure data have been used more frequently in university and college benchmarking, which may encourage institutions to employ broader definitions of research than those provided on the survey.
It should also be noted that because institutions were asked to include funds passed through to higher education institutions as well as subrecipient funding from higher education institutions, there is double counting included in national and group totals. For example, Institution A’s survey included the $2 million passed through to Institution B, and Institution B’s survey also included the $2 million in subrecipient funding that it received from Institution A. Overall, institutions reported $4.7 billion in expenditures from subrecipient funding received from other universities in FY 2022 and $4.7 billion in funds passed through to higher education subrecipients in FY 2022. Adjustments are made to R&D totals presented in the NCSES National Patterns of R&D Resources publications (https://ncses.nsf.gov/data-collections/national-patterns/).
Annual data are available for FYs 1972–2022. When the review for consistency between each year’s data and submissions in prior years reveals discrepancies, it is sometimes necessary to modify prior years’ data. This is especially likely to affect trends for certain institutions that fail to report every year, because current-year data are used to impute prior-year data. For accurate historical data, use only the most recently released data tables. Individuals wishing to analyze trends other than those in the most recent data tables are encouraged to contact the Survey Manager for more information about comparability of data over time.
Changes in survey coverage and population. Before FY 2010, the population included only institutions with R&D expenditures and degree programs in S&E fields. Institutions that performed R&D in only non-S&E fields were excluded from the population. Although not a change in the coverage or population, each campus headed by a campus-level president, chancellor, or equivalent began completing a separate survey in 2010 rather than combining its response with the responses of other campuses in the university system. As a result, the overall number of academic institutions in the population increased from 711 in FY 2009 to 742 in FY 2010.
To compare HERD Survey data across university systems by aggregating member campuses, table 6 shows all institutions in the FY 2022 population by state, institutional control, and system.
Universities and colleges can merge or separate, possibly resulting in large changes in data from previous years.
Changes in questionnaire. Tables include data from the Academic R&D Expenditures Survey (FYs 1972–2009) and the HERD Survey (FYs 2010–20). Analysts should be cautious when examining trend data. Although many variables are similar across the two surveys because of clarification of which funds are to be included in the definition of R&D and the inclusion of non-S&E expenditures, exact comparisons may be misleading. In prior years, the Academic R&D Expenditures Survey collected expenditures for S&E and non-S&E fields separately. Institutions were not always able to provide non-S&E expenditures, and those data were not imputed previously. Also, revisions to the instructions on what types of activities are included as R&D in 2010 may have influenced reported values to varying degrees, depending on the number of clinical trials and training grants at an institution. Specific changes are described below:
Changes in reporting procedures or classification. To reduce the burden for institutions with minimal amounts of R&D expenditures, NCSES introduced a shorter version of the HERD Survey, beginning with the FY 2012 collection. The short-form survey includes four core questions. For the FY 2022 cycle, the short-form population included 263 institutions that reported R&D expenditures between $150,000 and $1 million during FY 2021. The remainder of the institutions (637) received the full version of the survey.
Short-form survey data for FYs 2012–2022 appear only in those tables that specify in their title that the data presented include data from the short-form version of the survey. Data from the short-form survey population are included in the year totals prior to FY 2012, aggregated under “all other surveyed institutions.” The total FY 2022 R&D expenditures reported by institutions in the short-form survey population ($161.5 million) represent 0.2% of the expenditures reported by all institutions ($97.8 billion).
Recommended data tables
This report provides data from the FY 2022 Higher Education Research and Development (HERD) Survey. The survey is an annual census of institutions that expended at least $150,000 in separately accounted-for research and development (R&D) in the fiscal year.
The tables present data on R&D expenditures at higher education institutions across all academic disciplines and include R&D expenditures by institution, R&D field, geographic area, source of funds, type of R&D (basic research, applied research, and experimental development), cost categories (salaries, software, equipment, and indirect costs), and trends over time.
Michael T. Gibbons of the National Center for Science and Engineering Statistics (NCSES) developed and coordinated this report under the guidance of Amber Levanon Seligson, NCSES Program Director, and the leadership of Emilda B. Rivers, NCSES Director; Christina Freyman, NCSES Deputy Director; and John Finamore, NCSES Chief Statistician. Jock Black (NCSES) reviewed the report.
Under contract to NCSES, ICF conducted the survey and prepared the data. ICF staff members who made significant contributions include Kathryn Harper, Project Director; Madelyn Roeder, Deputy Project Director; Jennifer Greer, Data Management Lead; Sindhura Geda, Data Management Specialist; Bridget Beavers, Data Management Specialist; Alison Celigoi, Data Management Specialist; Cameron Shanton, Data Collection Specialist; Audrey Nankobogo, Data Collection Specialist; Henry LeVee, Data Collection Specialist; Vladimer Shioshvili, Survey Systems Lead.
NCSES thanks the research-performing academic institutions that provided information for this report.
National Center for Science and Engineering Statistics (NCSES). 2023. Higher Education Research and Development: Fiscal Year 2022. NSF 24-308. Alexandria, VA: National Science Foundation. Available at https://ncses.nsf.gov/surveys/higher-education-research-development/2022.
For additional information about this survey or the methodology, contact