 An official website of the United States government
Geographic Distribution of Business R&D Performance in 2021
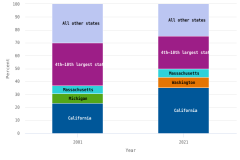
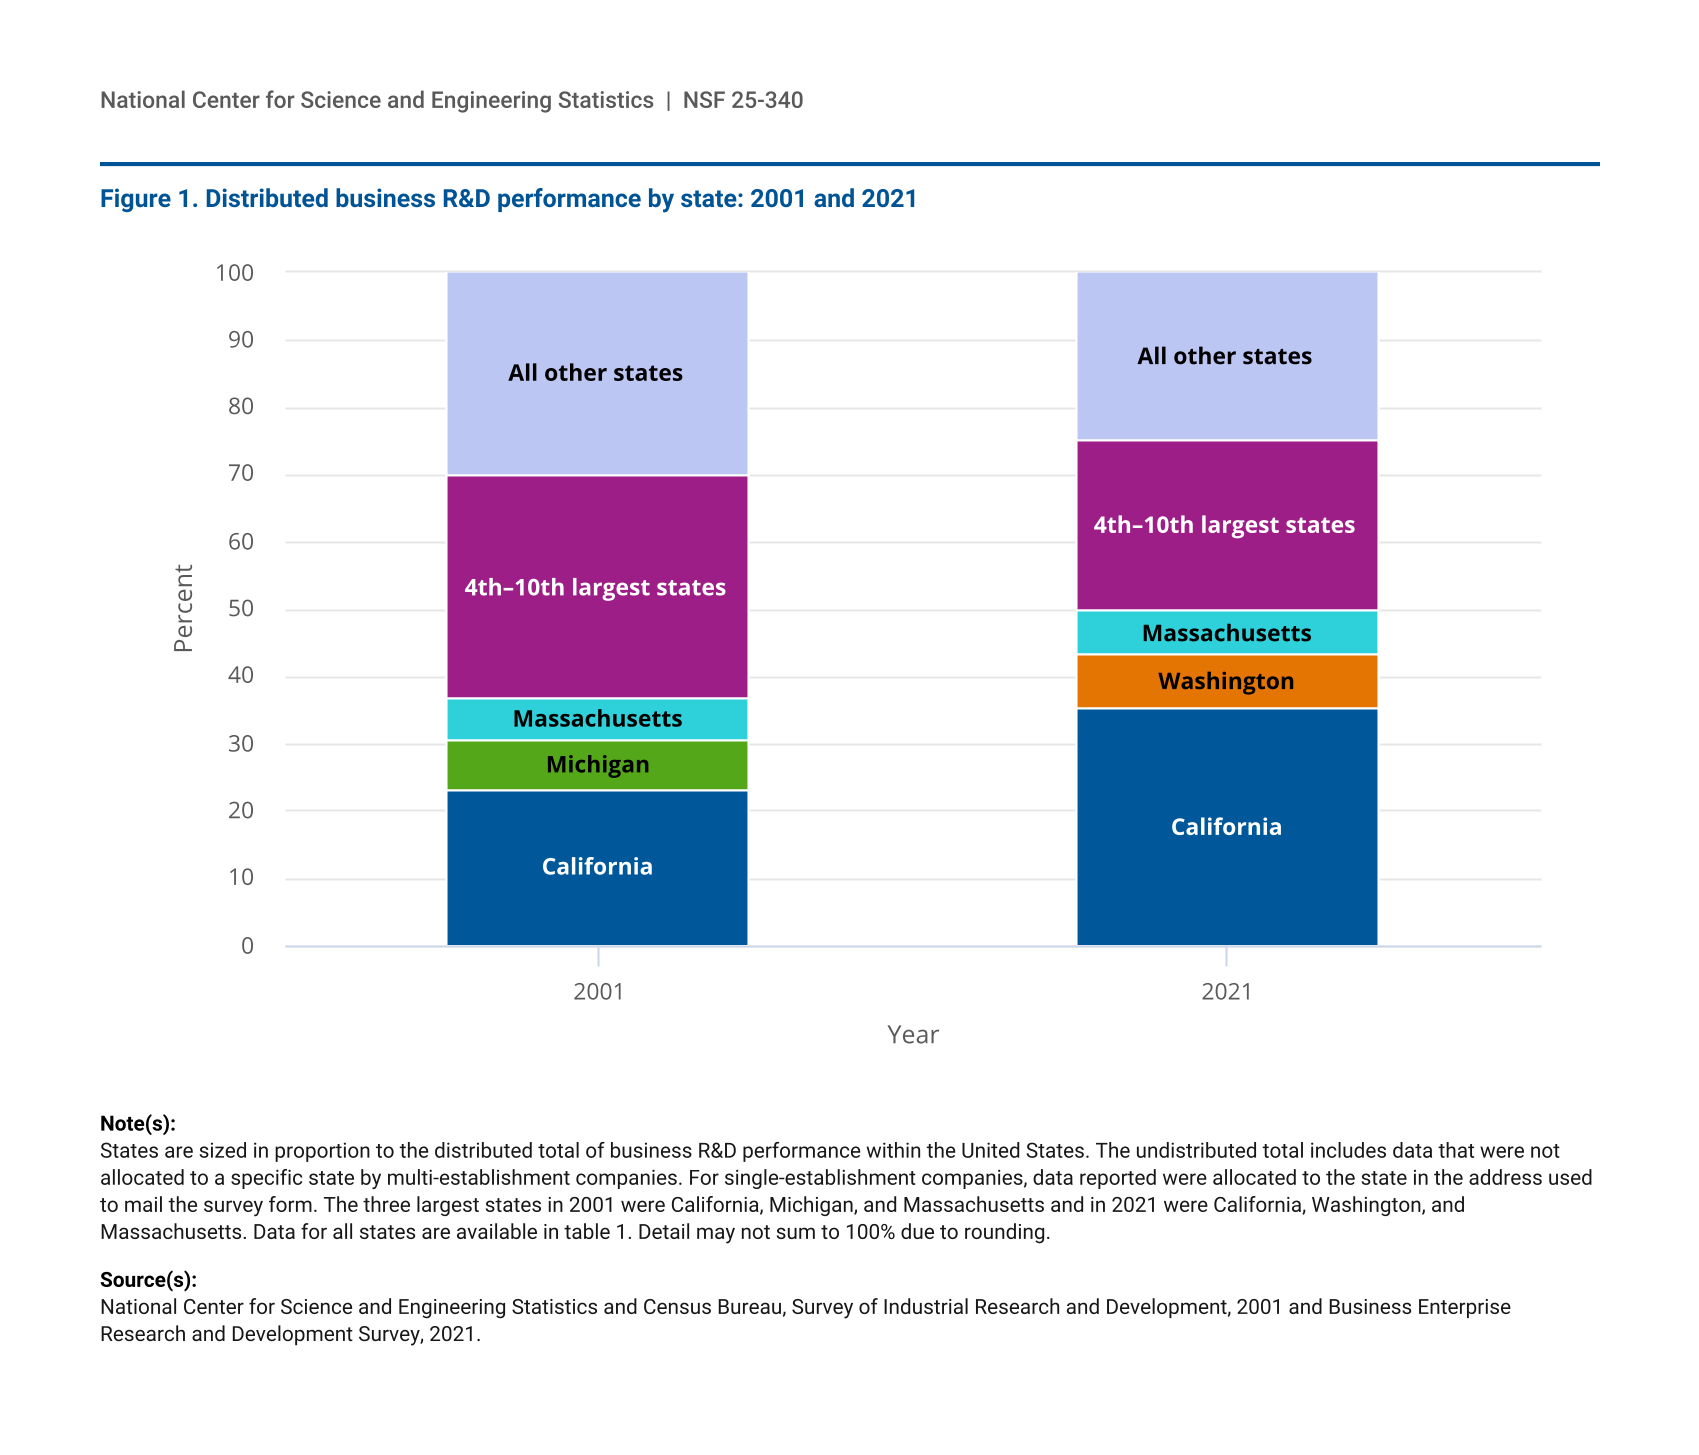
From 2001 to 2021, expenditures for research and development (R&D) performed by for-profit businesses in the United States doubled in real terms. Over half of the growth in U.S. business R&D over this period can be attributed to 2 states: California and Washington. In 2001, the 10 largest states in terms of business R&D accounted for 70% of the national estimate that could be attributed to a state, and the 3 largest states (California, Michigan, and Massachusetts) accounted for 37%. Business R&D was more geographically concentrated in 2021, with the 10 largest states accounting for 75% of the national estimate and the 3 largest (California, Washington, and Massachusetts) accounting for 50% (figure 1 and table 1). Data are from the Business Enterprise Research and Development (BERD) Survey, cosponsored by the National Center for Science and Engineering Statistics within the U.S. National Science Foundation and the Census Bureau.
| Year | California | Washington | Michigan | Massachusetts | 4th–10th largest states | All other states |
|---|---|---|---|---|---|---|
| 2001 | 23.2 | na | 7.4 | 6.1 | 33.1 | 30.1 |
| 2021 | 35.2 | 8.2 | na | 6.6 | 25.2 | 24.9 |
States are sized in proportion to the distributed total of business R&D performance within the United States. The undistributed total includes data that were not allocated to a specific state by multi-establishment companies. For single-establishment companies, data reported were allocated to the state in the address used to mail the survey form. The three largest states in 2001 were California, Michigan, and Massachusetts and in 2021 were California, Washington, and Massachusetts. Data for all states are available in table 1. Detail may not sum to 100% due to rounding.
National Center for Science and Engineering Statistics and Census Bureau, Survey of Industrial Research and Development, 2001 and Business Enterprise Research and Development Survey, 2021.
Data that were not allocated to a specific state by multi-establishment companies are reported as undistributed. For single-establishment companies, data reported were allocated to the state in the address used to mail the survey form.
National Center for Science and Engineering Statistics and Census Bureau, Survey of Industrial Research and Development, 2001 and Business Enterprise Research and Development Survey, 2021.
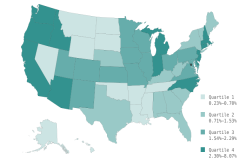
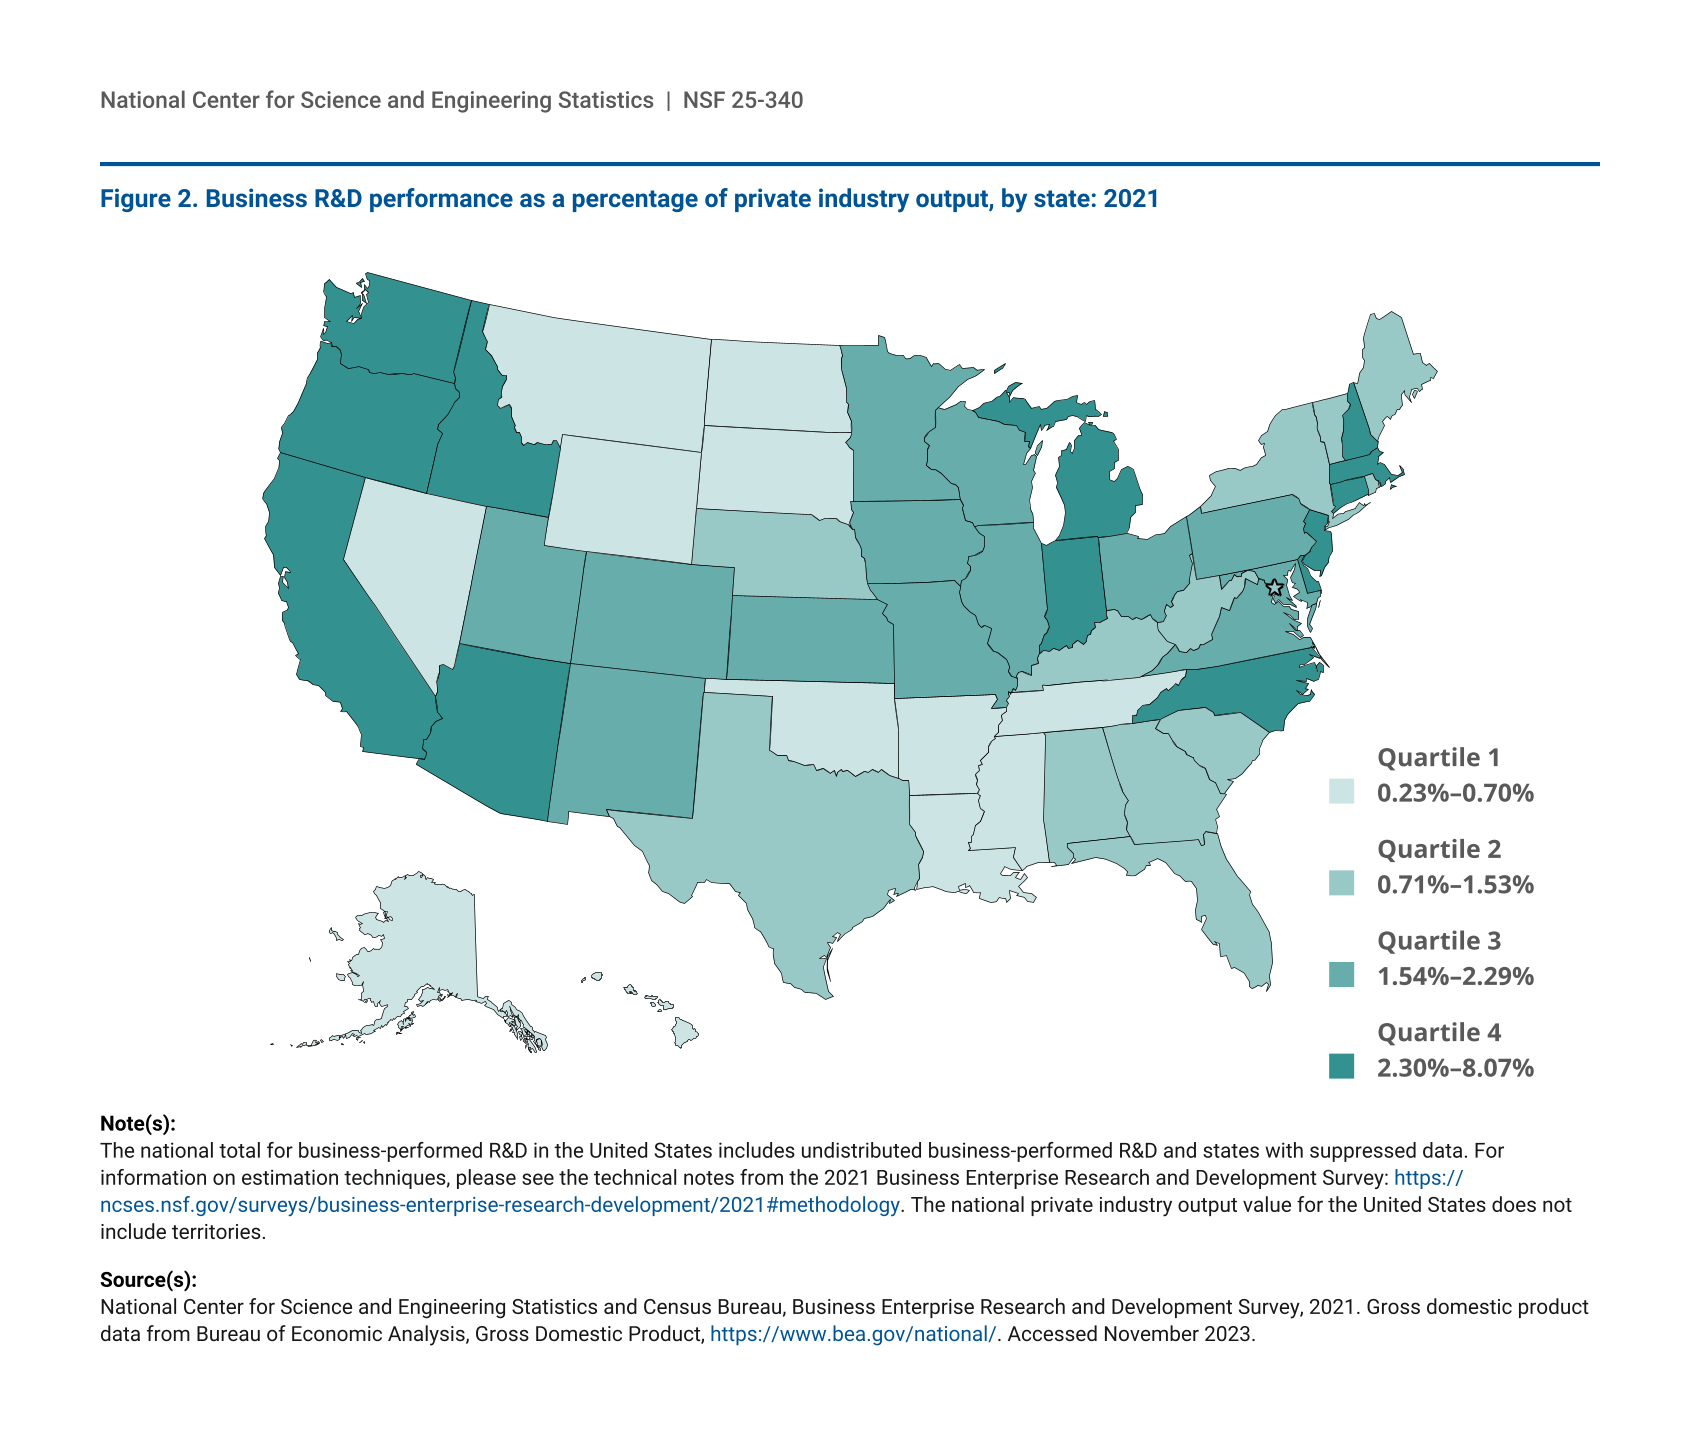
Over this period, business R&D expenditures as a percentage of private industry output in the United States grew from 2.20% to 2.90%, indicating an overall increase in the intensity of R&D activity among businesses in the United States. Figure 2 shows this indicator for the 50 U.S. states and the District of Columbia in 2021. The 3 largest states in terms of business R&D expenditures also have the highest values of this indicator. Each are estimated to have business R&D expenditures as a percentage of private industry output over twice the national average. In contrast, Texas and New York, 2 of the top 10 states in terms of business R&D performance, have business R&D expenditures as a percentage of private industry output that are about half the national average, placing them close to the median value of this indicator. The relatively low business R&D intensities for these 2 states is in part due to the outsized role of industries with low-R&D intensity in their economies: oil and gas in Texas and financial services in New York. Outside of the top 10 states in terms of business R&D performance, only 4 had higher business R&D expenditures as a percentage of private industry output than the U.S. average: Connecticut, Delaware, New Hampshire, and Oregon.
| State | Percent |
|---|---|
| United States | 2.90 |
| Alabama | 1.34 |
| Alaska | 0.44 |
| Arizona | 2.45 |
| Arkansas | 0.37 |
| California | 6.94 |
| Colorado | 2.05 |
| Connecticut | 3.15 |
| Delaware | 4.81 |
| District of Columbia | 0.71 |
| Florida | 0.83 |
| Georgia | 1.03 |
| Hawaii | 0.56 |
| Idaho | 2.59 |
| Illinois | 1.93 |
| Indiana | 2.47 |
| Iowa | 1.54 |
| Kansas | 1.64 |
| Kentucky | 0.71 |
| Louisiana | 0.23 |
| Maine | 0.72 |
| Maryland | 1.82 |
| Massachusetts | 6.78 |
| Michigan | 4.33 |
| Minnesota | 2.21 |
| Mississippi | 0.32 |
| Missouri | 2.18 |
| Montana | 0.51 |
| Nebraska | 0.81 |
| Nevada | 0.57 |
| New Hampshire | 3.56 |
| New Jersey | 4.01 |
| New Mexico | 1.98 |
| New York | 1.53 |
| North Carolina | 2.68 |
| North Dakota | 0.61 |
| Ohio | 1.70 |
| Oklahoma | 0.58 |
| Oregon | 4.70 |
| Pennsylvania | 2.29 |
| Rhode Island | 1.44 |
| South Carolina | 0.80 |
| South Dakota | 0.39 |
| Tennessee | 0.70 |
| Texas | 1.51 |
| Utah | 1.91 |
| Vermont | 1.41 |
| Virginia | 1.61 |
| Washington | 8.07 |
| West Virginia | 0.72 |
| Wisconsin | 2.06 |
| Wyoming | 0.26 |
The national total for business-performed R&D in the United States includes undistributed business-performed R&D and states with suppressed data. For information on estimation techniques, please see the technical notes from the 2021 Business Enterprise Research and Development Survey: https://ncses.nsf.gov/surveys/business-enterprise-research-development/2021#methodology. The national private industry output value for the United States does not include territories.
National Center for Science and Engineering Statistics and Census Bureau, Business Enterprise Research and Development Survey, 2021. Gross domestic product data from Bureau of Economic Analysis, Gross Domestic Product, https://www.bea.gov/national/. Accessed November 2023.
Focusing on the business R&D paid for by companies’ own funds, more than half of the state’s R&D was in a single industry for 5 of the top 10 states with the highest level of business R&D (table 2). Automobile manufacturers accounted for 71% of Michigan’s total, semiconductor manufacturers for 62% of Oregon’s total, and the pharmaceutical industry for 56%, 52%, and 51% of New Jersey’s, Pennsylvania’s, and Massachusetts’s totals, respectively. As a point of reference, the pharmaceutical industry is the single-largest industry in terms of business R&D, as tabulated by the BERD Survey, and it accounts for 17% of the nation’s R&D performed and paid for by companies from their own funds. As a group, the information and communication technology (ICT) industries account for close to half of U.S. business R&D. About two-thirds of California’s business R&D is performed by these ICT industries.
ICT = information and communications technologies; NAICS = 2017 North American Industry Classification System.
Industry classification is based on the dominant business code for domestic R&D performance, where available. For companies that did not report business codes, the classification used for sampling was assigned. Statistics are representative of companies located in the United States that performed or funded $50,000 or more of R&D and are not comparable with estimates published for years prior to 2018. ICT manufacturing comprises NAICS 334 (computer and electronic products), and ICT services comprises NAICS 5112 (software publishers), NAICS 517 (telecommunications), NAICS 518 (data processing, hosting, and related services), NAICS 5415 (computer systems design and related services), and the remaining industries within NAICS 51 (information) other than traditional paper publishers.
National Center for Science and Engineering Statistics and Census Bureau, Business Enterprise Research and Development Survey, 2021.
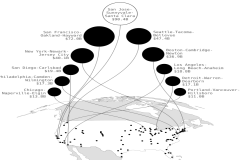
Business R&D by Metropolitan and Micropolitan area
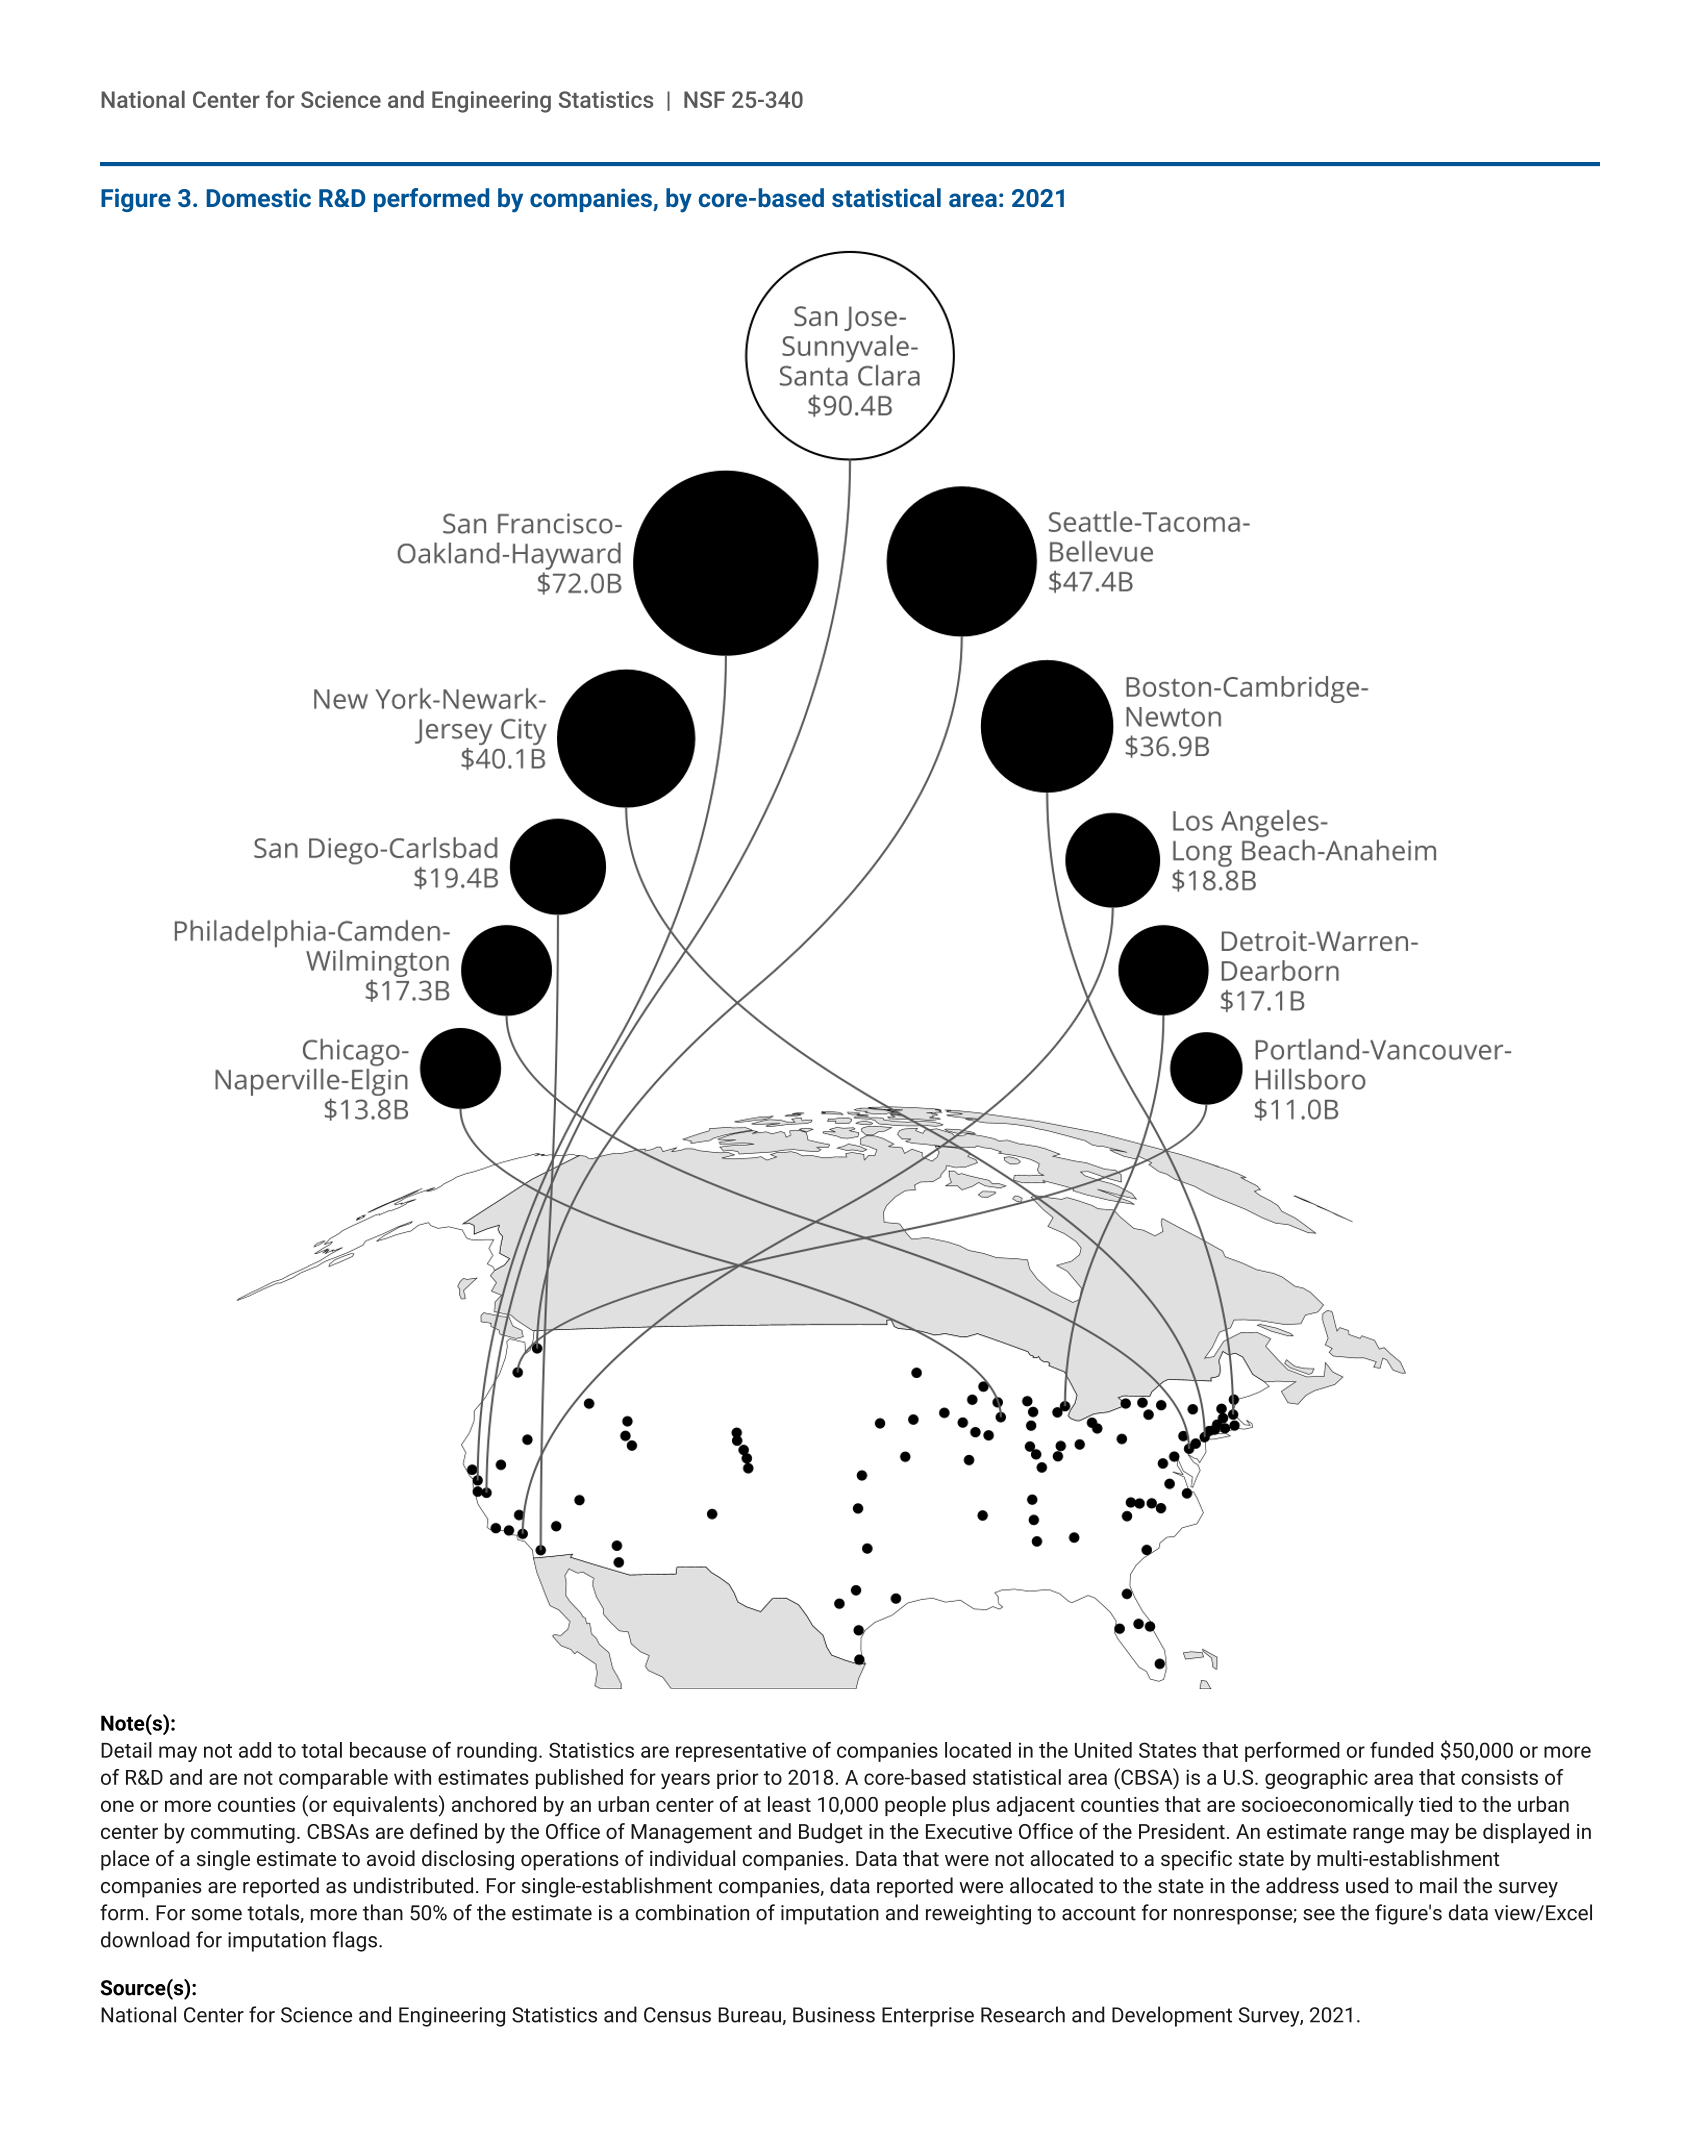
The BERD Survey estimates that about 95% of U.S. business R&D in 2021 was performed in 100 metropolitan and micropolitan statistical areas—collectively referred to as core-based statistical areas (CBSAs). These CBSAs are marked on the map in figure 3, and detailed information is shown for the 11 locations with the largest R&D estimates. The San Jose-Sunnyvale-Santa Clara metropolitan area remains the largest CBSA in terms of R&D, accounting for 15% of U.S. business R&D performance. The combined business R&D of this metro area and its neighbor, the San Francisco-Oakland-Hayward metro area, is roughly the same as the sum of the next five largest CBSAs in terms of R&D. These two CBSAs account for about three-quarters (77%) of California’s business R&D. Seattle-Tacoma-Bellevue, the third-largest CBSA in terms of business R&D, accounts for 96% of Washington’s business R&D. Oregon’s R&D is similarly concentrated in the Portland-Vancouver-Hillsboro CBSA.
Detail may not add to total because of rounding. Statistics are representative of companies located in the United States that performed or funded $50,000 or more of R&D and are not comparable with estimates published for years prior to 2018. A core-based statistical area (CBSA) is a U.S. geographic area that consists of one or more counties (or equivalents) anchored by an urban center of at least 10,000 people plus adjacent counties that are socioeconomically tied to the urban center by commuting. CBSAs are defined by the Office of Management and Budget in the Executive Office of the President. An estimate range may be displayed in place of a single estimate to avoid disclosing operations of individual companies. Data that were not allocated to a specific state by multi-establishment companies are reported as undistributed. For single-establishment companies, data reported were allocated to the state in the address used to mail the survey form. For some totals, more than 50% of the estimate is a combination of imputation and reweighting to account for nonresponse; see the figure's data view/Excel download for imputation flags.
National Center for Science and Engineering Statistics and Census Bureau, Business Enterprise Research and Development Survey, 2021.
In the Midwest, the largest centers of business R&D were the Detroit-Warren-Dearborn CBSA and the Chicago-Naperville-Elgin CBSA. On the East Coast, the largest centers of business R&D were the New York-Newark-Jersey City, Boston-Cambridge-Newton, and Philadelphia-Camden-Wilmington CBSAs.
Data Source, Limitations, and Availability
The sample for the BERD Survey was selected to represent all for-profit, nonfarm companies that were publicly or privately held, had 10 or more employees in the United States, and performed or funded R&D either domestically or abroad. For 2021, a total of 47,500 companies were sampled for the BERD Survey, representing 1,137,000 companies.
In this InfoBrief, money amounts are expressed in terms of 2021 U.S. dollars. Money amounts from years other than 2021 are adjusted for inflation using gross domestic product implicit price deflators from the Bureau of Economic Analysis.
The estimates in this InfoBrief are based on responses from samples of different populations of organizations and may differ from actual values because of sampling variability or other factors. As a result, apparent differences between the estimates for two or more groups may not be statistically significant. All comparative statements in this InfoBrief have undergone statistical testing and are significant at the 90% confidence level unless otherwise noted.
NCSES has reviewed this product for unauthorized disclosure of confidential information and approved its release (NCSES-DRN25-027).
Notes
1 In 2001, 4.9% of U.S. business R&D performance could not be assigned a state location. In 2021, 0.1% of the same measure could not be assigned a state location. All location shares of U.S. R&D presented in this InfoBrief exclude these undistributed amounts.
2 Private industry output is a measure of industries’ sales or receipts and is estimated by the Bureau of Economic Analysis.
3 For this InfoBrief, the ICT sector is defined as the sum of ICT manufacturing, which comprises North American Industrial Classification System (NAICS) 334 (computer and electronic products) and ICT services, which comprises NAICS 5112 (software publishers), NAICS 517 (telecommunications), NAICS 518 (data processing, hosting, and related services), NAICS 5415 (computer systems design and related services), and the remaining industries within NAICS 51 (information) other than traditional paper publishers.
Suggested Citation
National Center for Science and Engineering Statistics (NCSES). 2025. Geographic Distribution of Business R&D Performance in 2021. NSF 25-340. Alexandria, VA: U.S. National Science Foundation. Available at https://ncses.nsf.gov/pubs/nsf25340.
Contact Us
National Center for Science and Engineering Statistics
Directorate for Social, Behavioral and Economic Sciences
U.S. National Science Foundation
2415 Eisenhower Avenue, Suite W14200
Alexandria, VA 22314
Tel: (703) 292-8780
FIRS: (800) 877-8339
TDD: (800) 281-8749
E-mail: ncsesweb@nsf.gov