 An official website of the United States government
Report
Executive summary
Doctoral education trains scientists, engineers, researchers, and scholars, all of whom are critical to the nation’s progress. These individuals discover, create, and share new knowledge and new ways of thinking that lead, directly and indirectly, to new products, services, and works of art. Annual counts of doctorate recipients from U.S. universities are measures of the incremental investment in human resources devoted to science, engineering, research, and scholarship, and these counts can serve as leading indicators of the capacity for knowledge creation and innovation in various domains.
Changes in the characteristics of doctorate recipients over time reflect political, economic, social, technological, and demographic trends. These include the following:
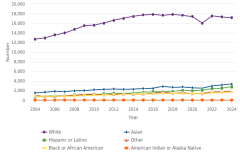
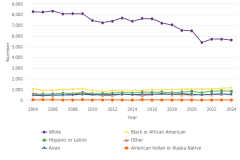
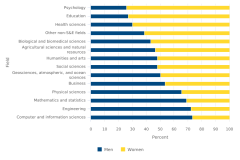
- Changes in doctorate recipient demographics
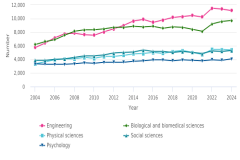
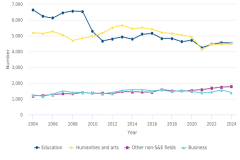
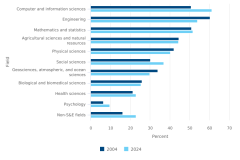
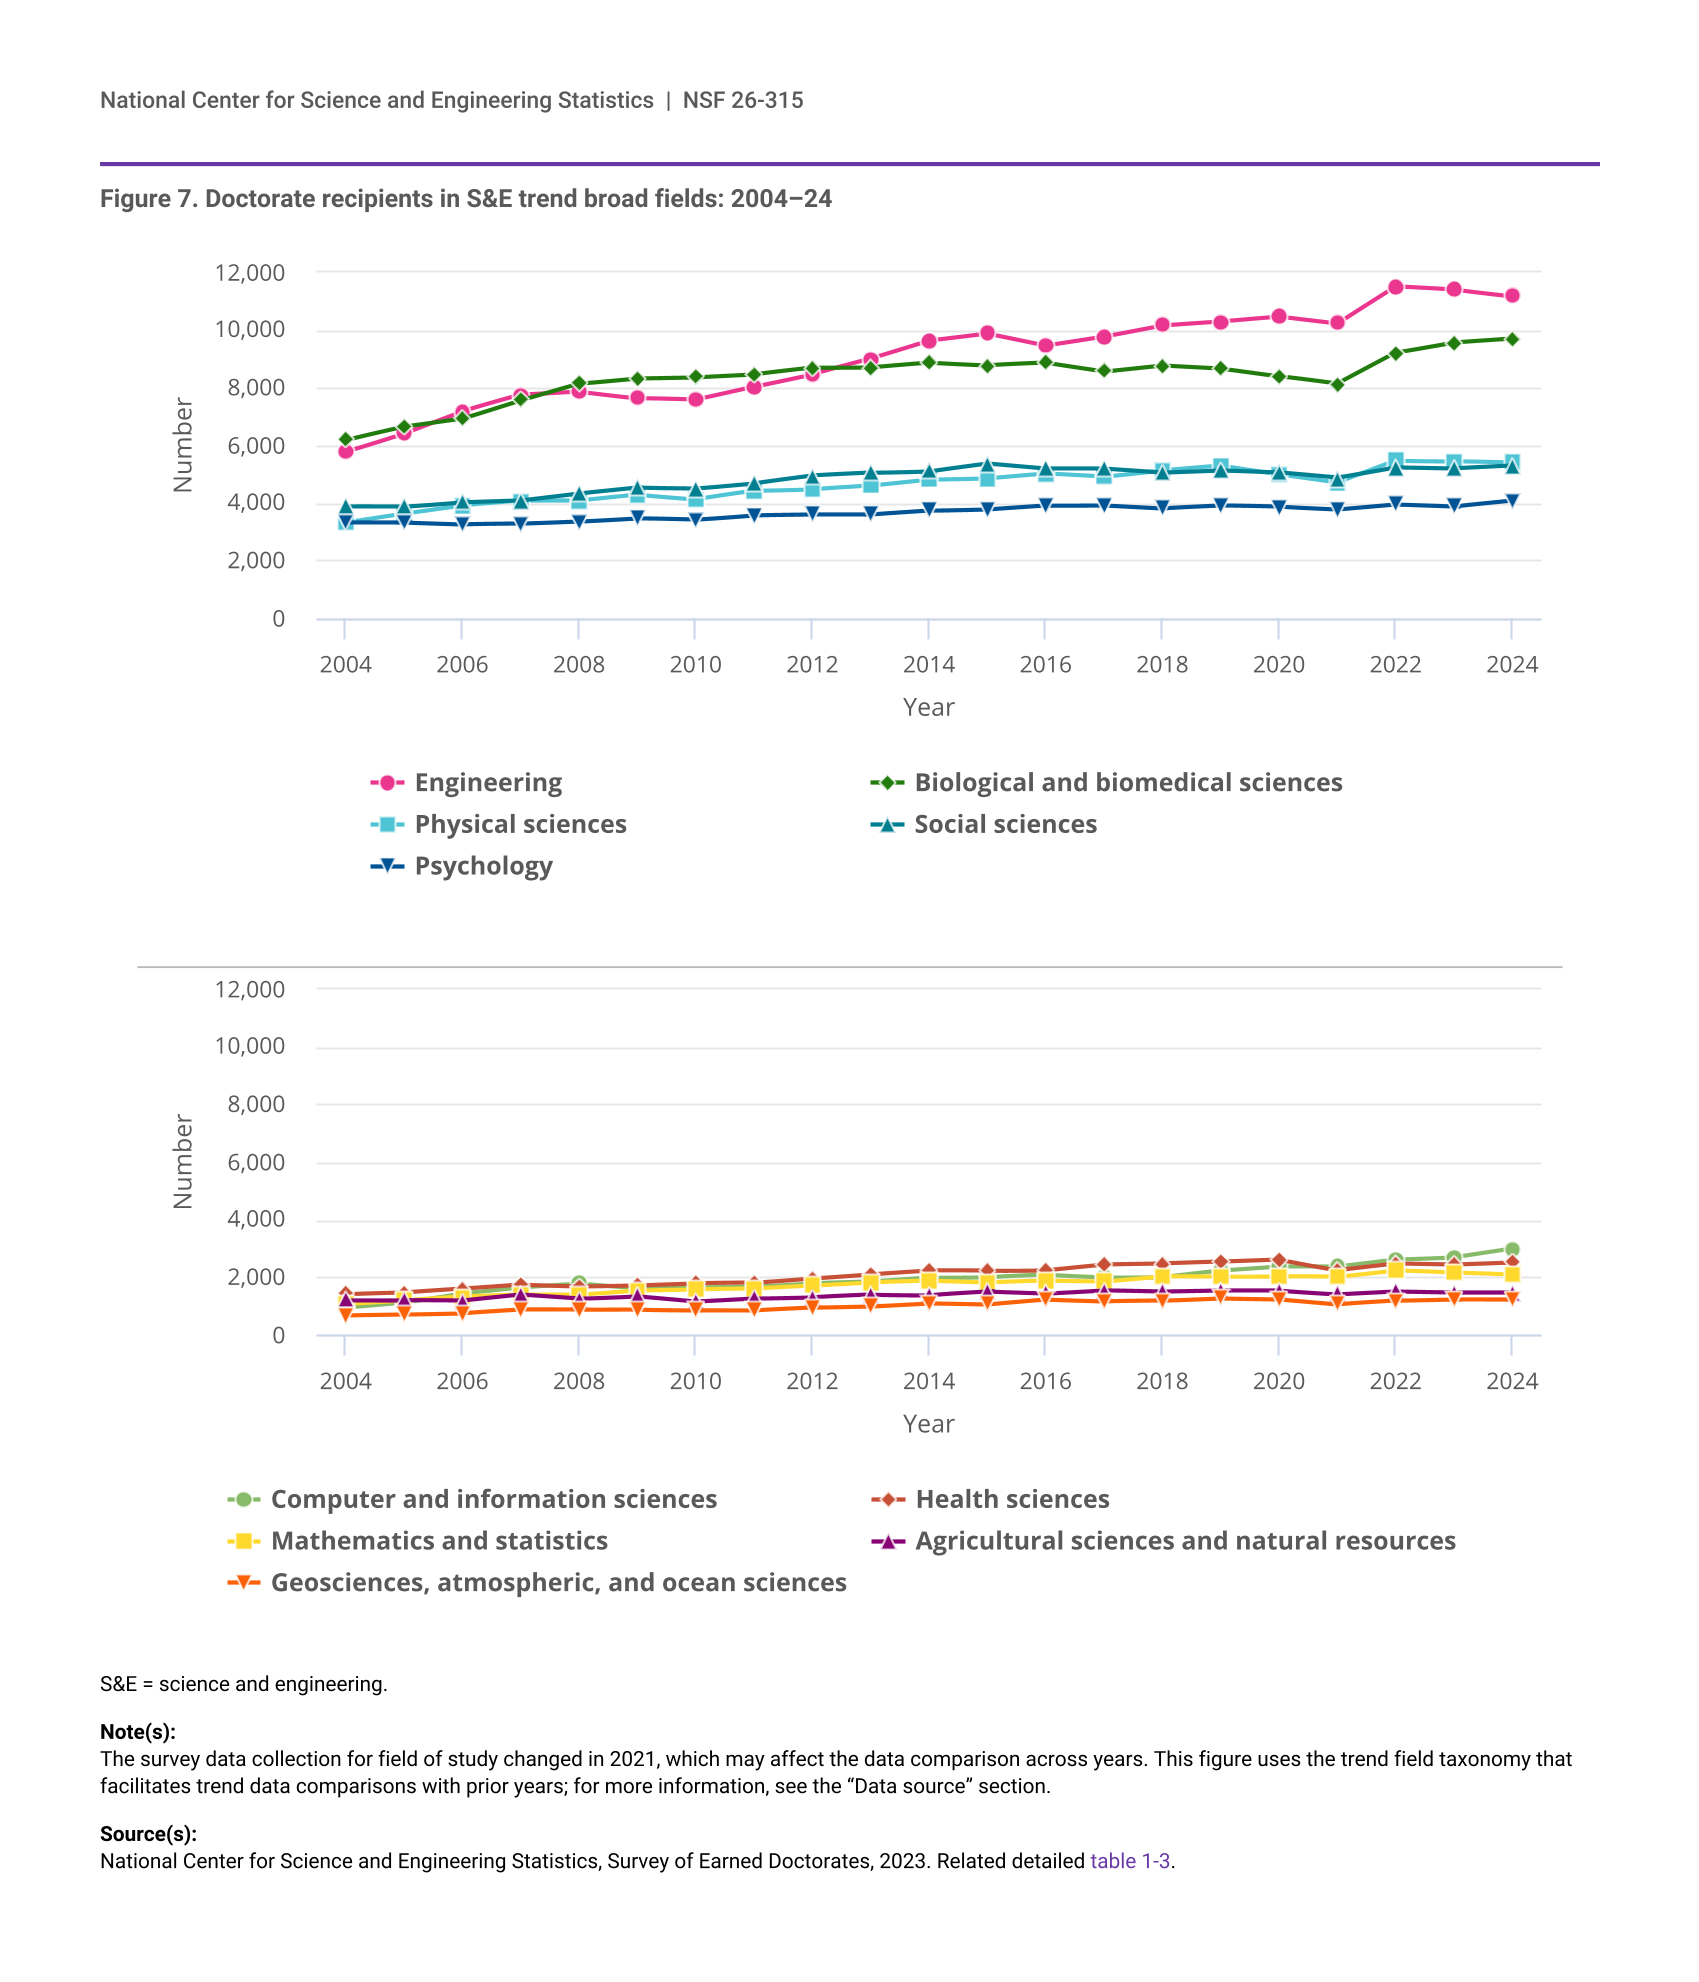
- Changes in the number of doctorates awarded in specific science and engineering (S&E) fields
- Shifting academic employment opportunities after graduation
- Trends in the pursuit of postdoctoral (postdoc) research positions by field
Understanding these trends and changes is necessary to inform policy discussions regarding this country’s doctoral education system.
The data in this report cover the 2024 academic year (1 July 2023 to 30 June 2024) and were collected from doctoral students who completed the Survey of Earned Doctorates (SED) as they approached graduation.
Key takeaways from the 2024 SED data include the following:
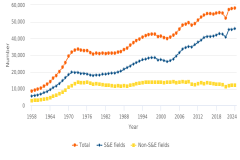
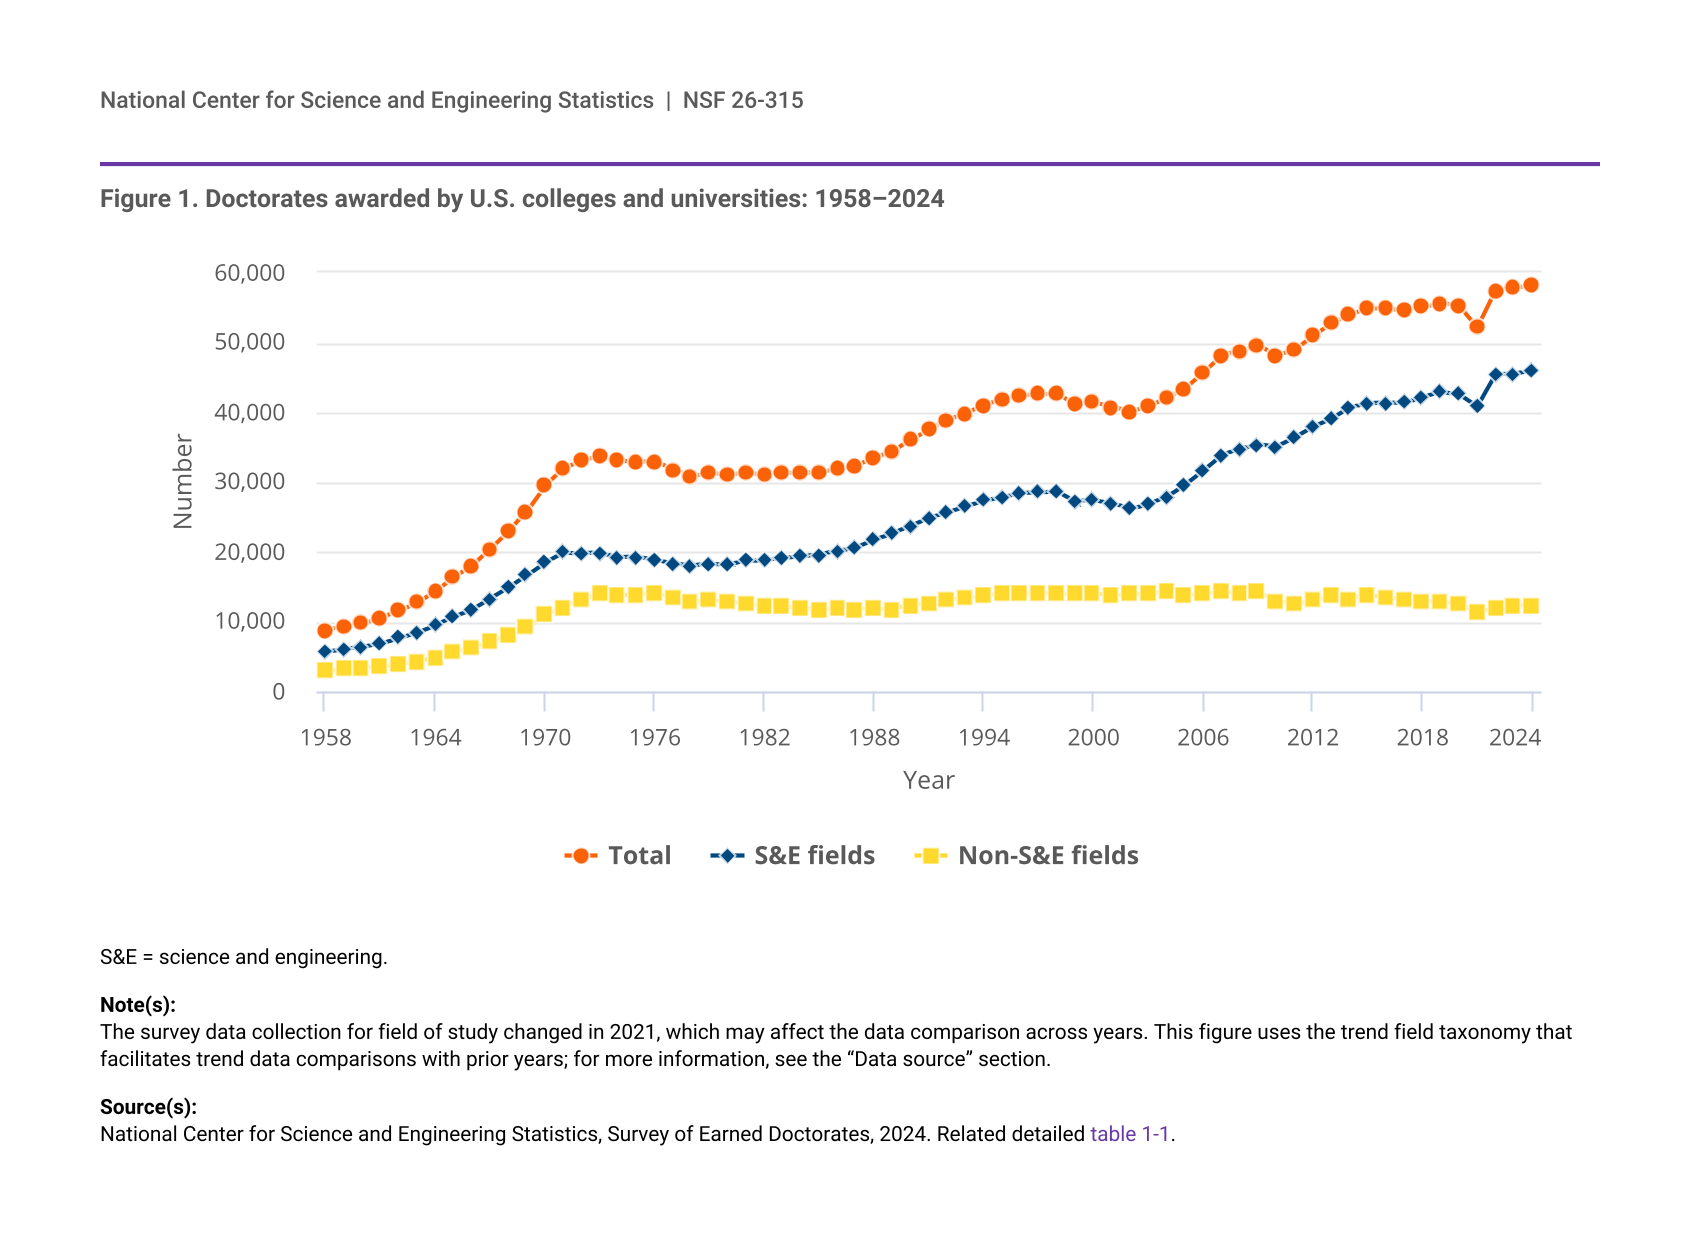
- The number of doctorate recipients from U.S. universities increased from 57,806 in 2023 to 58,131 in 2024.
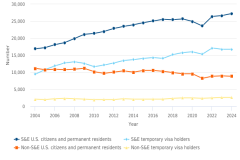
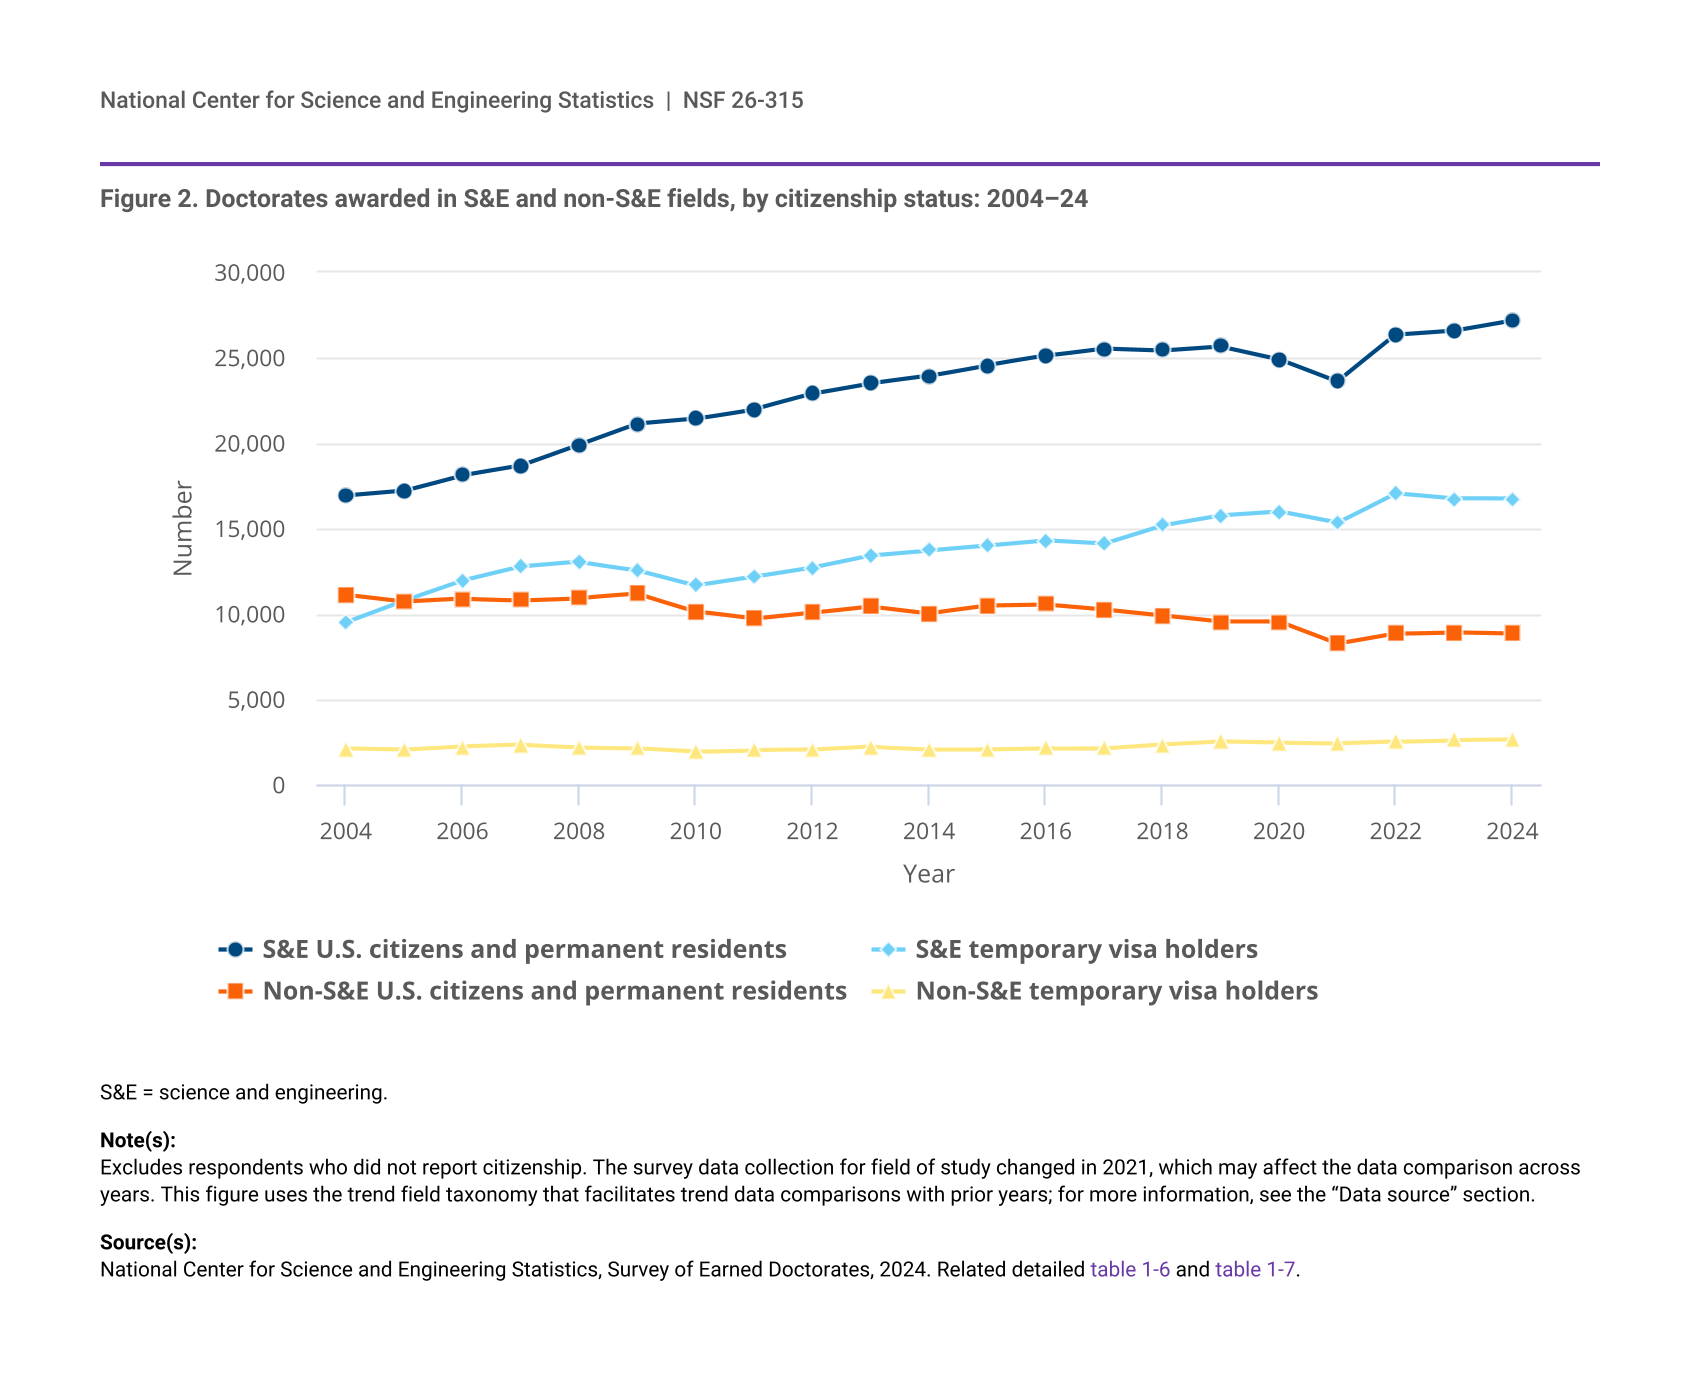
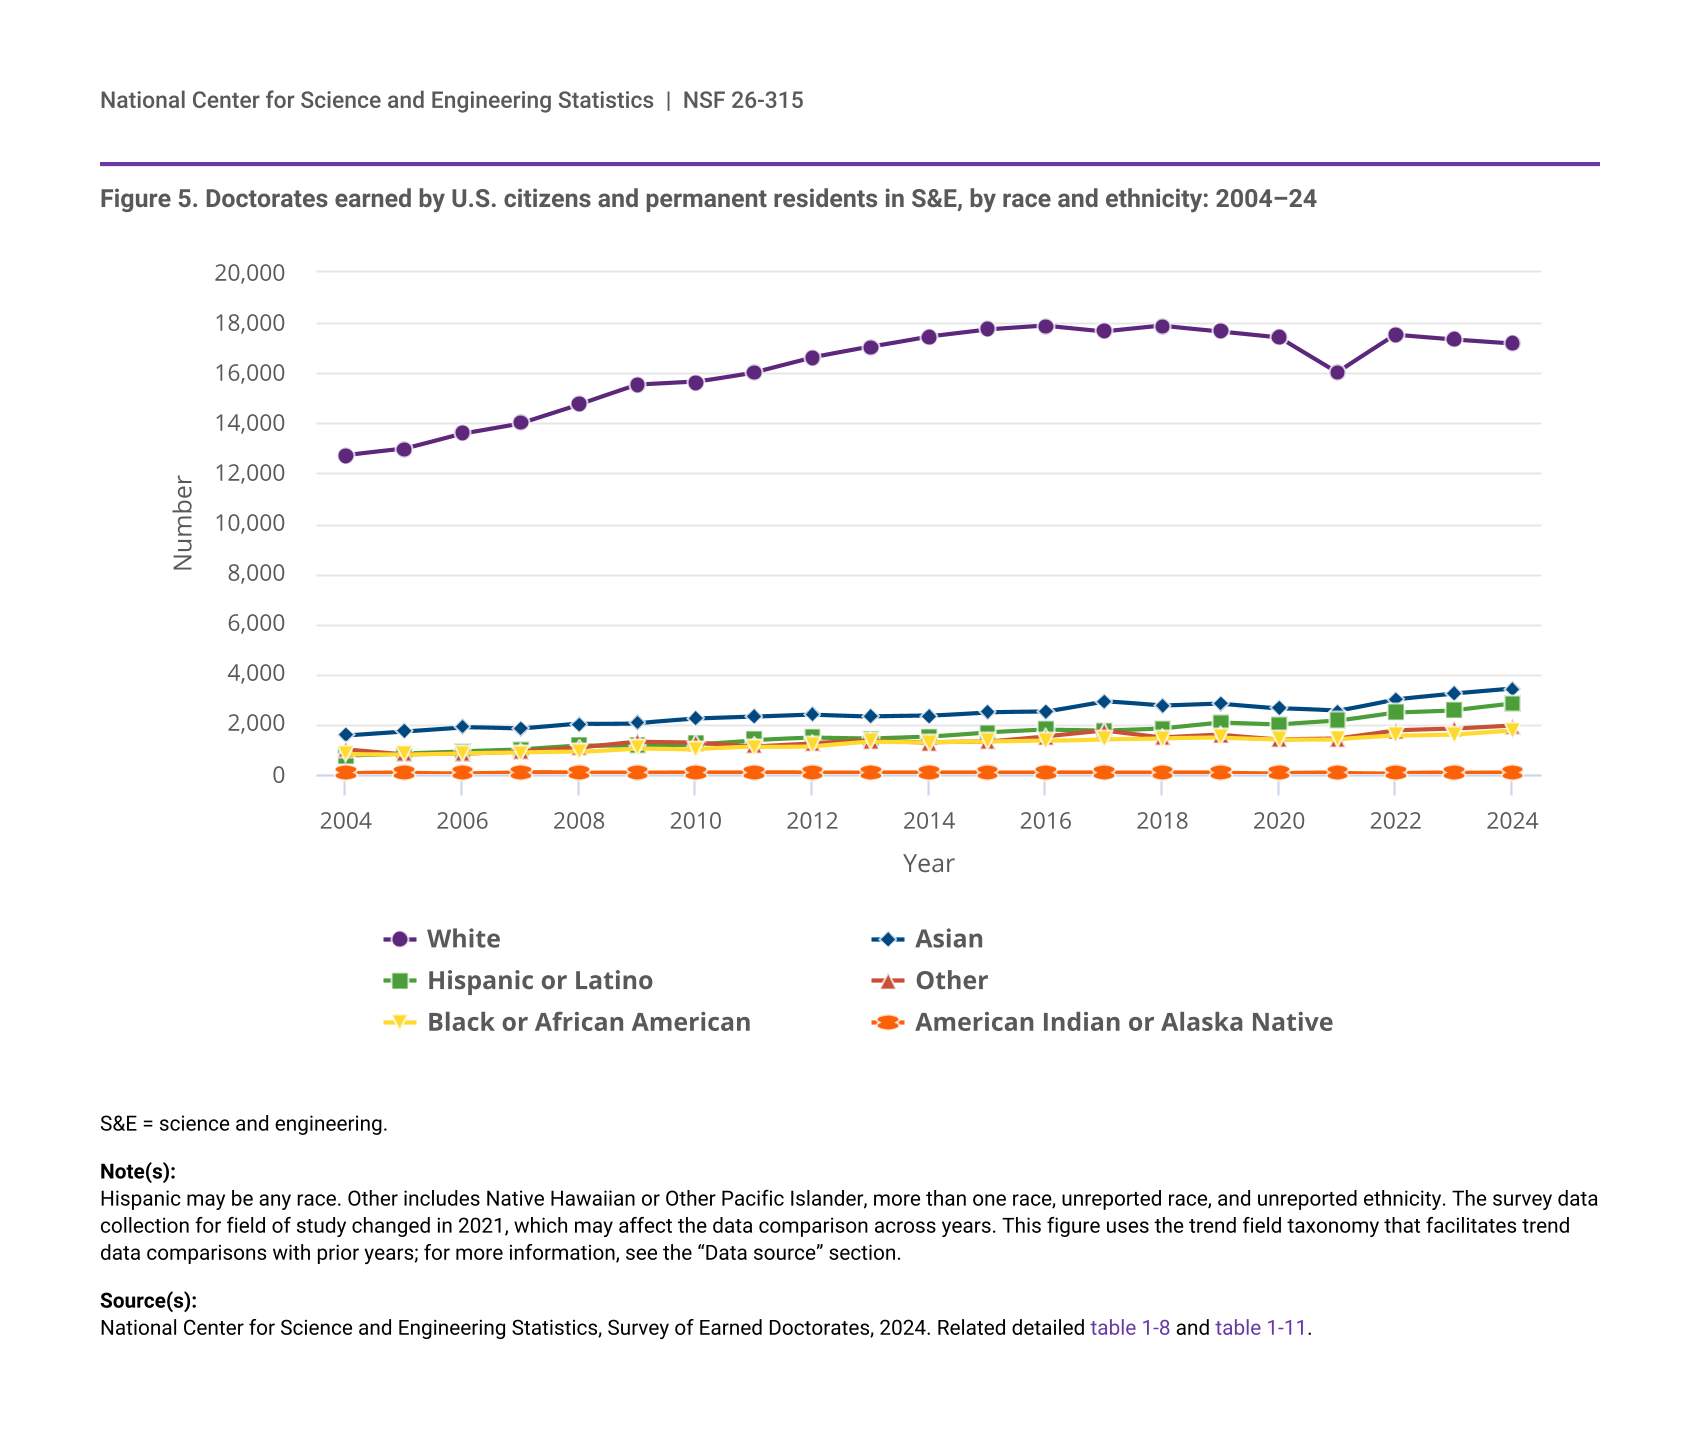
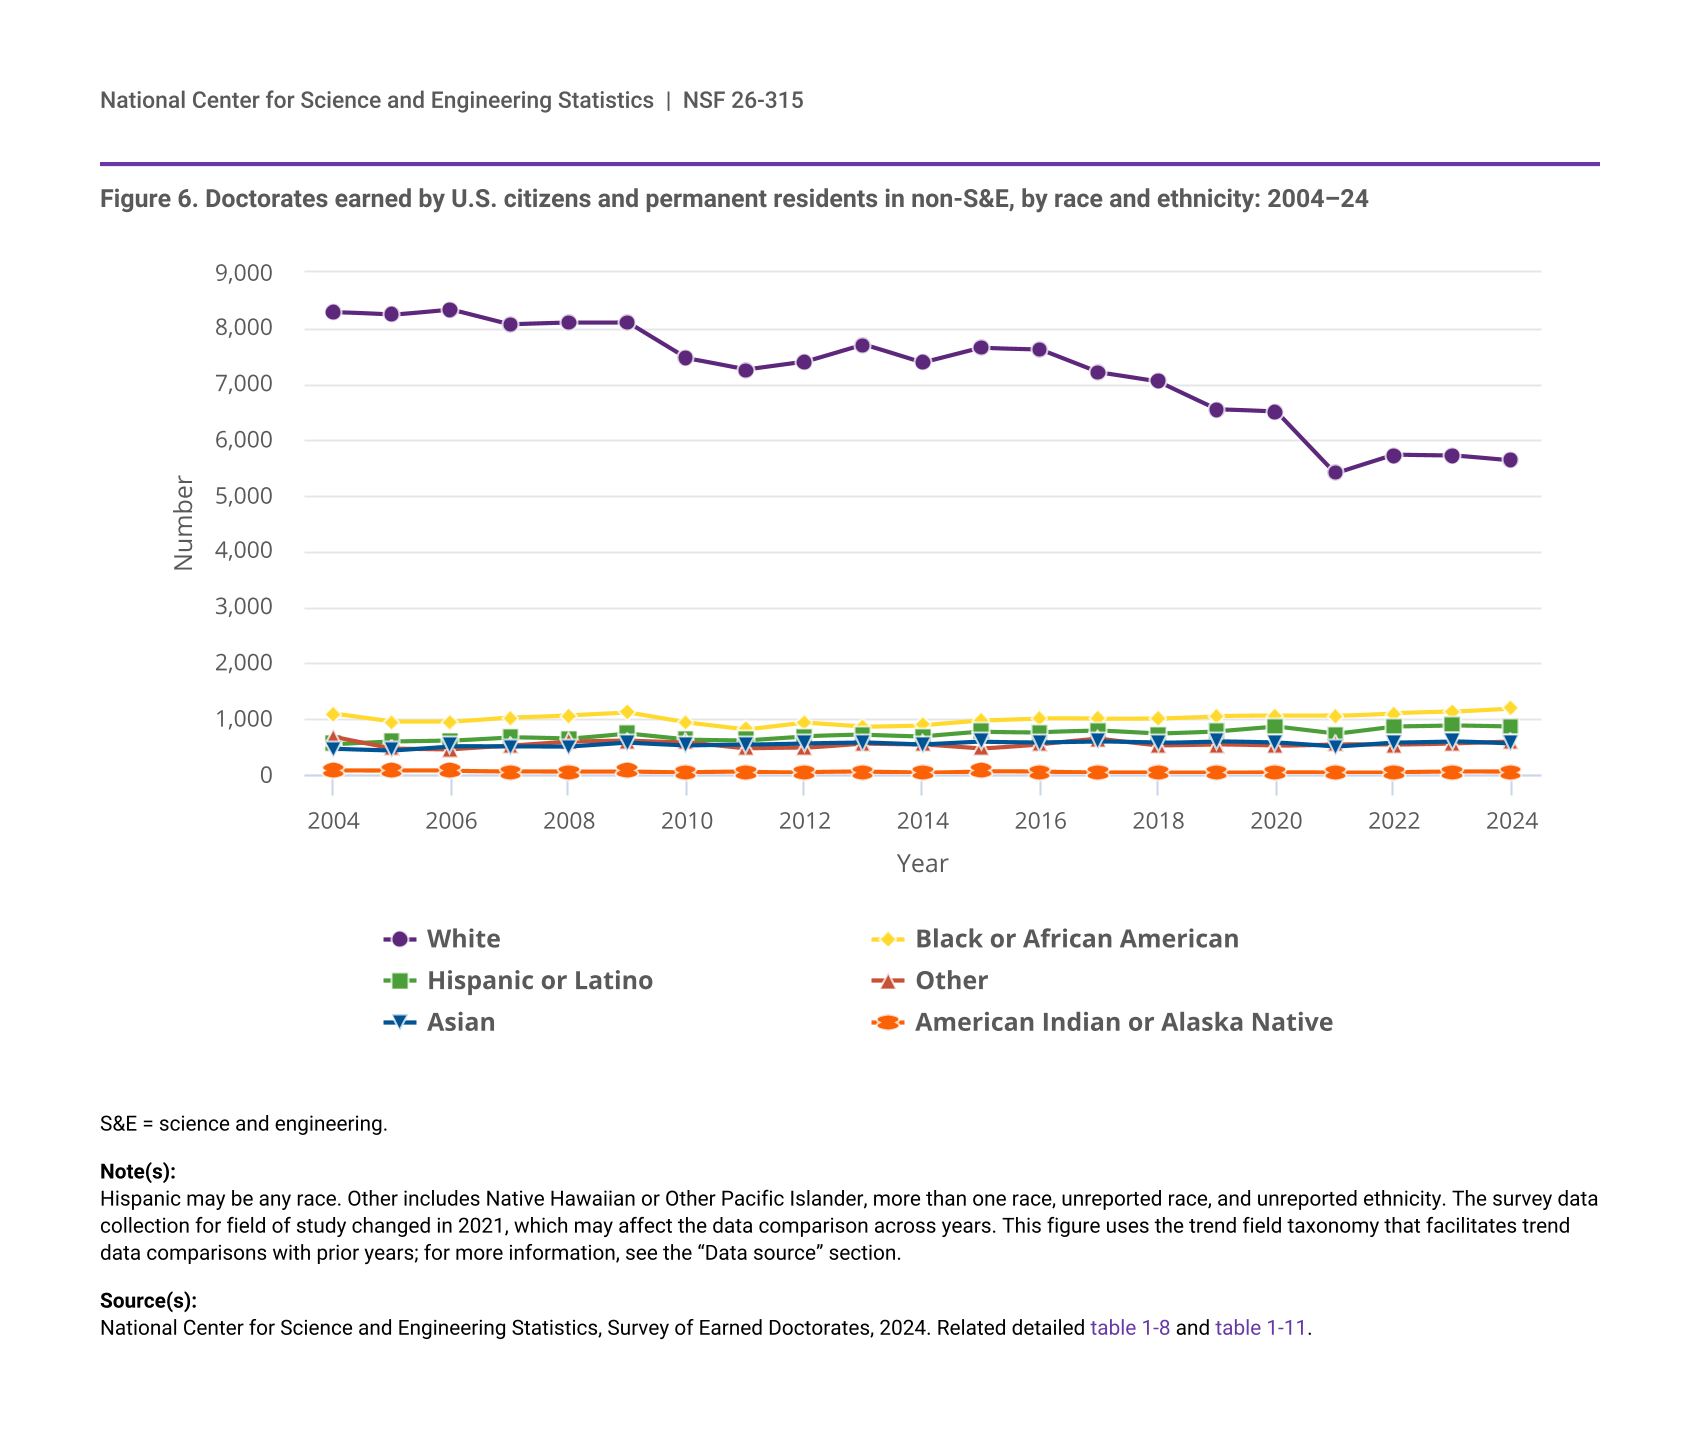
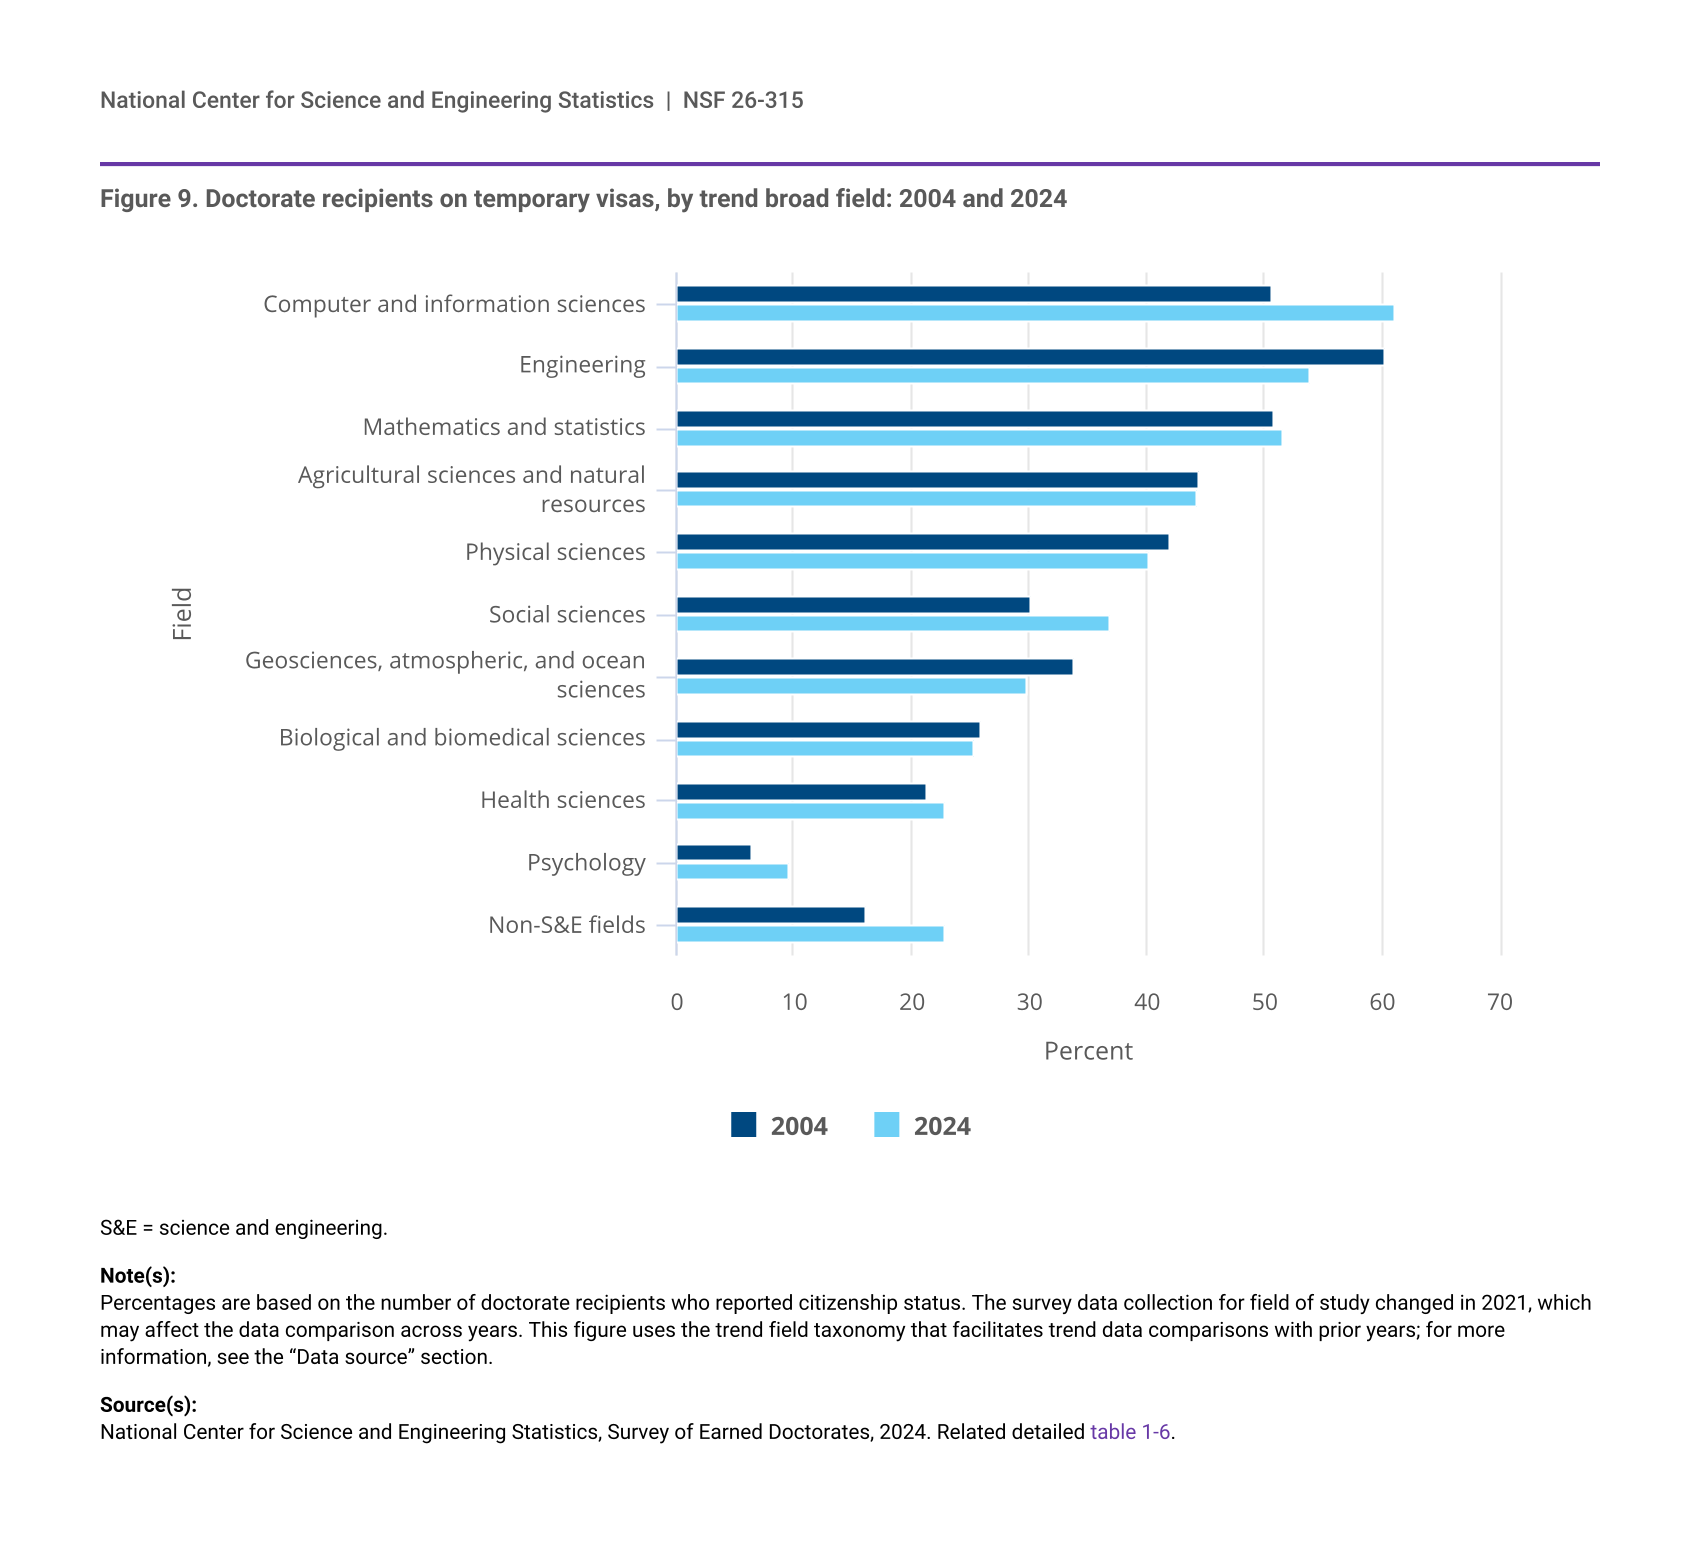
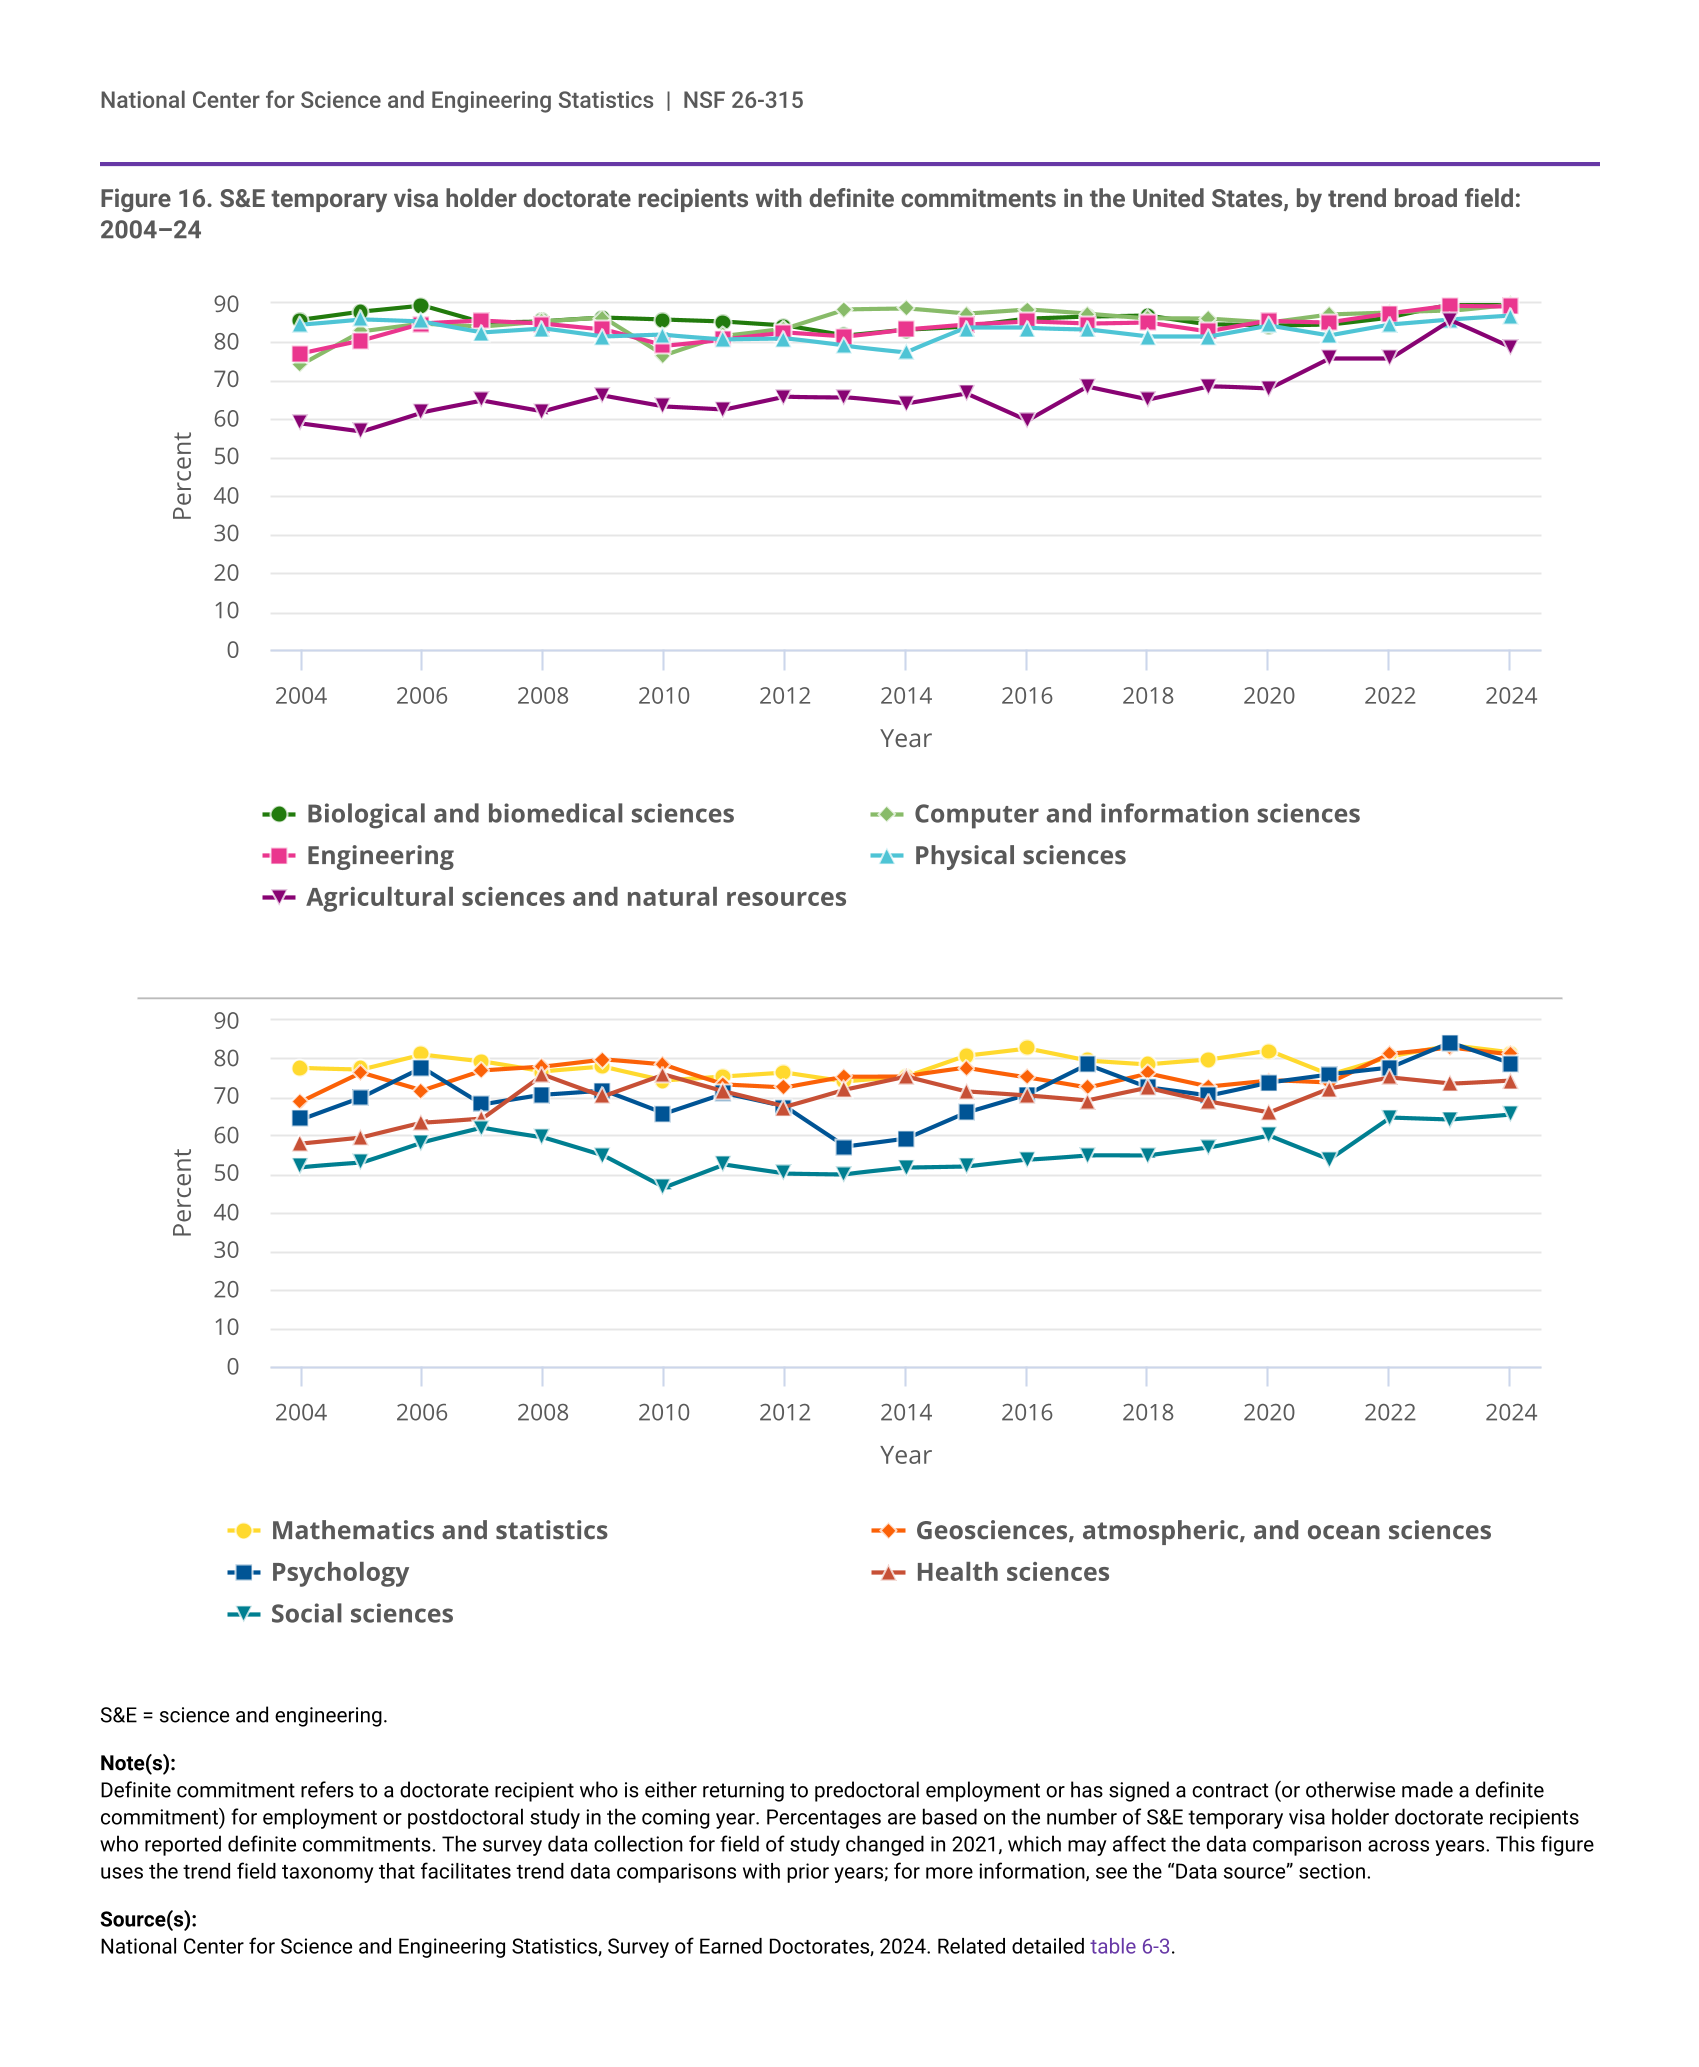
- In the past 2 decades, the number of doctorates awarded to temporary visa holders increased by 76% in S&E fields and by 24% in non-S&E fields, compared with a 61% increase in S&E and a 20% decline in non-S&E doctorates awarded to U.S. citizens and permanent residents.
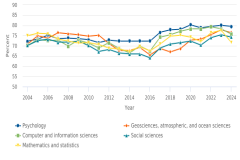
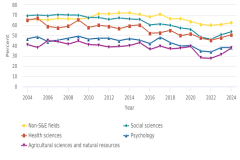
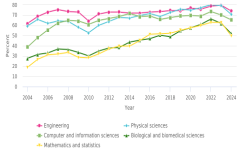
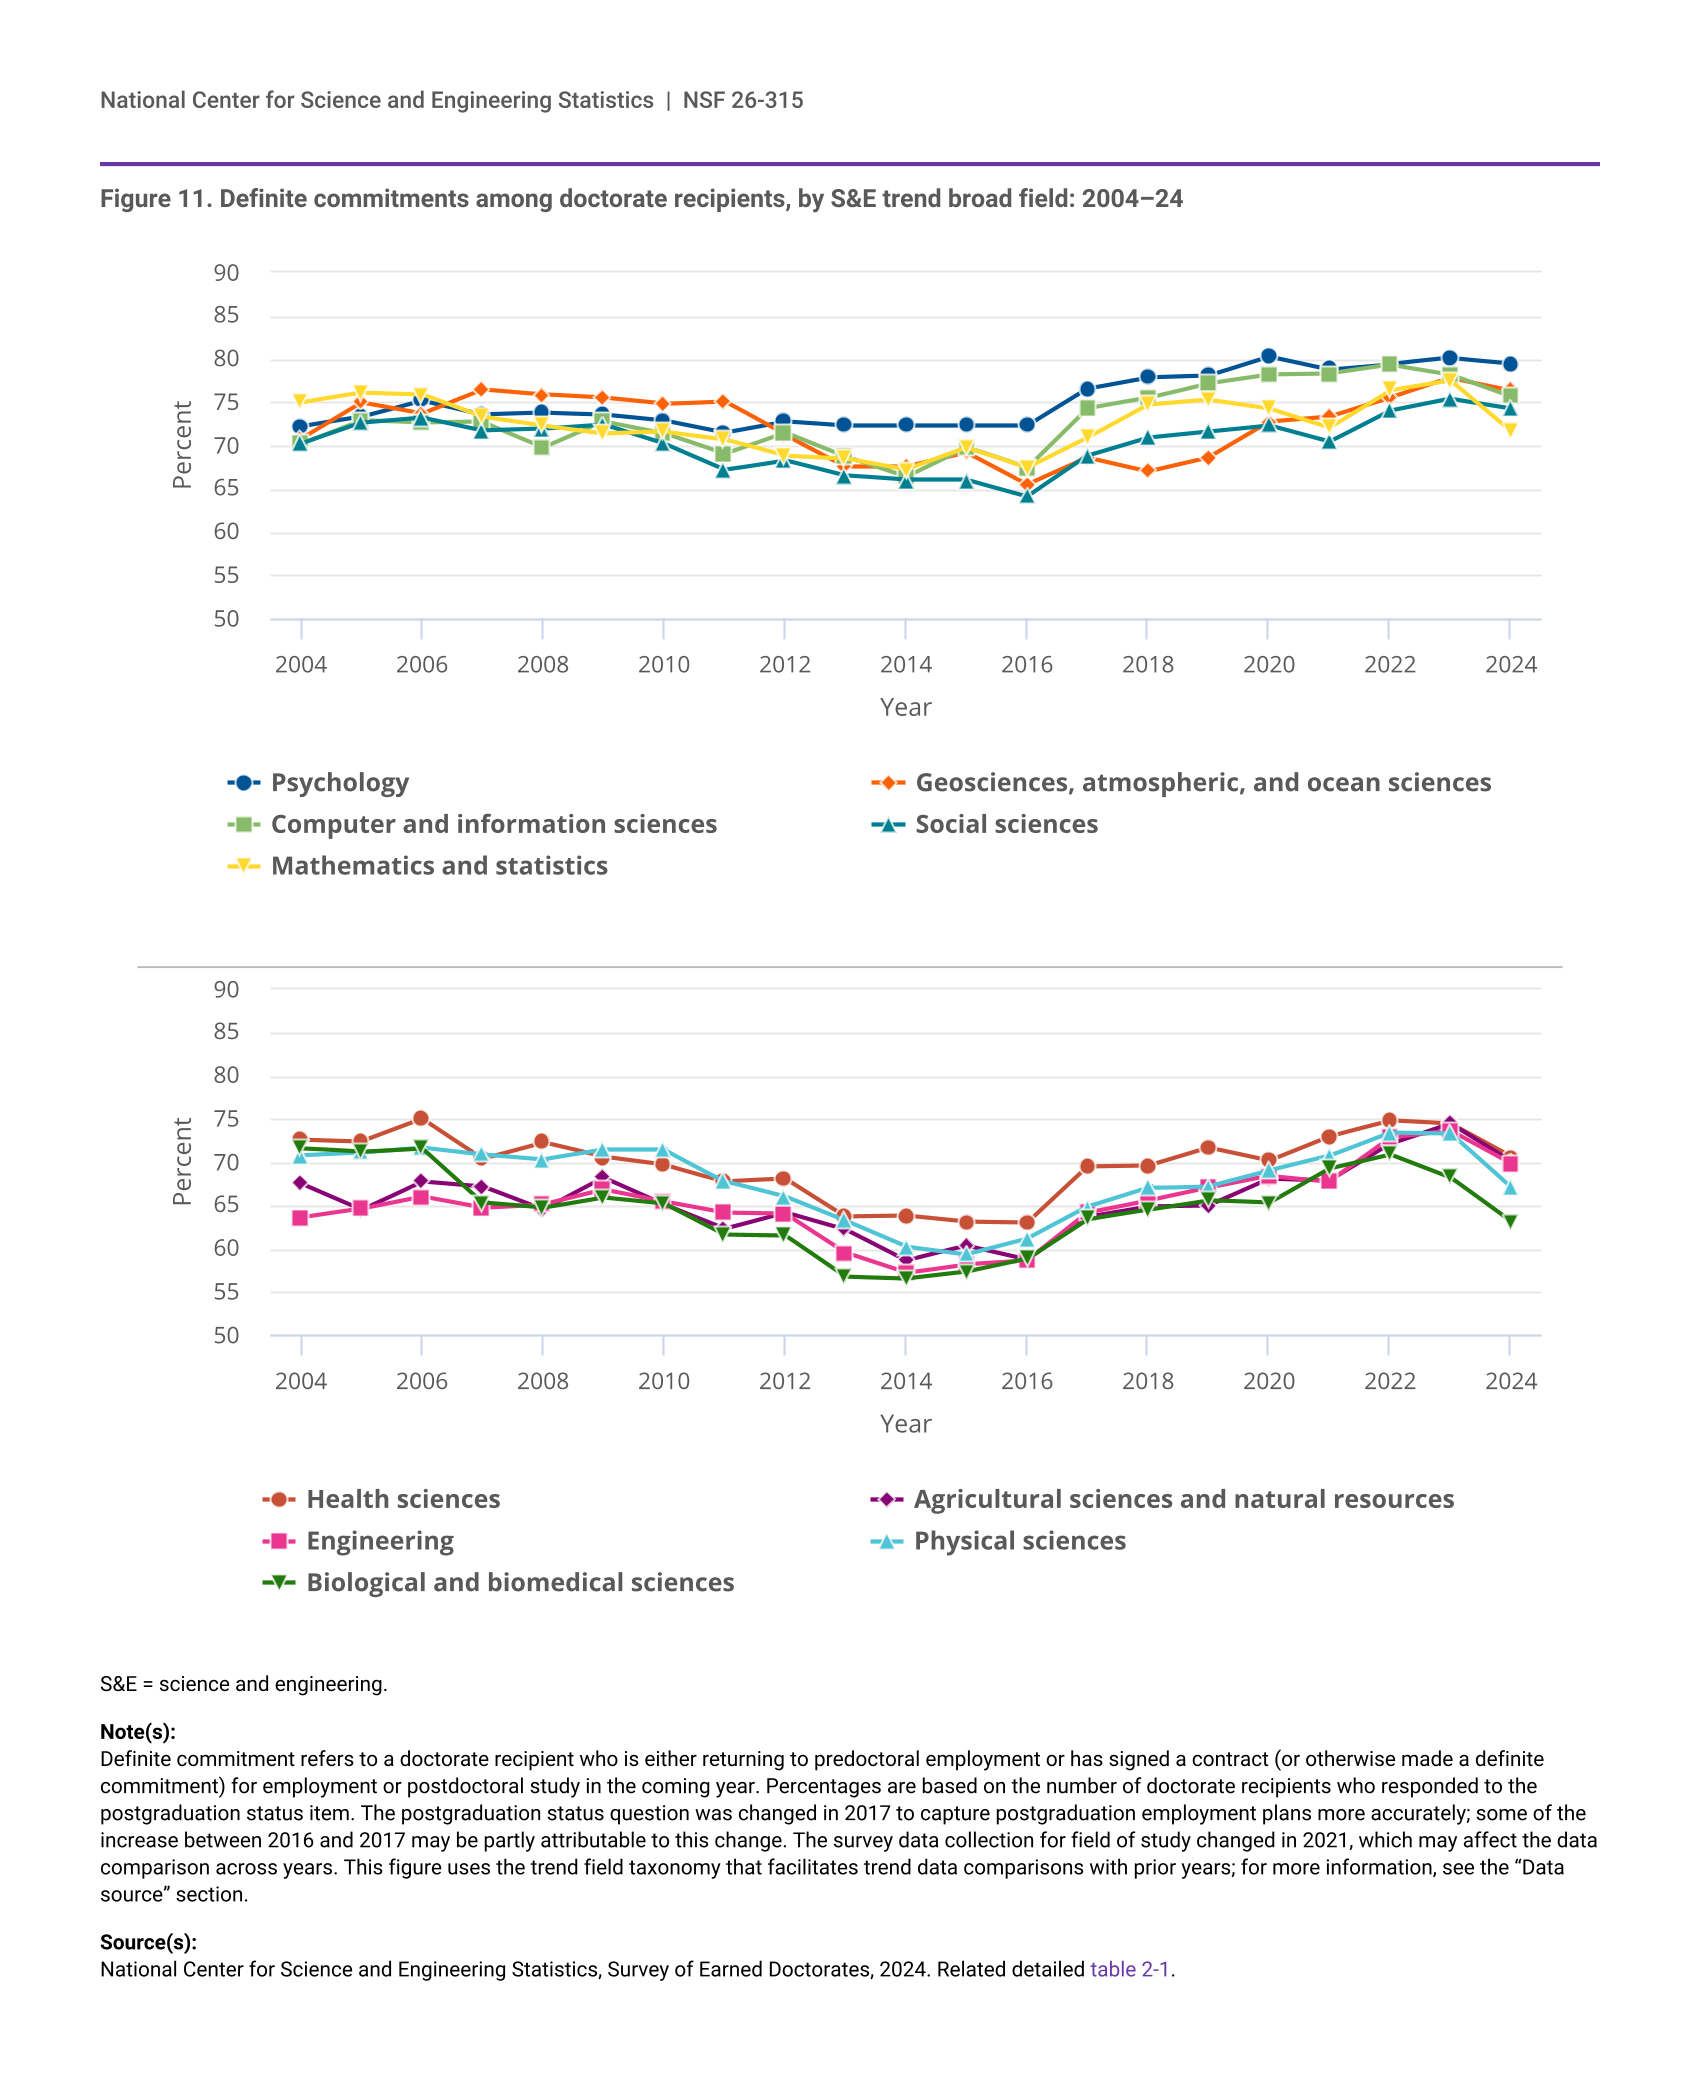
- Between 2023 and 2024, the proportion of doctorate recipients with definite employment commitments declined in all S&E broad fields. The largest declines were in physical sciences and mathematics and statistics (6 percentage points each); in biological and biomedical sciences (5 percentage points); and in agricultural sciences and natural resources, health sciences, and engineering (4 percentage points each).
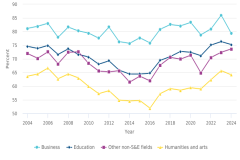
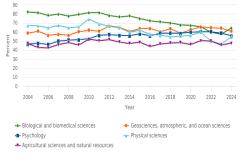
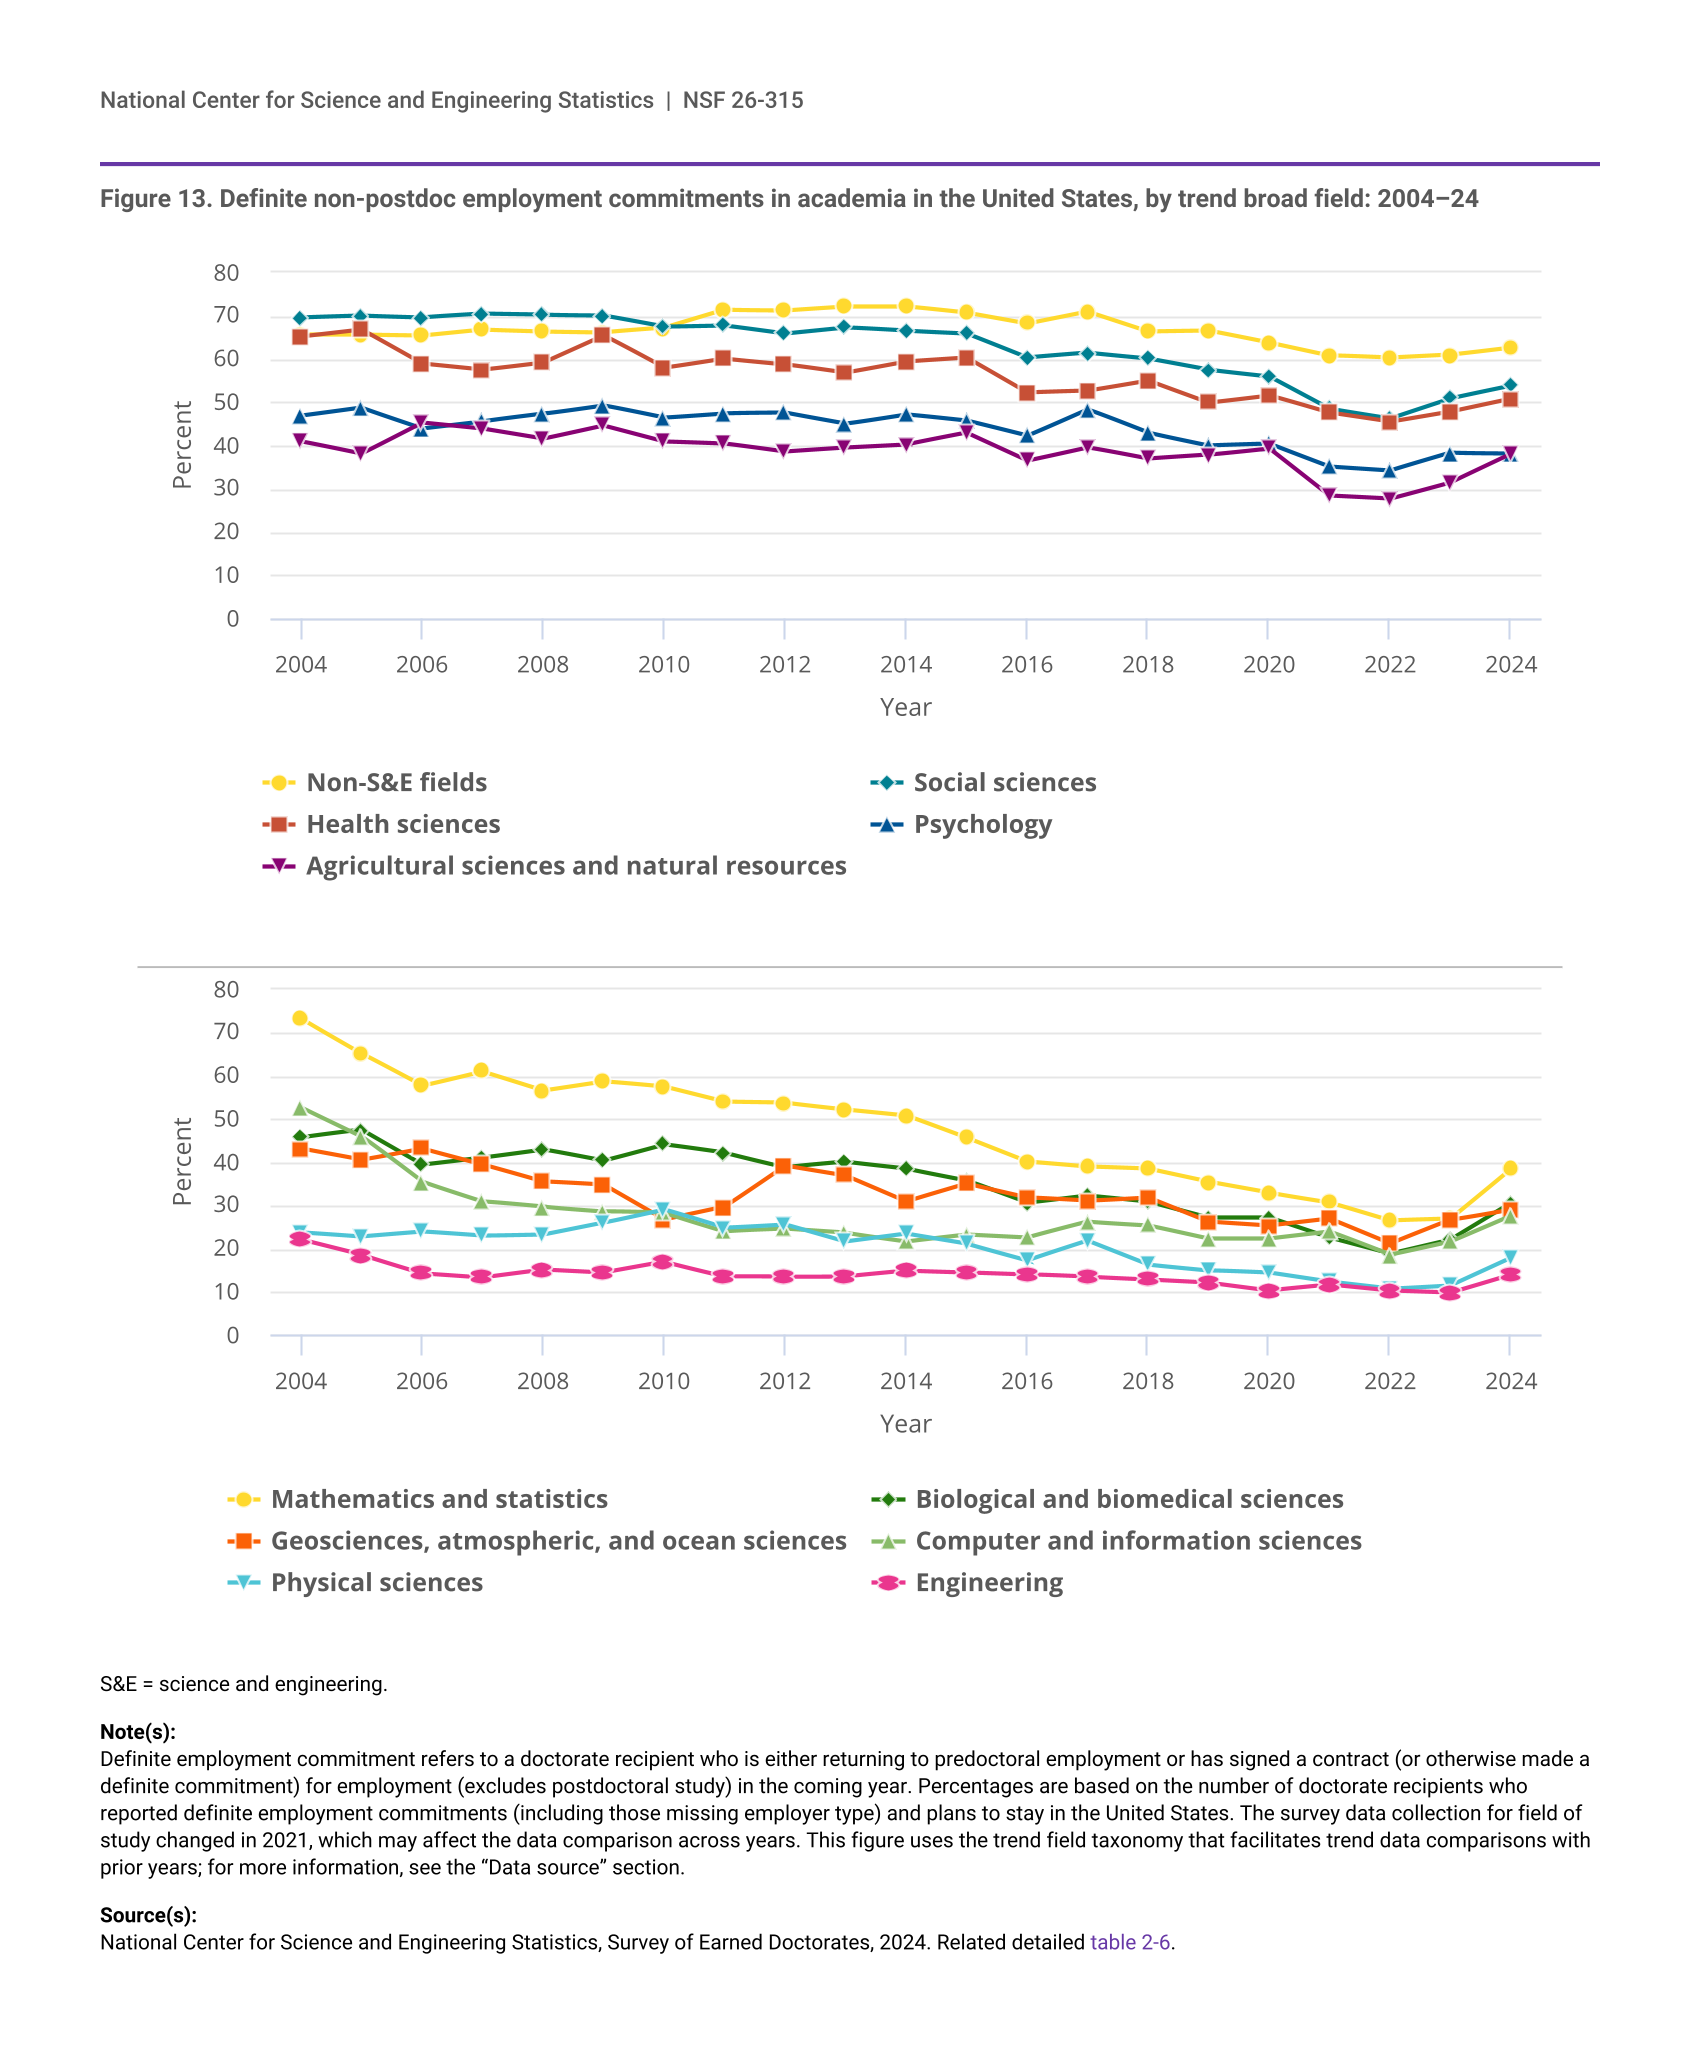
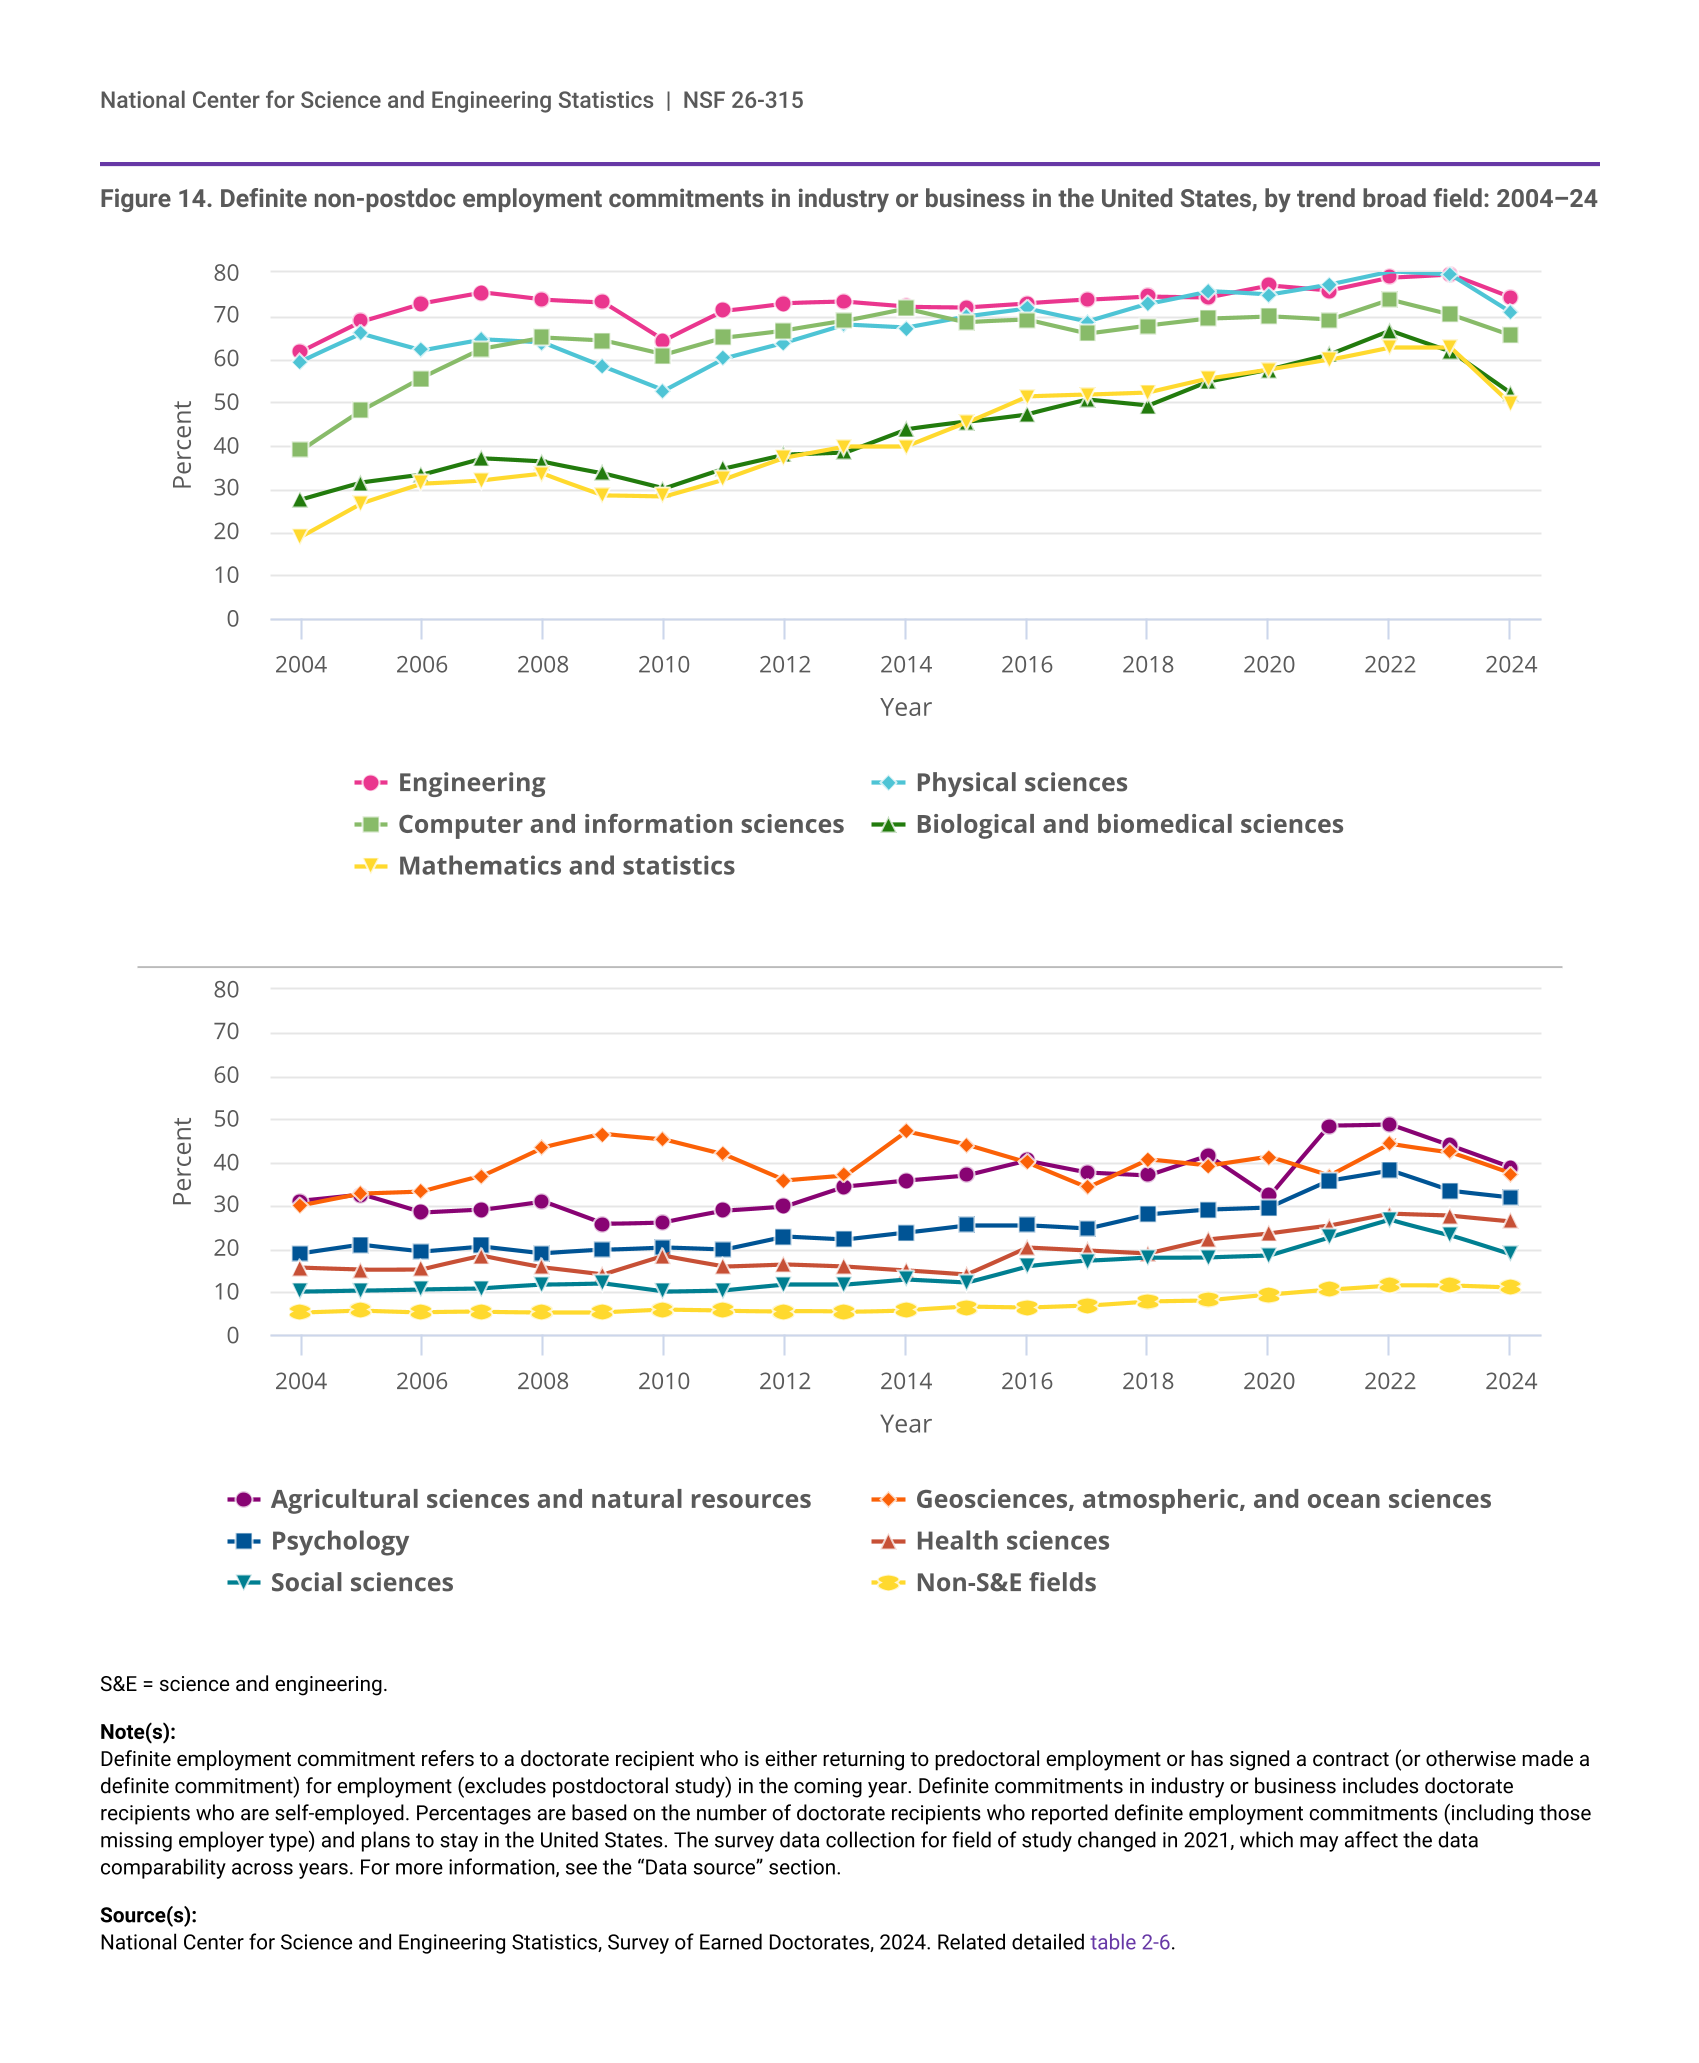
- In the past 20 years, the proportion of non-postdoc U.S. employment commitments in academia declined in all S&E fields, while the proportion of those in industry or business increased. Despite this long-term trend, between 2023 and 2024 the proportion of non-postdoc commitments in academia increased in all S&E fields except psychology. In industry or business, the proportion of these commitments declined in all S&E fields since at least 2022.
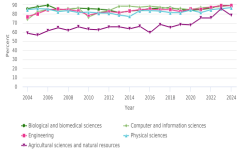
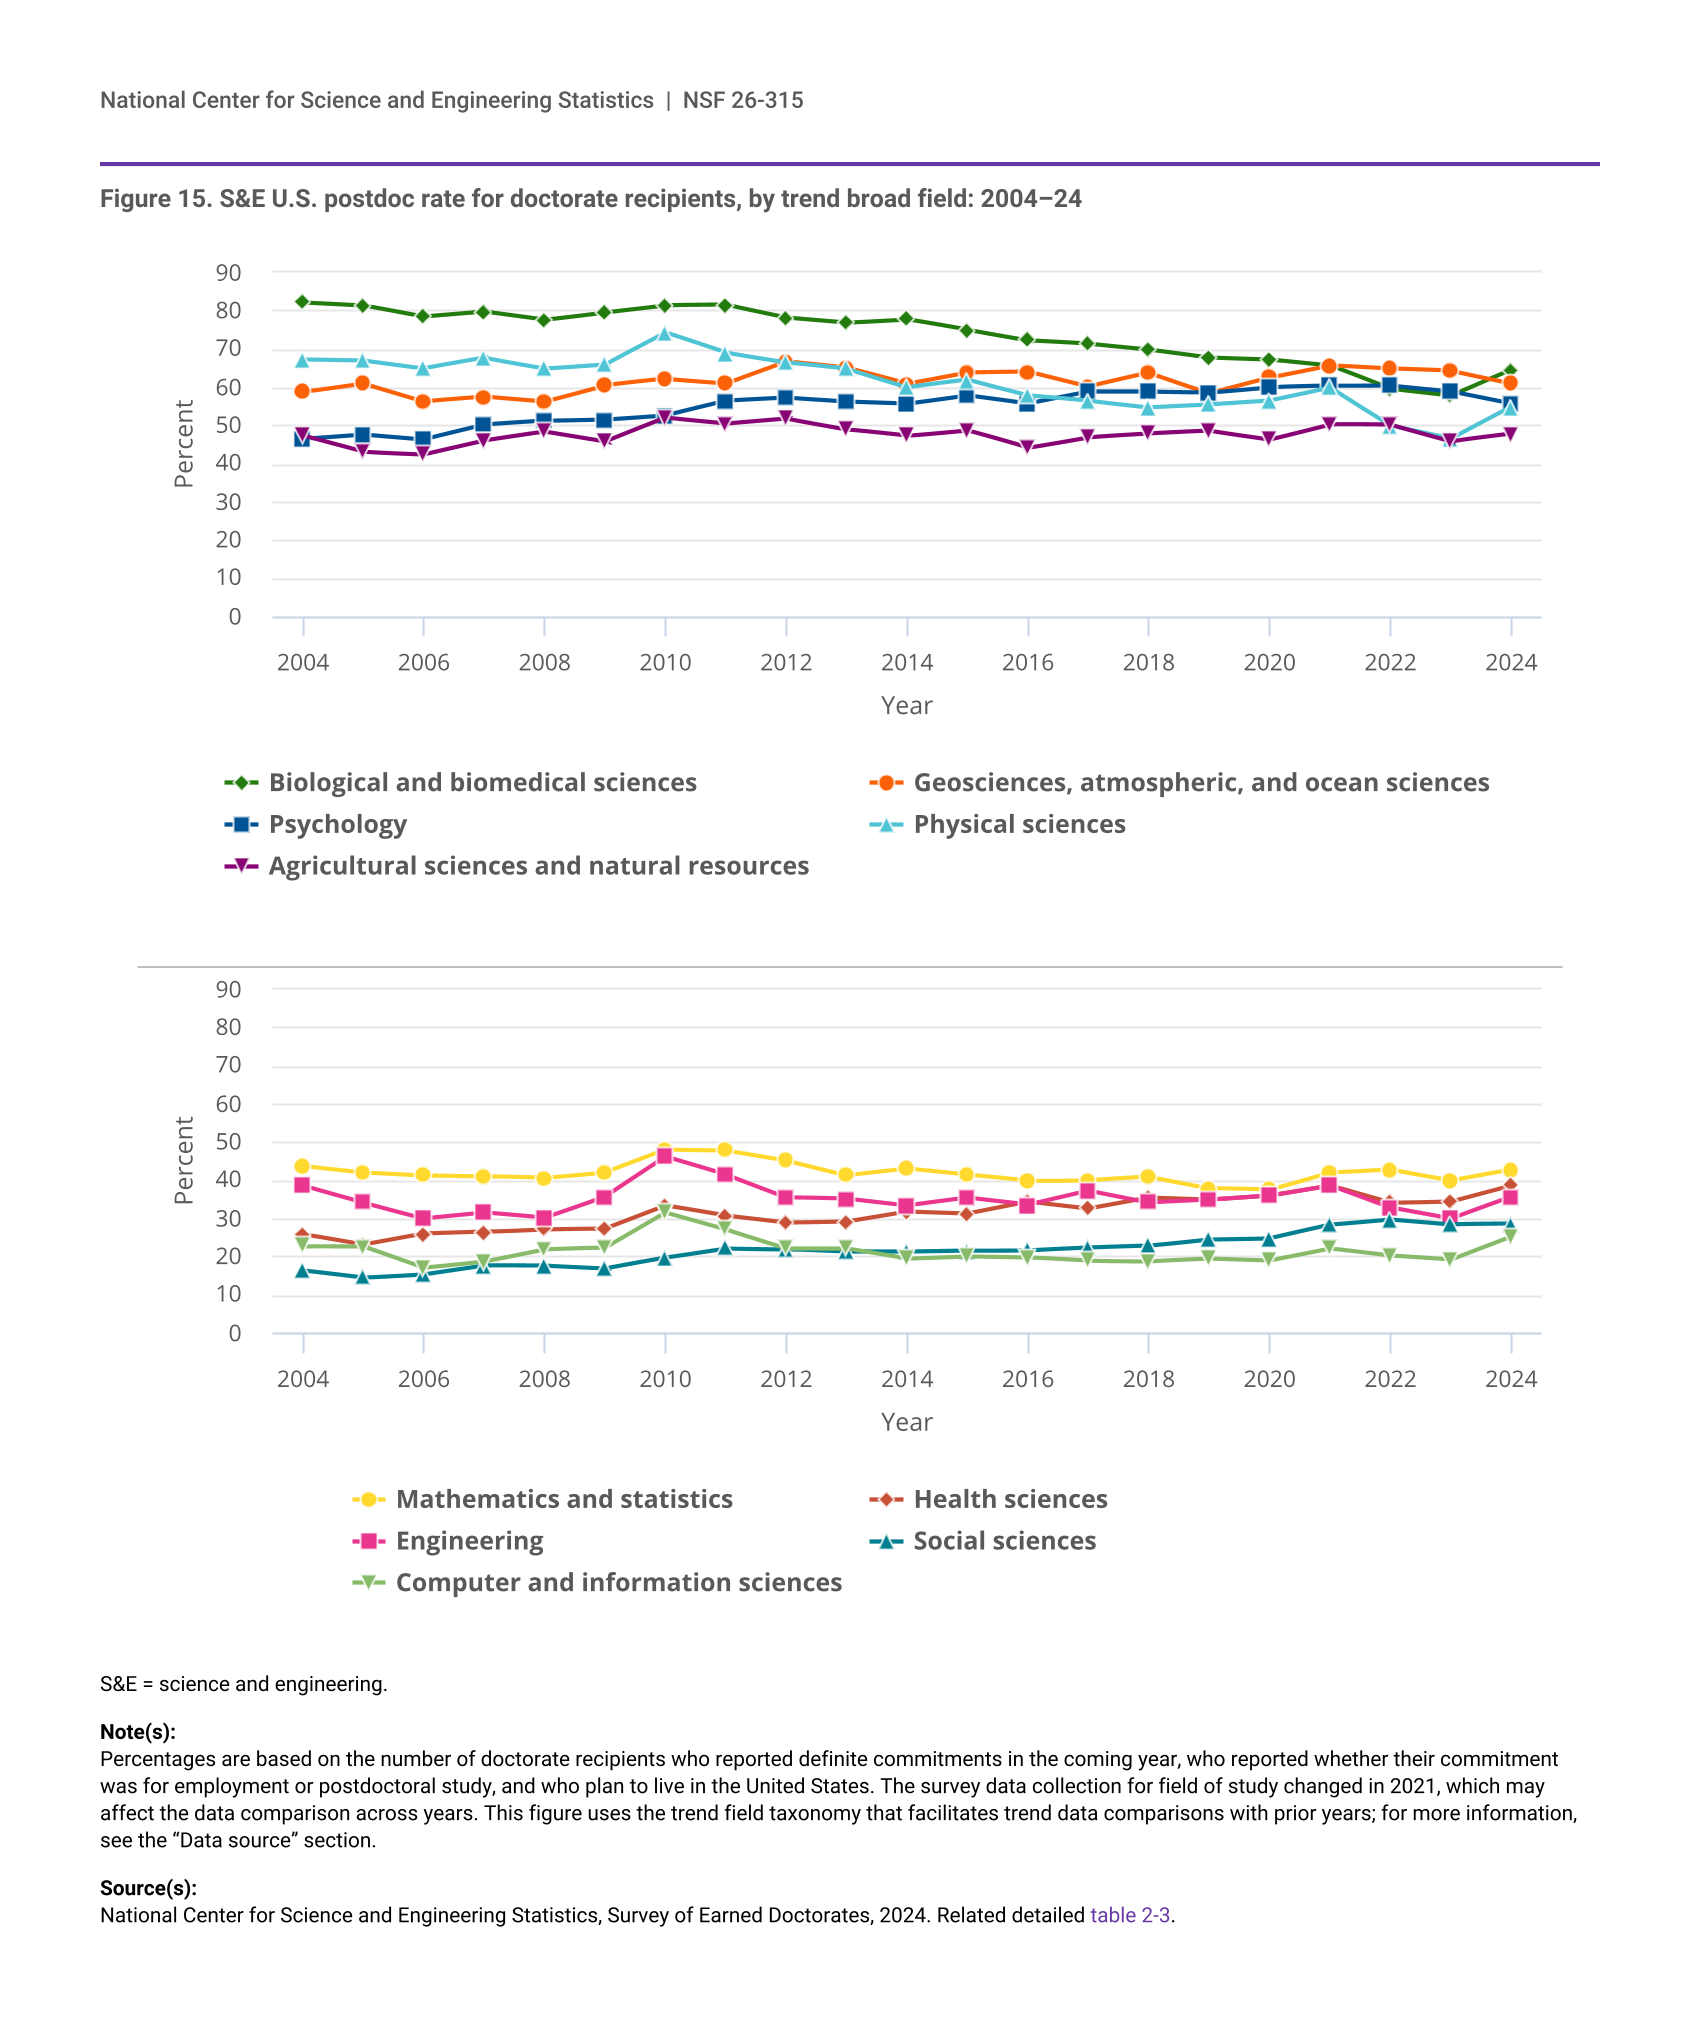
- Between 2023 and 2024, the proportion of definite commitments for postdoc positions increased in most S&E fields. The largest increases, between 6 and 8 percentage points, were in physical sciences, biological and biomedical sciences, and computer and information sciences.