 An official website of the United States government
Report
U.S. doctorate awards
Each annual cohort of doctorate recipients augments the supply of prospective scientists, engineers, researchers, and scholars available to the U.S. labor market. Data on the composition of these cohorts reveal demographic changes.
Overall trends
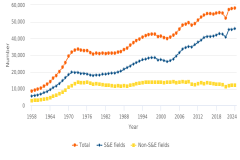
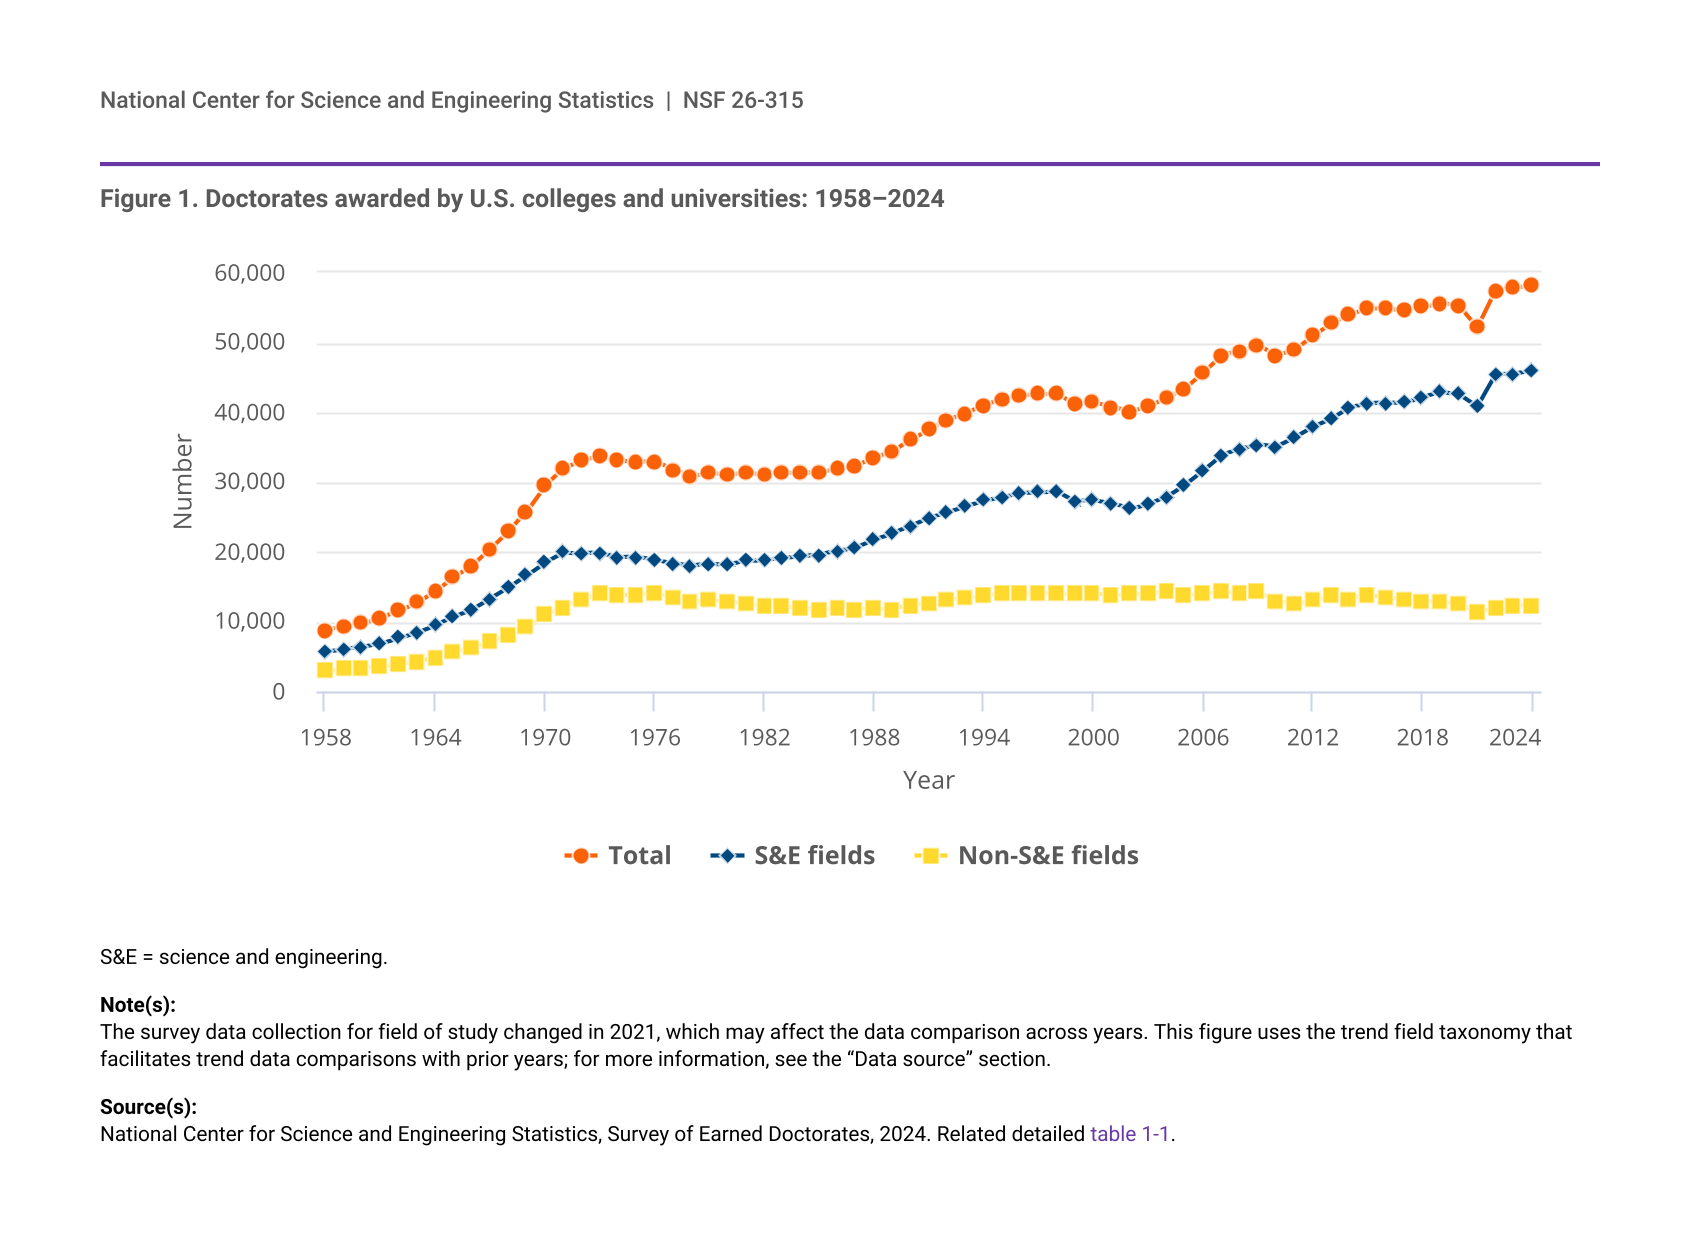
The number of research doctoral degrees awarded by U.S. institutions increased from 57,806 in 2023 to 58,131 in 2024 (figure 1). This increase is similar to the increase between 2022 and 2023. Since the Survey of Earned Doctorates (SED) began collecting data in academic year 1958, there has been an upward trend in the number of doctorates awarded by U.S. institutions—with an average annual growth of 3.0%, punctuated by periods of slower growth and some declines.
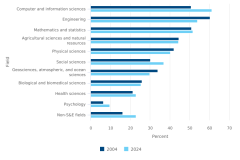
Since the survey’s inception, the number of doctorates in science and engineering (S&E) fields has exceeded the number of non-S&E doctorates and this gap has widened over time. From 2004 to 2024, the number of S&E doctorate recipients increased by 65%, while the number of non-S&E doctorate recipients decreased by 15%. As a result, the proportion of S&E doctorates to all doctorates climbed from 66% in 2004 to 79% in 2024.
| Year | Total | S&E fields | Non-S&E fields |
|---|---|---|---|
| 1958 | 8,773 | 5,751 | 3,022 |
| 1959 | 9,213 | 6,043 | 3,170 |
| 1960 | 9,733 | 6,388 | 3,345 |
| 1961 | 10,413 | 6,872 | 3,541 |
| 1962 | 11,500 | 7,612 | 3,888 |
| 1963 | 12,728 | 8,422 | 4,306 |
| 1964 | 14,325 | 9,462 | 4,863 |
| 1965 | 16,340 | 10,706 | 5,634 |
| 1966 | 17,949 | 11,732 | 6,217 |
| 1967 | 20,403 | 13,274 | 7,129 |
| 1968 | 22,937 | 14,824 | 8,113 |
| 1969 | 25,743 | 16,574 | 9,169 |
| 1970 | 29,498 | 18,458 | 11,040 |
| 1971 | 31,867 | 19,904 | 11,963 |
| 1972 | 33,041 | 19,791 | 13,250 |
| 1973 | 33,755 | 19,838 | 13,917 |
| 1974 | 33,047 | 19,170 | 13,877 |
| 1975 | 32,952 | 19,237 | 13,715 |
| 1976 | 32,946 | 18,857 | 14,089 |
| 1977 | 31,716 | 18,327 | 13,389 |
| 1978 | 30,875 | 17,977 | 12,898 |
| 1979 | 31,238 | 18,241 | 12,997 |
| 1980 | 31,019 | 18,190 | 12,829 |
| 1981 | 31,355 | 18,739 | 12,616 |
| 1982 | 31,108 | 18,765 | 12,343 |
| 1983 | 31,280 | 19,130 | 12,150 |
| 1984 | 31,334 | 19,309 | 12,025 |
| 1985 | 31,295 | 19,527 | 11,768 |
| 1986 | 31,897 | 20,088 | 11,809 |
| 1987 | 32,365 | 20,583 | 11,782 |
| 1988 | 33,497 | 21,697 | 11,800 |
| 1989 | 34,325 | 22,585 | 11,740 |
| 1990 | 36,065 | 23,715 | 12,350 |
| 1991 | 37,530 | 24,921 | 12,609 |
| 1992 | 38,886 | 25,644 | 13,242 |
| 1993 | 39,800 | 26,486 | 13,314 |
| 1994 | 41,034 | 27,331 | 13,703 |
| 1995 | 41,747 | 27,704 | 14,043 |
| 1996 | 42,437 | 28,442 | 13,995 |
| 1997 | 42,539 | 28,521 | 14,018 |
| 1998 | 42,636 | 28,636 | 14,000 |
| 1999 | 41,101 | 27,198 | 13,903 |
| 2000 | 41,369 | 27,420 | 13,949 |
| 2001 | 40,744 | 26,936 | 13,808 |
| 2002 | 40,031 | 26,136 | 13,895 |
| 2003 | 40,762 | 26,759 | 14,003 |
| 2004 | 42,122 | 27,842 | 14,280 |
| 2005 | 43,385 | 29,621 | 13,764 |
| 2006 | 45,620 | 31,640 | 13,980 |
| 2007 | 48,132 | 33,809 | 14,323 |
| 2008 | 48,776 | 34,765 | 14,011 |
| 2009 | 49,552 | 35,369 | 14,183 |
| 2010 | 48,028 | 35,043 | 12,985 |
| 2011 | 48,909 | 36,378 | 12,531 |
| 2012 | 50,943 | 37,895 | 13,048 |
| 2013 | 52,703 | 39,084 | 13,619 |
| 2014 | 53,986 | 40,708 | 13,278 |
| 2015 | 54,886 | 41,247 | 13,639 |
| 2016 | 54,809 | 41,306 | 13,503 |
| 2017 | 54,550 | 41,364 | 13,186 |
| 2018 | 55,077 | 42,144 | 12,933 |
| 2019 | 55,598 | 42,897 | 12,701 |
| 2020 | 55,200 | 42,561 | 12,639 |
| 2021 | 52,159 | 40,818 | 11,341 |
| 2022 | 57,439 | 45,393 | 12,046 |
| 2023 | 57,806 | 45,493 | 12,313 |
| 2024 | 58,131 | 45,929 | 12,202 |
S&E = science and engineering.
The survey data collection for field of study changed in 2021, which may affect the data comparison across years. This figure uses the trend field taxonomy that facilitates trend data comparisons with prior years; for more information, see the “Data source” section.
National Center for Science and Engineering Statistics, Survey of Earned Doctorates, 2024. Related detailed table 1-1.
Citizenship
Trends in citizenship
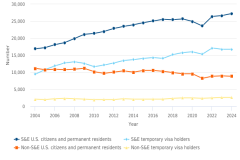
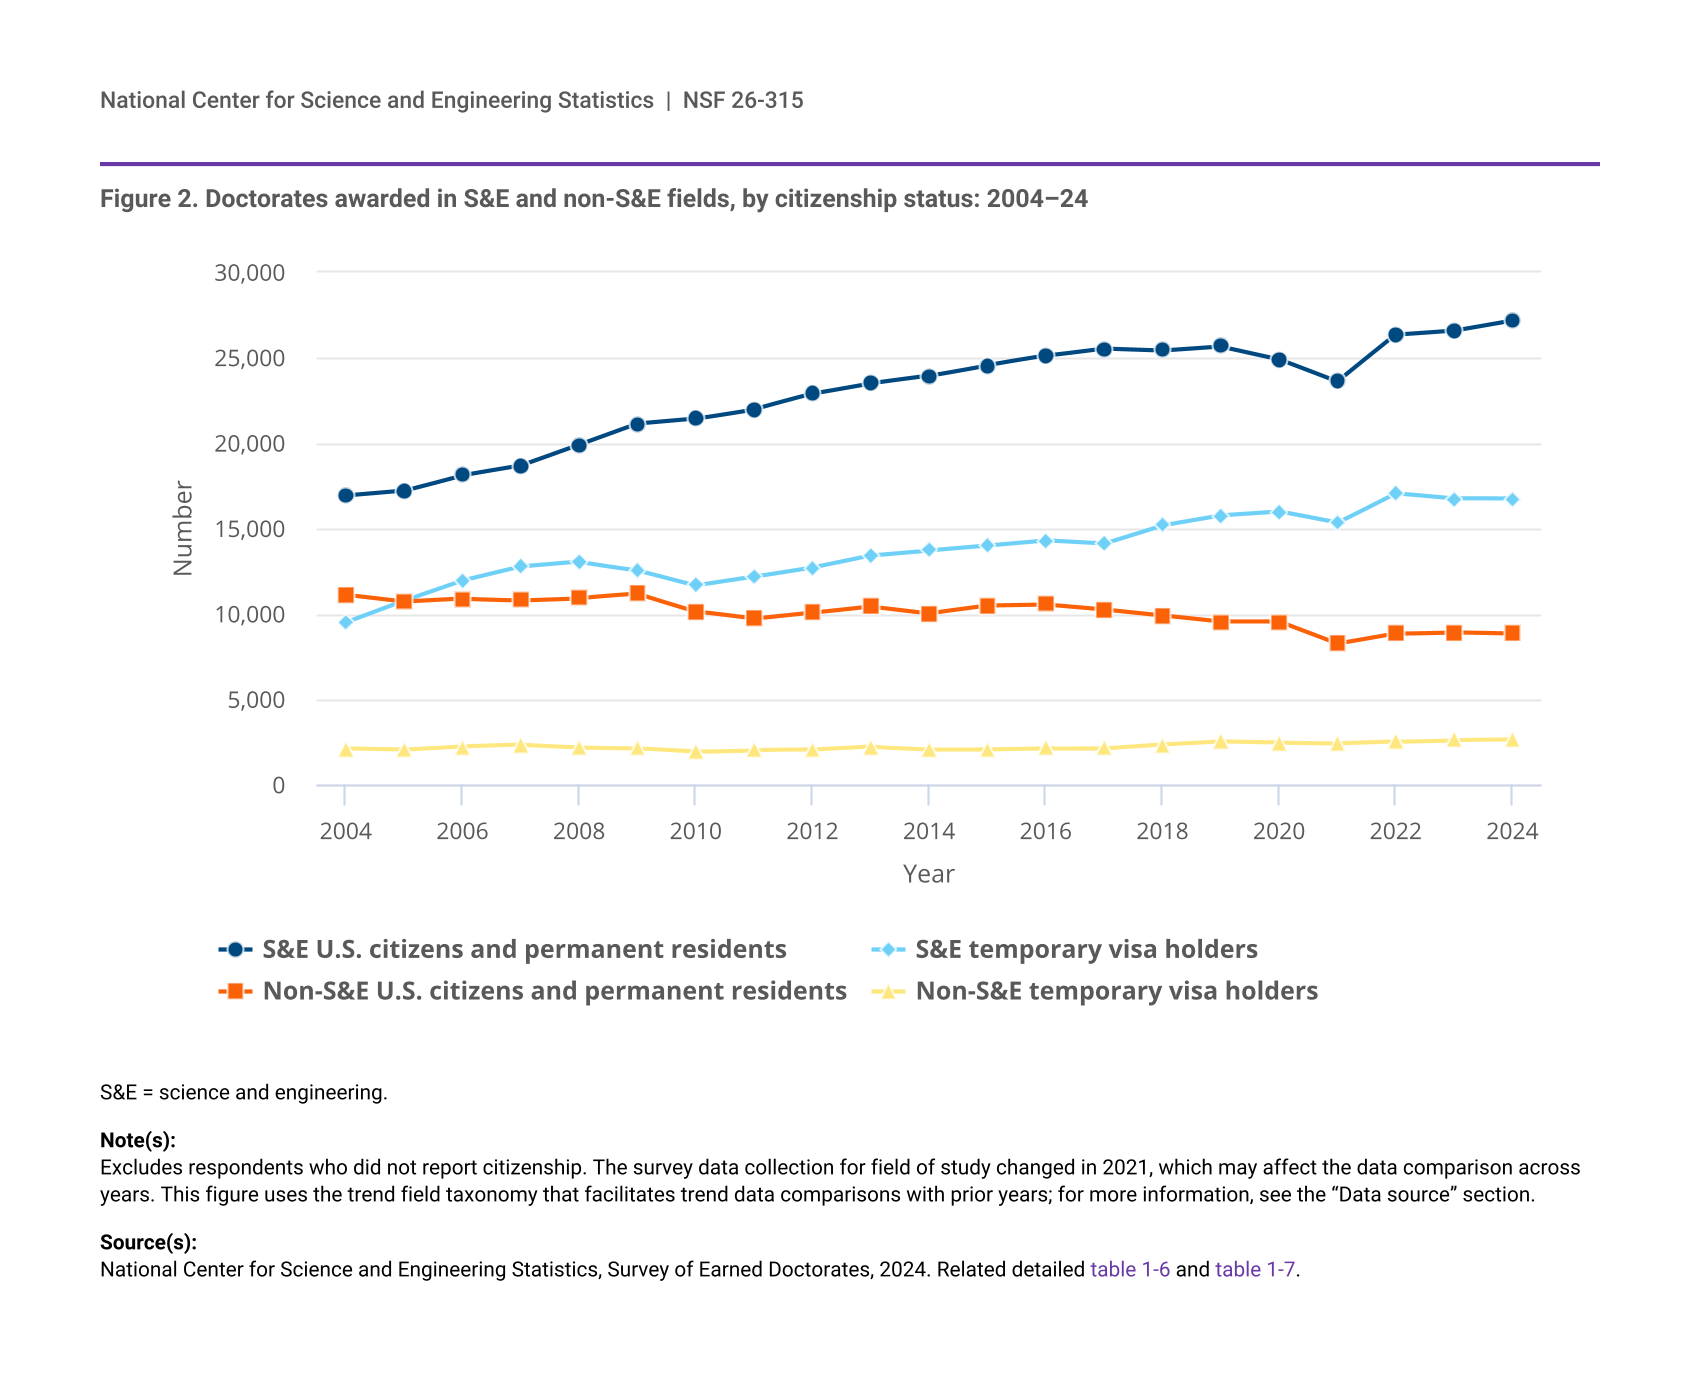
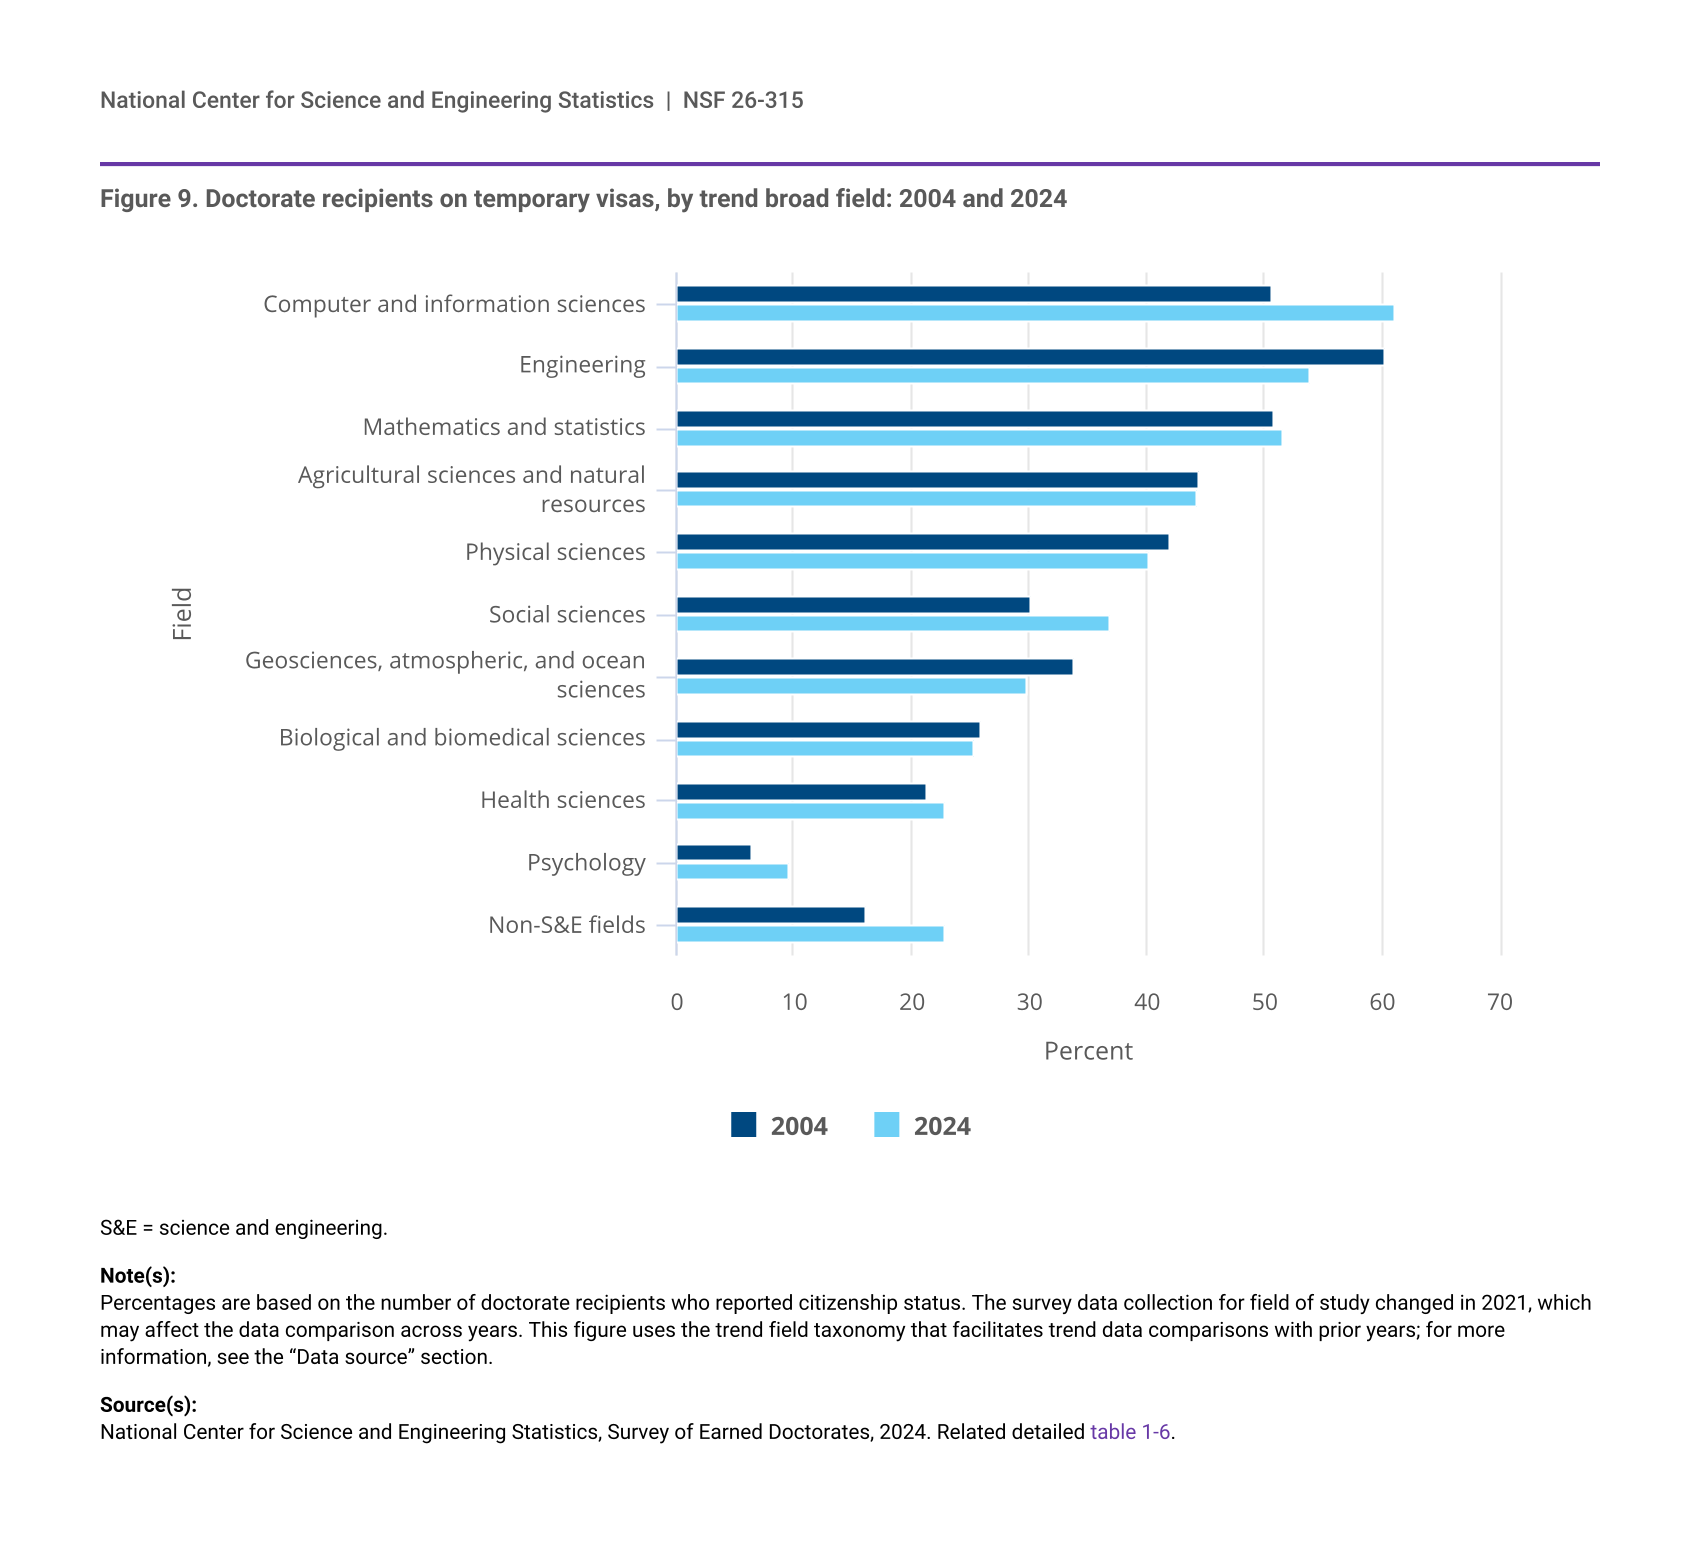
In 2024, U.S. institutions awarded 45,929 total S&E doctorates. Of the 43,942 S&E doctorate recipients who reported their citizenship, U.S. citizens and permanent residents earned 27,204 (62%) of the S&E doctorates, an increase of 600 from 2023. Temporary visa holders earned 16,738 (38%), a slight decline of 27 from 2023 (figure 2). Over the past 20 years, the average proportions of U.S. citizens and permanent residents and temporary visa holders earning S&E doctorates from U.S. institutions has remained stable at 62% and 38%, respectively. Overall, the number of S&E doctorates awarded to temporary visa holders has increased by 76% since 2004 and by 22% since 2014. Over the past 20 years, the proportion of S&E doctorates awarded to temporary visa holders peaked at 41% in 2007, declined to 35% in 2010, held steady at about 36% between 2011 and 2017, and grew to 39% through 2020, where it remained about the same through 2024. Starting from a larger base, the number of S&E doctorates awarded to U.S. citizens and permanent residents experienced a slower relative increase over the past 20 years (61% since 2004 and 14% since 2014) compared with the increase in S&E doctorates awarded to temporary visa holders.
| Year | S&E U.S. citizens and permanent residents | S&E temporary visa holders | Non-S&E U.S. citizens and permanent residents | Non-S&E temporary visa holders |
|---|---|---|---|---|
| 2004 | 16,921 | 9,499 | 11,119 | 2,129 |
| 2005 | 17,211 | 10,769 | 10,734 | 2,063 |
| 2006 | 18,121 | 11,949 | 10,907 | 2,249 |
| 2007 | 18,679 | 12,769 | 10,822 | 2,354 |
| 2008 | 19,907 | 13,053 | 10,937 | 2,208 |
| 2009 | 21,146 | 12,581 | 11,181 | 2,155 |
| 2010 | 21,444 | 11,683 | 10,158 | 1,953 |
| 2011 | 22,000 | 12,195 | 9,725 | 2,040 |
| 2012 | 22,894 | 12,739 | 10,087 | 2,045 |
| 2013 | 23,503 | 13,444 | 10,461 | 2,230 |
| 2014 | 23,943 | 13,743 | 10,060 | 2,096 |
| 2015 | 24,571 | 14,027 | 10,500 | 2,102 |
| 2016 | 25,112 | 14,325 | 10,566 | 2,152 |
| 2017 | 25,546 | 14,134 | 10,268 | 2,154 |
| 2018 | 25,436 | 15,204 | 9,913 | 2,377 |
| 2019 | 25,673 | 15,777 | 9,545 | 2,547 |
| 2020 | 24,919 | 15,997 | 9,539 | 2,476 |
| 2021 | 23,608 | 15,333 | 8,252 | 2,435 |
| 2022 | 26,352 | 17,081 | 8,849 | 2,537 |
| 2023 | 26,604 | 16,765 | 8,931 | 2,625 |
| 2024 | 27,204 | 16,738 | 8,858 | 2,633 |
S&E = science and engineering.
Excludes respondents who did not report citizenship. The survey data collection for field of study changed in 2021, which may affect the data comparison across years. This figure uses the trend field taxonomy that facilitates trend data comparisons with prior years; for more information, see the “Data source” section.
Citizenship and sex
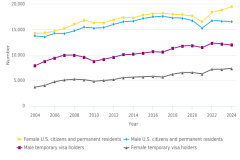
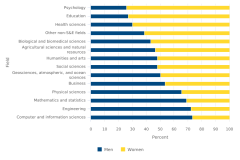
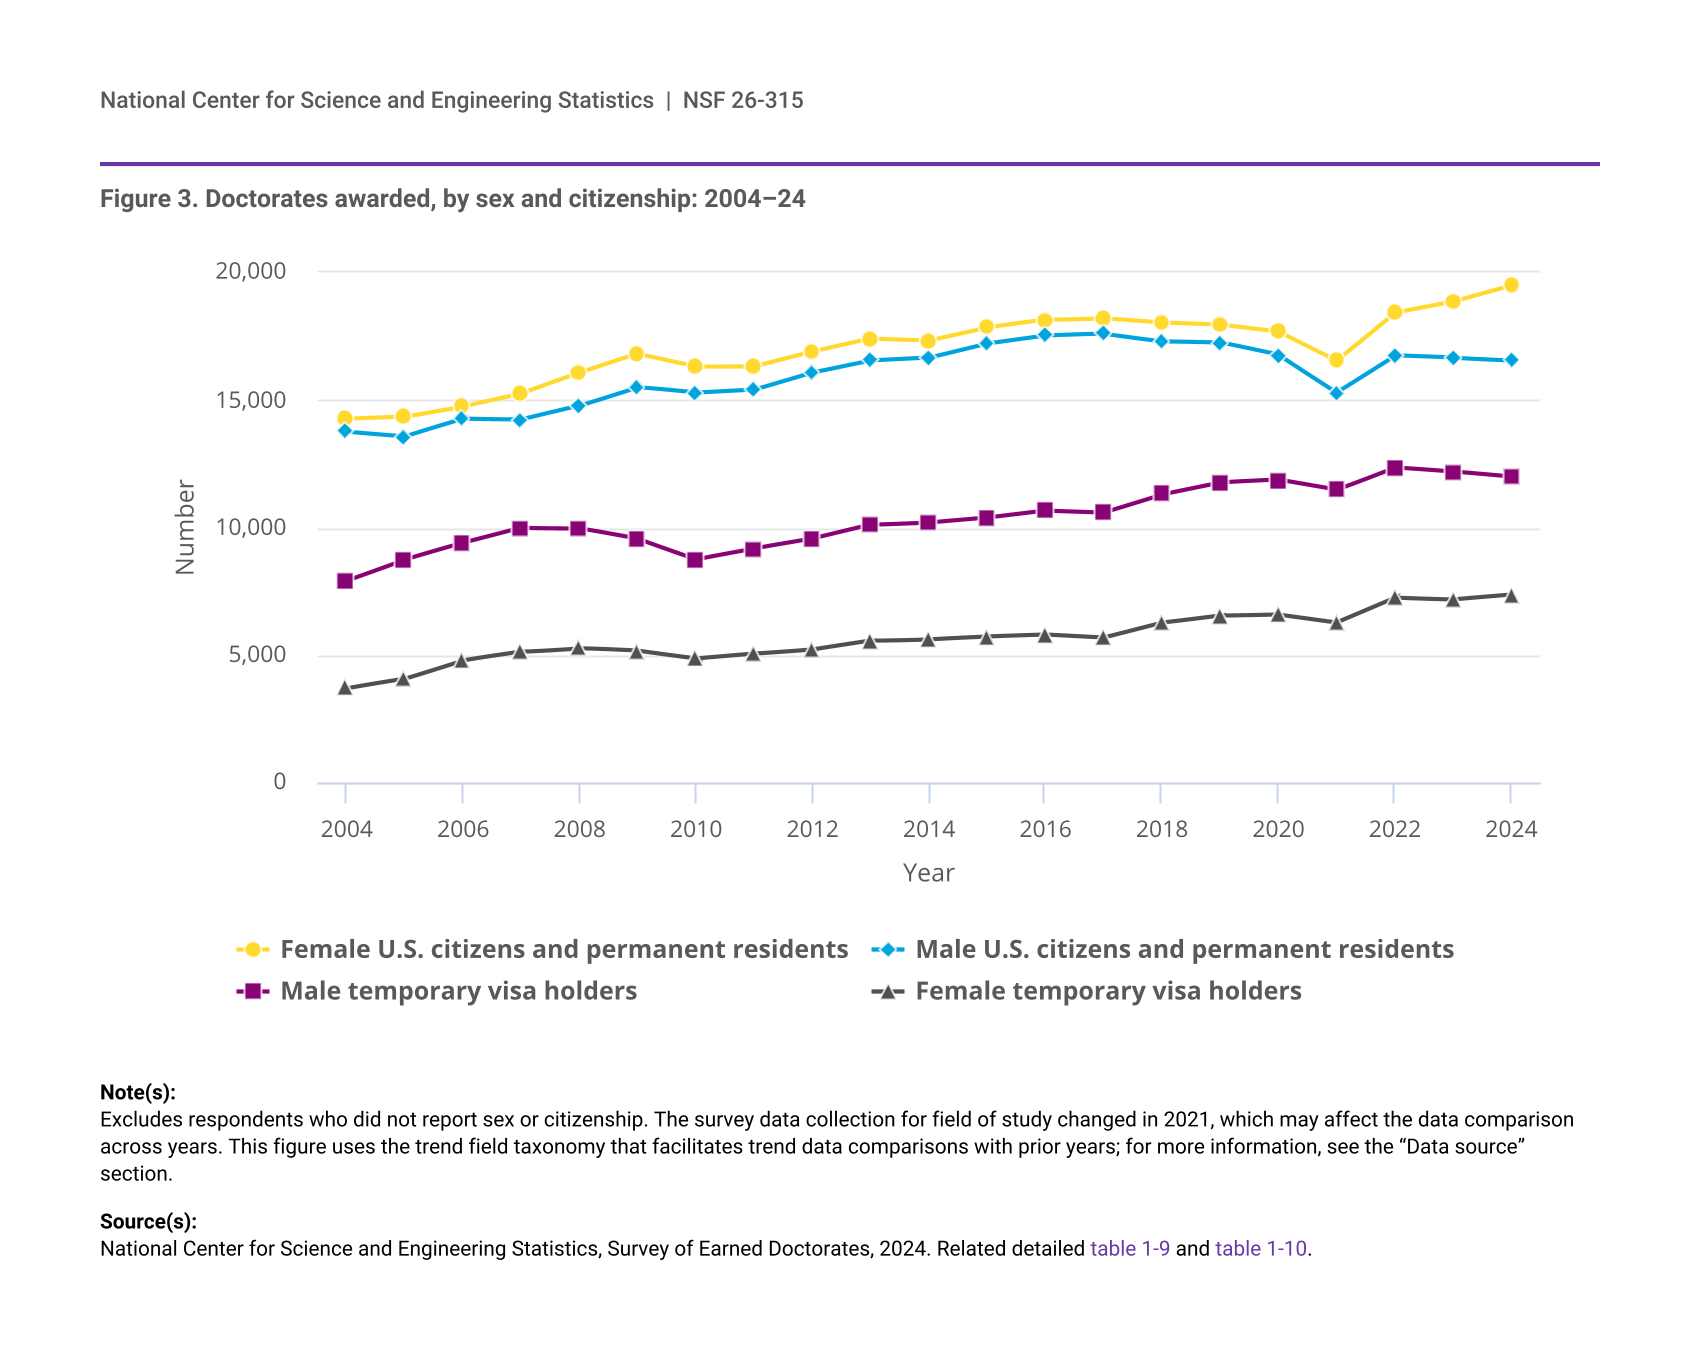
In 2024, women earned 48% of all doctorates awarded by U.S. institutions (up from 45% in 2004), and men earned 52% (down from 55% in 2004) (figure 3). These proportions, however, varied by citizenship. Among U.S. citizens and permanent residents, women earned 54% of doctorates awarded in 2024, while men earned 46%. Among temporary visa holders, men earned 62% of doctorates awarded and women earned 38%.
Between 2004 and 2024, the proportion of women among U.S. citizens and permanent residents earning doctorates increased from 51% to 54%, while the proportion of their male counterparts earning doctorates declined from 49% to 46%. During this period, among temporary visa holders, the proportion of men earning doctorates declined from 68% to 62%, while the proportion of women increased from 32% to 38%. From 2023 to 2024, the number of female doctorate recipients who were U.S. citizens and permanent residents increased by 624, and female temporary visa holders increased by 185. In contrast, during the same period, the number of male doctorate recipients, regardless of citizenship status, decreased, continuing the decline observed between 2022 and 2023.
| Year | Female U.S. citizens and permanent residents | Male U.S. citizens and permanent residents | Male temporary visa holders | Female temporary visa holders |
|---|---|---|---|---|
| 2004 | 14,270 | 13,770 | 7,913 | 3,715 |
| 2005 | 14,357 | 13,586 | 8,749 | 4,079 |
| 2006 | 14,762 | 14,266 | 9,398 | 4,800 |
| 2007 | 15,260 | 14,240 | 9,994 | 5,128 |
| 2008 | 16,069 | 14,774 | 9,984 | 5,277 |
| 2009 | 16,818 | 15,508 | 9,564 | 5,167 |
| 2010 | 16,327 | 15,275 | 8,768 | 4,868 |
| 2011 | 16,329 | 15,396 | 9,179 | 5,056 |
| 2012 | 16,909 | 16,072 | 9,556 | 5,224 |
| 2013 | 17,414 | 16,550 | 10,103 | 5,571 |
| 2014 | 17,343 | 16,660 | 10,204 | 5,633 |
| 2015 | 17,853 | 17,218 | 10,395 | 5,734 |
| 2016 | 18,147 | 17,530 | 10,671 | 5,805 |
| 2017 | 18,211 | 17,602 | 10,601 | 5,686 |
| 2018 | 18,036 | 17,312 | 11,307 | 6,274 |
| 2019 | 17,959 | 17,258 | 11,767 | 6,556 |
| 2020 | 17,689 | 16,769 | 11,868 | 6,605 |
| 2021 | 16,555 | 15,303 | 11,475 | 6,293 |
| 2022 | 18,444 | 16,752 | 12,357 | 7,261 |
| 2023 | 18,875 | 16,656 | 12,191 | 7,198 |
| 2024 | 19,499 | 16,562 | 11,988 | 7,383 |
Excludes respondents who did not report sex or citizenship. The survey data collection for field of study changed in 2021, which may affect the data comparison across years. This figure uses the trend field taxonomy that facilitates trend data comparisons with prior years; for more information, see the “Data source” section.
National Center for Science and Engineering Statistics, Survey of Earned Doctorates, 2024. Related detailed table 1-9 and table 1-10.
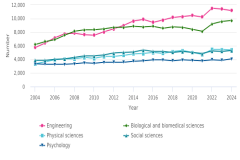
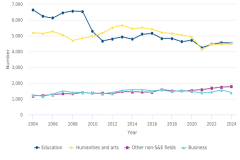
Sex and field
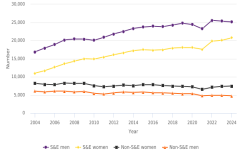
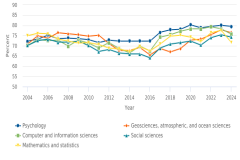
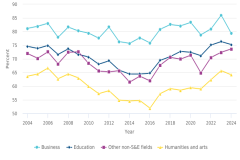
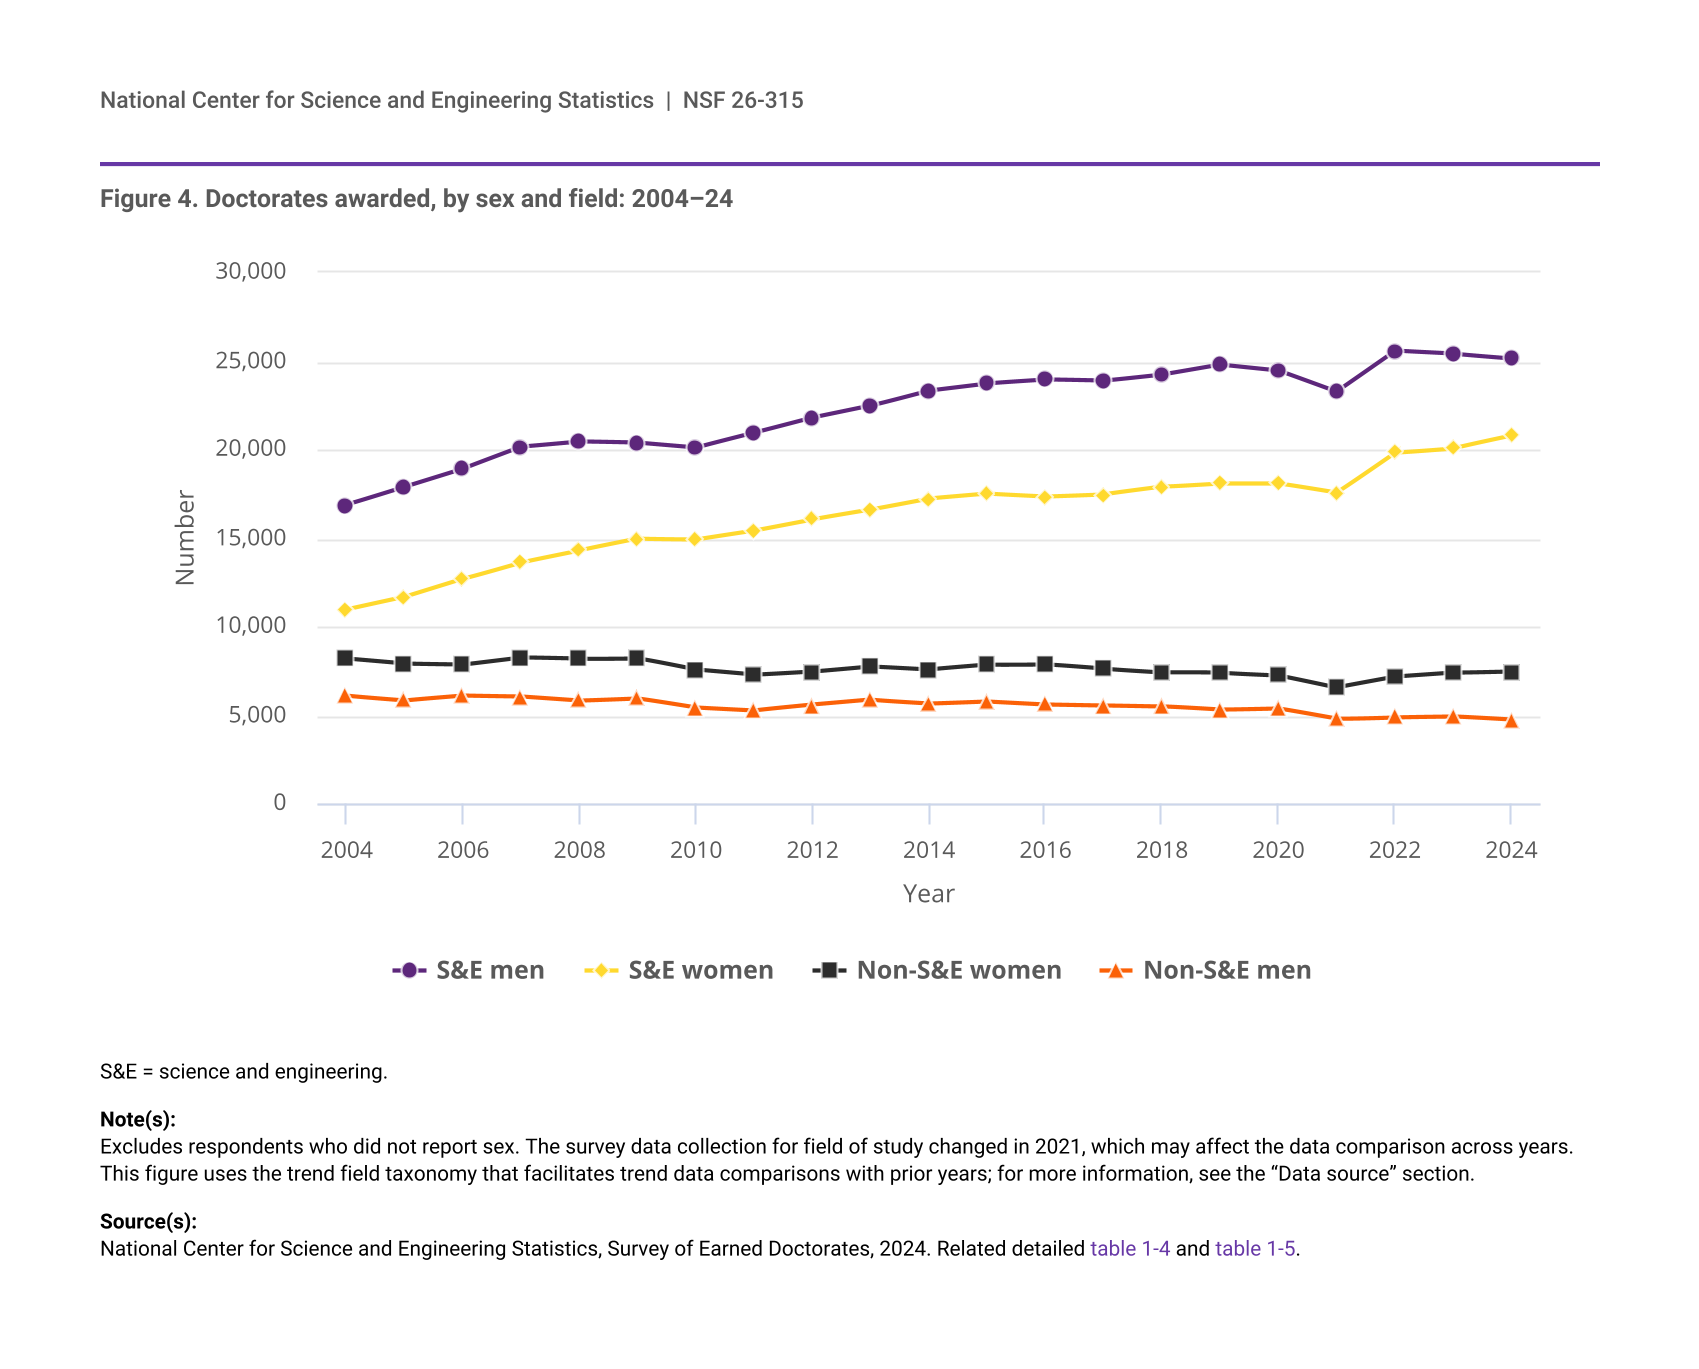
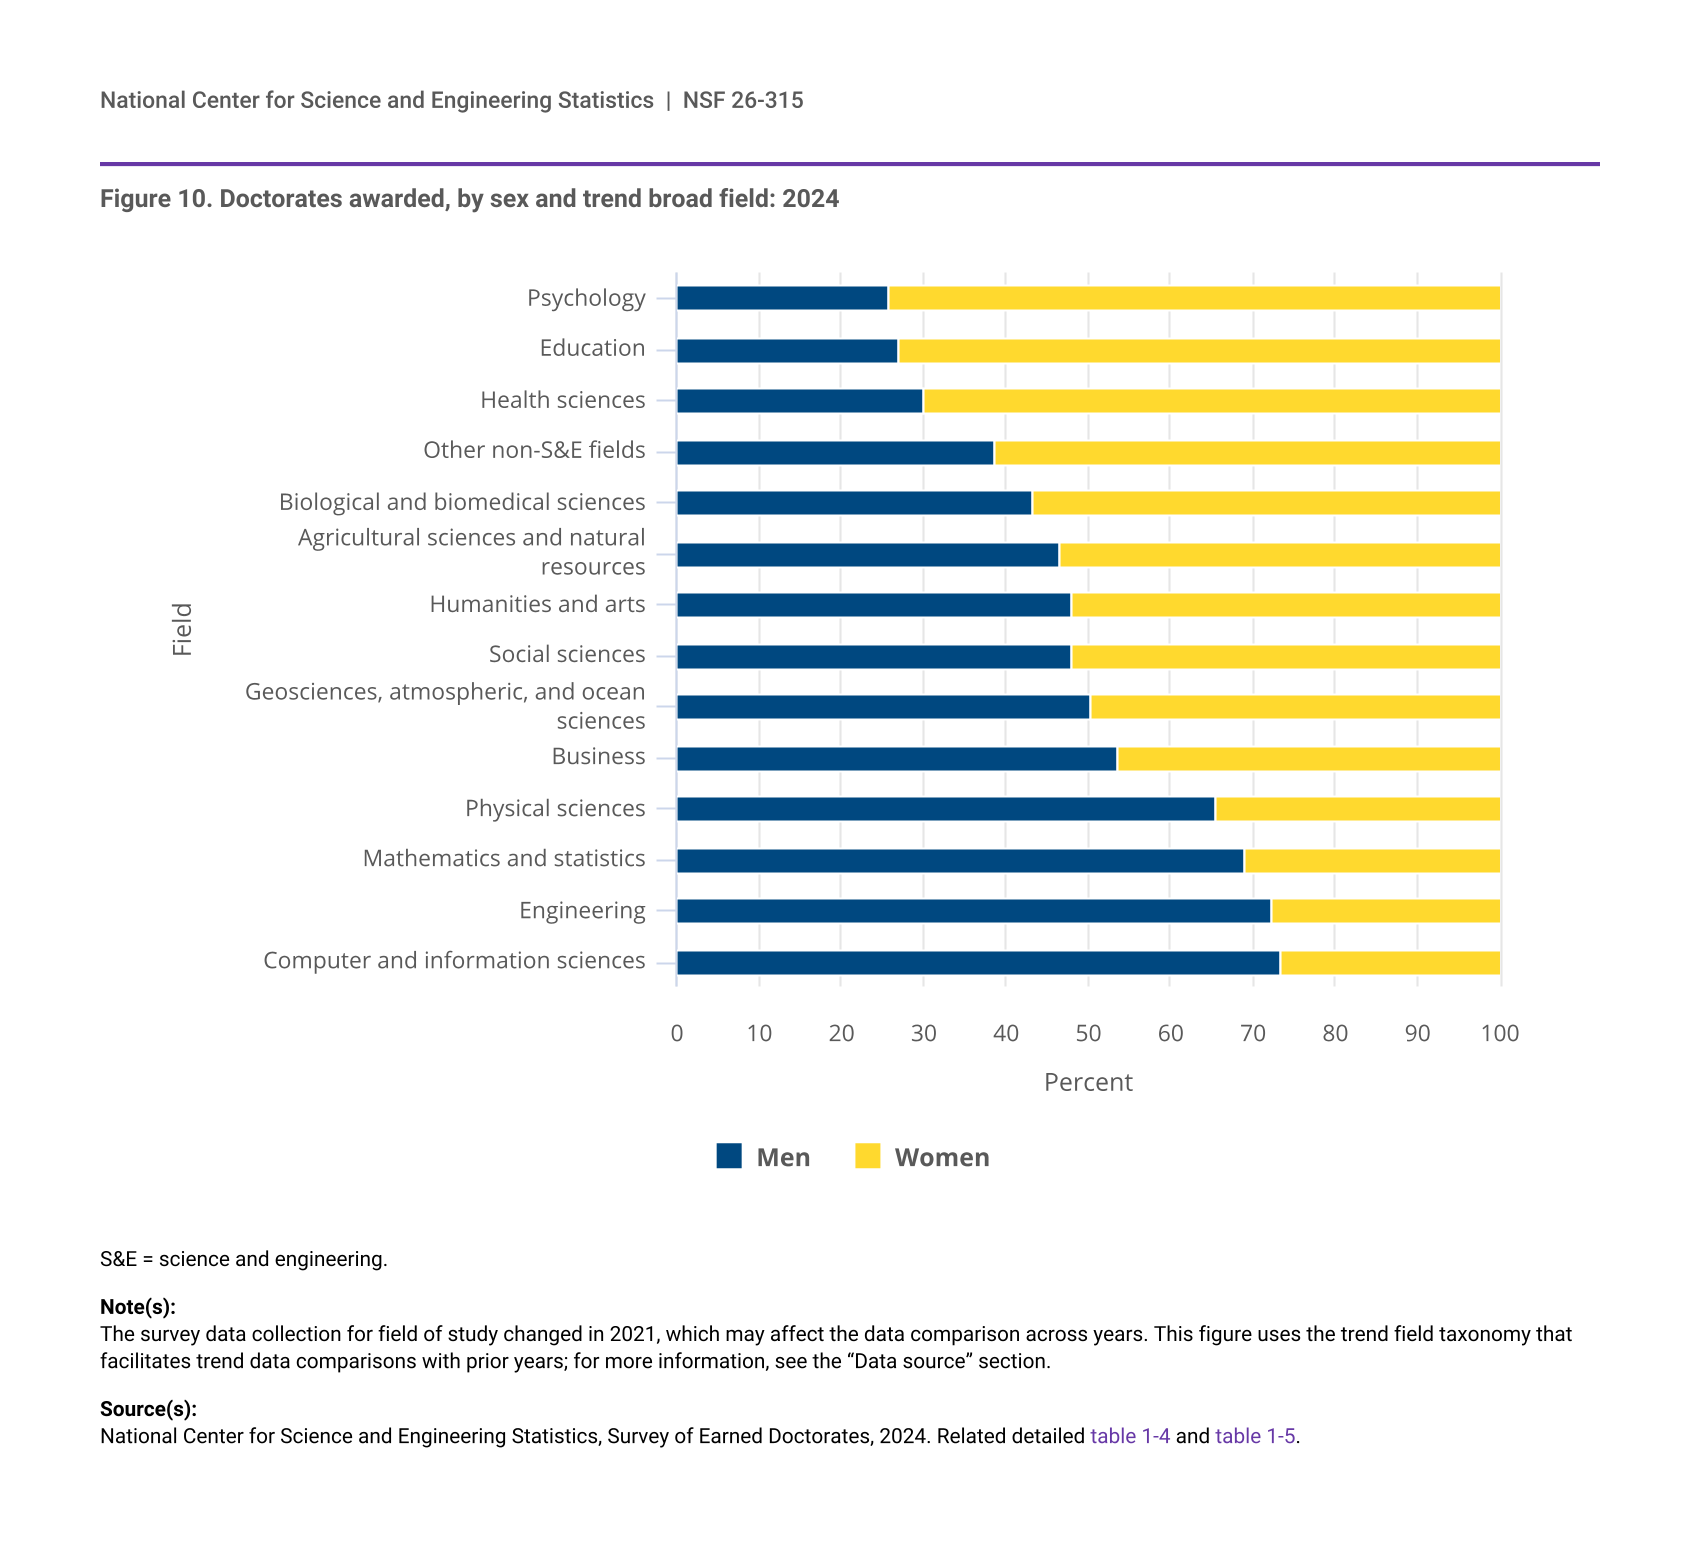
In the past 20 years, all of the growth in the number of doctorates earned by both men and women has been in S&E fields (figure 4). During this period, the number of female doctorate recipients in S&E fields increased by 89% (from 10,969 in 2004 to 20,782 in 2024), compared with a 49% increase in the number of male S&E doctorate recipients (from 16,872 in 2004 to 25,146 in 2024). The proportion of female doctorate recipients in S&E increased from 39% in 2004 to 42% in 2009, remained fairly stable through 2019, and increased to 45% by 2024. While the proportion of female doctorate recipients in non-S&E fields has always been higher than that in S&E fields, the proportion of women earning non-S&E doctorates hovered at about 58% through 2021 and grew to 61% by 2024. In the past 20 years, the number of doctorates in non-S&E fields awarded to men declined by 22% (from 6,093 in 2004 to 4,739 in 2024), and the number awarded to women declined by 9% (from 8,186 to 7,463).
| Year | S&E men | S&E women | Non-S&E women | Non-S&E men |
|---|---|---|---|---|
| 2004 | 16,872 | 10,969 | 8,186 | 6,093 |
| 2005 | 17,896 | 11,681 | 7,901 | 5,841 |
| 2006 | 18,917 | 12,701 | 7,858 | 6,103 |
| 2007 | 20,147 | 13,646 | 8,258 | 6,055 |
| 2008 | 20,447 | 14,309 | 8,185 | 5,824 |
| 2009 | 20,377 | 14,962 | 8,225 | 5,954 |
| 2010 | 20,102 | 14,931 | 7,557 | 5,422 |
| 2011 | 20,931 | 15,429 | 7,270 | 5,257 |
| 2012 | 21,790 | 16,061 | 7,465 | 5,572 |
| 2013 | 22,471 | 16,603 | 7,762 | 5,855 |
| 2014 | 23,341 | 17,228 | 7,585 | 5,667 |
| 2015 | 23,741 | 17,501 | 7,846 | 5,791 |
| 2016 | 23,949 | 17,346 | 7,876 | 5,623 |
| 2017 | 23,877 | 17,470 | 7,616 | 5,565 |
| 2018 | 24,239 | 17,886 | 7,422 | 5,502 |
| 2019 | 24,801 | 18,088 | 7,395 | 5,304 |
| 2020 | 24,467 | 18,089 | 7,261 | 5,377 |
| 2021 | 23,262 | 17,548 | 6,557 | 4,782 |
| 2022 | 25,563 | 19,829 | 7,154 | 4,888 |
| 2023 | 25,403 | 20,084 | 7,383 | 4,929 |
| 2024 | 25,146 | 20,782 | 7,463 | 4,739 |
S&E = science and engineering.
Excludes respondents who did not report sex. The survey data collection for field of study changed in 2021, which may affect the data comparison across years. This figure uses the trend field taxonomy that facilitates trend data comparisons with prior years; for more information, see the “Data source” section.
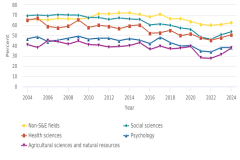
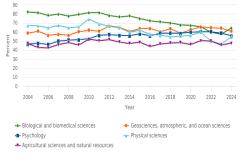
Race and ethnicity
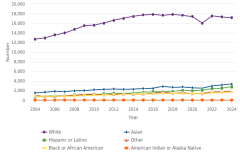
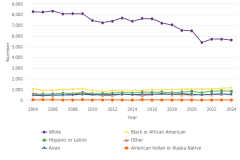
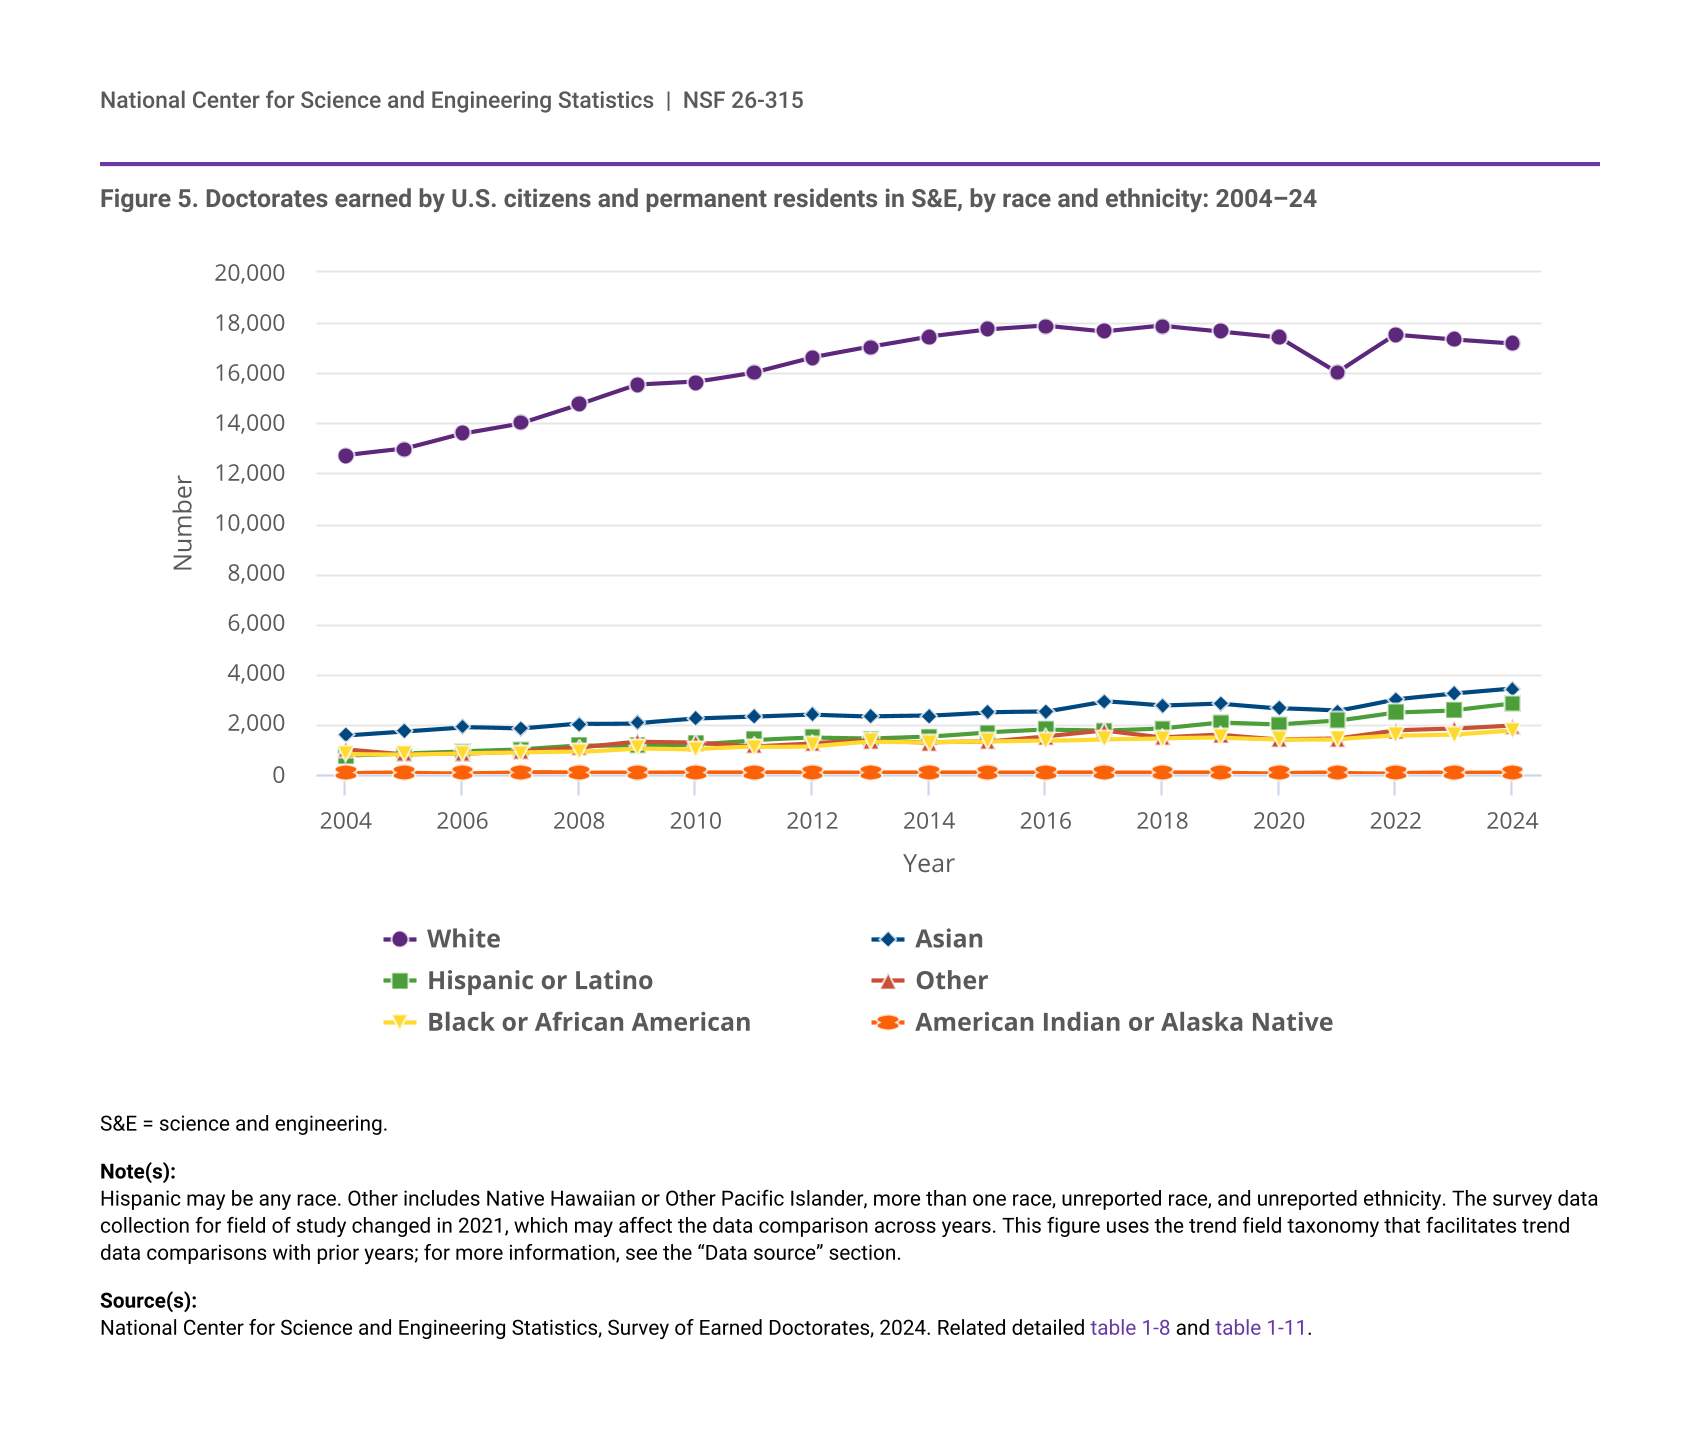
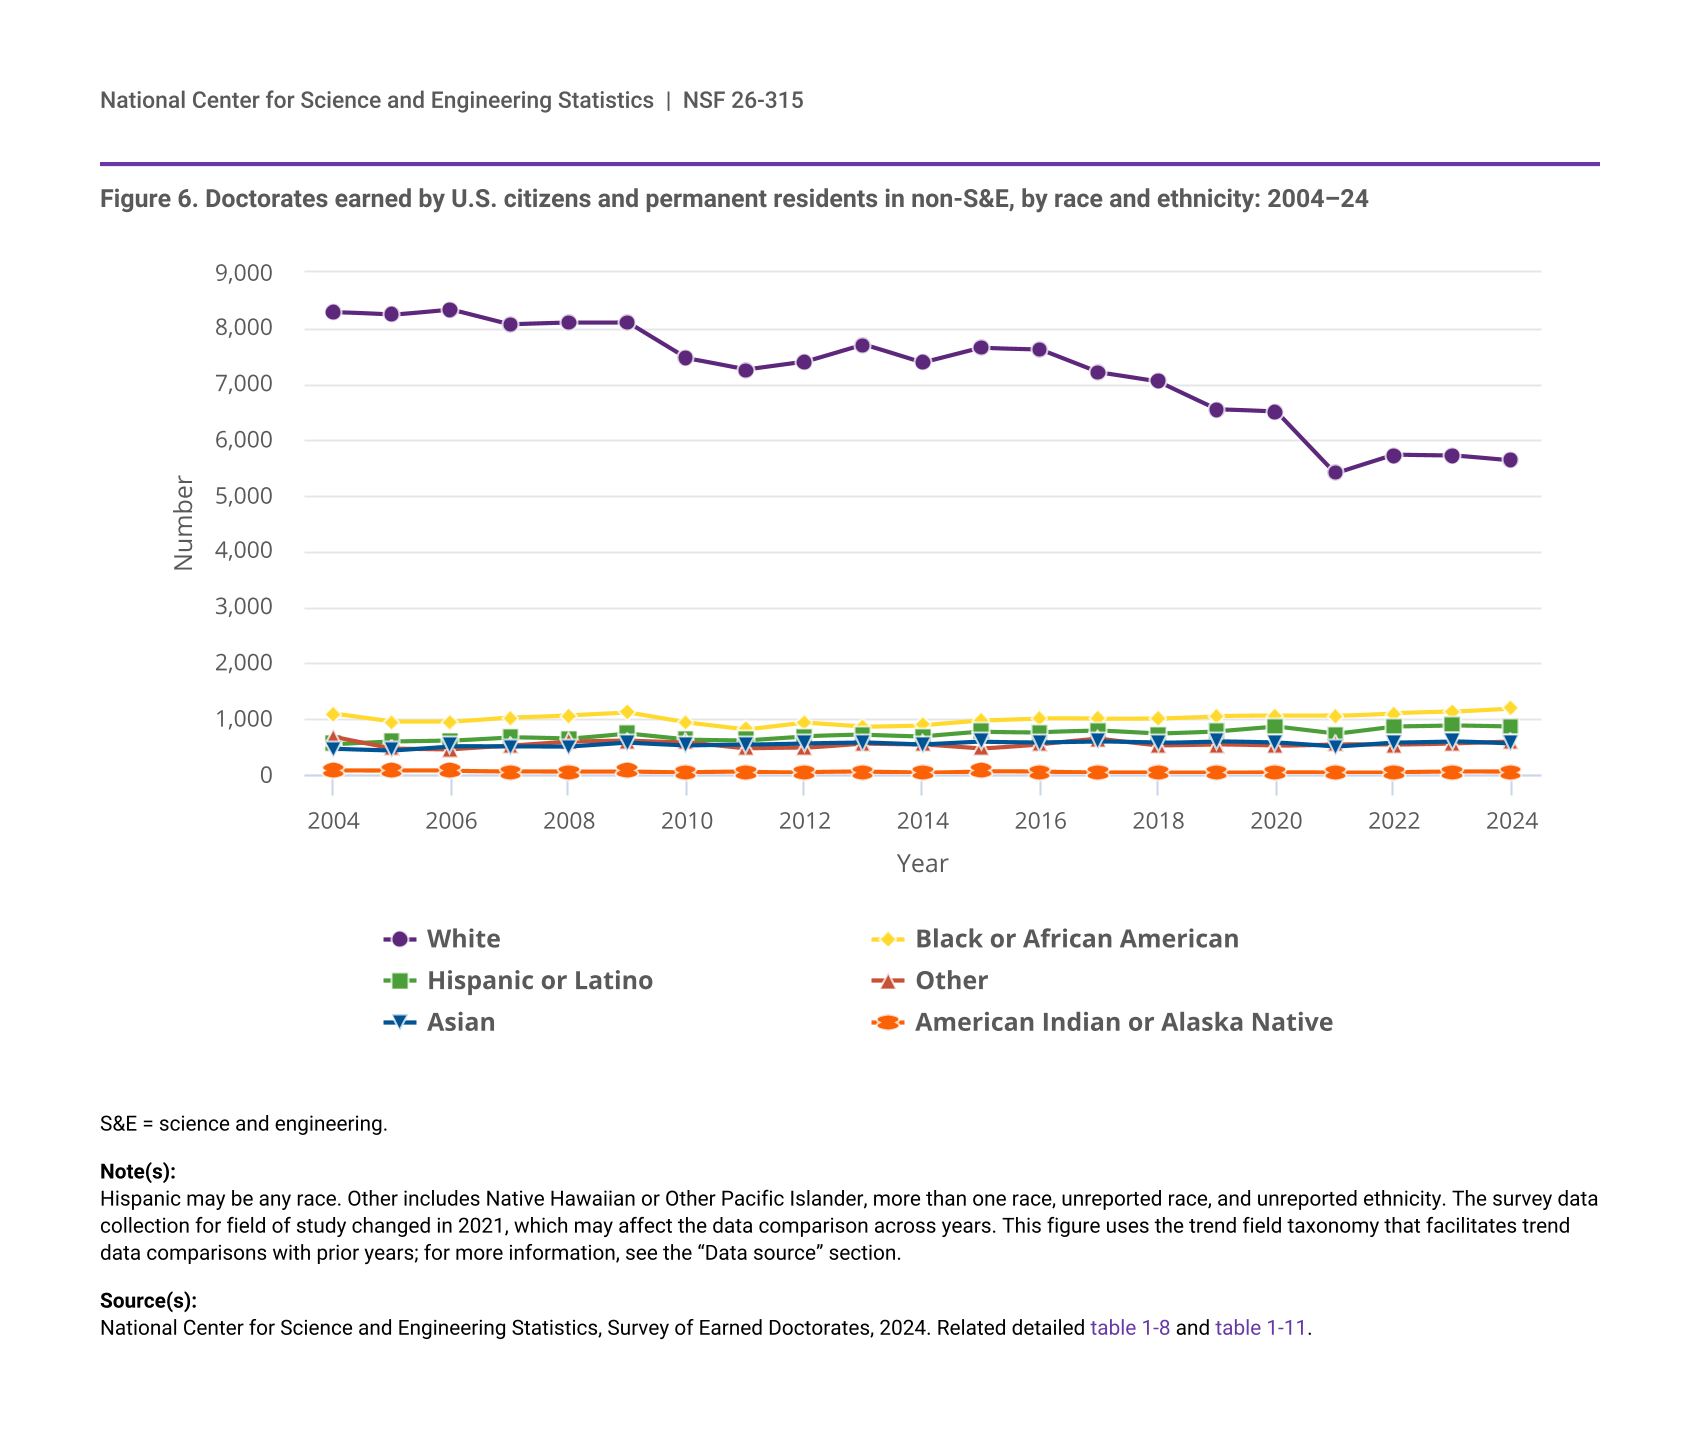
While the overall number of doctorates earned by U.S. citizens and permanent residents has increased between 2004 and 2024, the rate of growth, or in some cases decline, varied across racial and ethnic groups. In S&E and in non-S&E fields, the proportion of Asian, Hispanic or Latino, and Black or African American doctorate recipients among U.S. citizens and permanent residents increased, while the proportion of White and American Indian or Alaska Native doctorate recipients declined (figure 5 and figure 6). From 2004 to 2024, the proportion of S&E doctorates earned by White U.S. citizens and permanent residents declined from 75% to 63%, and the proportion earned by Asian U.S. citizens and permanent residents increased from 9% to 13% (figure 5). In the past 20 years among U.S. citizens and permanent residents awarded S&E doctorates, the number of Hispanic or Latino doctorate recipients increased from 757 (4%) to 2,823 (10%) and the number of Black or African American doctorate recipients increased from 812 (5%) in 2004 to 1,754 (6%) in 2024. The 2024 number of S&E doctorates awarded to Hispanic or Latino and Black or African American recipients represented the highest number for each group over the last 2 decades. In the same period, the number of American Indian or Alaska Native doctorate recipients in S&E among U.S. citizens and permanent residents fluctuated between 50 and 86. Between 2023 and 2024, S&E doctorates awarded to American Indians or Alaska Natives increased from 66 to 81, remaining under 0.5% of S&E doctorates awarded.
| Year | White | Asian | Hispanic or Latino | Other | Black or African American | American Indian or Alaska Native |
|---|---|---|---|---|---|---|
| 2004 | 12,722 | 1,564 | 757 | 1,009 | 812 | 57 |
| 2005 | 12,971 | 1,724 | 846 | 800 | 800 | 70 |
| 2006 | 13,586 | 1,886 | 925 | 828 | 846 | 50 |
| 2007 | 13,998 | 1,814 | 989 | 924 | 868 | 86 |
| 2008 | 14,738 | 2,014 | 1,135 | 1,060 | 898 | 62 |
| 2009 | 15,517 | 2,046 | 1,145 | 1,307 | 1,056 | 75 |
| 2010 | 15,640 | 2,219 | 1,213 | 1,285 | 1,009 | 78 |
| 2011 | 16,025 | 2,298 | 1,372 | 1,132 | 1,095 | 78 |
| 2012 | 16,615 | 2,386 | 1,459 | 1,247 | 1,126 | 61 |
| 2013 | 17,038 | 2,320 | 1,425 | 1,336 | 1,313 | 71 |
| 2014 | 17,449 | 2,349 | 1,508 | 1,282 | 1,285 | 70 |
| 2015 | 17,724 | 2,487 | 1,681 | 1,301 | 1,307 | 71 |
| 2016 | 17,876 | 2,508 | 1,788 | 1,514 | 1,351 | 75 |
| 2017 | 17,650 | 2,921 | 1,757 | 1,739 | 1,410 | 69 |
| 2018 | 17,877 | 2,733 | 1,845 | 1,464 | 1,441 | 76 |
| 2019 | 17,658 | 2,818 | 2,078 | 1,577 | 1,465 | 77 |
| 2020 | 17,419 | 2,638 | 1,998 | 1,406 | 1,404 | 54 |
| 2021 | 16,023 | 2,531 | 2,147 | 1,436 | 1,407 | 64 |
| 2022 | 17,511 | 3,005 | 2,485 | 1,757 | 1,536 | 58 |
| 2023 | 17,329 | 3,231 | 2,565 | 1,822 | 1,591 | 66 |
| 2024 | 17,170 | 3,428 | 2,823 | 1,948 | 1,754 | 81 |
S&E = science and engineering.
Hispanic may be any race. Other includes Native Hawaiian or Other Pacific Islander, more than one race, unreported race, and unreported ethnicity. The survey data collection for field of study changed in 2021, which may affect the data comparison across years. This figure uses the trend field taxonomy that facilitates trend data comparisons with prior years; for more information, see the “Data source” section.
National Center for Science and Engineering Statistics, Survey of Earned Doctorates, 2024. Related detailed table 1-8 and table 1-11.
| Year | White | Black or African American | Hispanic or Latino | Other | Asian | American Indian or Alaska Native |
|---|---|---|---|---|---|---|
| 2004 | 8,289 | 1,085 | 545 | 674 | 458 | 68 |
| 2005 | 8,237 | 941 | 589 | 469 | 431 | 67 |
| 2006 | 8,337 | 943 | 607 | 452 | 505 | 63 |
| 2007 | 8,069 | 1,023 | 666 | 516 | 494 | 54 |
| 2008 | 8,097 | 1,063 | 638 | 593 | 493 | 53 |
| 2009 | 8,099 | 1,112 | 735 | 612 | 566 | 57 |
| 2010 | 7,460 | 930 | 629 | 581 | 519 | 39 |
| 2011 | 7,253 | 804 | 617 | 468 | 534 | 49 |
| 2012 | 7,395 | 929 | 685 | 478 | 557 | 43 |
| 2013 | 7,711 | 859 | 710 | 561 | 572 | 48 |
| 2014 | 7,380 | 887 | 682 | 546 | 532 | 33 |
| 2015 | 7,651 | 968 | 768 | 468 | 585 | 60 |
| 2016 | 7,626 | 1,007 | 760 | 544 | 576 | 53 |
| 2017 | 7,214 | 1,000 | 783 | 639 | 592 | 40 |
| 2018 | 7,047 | 1,008 | 727 | 523 | 569 | 39 |
| 2019 | 6,551 | 1,046 | 766 | 540 | 600 | 42 |
| 2020 | 6,506 | 1,049 | 852 | 515 | 574 | 43 |
| 2021 | 5,400 | 1,051 | 726 | 542 | 497 | 36 |
| 2022 | 5,732 | 1,101 | 863 | 538 | 575 | 40 |
| 2023 | 5,719 | 1,123 | 881 | 561 | 598 | 49 |
| 2024 | 5,623 | 1,182 | 859 | 594 | 552 | 48 |
S&E = science and engineering.
Hispanic may be any race. Other includes Native Hawaiian or Other Pacific Islander, more than one race, unreported race, and unreported ethnicity. The survey data collection for field of study changed in 2021, which may affect the data comparison across years. This figure uses the trend field taxonomy that facilitates trend data comparisons with prior years; for more information, see the “Data source” section.
National Center for Science and Engineering Statistics, Survey of Earned Doctorates, 2024. Related detailed table 1-8 and table 1-11.