 An official website of the United States government
 Executive Summary
Overall R&D Scale and Growth
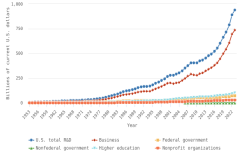
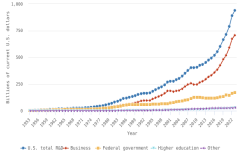
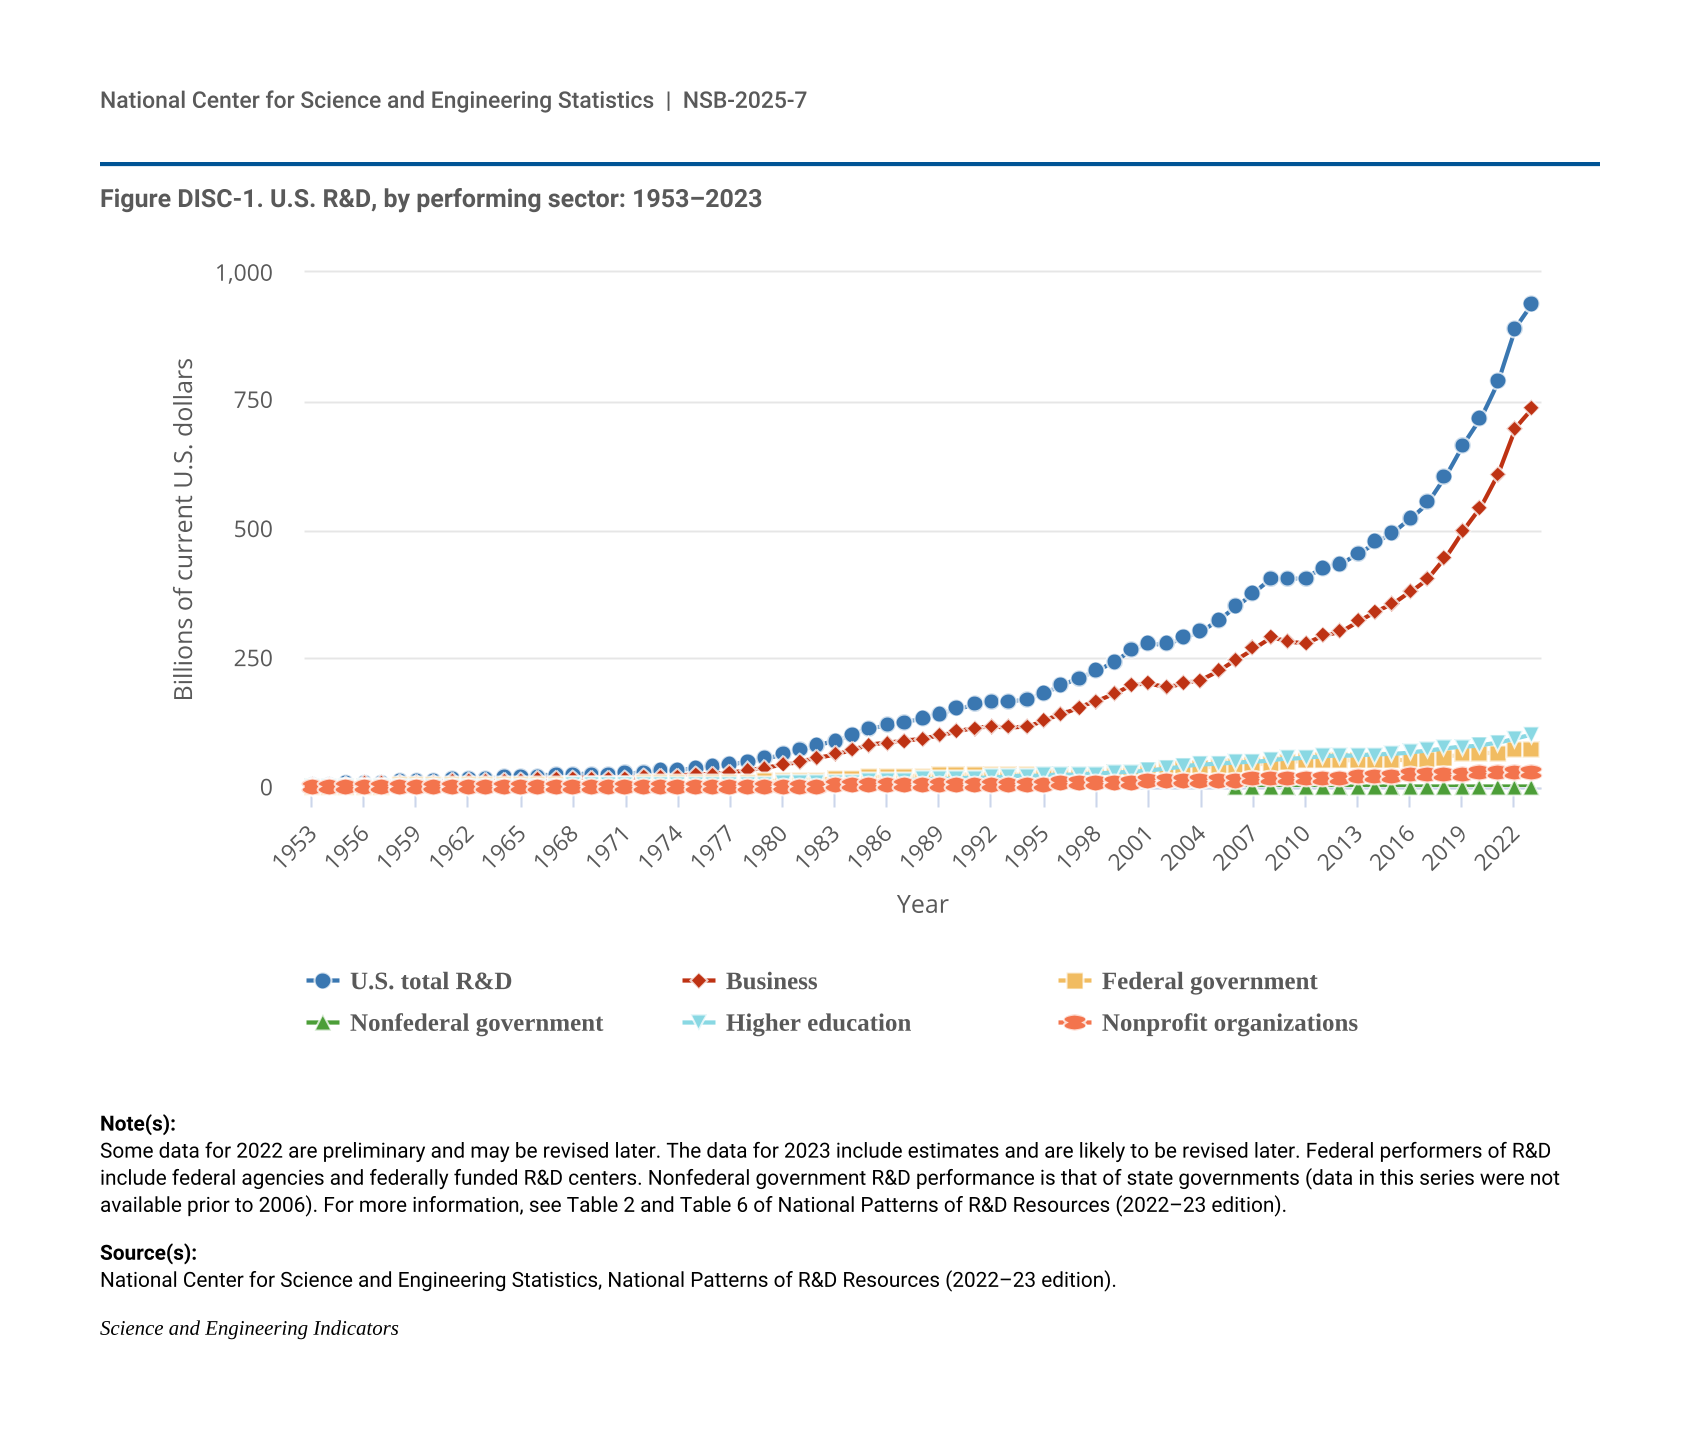
The United States maintained a large and expanding research and experimental development (R&D) enterprise in 2023, with total R&D expenditures reaching $940 billion. The United States had the largest national R&D investment in 2022 using internationally comparable data.
- In 2023, the United States performed an estimated $940 billion in R&D across all sectors of the economy, up from $892 billion in 2022 in current (nominal) U.S. dollars, an increase of 5% (2% in constant, or inflation-adjusted, 2017 U.S. dollars).
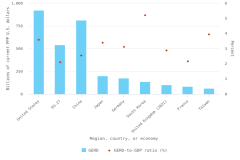
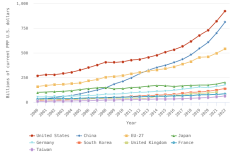
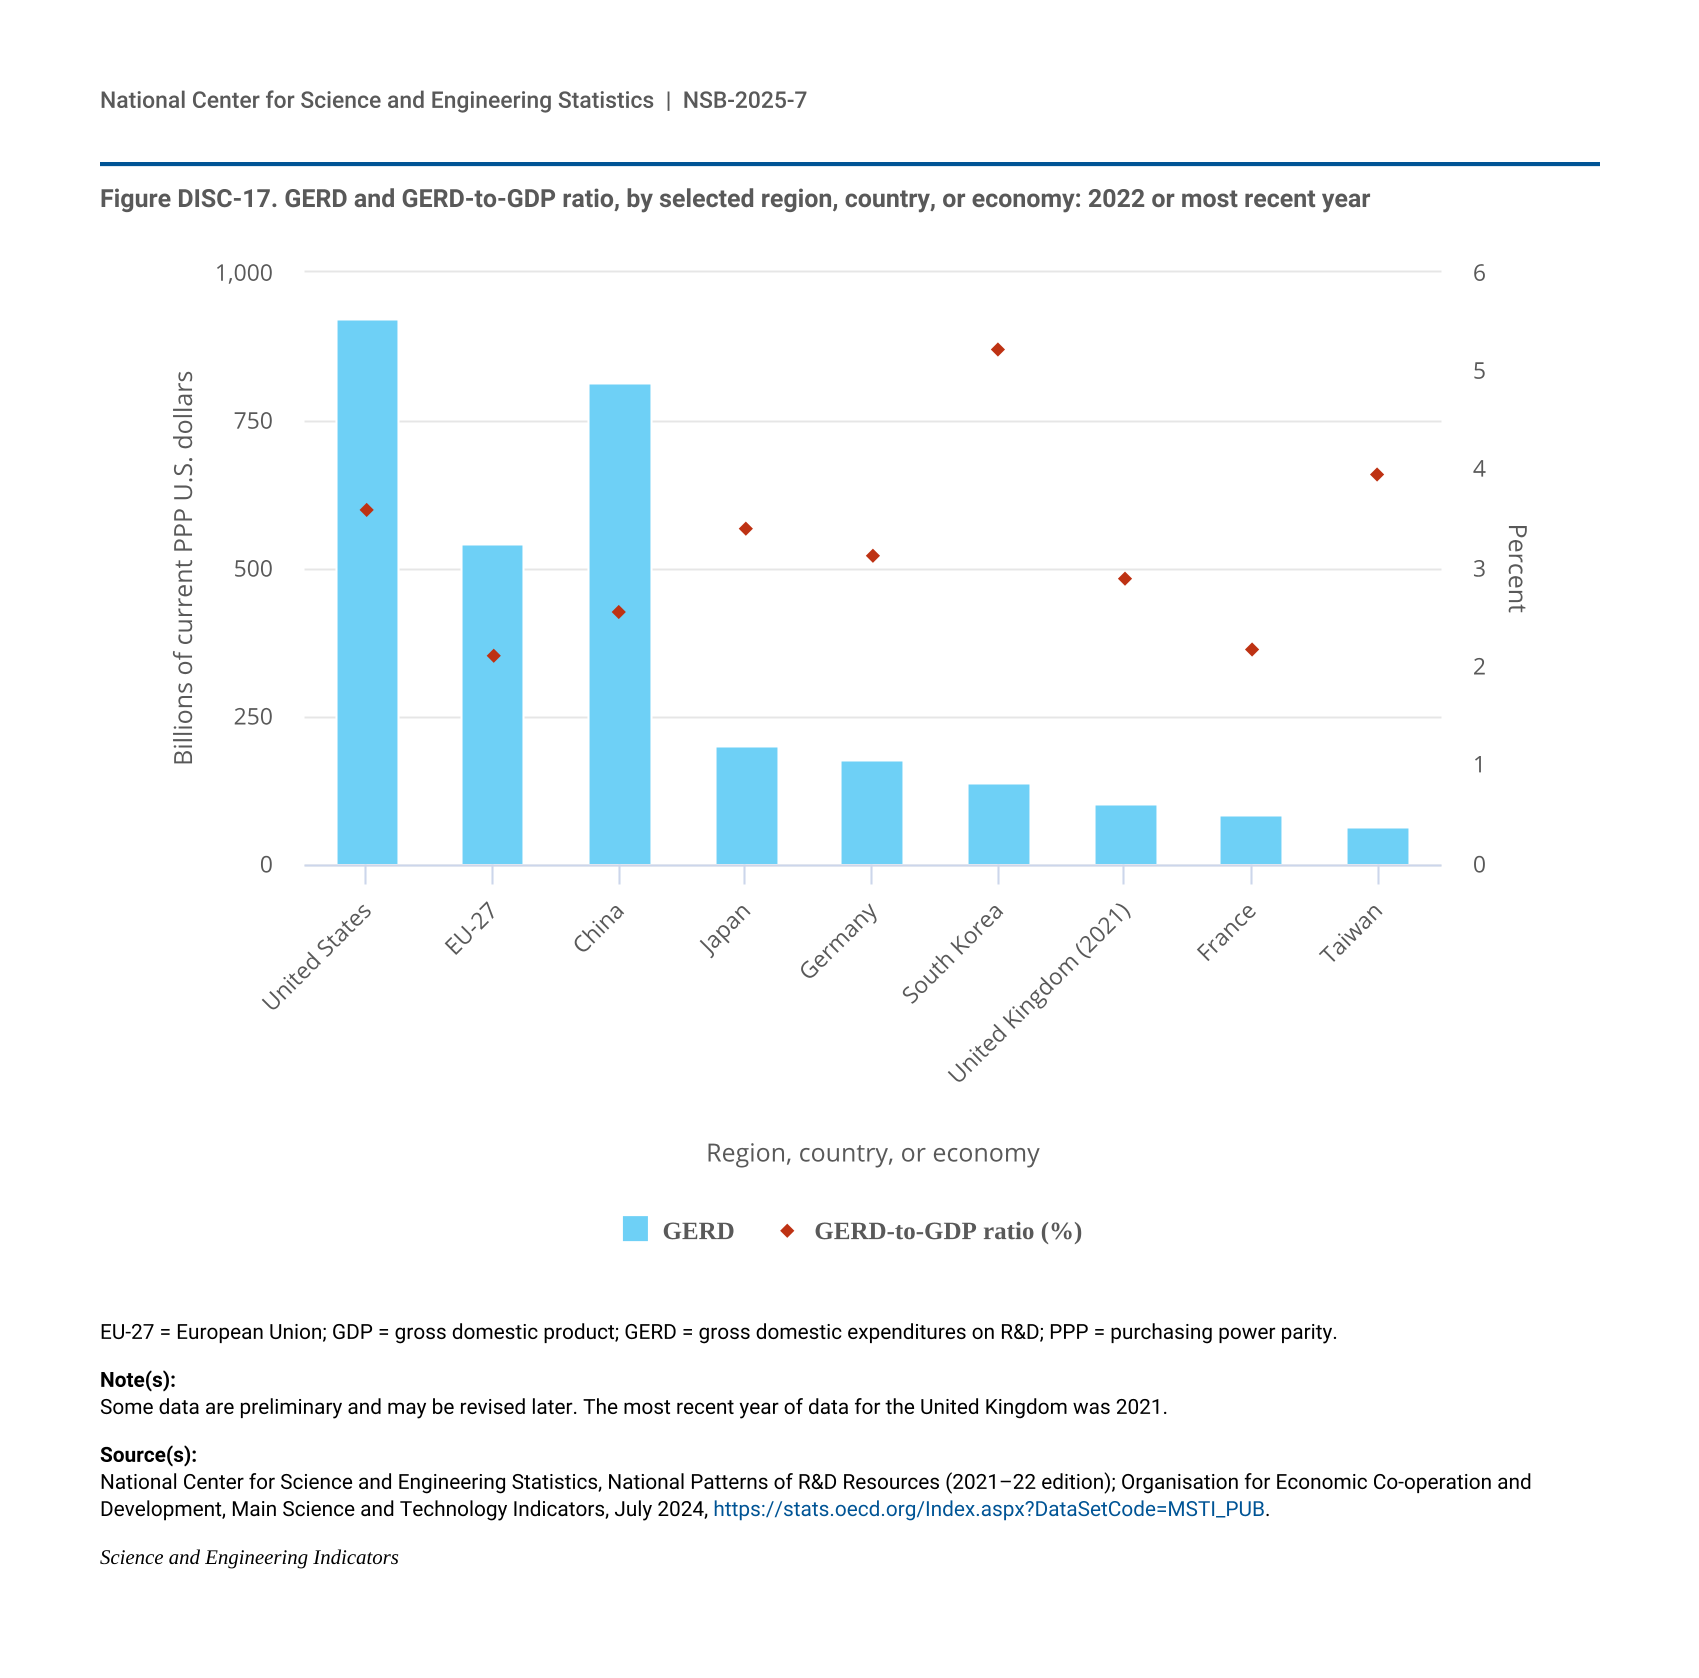
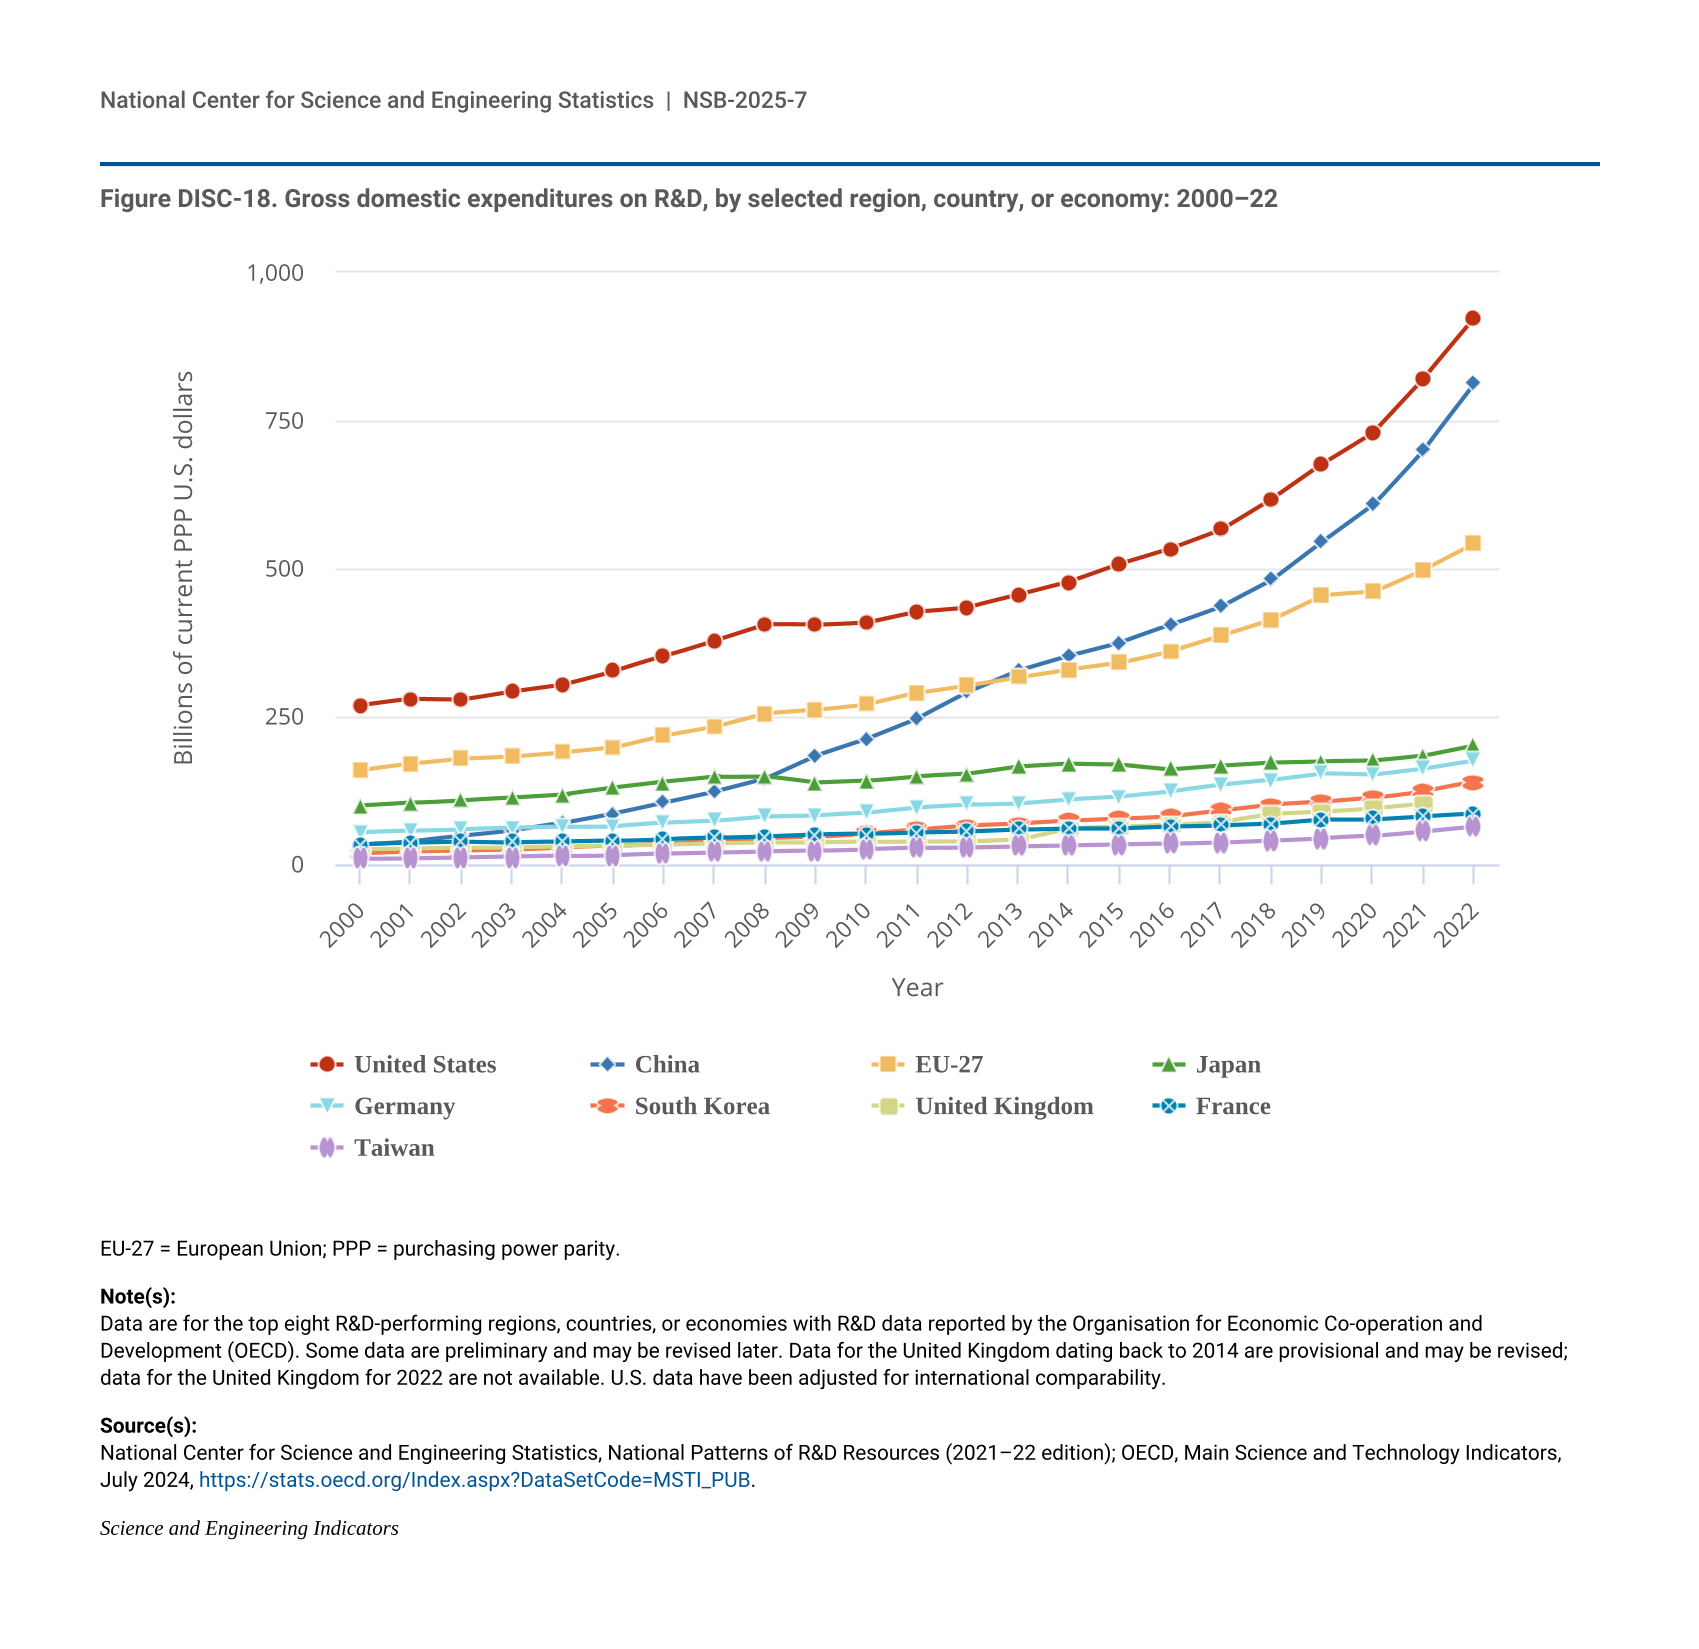
- When adjusted for international comparability, the United States had $923 billion in gross domestic expenditures on R&D (GERD) in 2022, up 12% in current purchasing power parity (PPP) dollars from 2021. China recorded the second-highest GERD at $812 billion, up 16% in current PPP dollars from 2021.
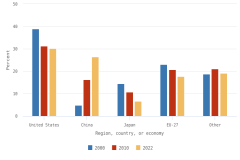
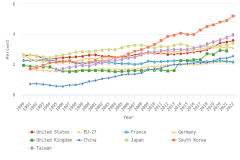
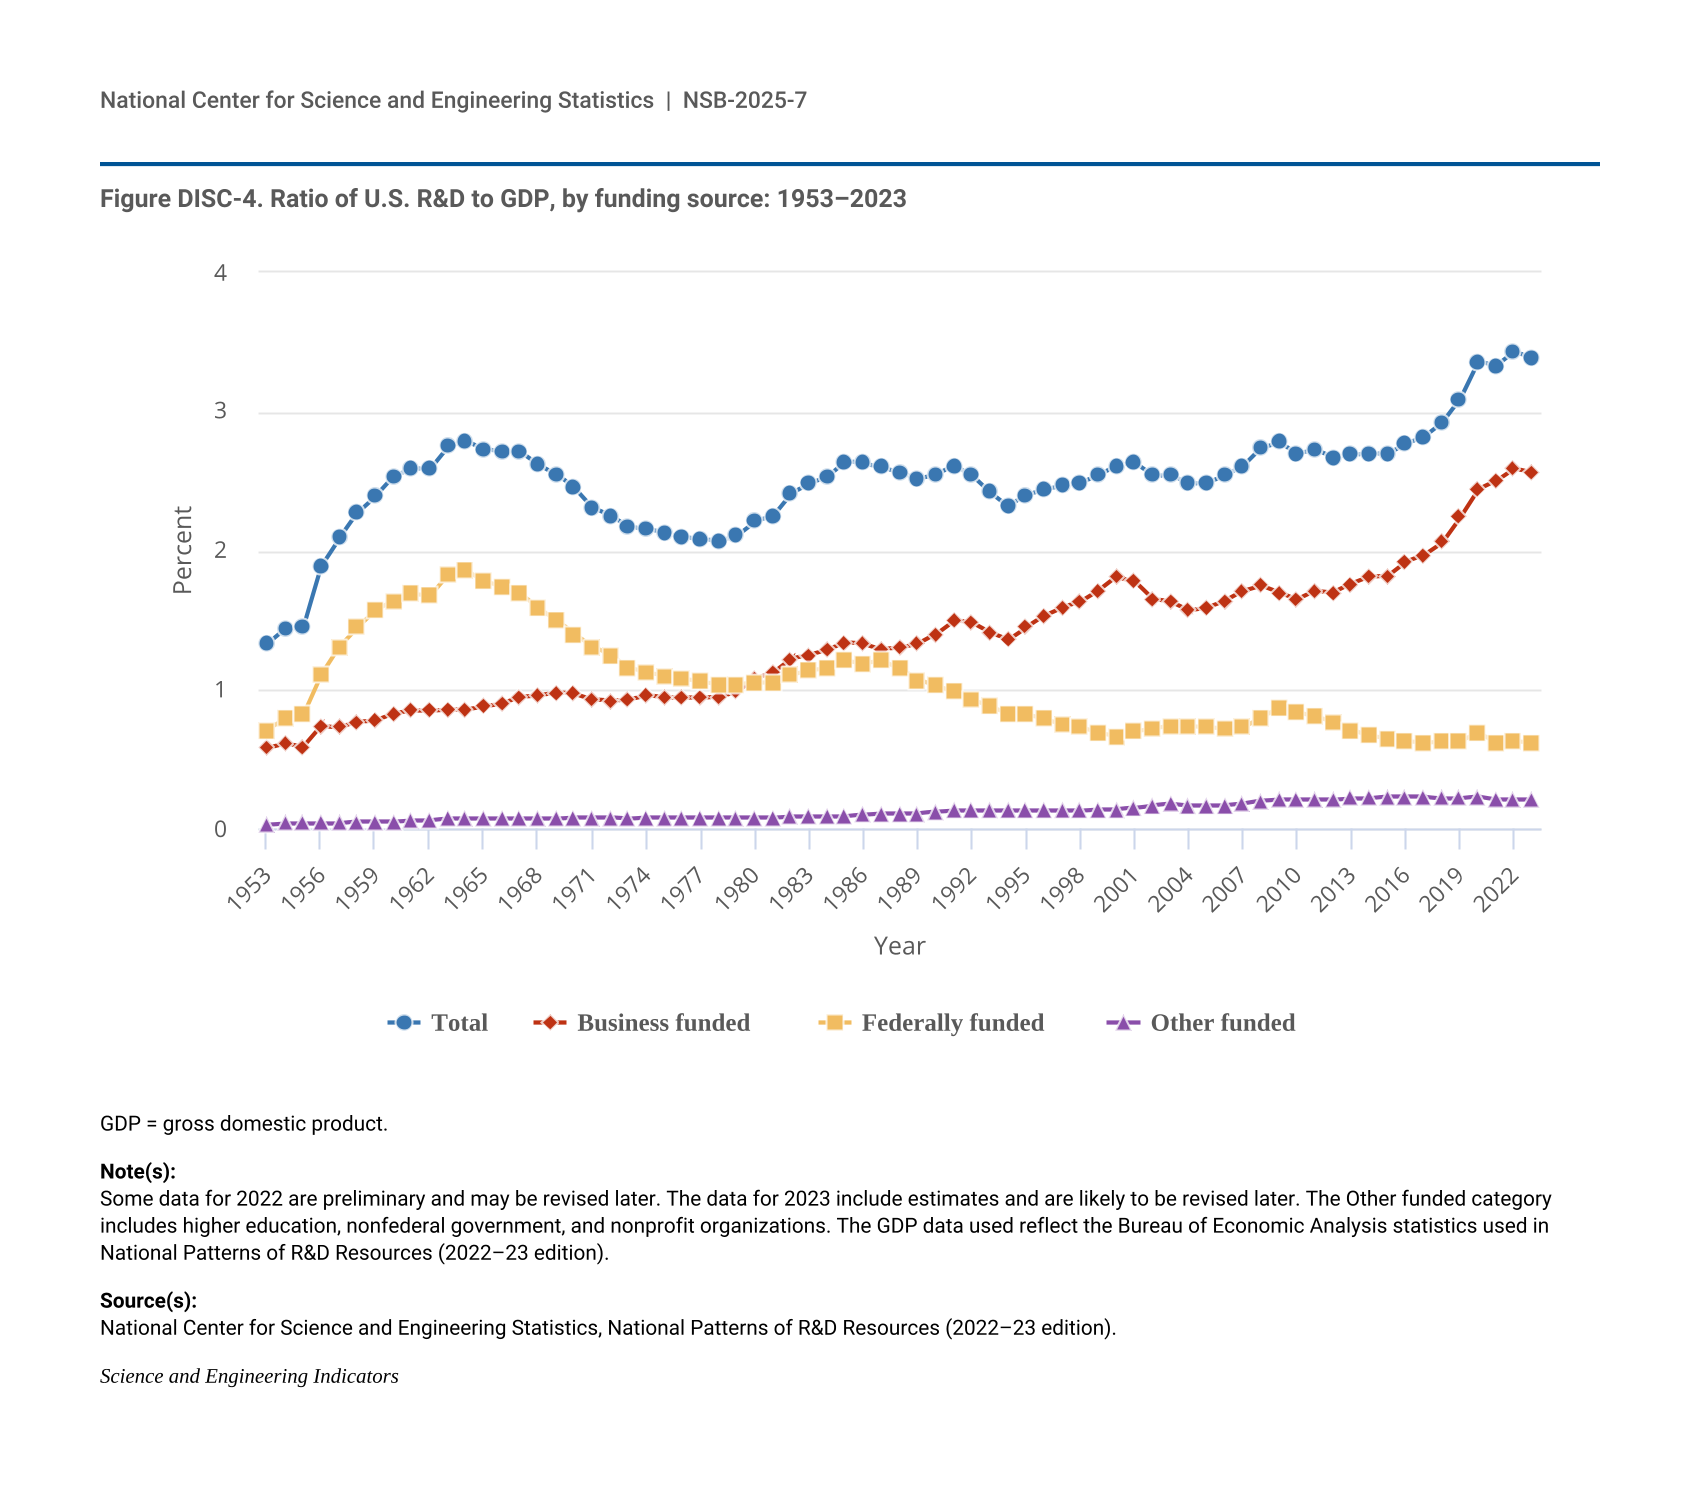
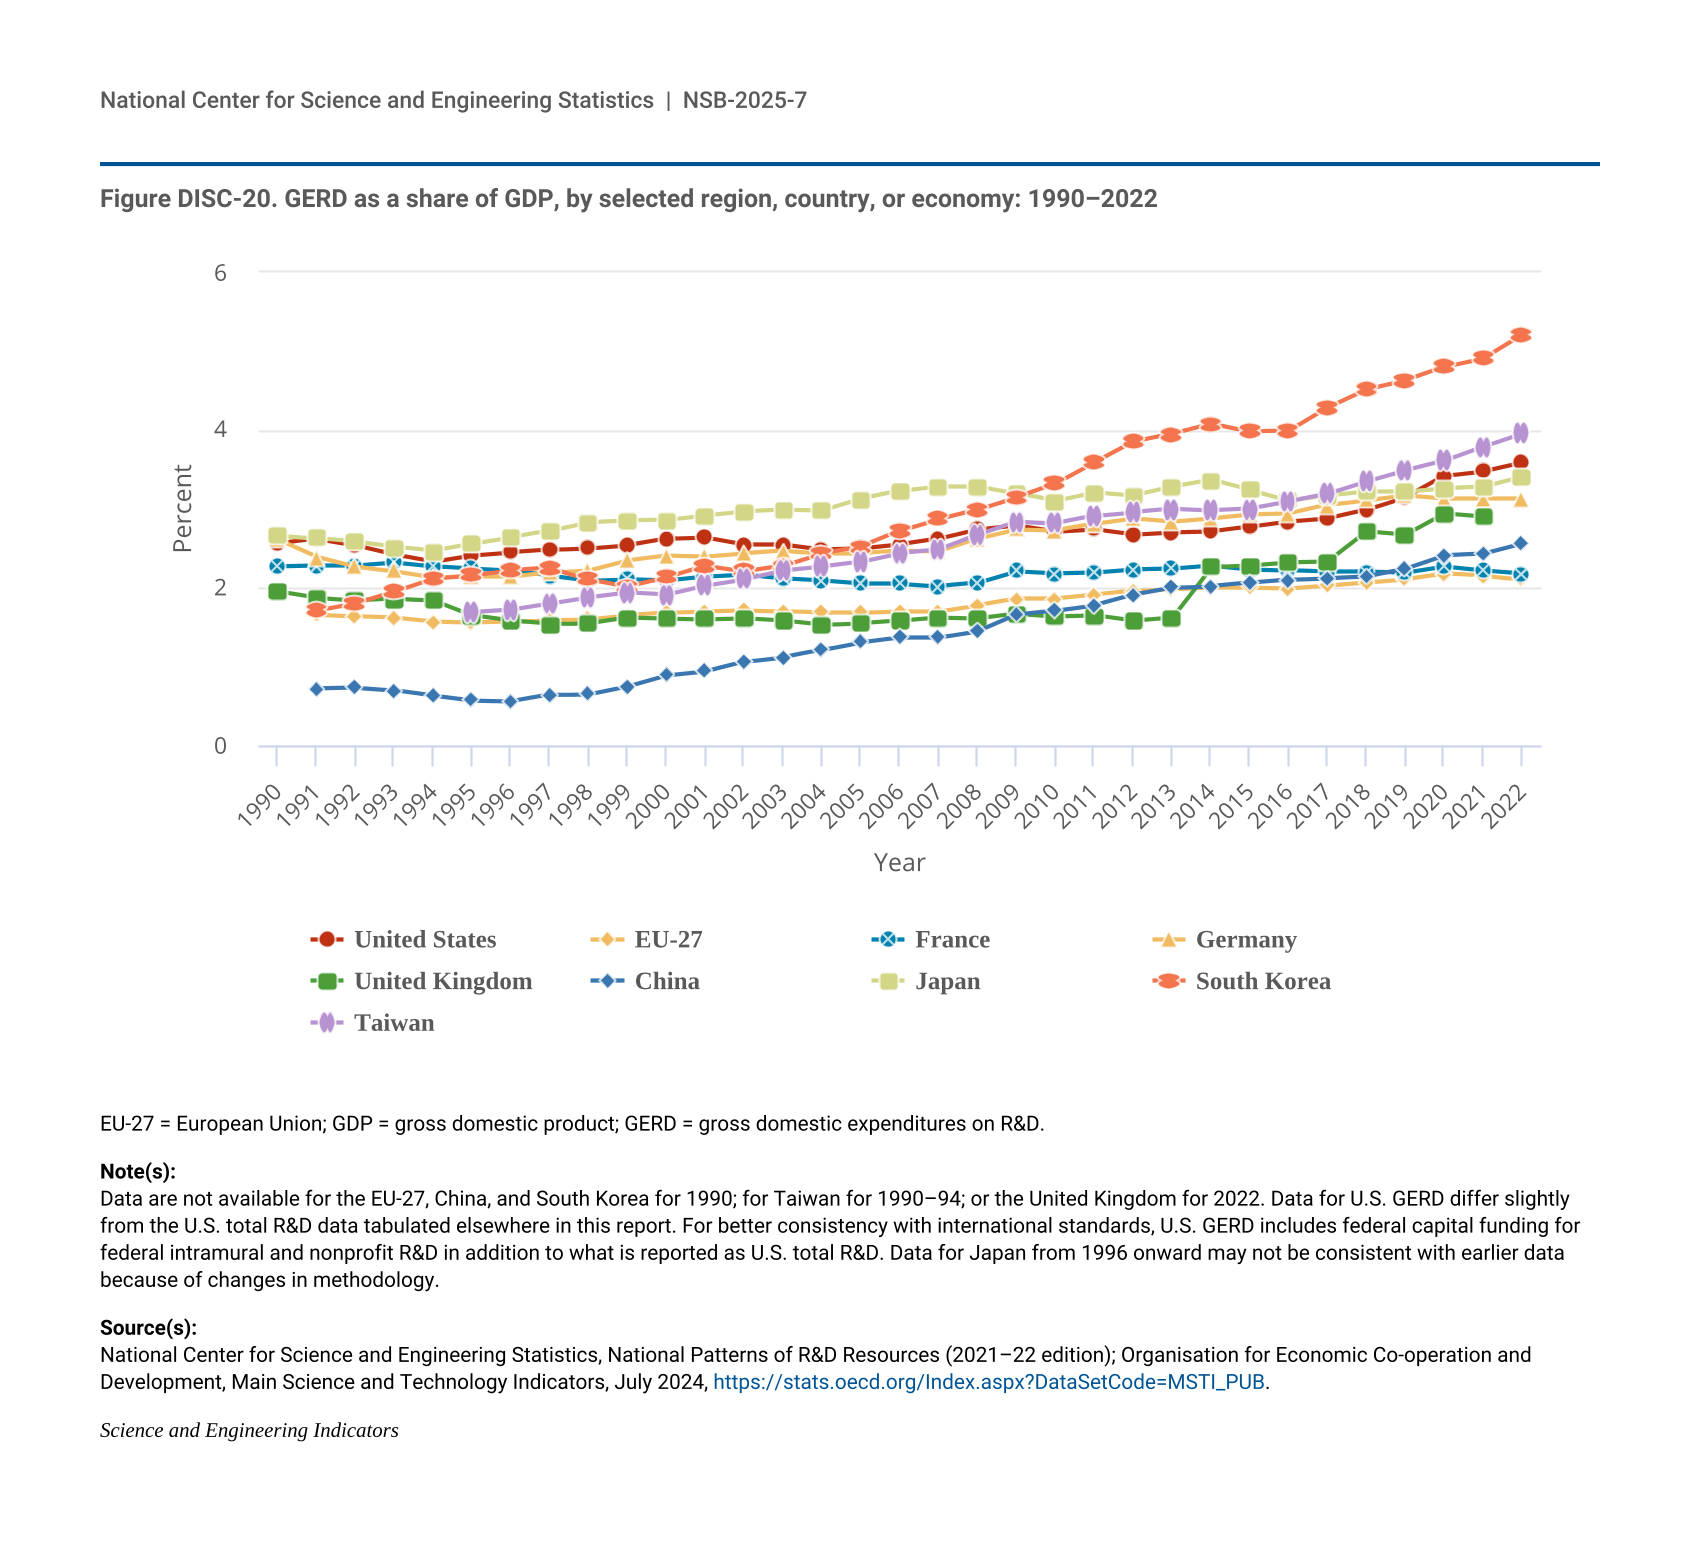
- GERD-to–gross domestic product (GDP) ratios, or national R&D intensities, are a useful summary measure to compare across economies. In 2022, Israel (6.0%) and South Korea (5.2%) topped this indicator, while seven economies had intensities between 3.0% and 4.0%, including Taiwan (4.0%), the United States (3.6%), Japan (3.4%), and Germany (3.1%). China’s GERD-to-GDP ratio was 2.6%, and the European Union (EU-27) had a ratio of 2.1%.
Sectoral Performance and Funding Distribution
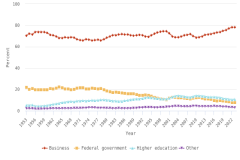
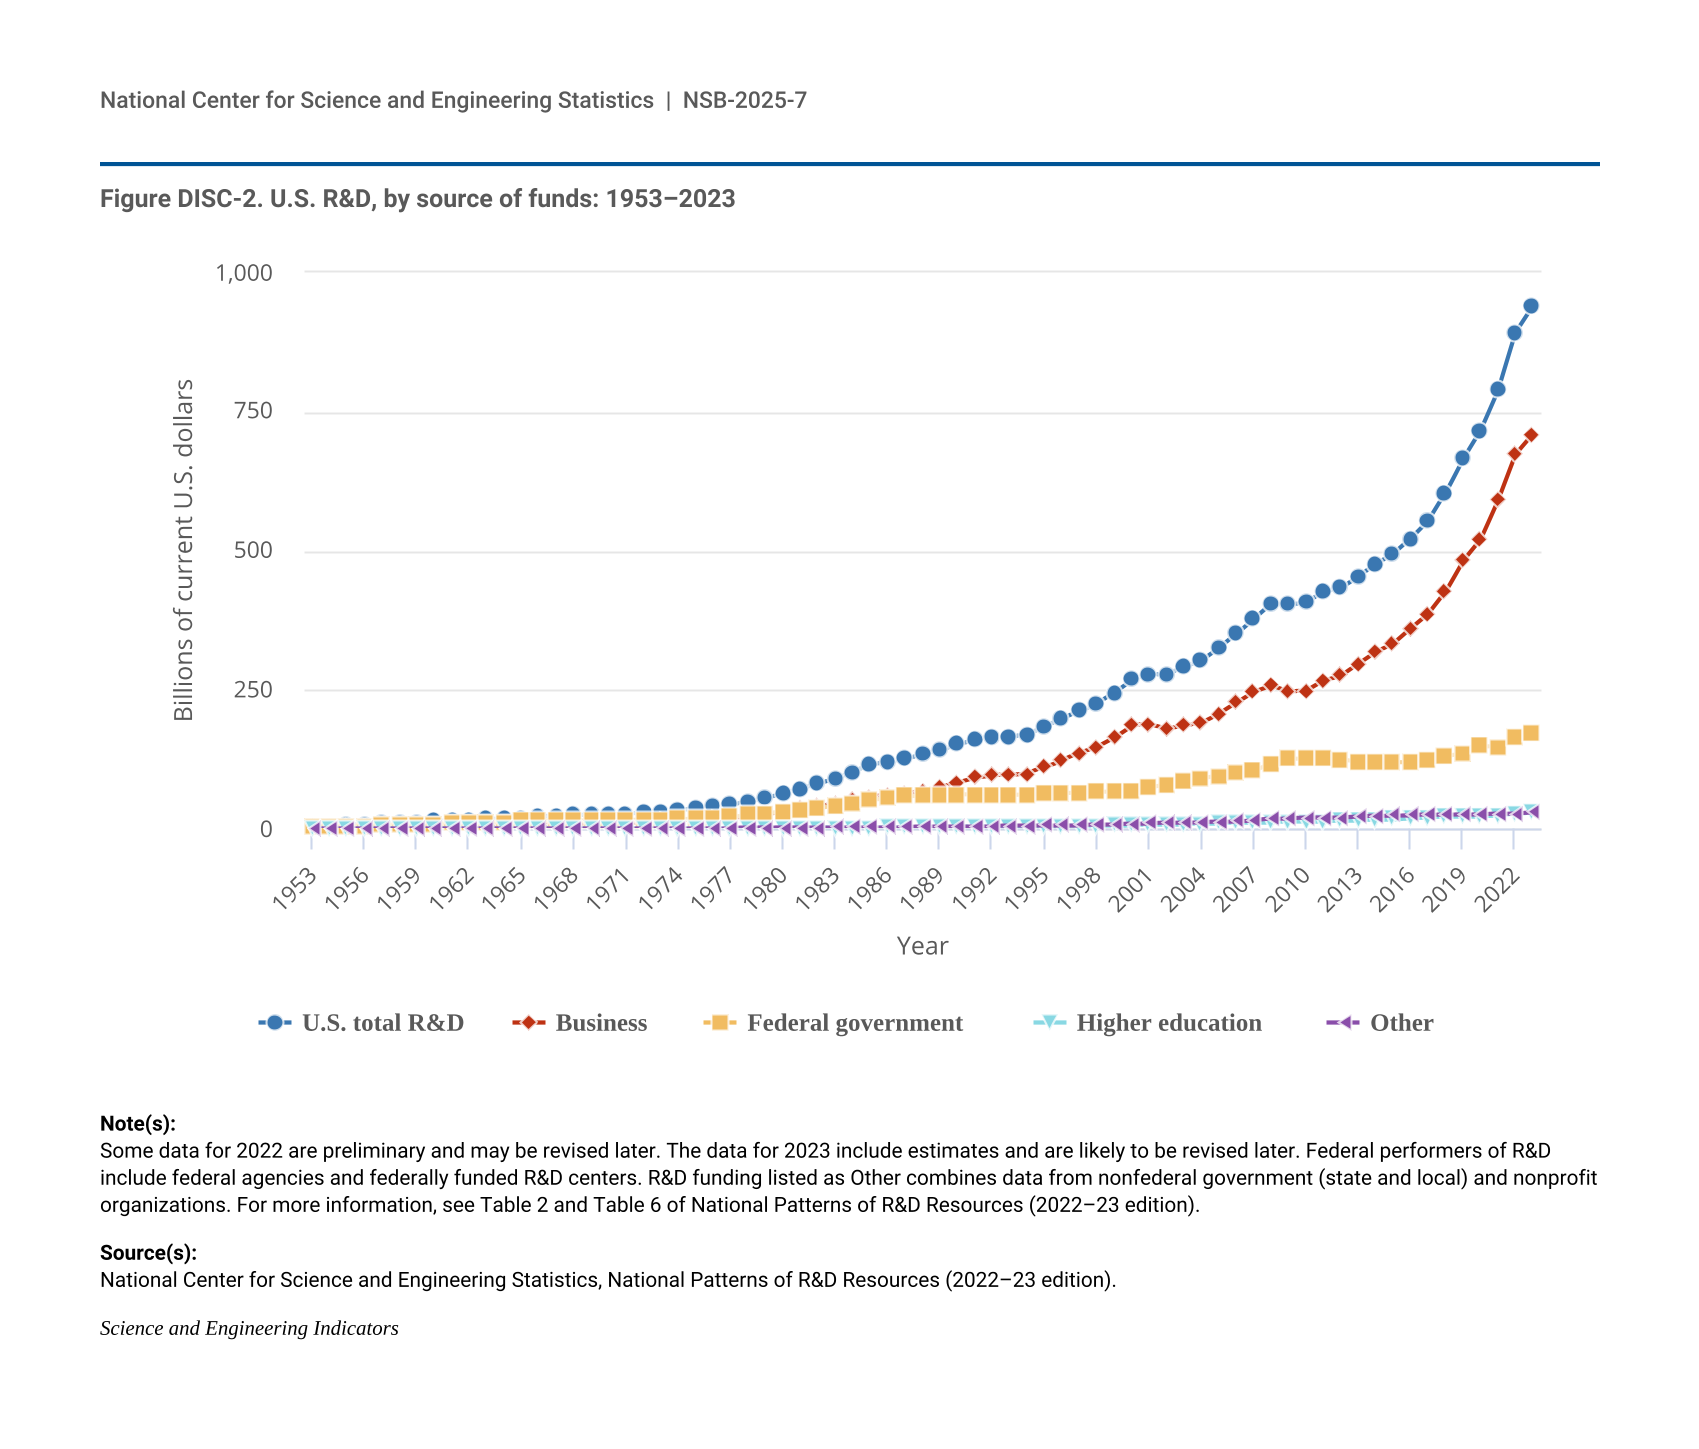
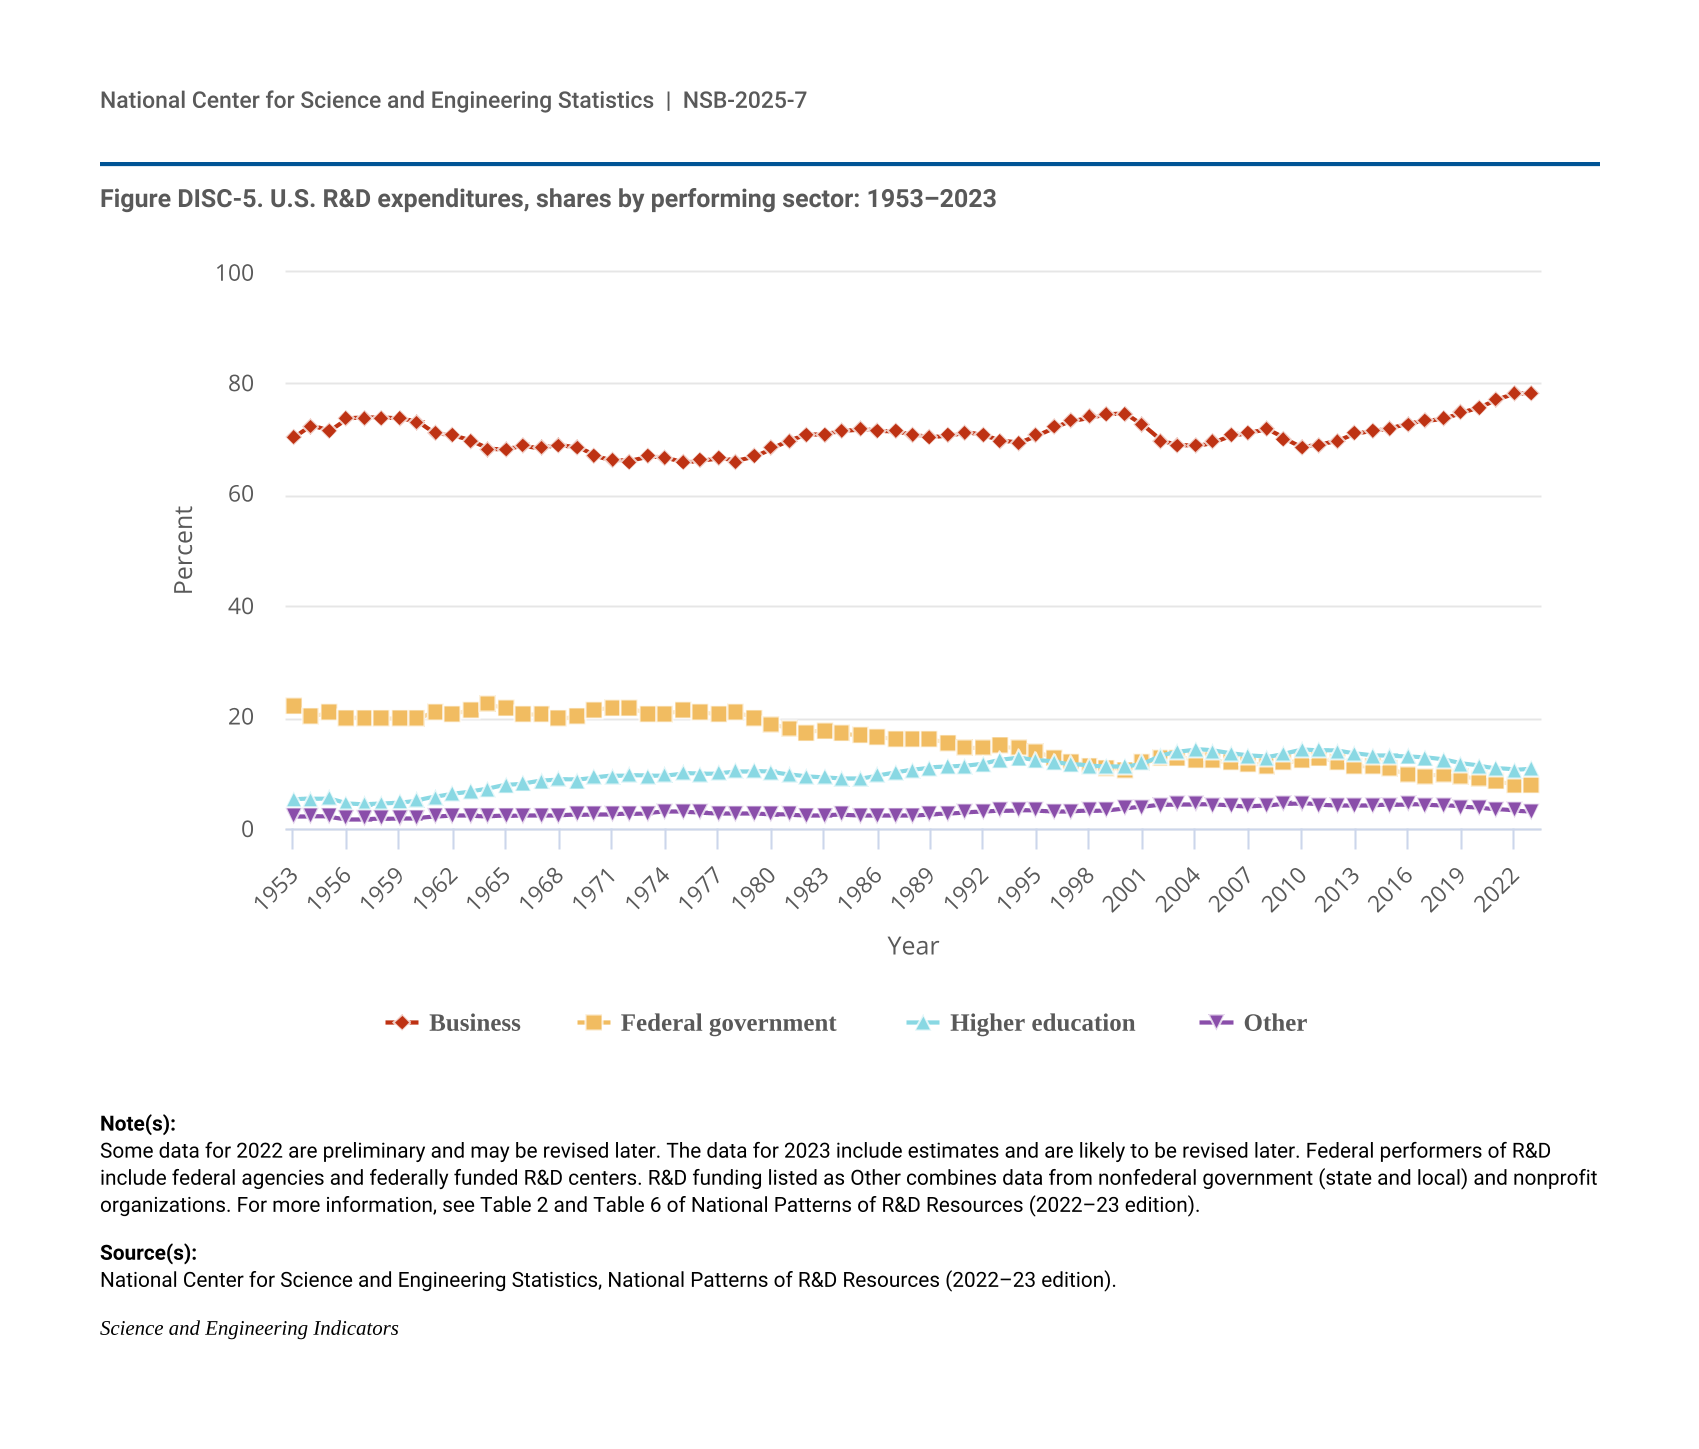
The business sector performed and funded the vast majority of R&D in the United States in 2023, accounting for 78% and 75% of these categories, respectively, and driving two-thirds of total U.S. R&D performance to focus on experimental development.
Performance
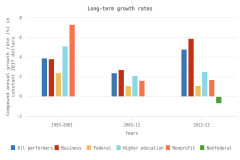
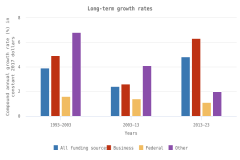
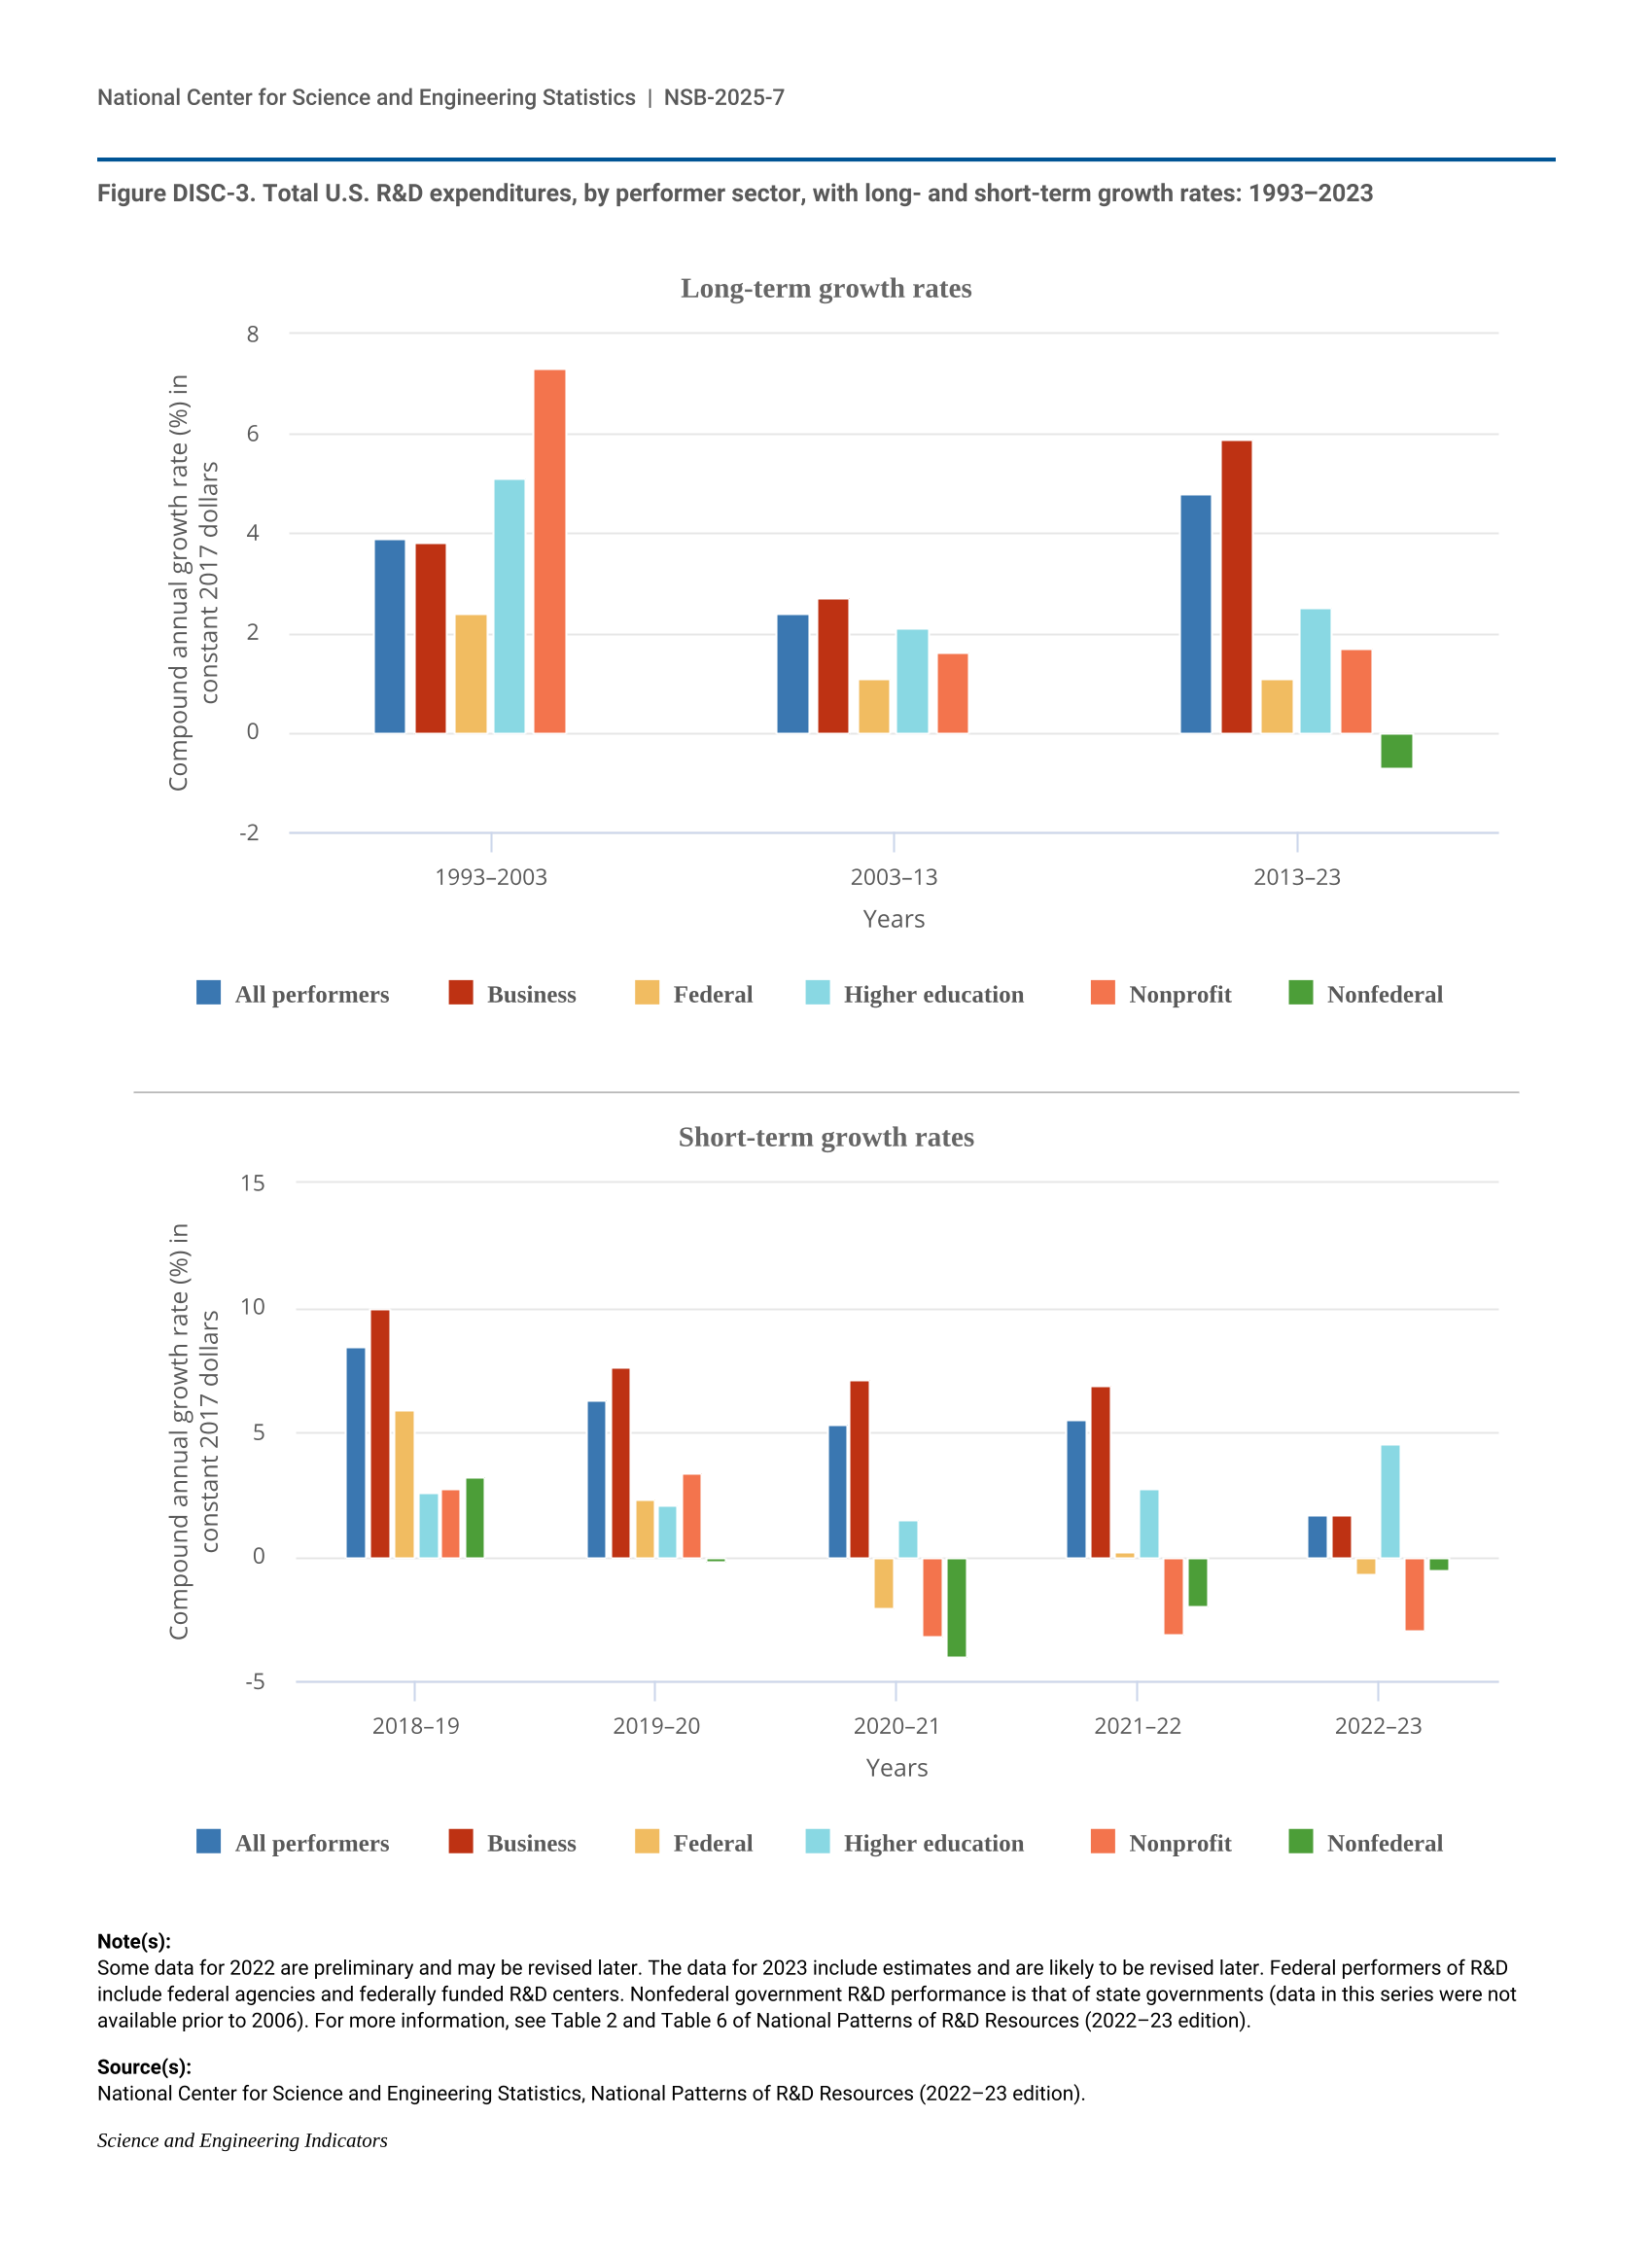
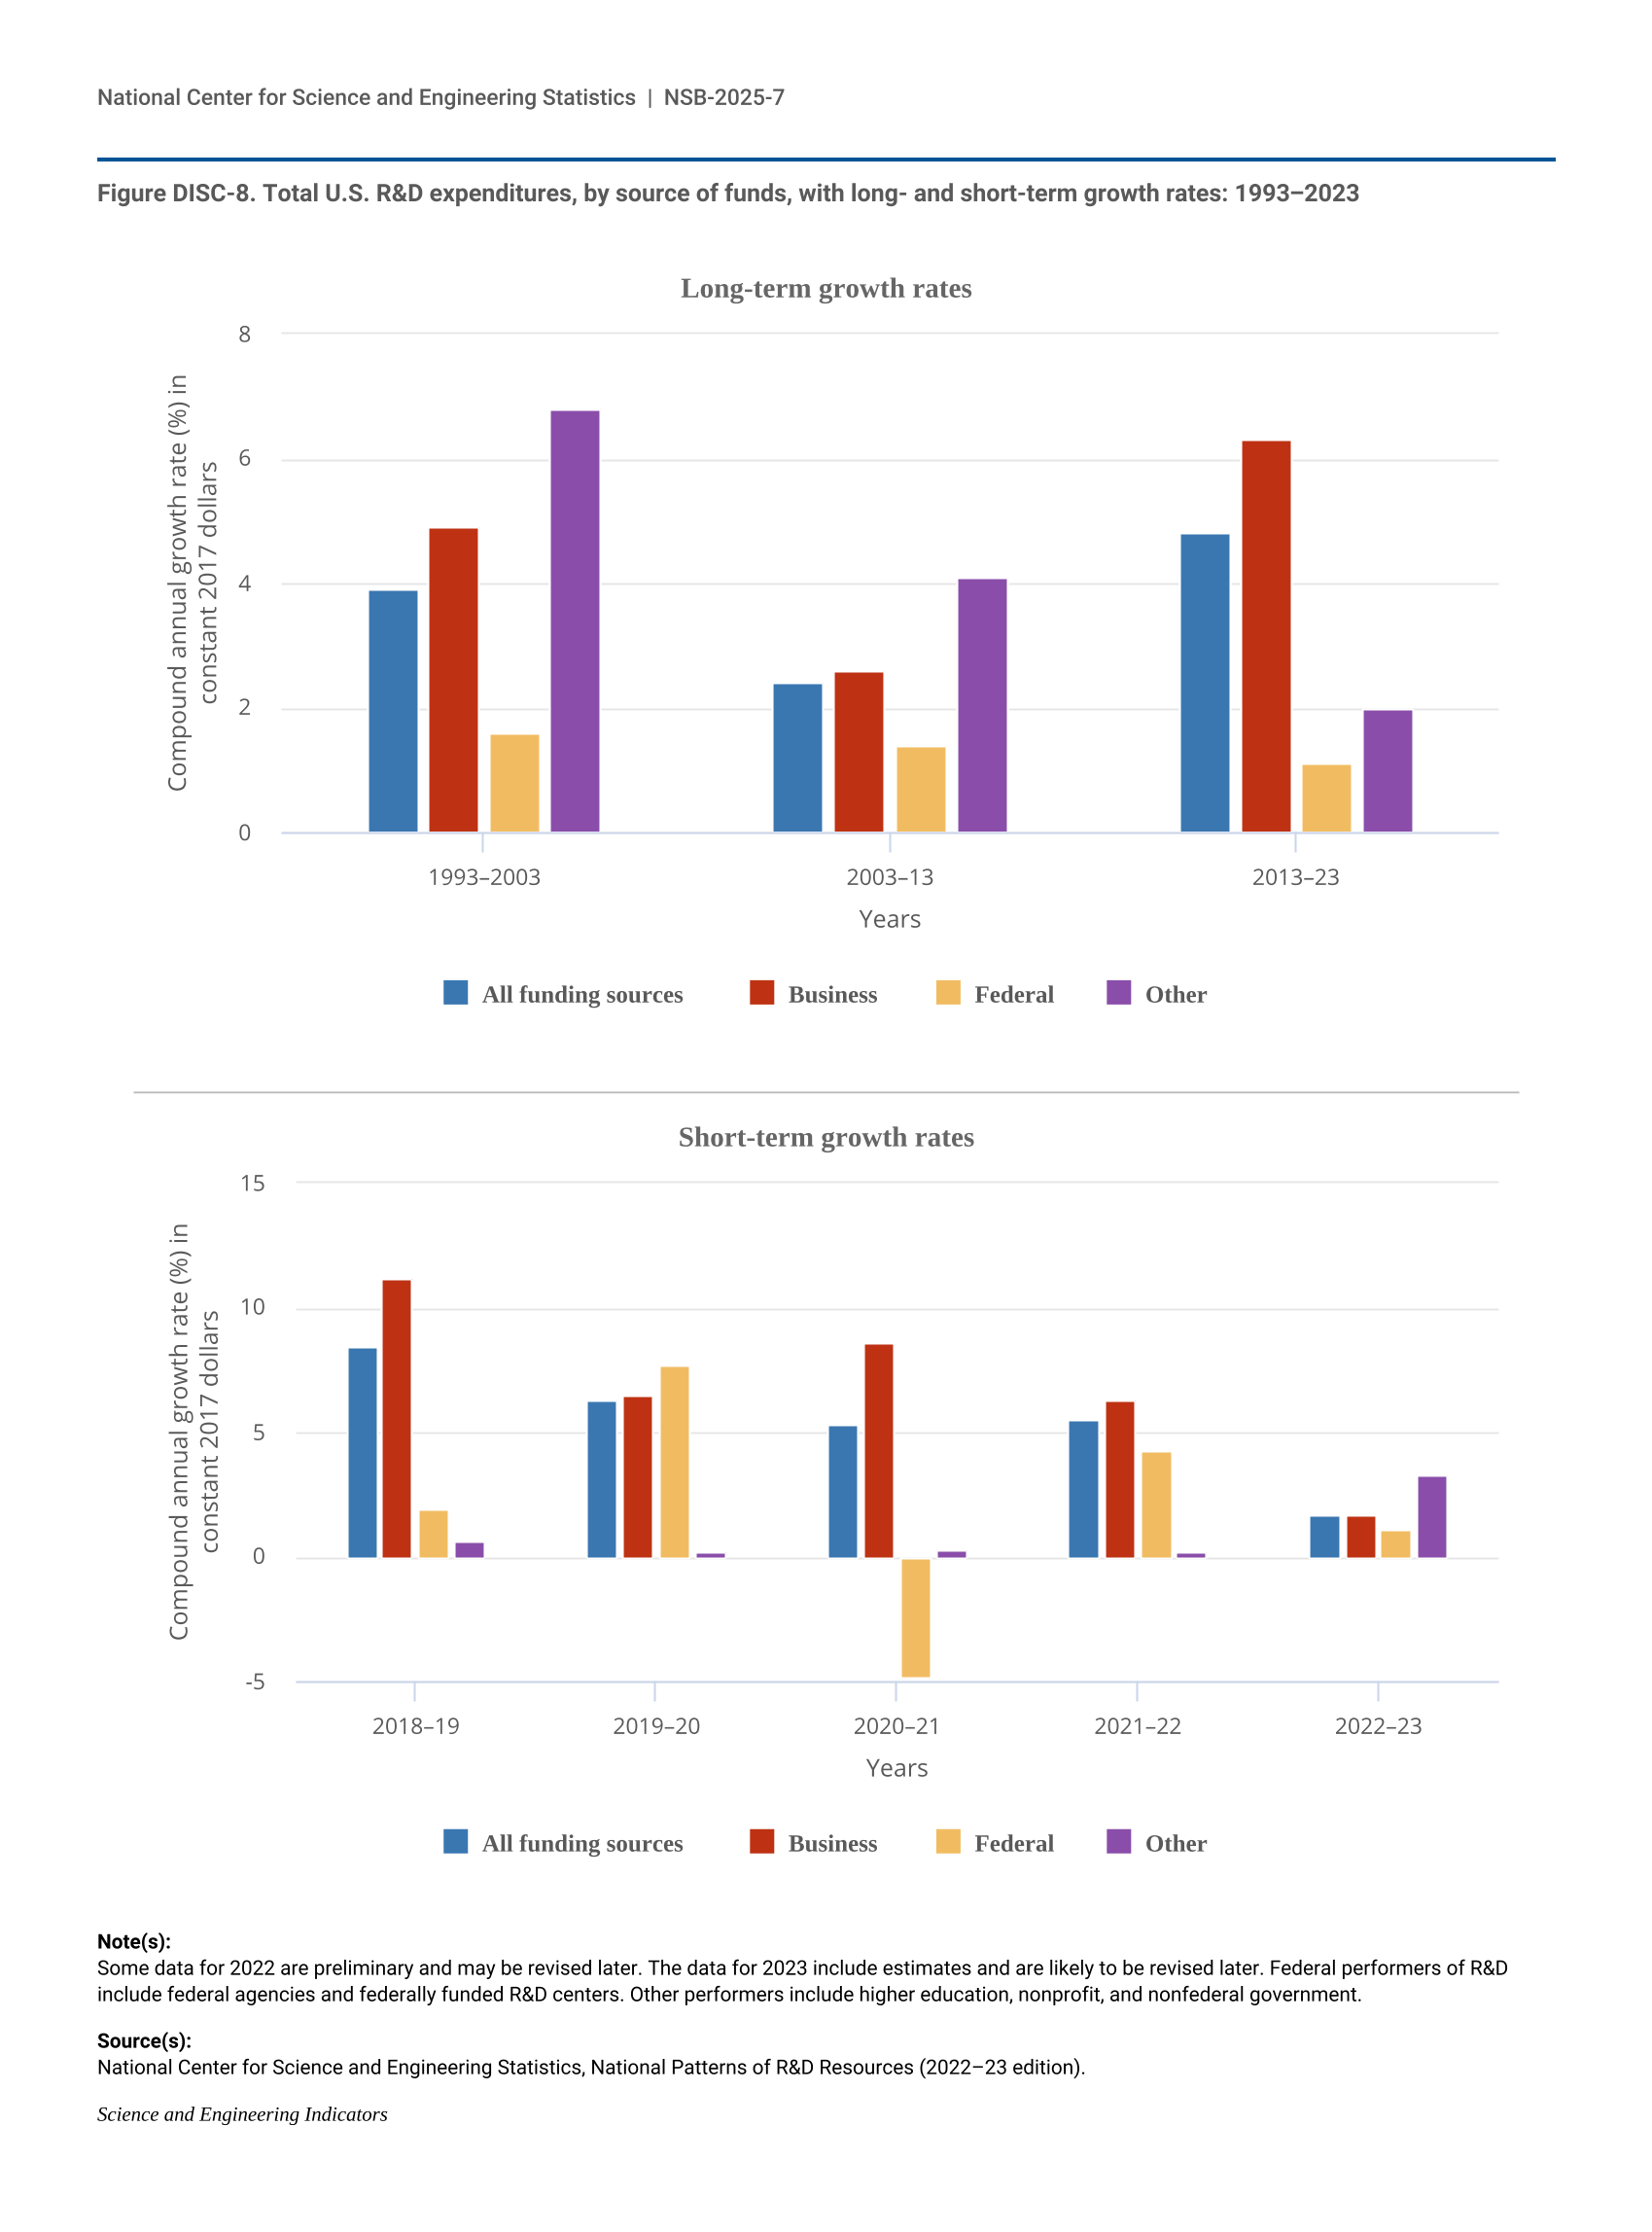
- The business sector performed the largest amount of R&D in the U.S. economy in 2023 ($735 billion, or 78% of total U.S. R&D performance). Business R&D performance compound annual growth rate (CAGR) since 2013 was more than double the CAGR of all other sectors (6% in constant dollars).
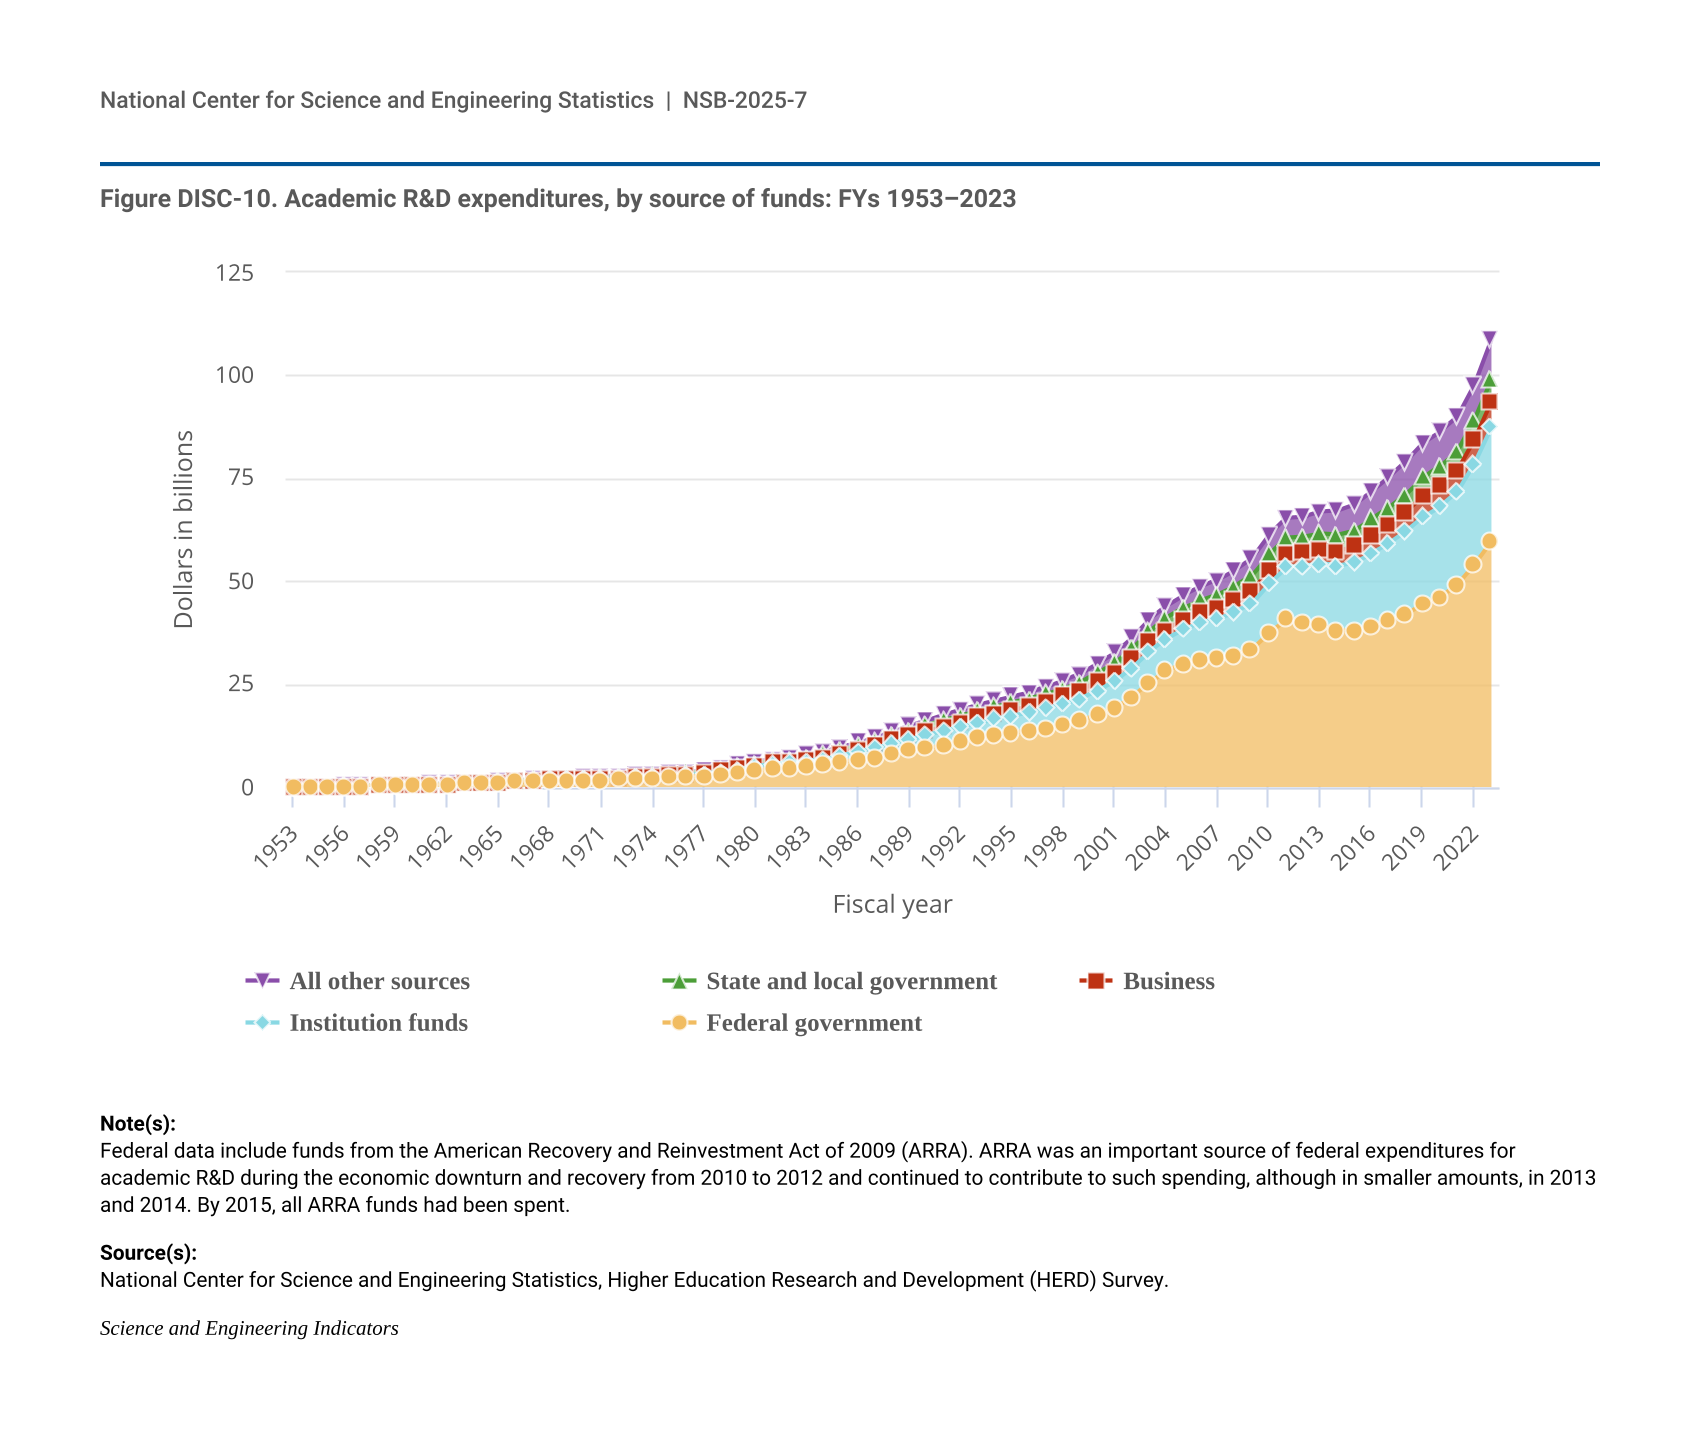
- The higher education sector was the second-largest R&D performer in 2023 ($102 billion, or 11% of total U.S. R&D performance), with 3% CAGR in constant dollars since 2013.
- The federal government was the third-largest R&D performer in 2023 ($74 billion, or 8% of total U.S. R&D performance). This amount includes $44 billion in R&D performed by federal agencies and $29 billion performed by federally funded R&D centers. Federal R&D performance has changed little since 2013, with 1% CAGR in constant dollars.
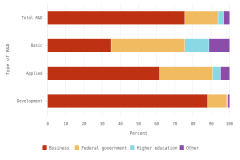
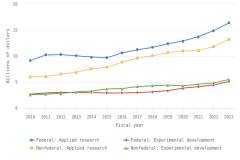
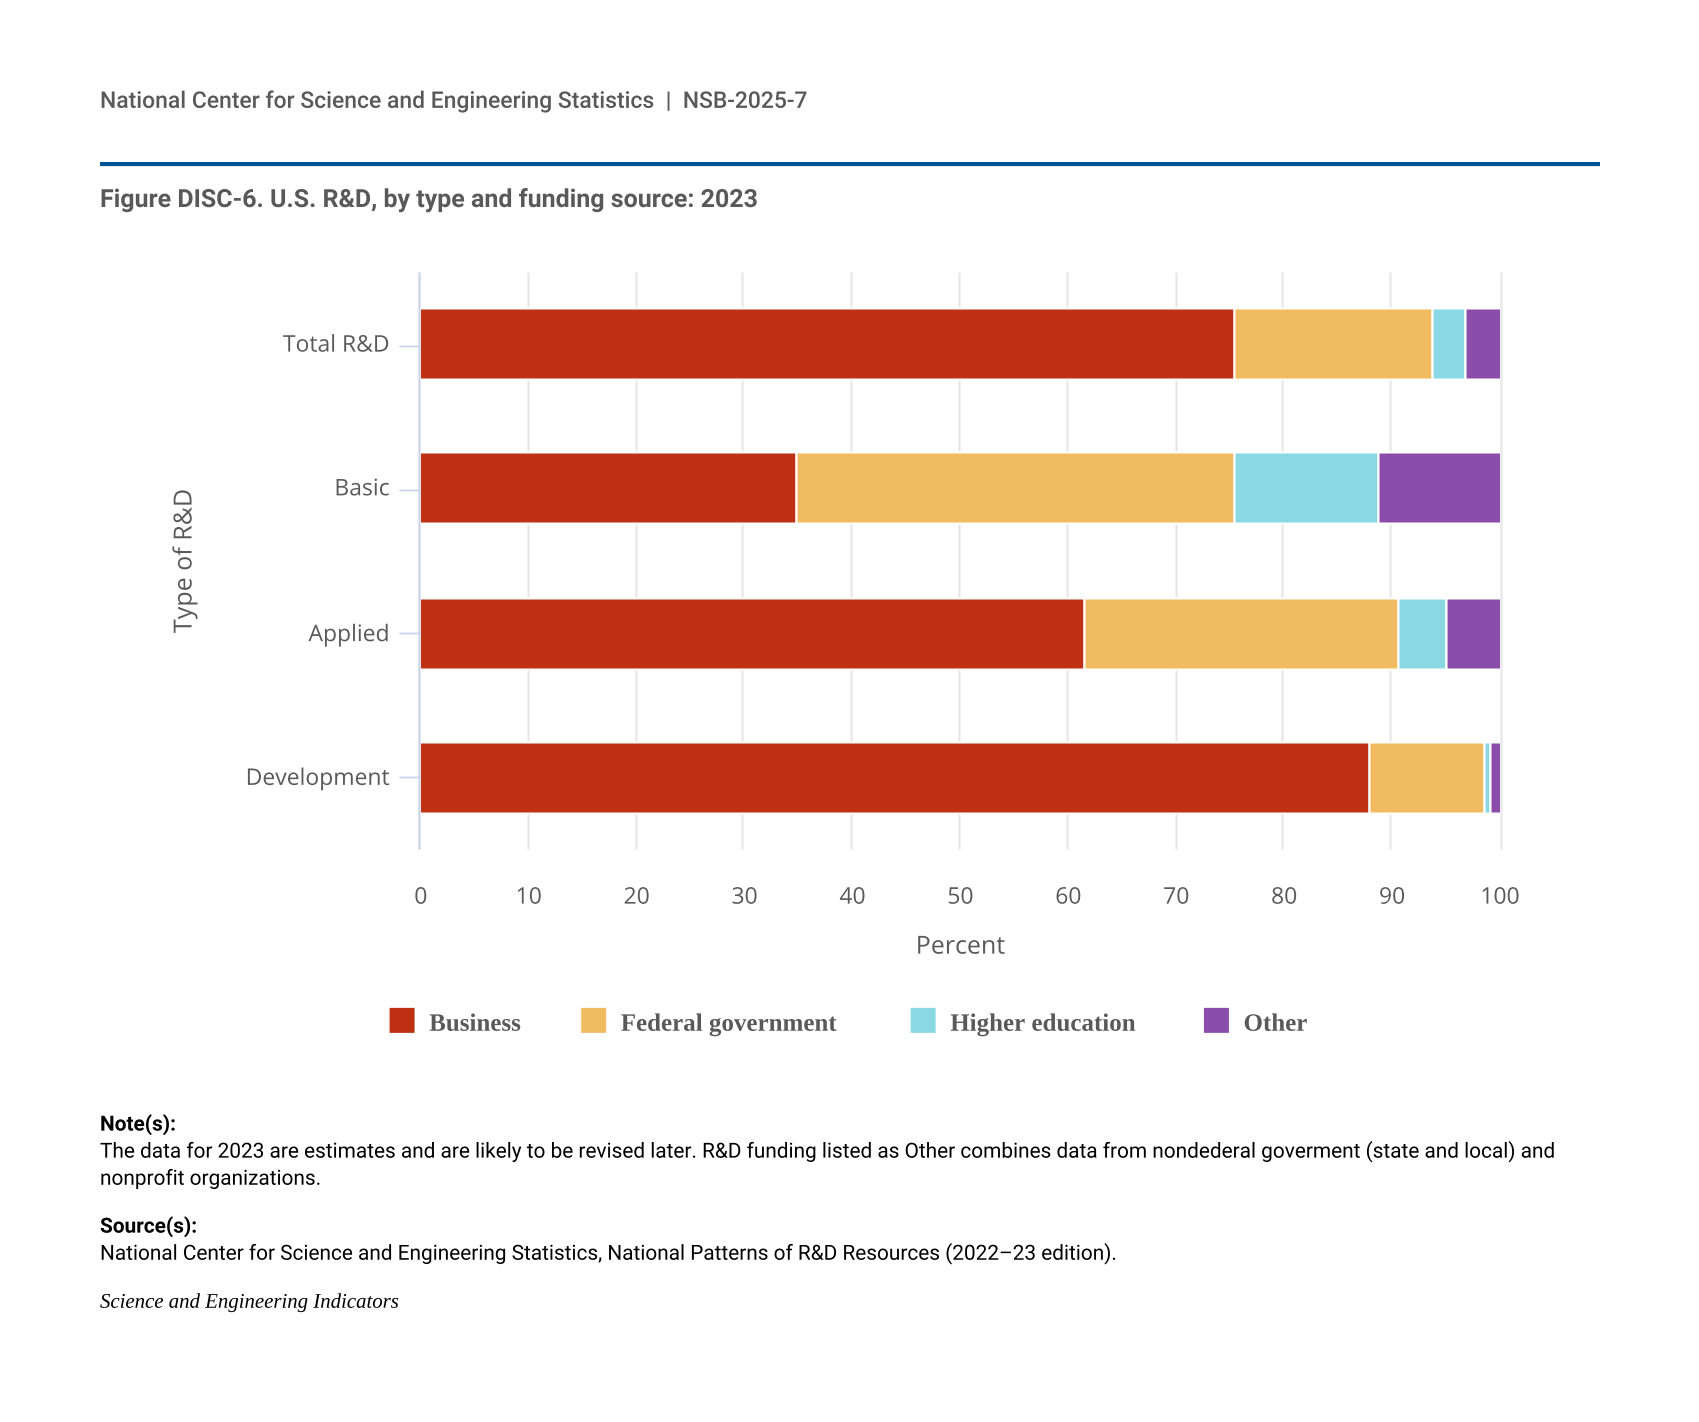
- In 2023, about two-thirds of U.S. R&D performance across all sectors was for experimental development (67%), followed by applied research (18%) and basic research (15%). The large share of experimental development in total U.S. R&D performance is consistent with the role of the business sector as the largest performer (and funder) of R&D, given its focus on R&D on closer-to-market applications.
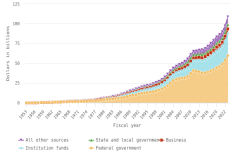
Funding
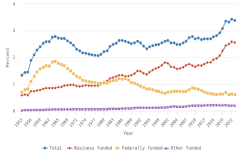
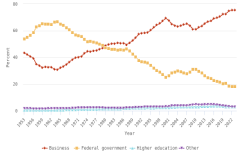
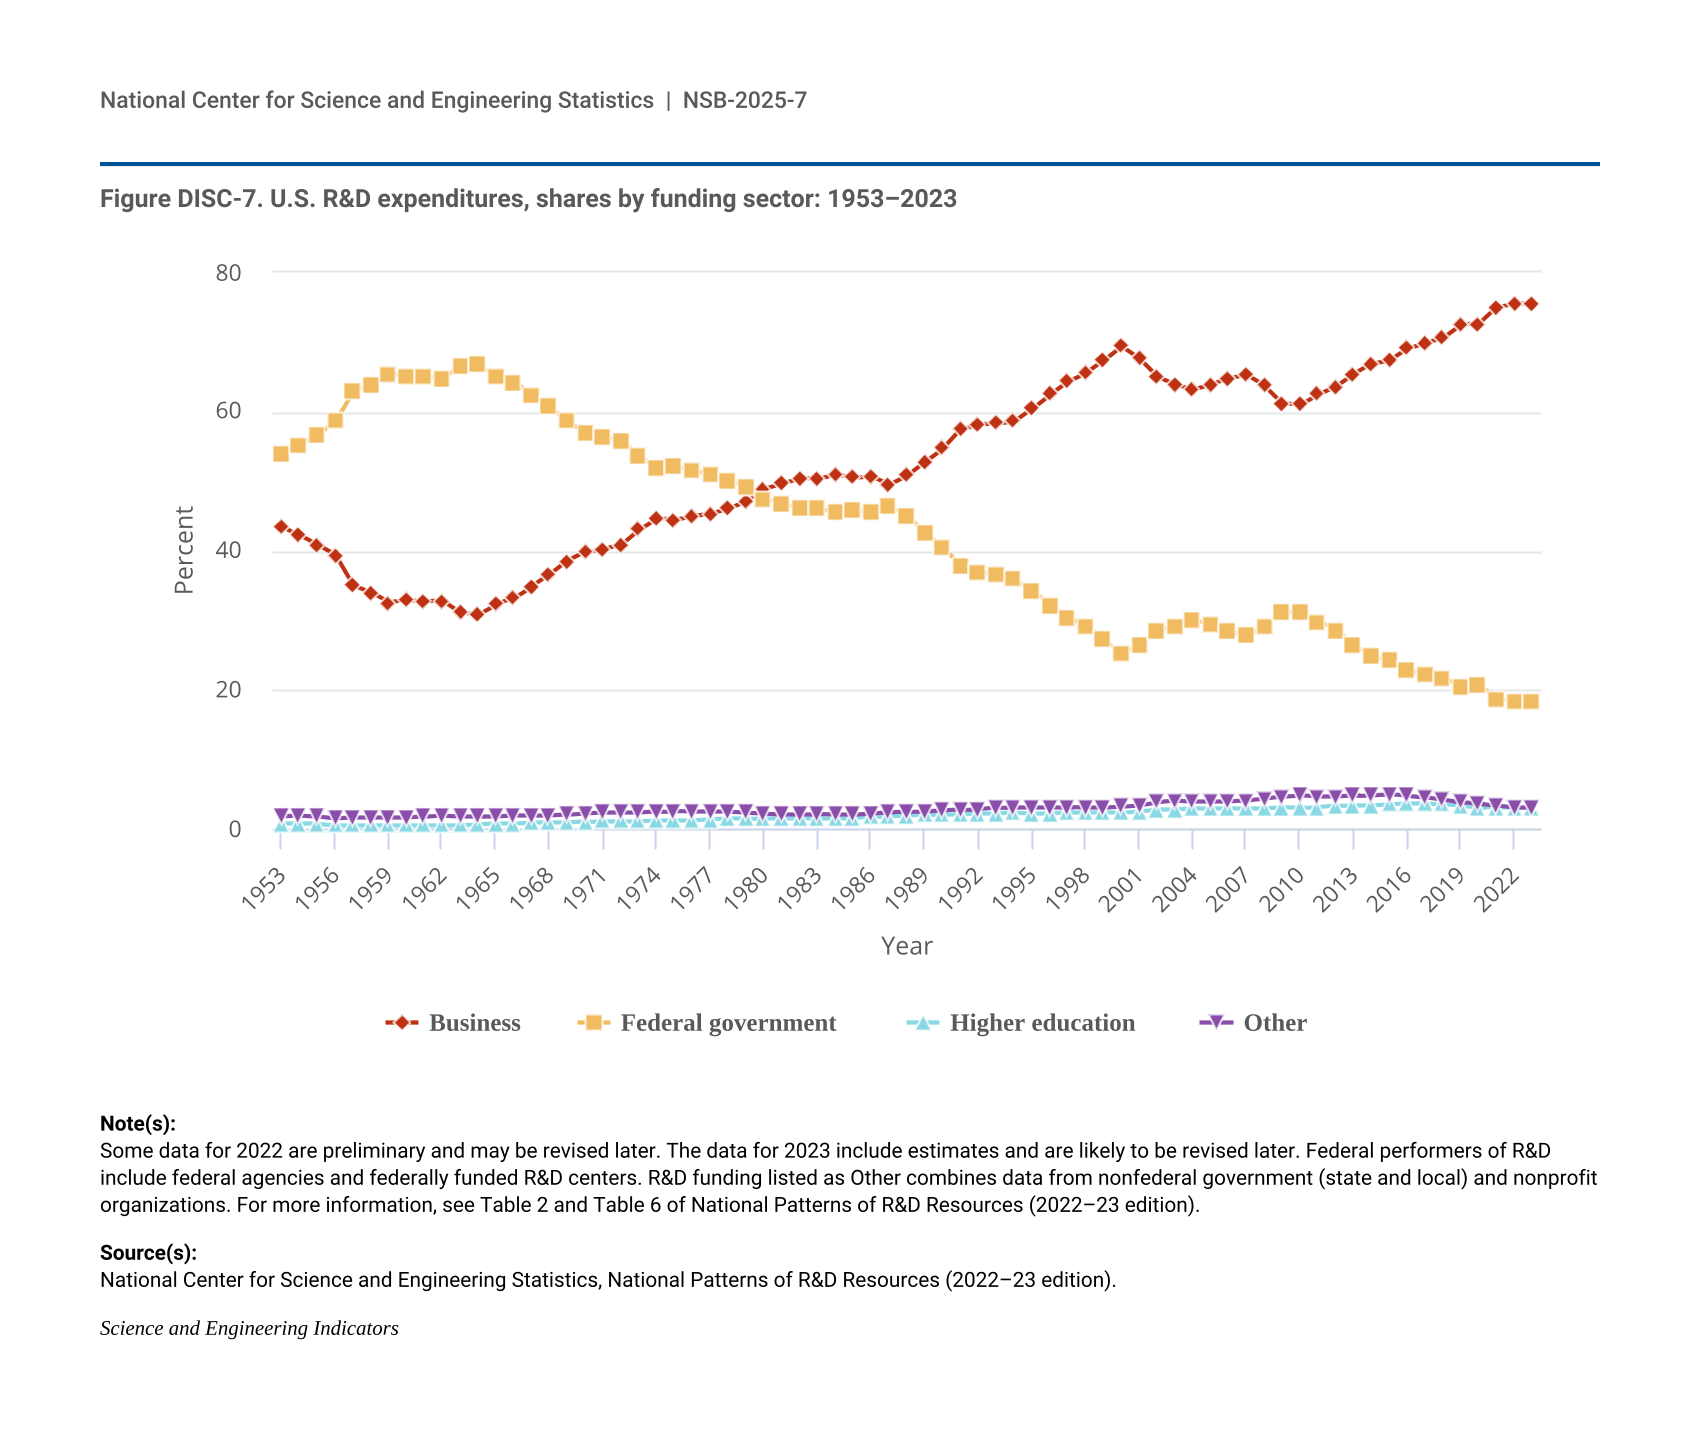
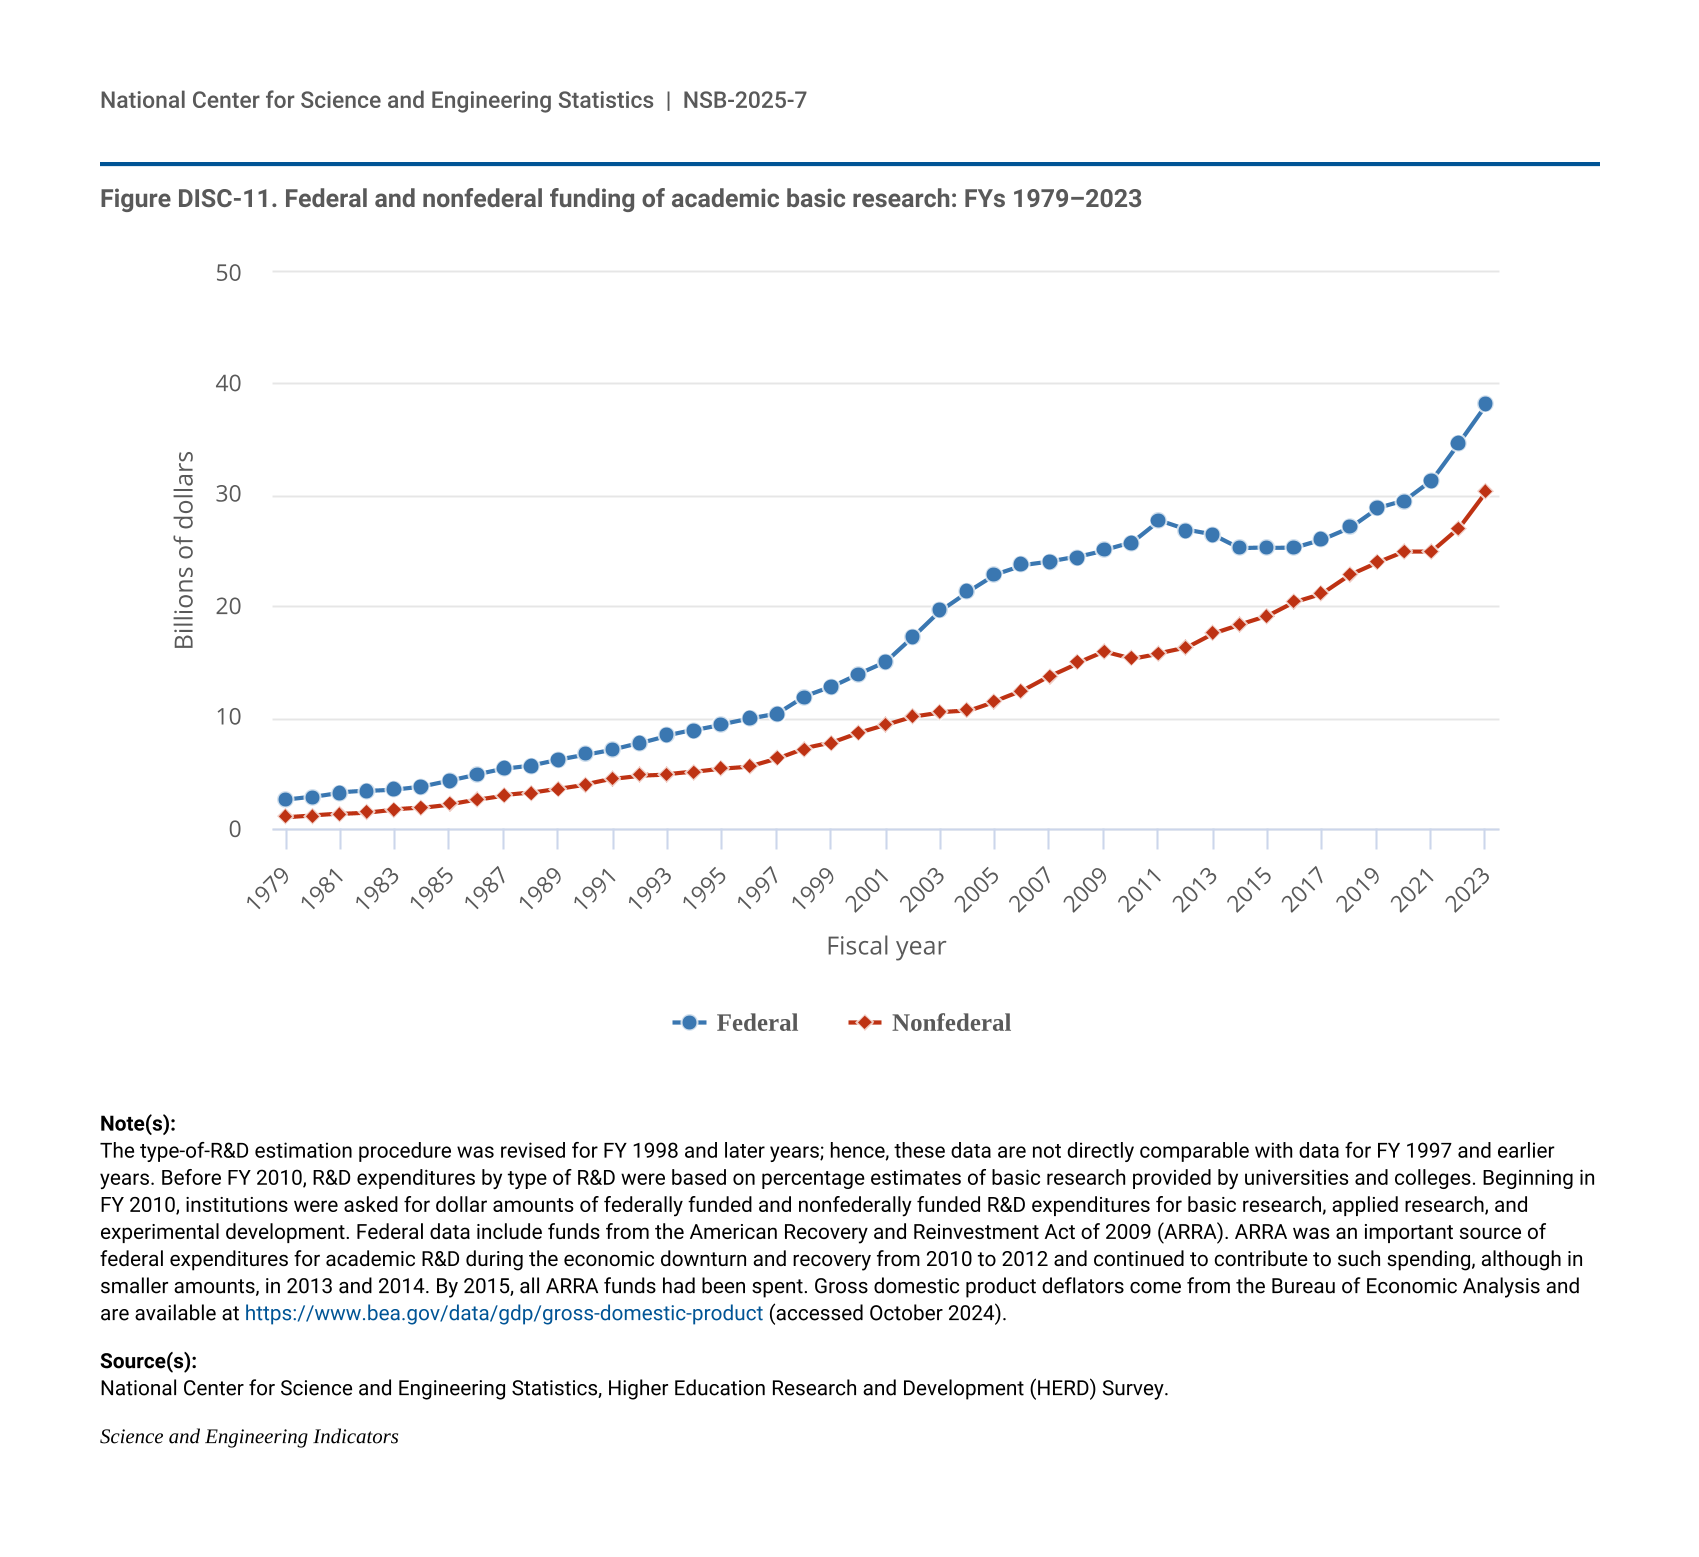
- Businesses funded 75% of U.S. total R&D performed by all sectors in 2023, compared with 18% funded by the federal government. Between 2012 and 2023, the share of basic research performed across all sectors funded by businesses grew from 21% to an estimated 35%, while the federal government’s share of basic research funding decreased from 52% to 41%.
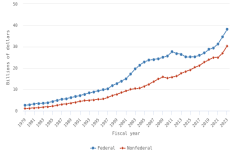
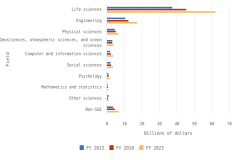
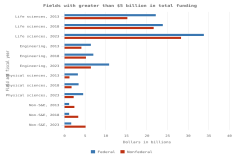
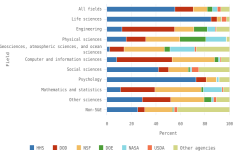
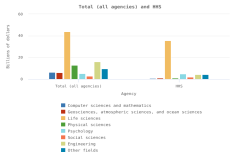
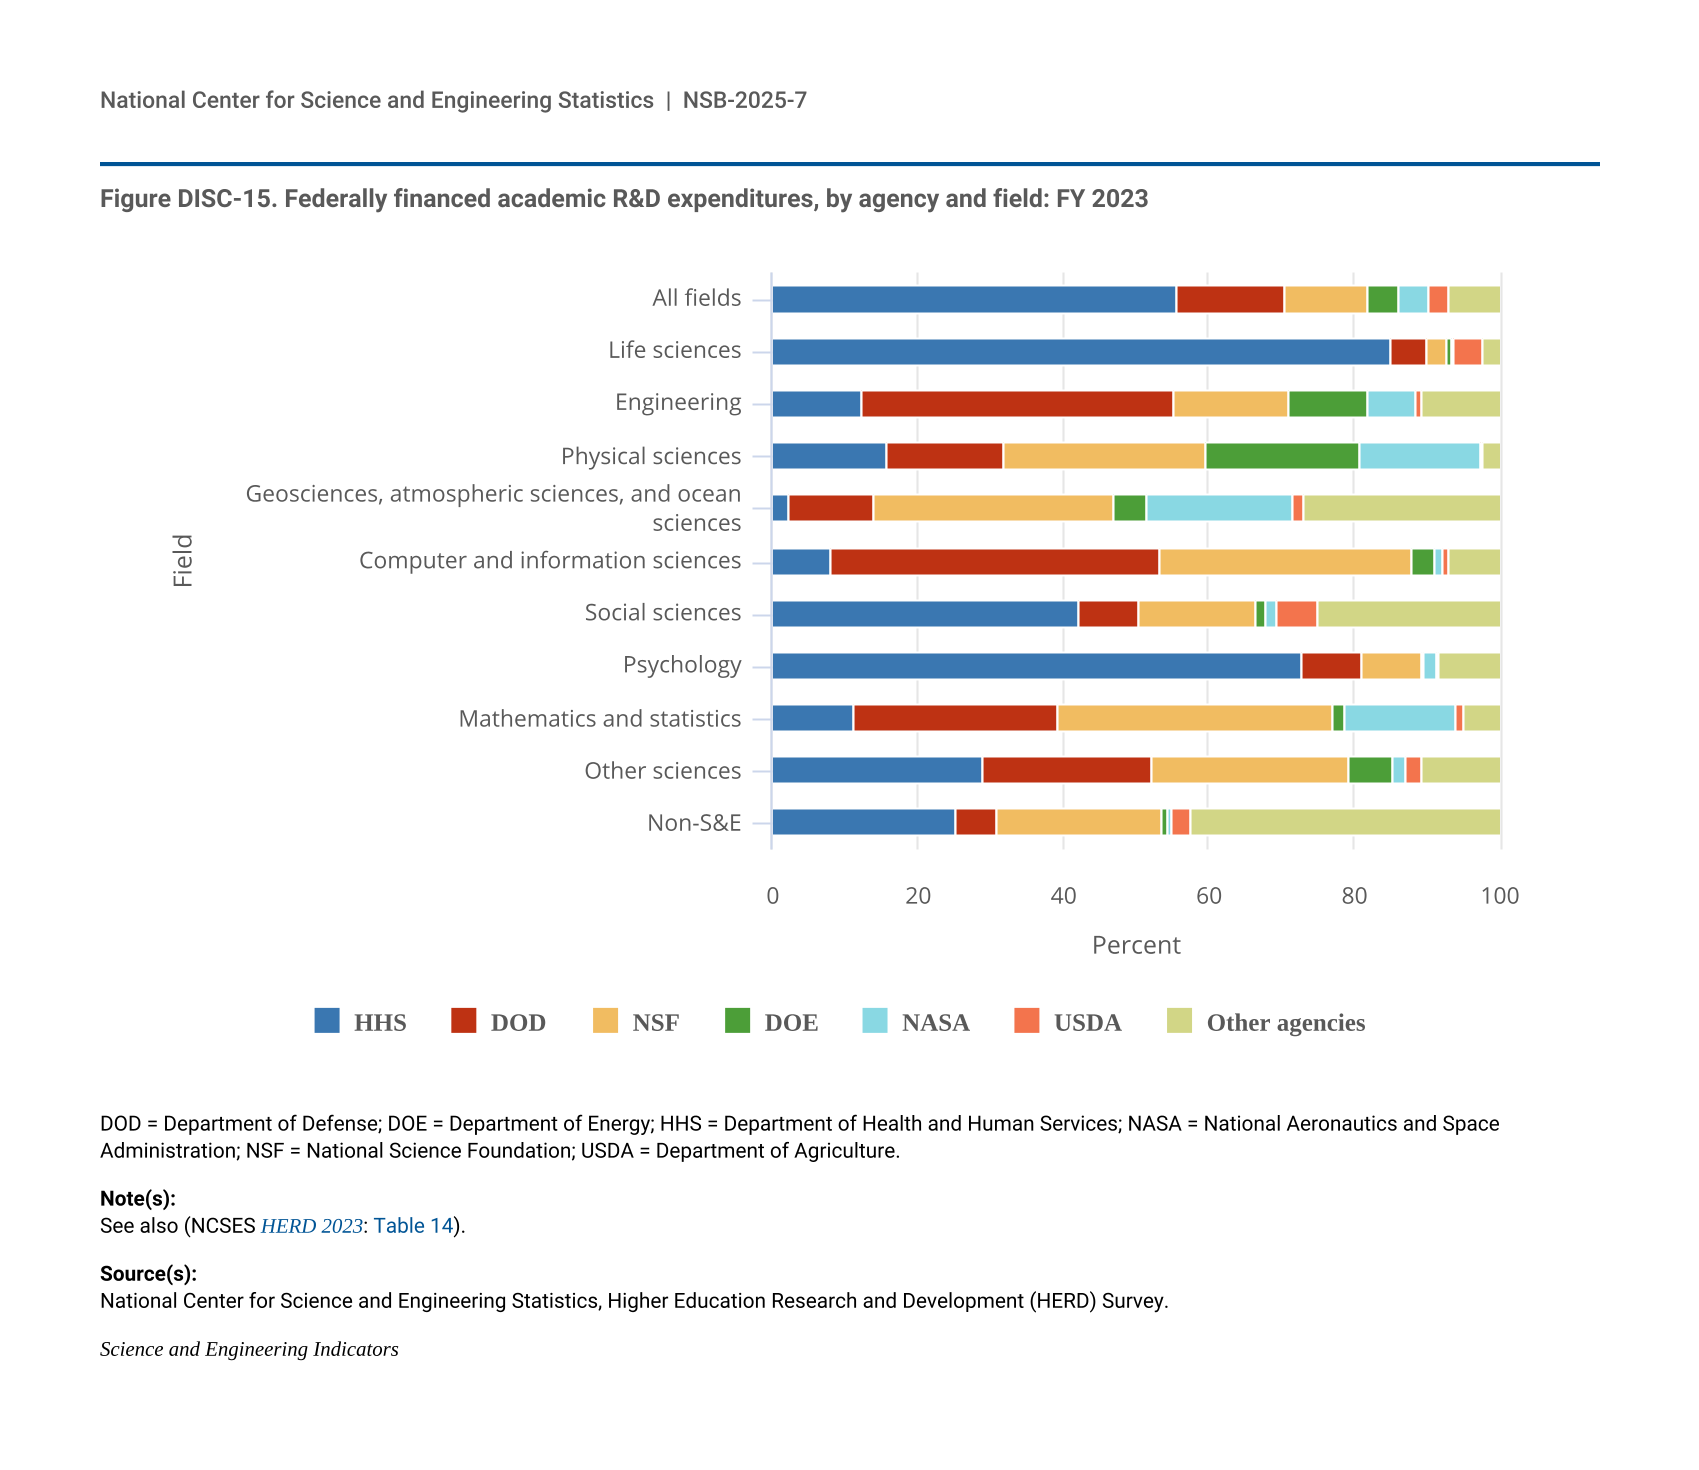
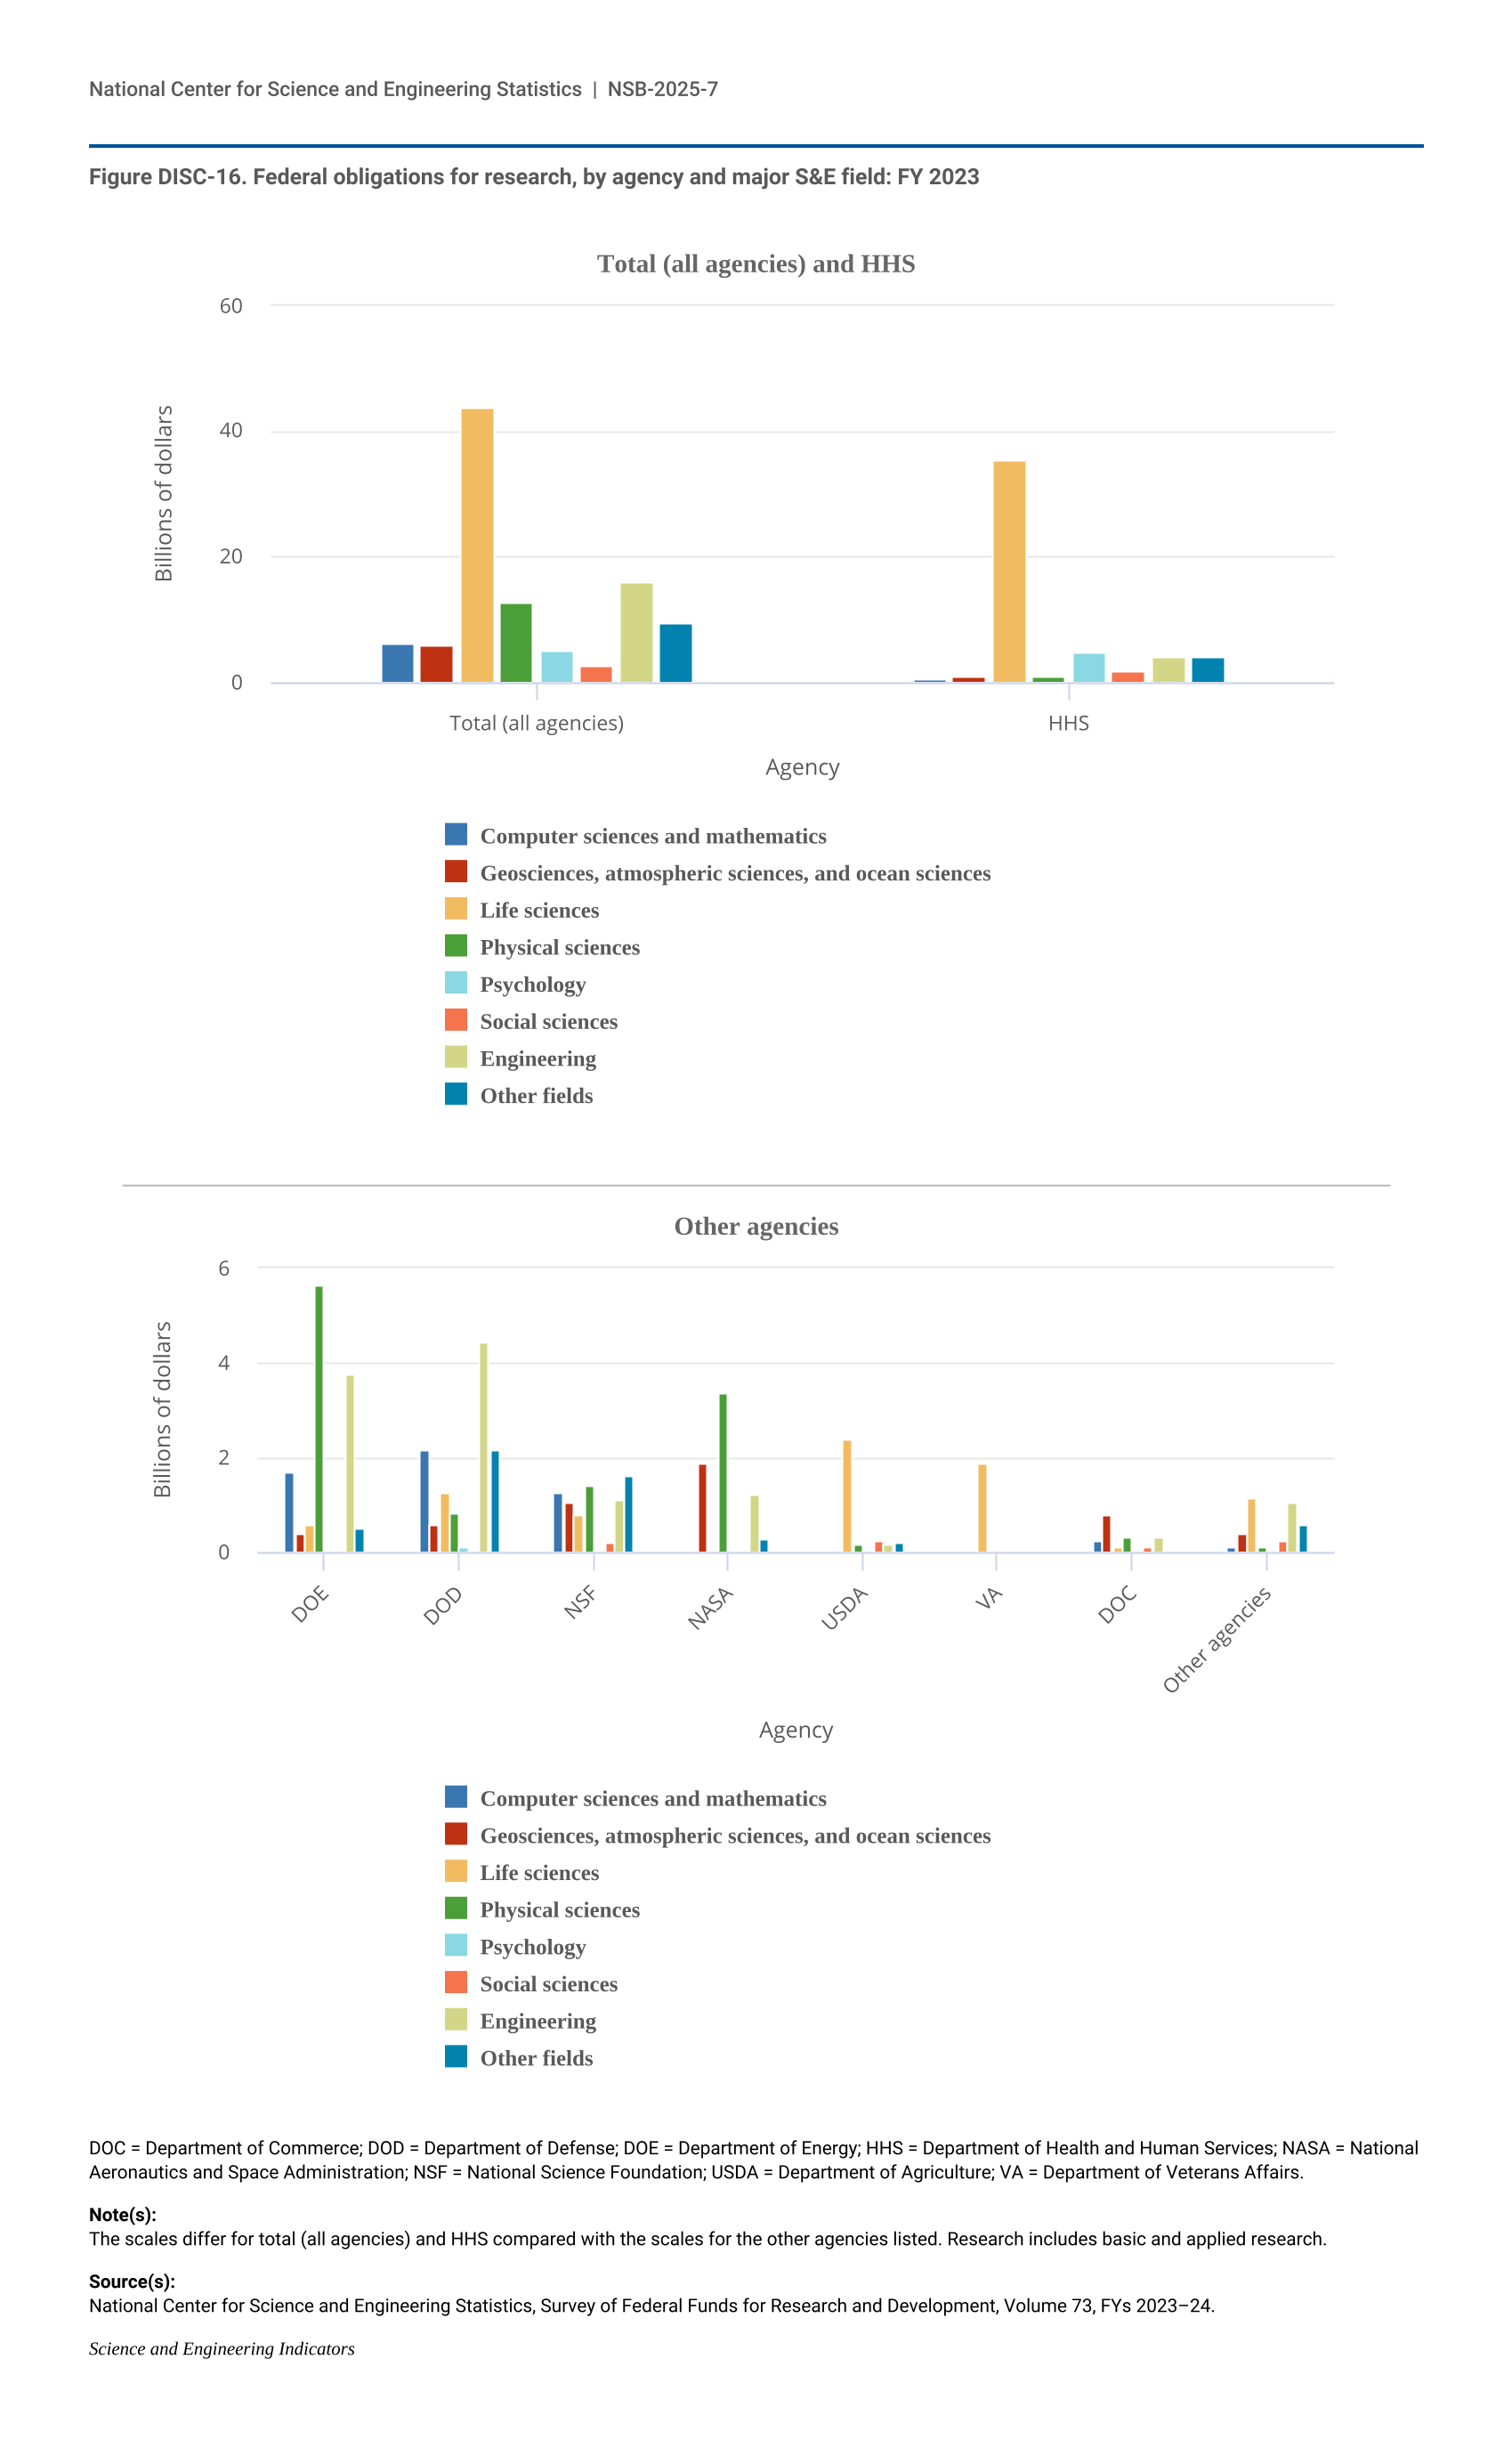
- In FY 2023, 25% of federal R&D obligations were devoted to basic research ($47 billion), 29% to applied research ($54 billion), and 46% to experimental development ($85 billion). About 43% of basic research and applied research obligations were dedicated to life sciences research, primarily from the U.S. Department of Health and Human Services.
Industry Concentration and Key Focus Areas
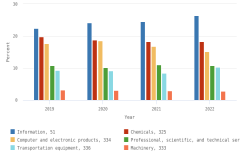
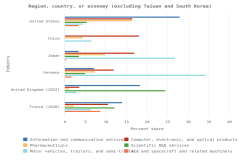
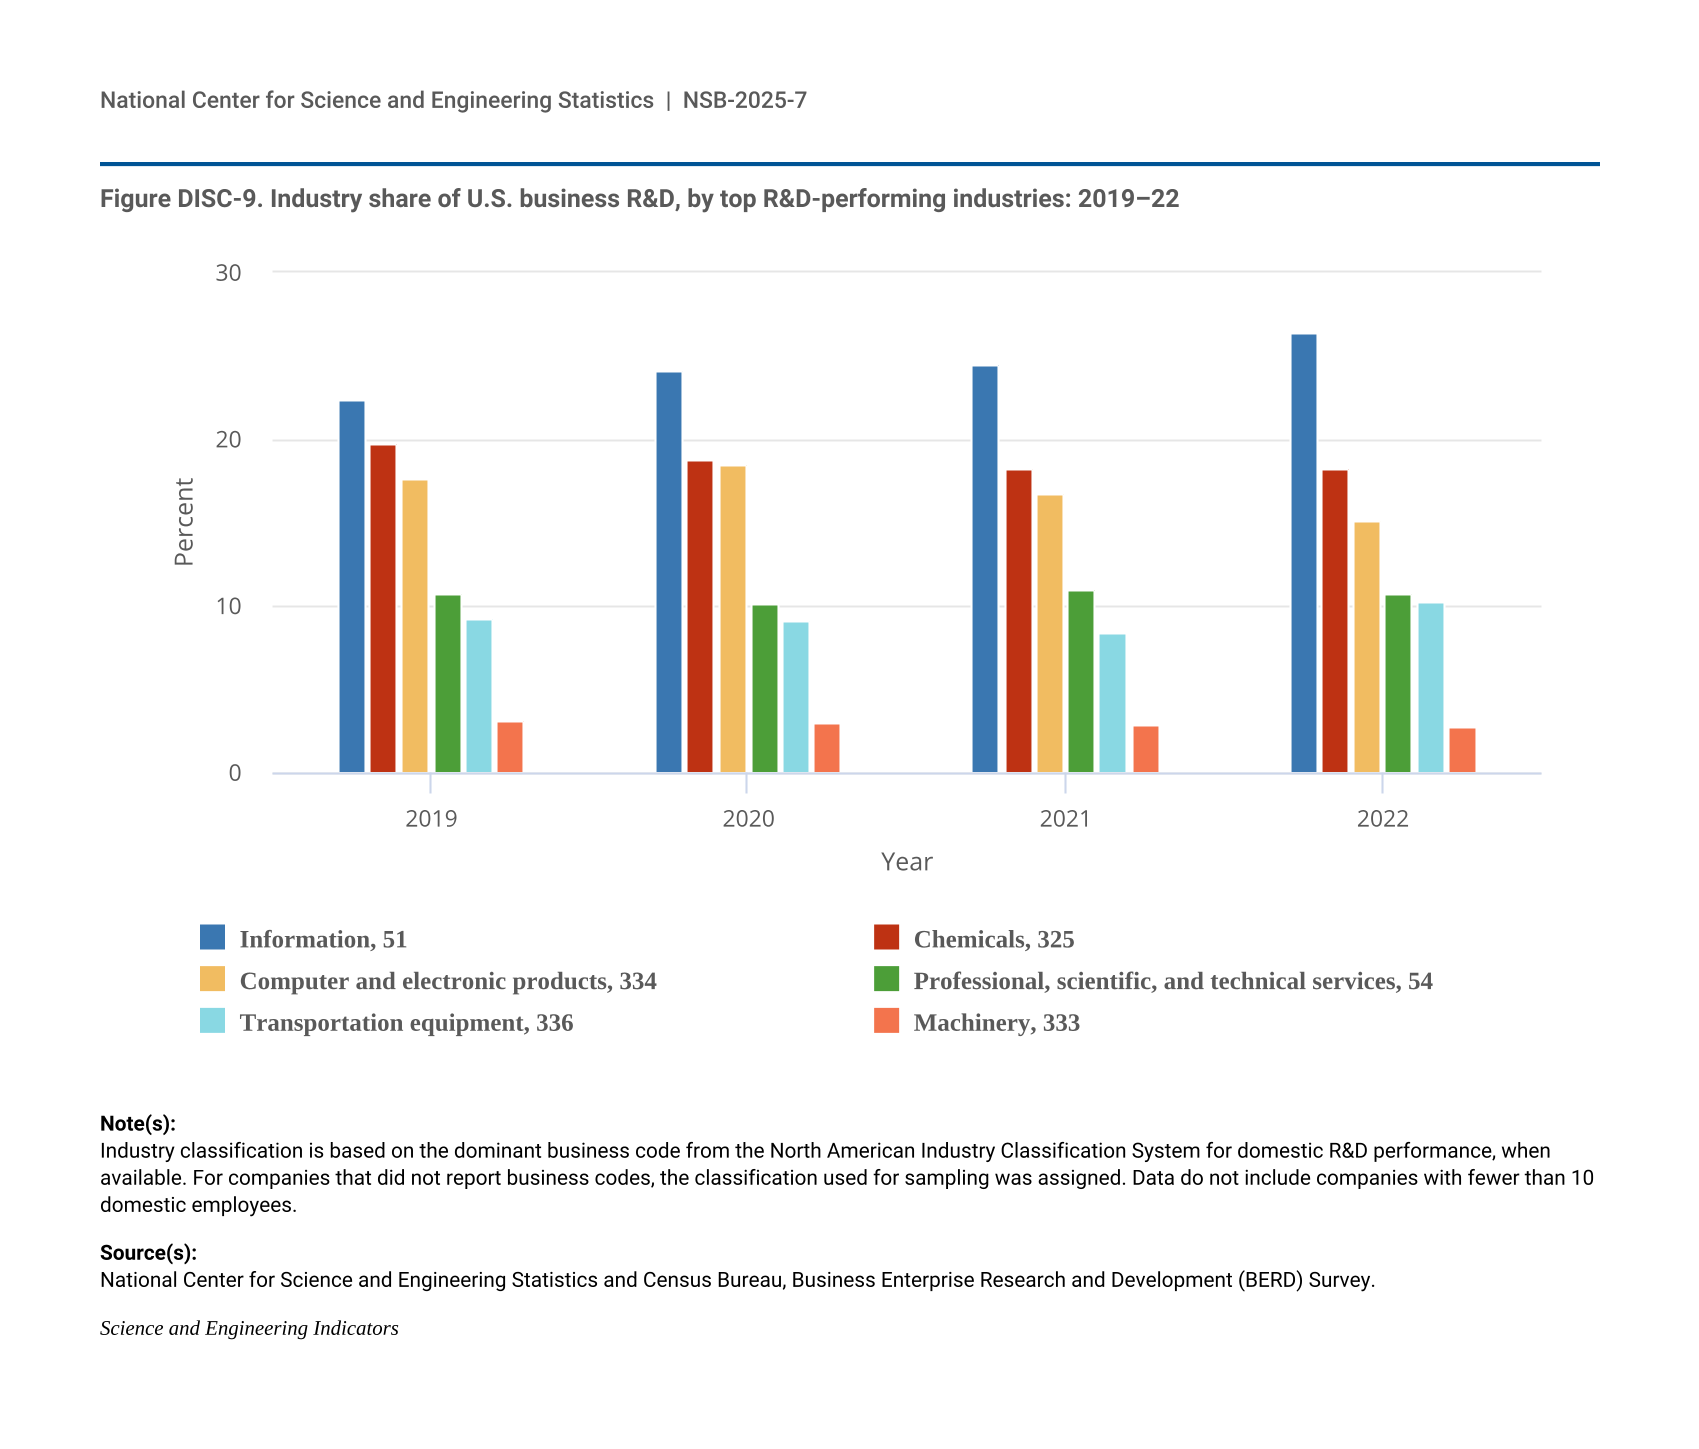
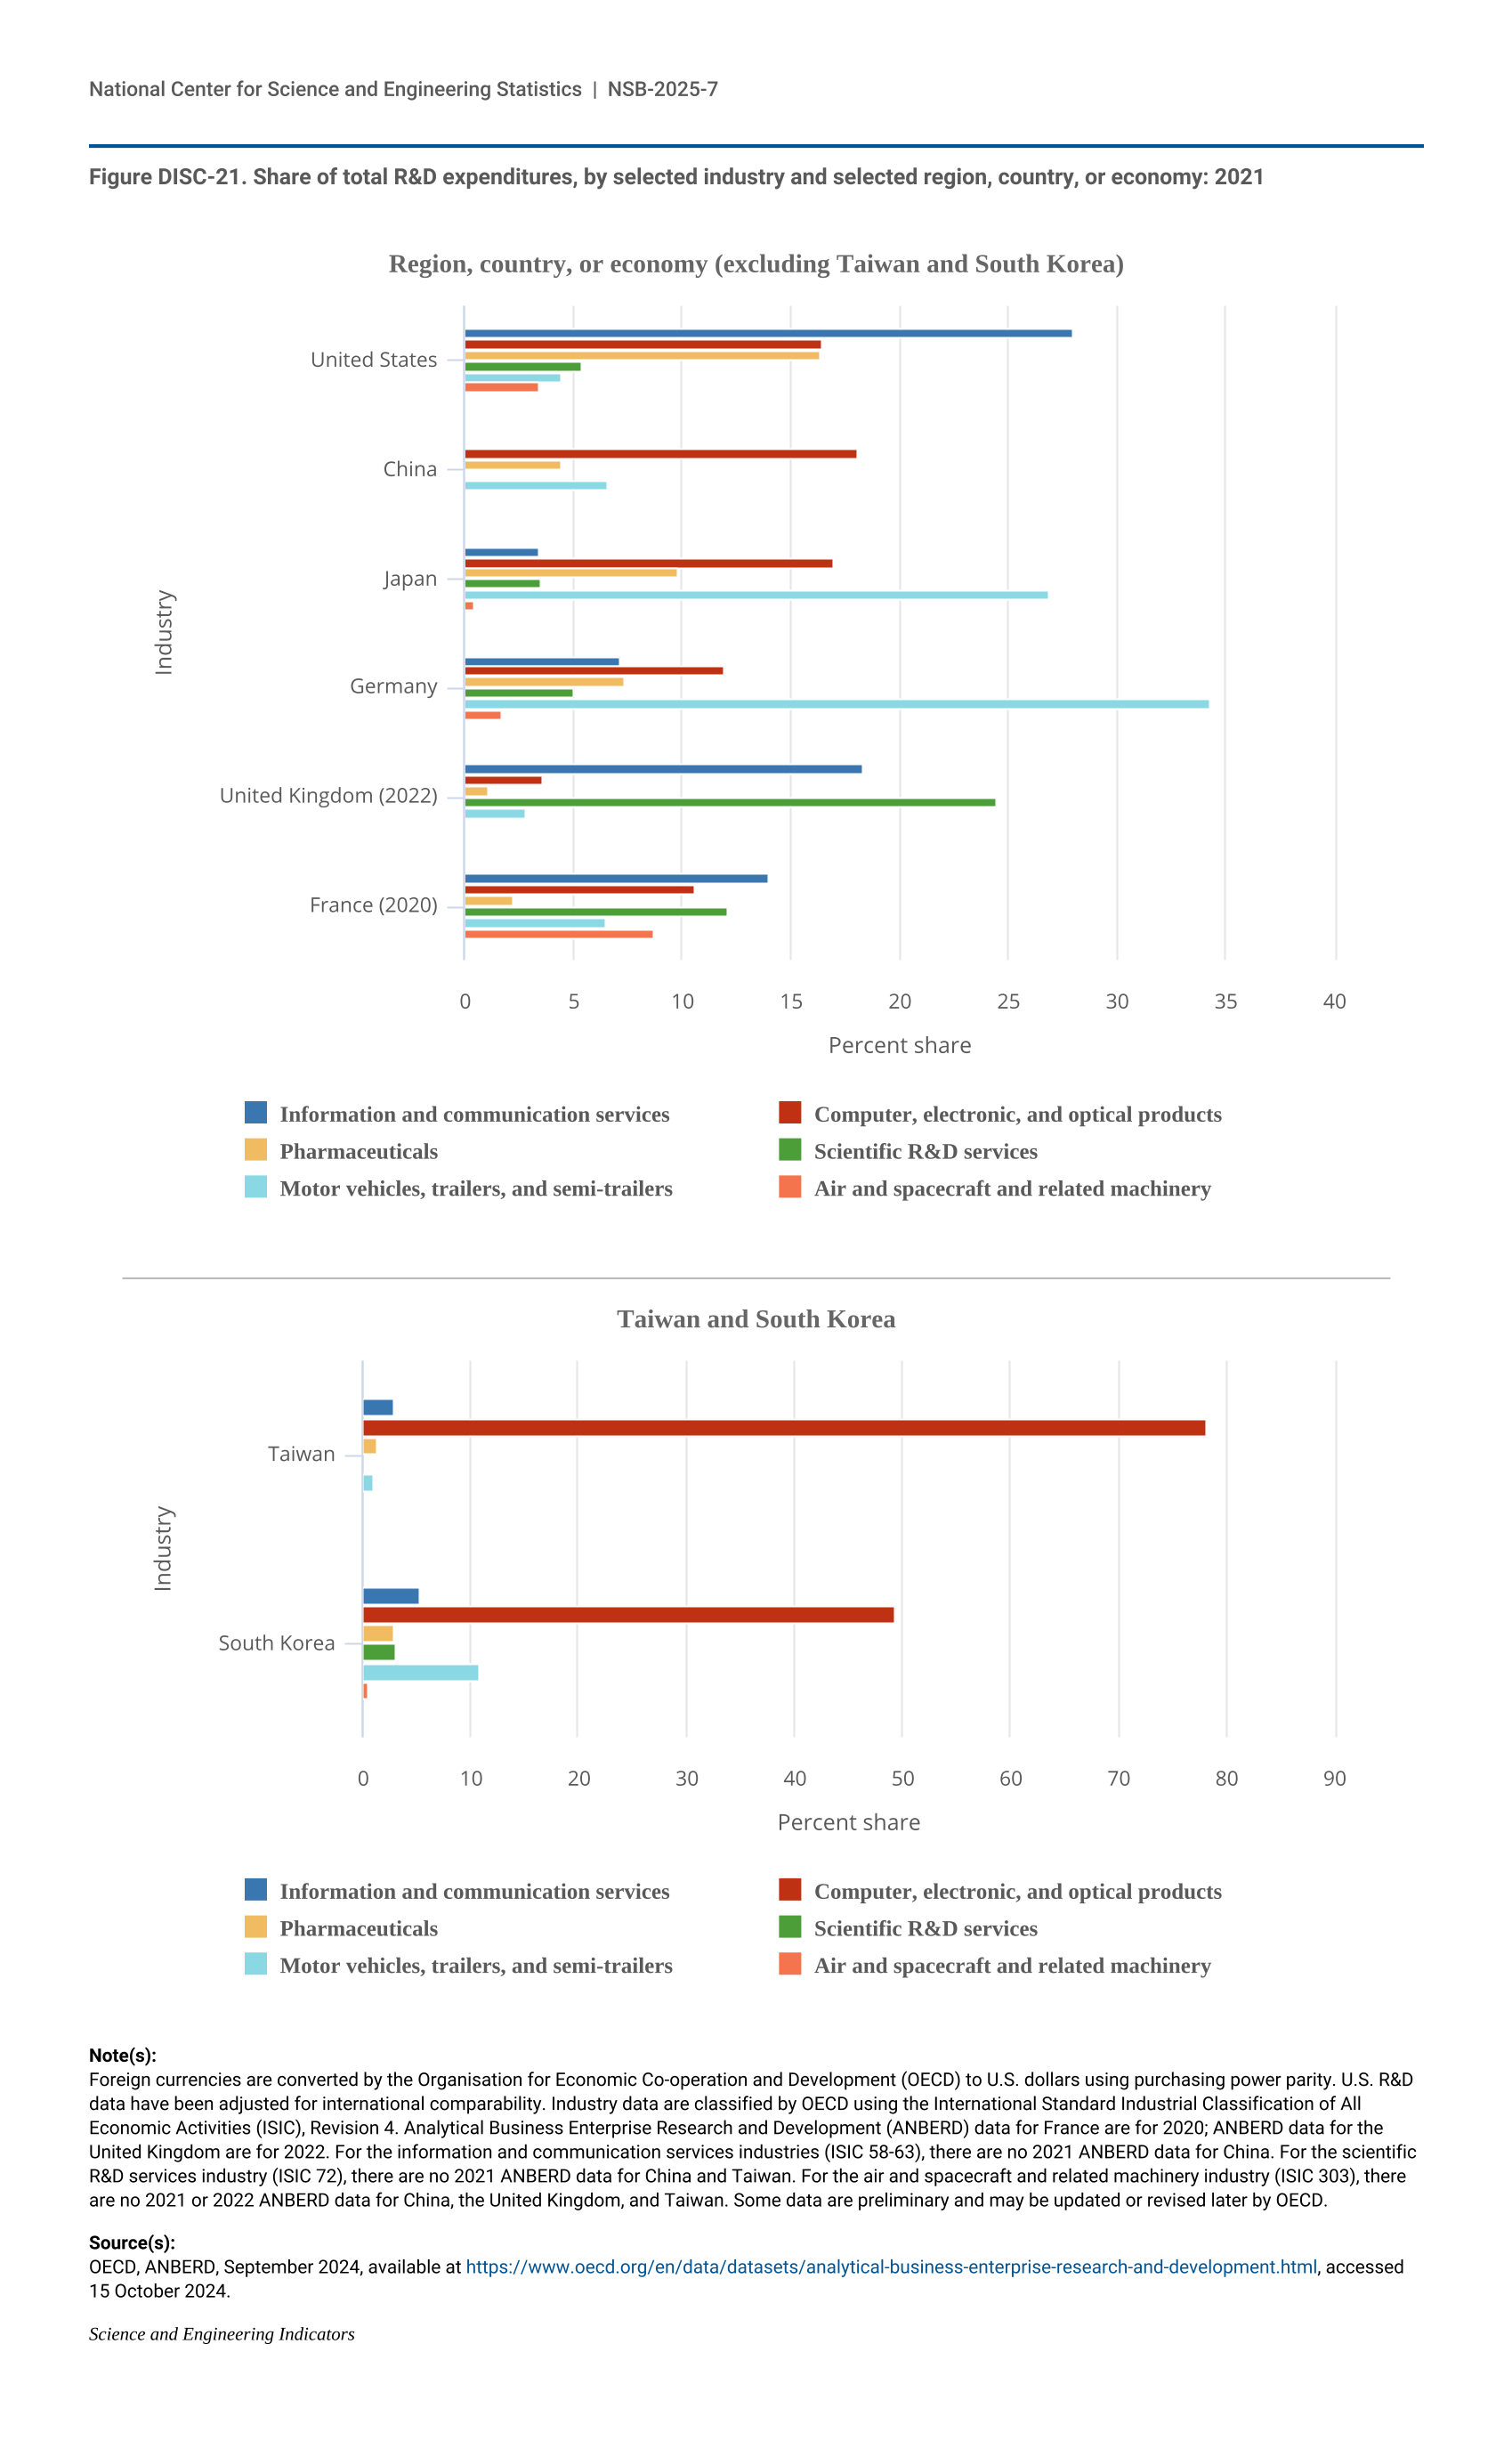
U.S. business sector R&D performed by companies with 10 or more domestic employees reached $692 billion in 2022. Business sector R&D focused on critical technologies, such as biotechnology, artificial intelligence (AI), and nanotechnology, was concentrated in specific industries.
- In 2022, about 80% of the $692 billion of U.S. business R&D performed by companies with 10 or more domestic employees occurred in 5 industries: information (26%); chemicals manufacturing (18%); computer and electronic products manufacturing (including semiconductors) (15%); professional, scientific, and technical services (11%); and transportation equipment manufacturing (10%).
- In 2022, domestic software R&D performed in any industry accounted for 42% ($292 billion) of U.S. R&D performed by businesses with 10 or more domestic employees.
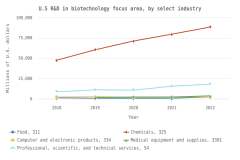
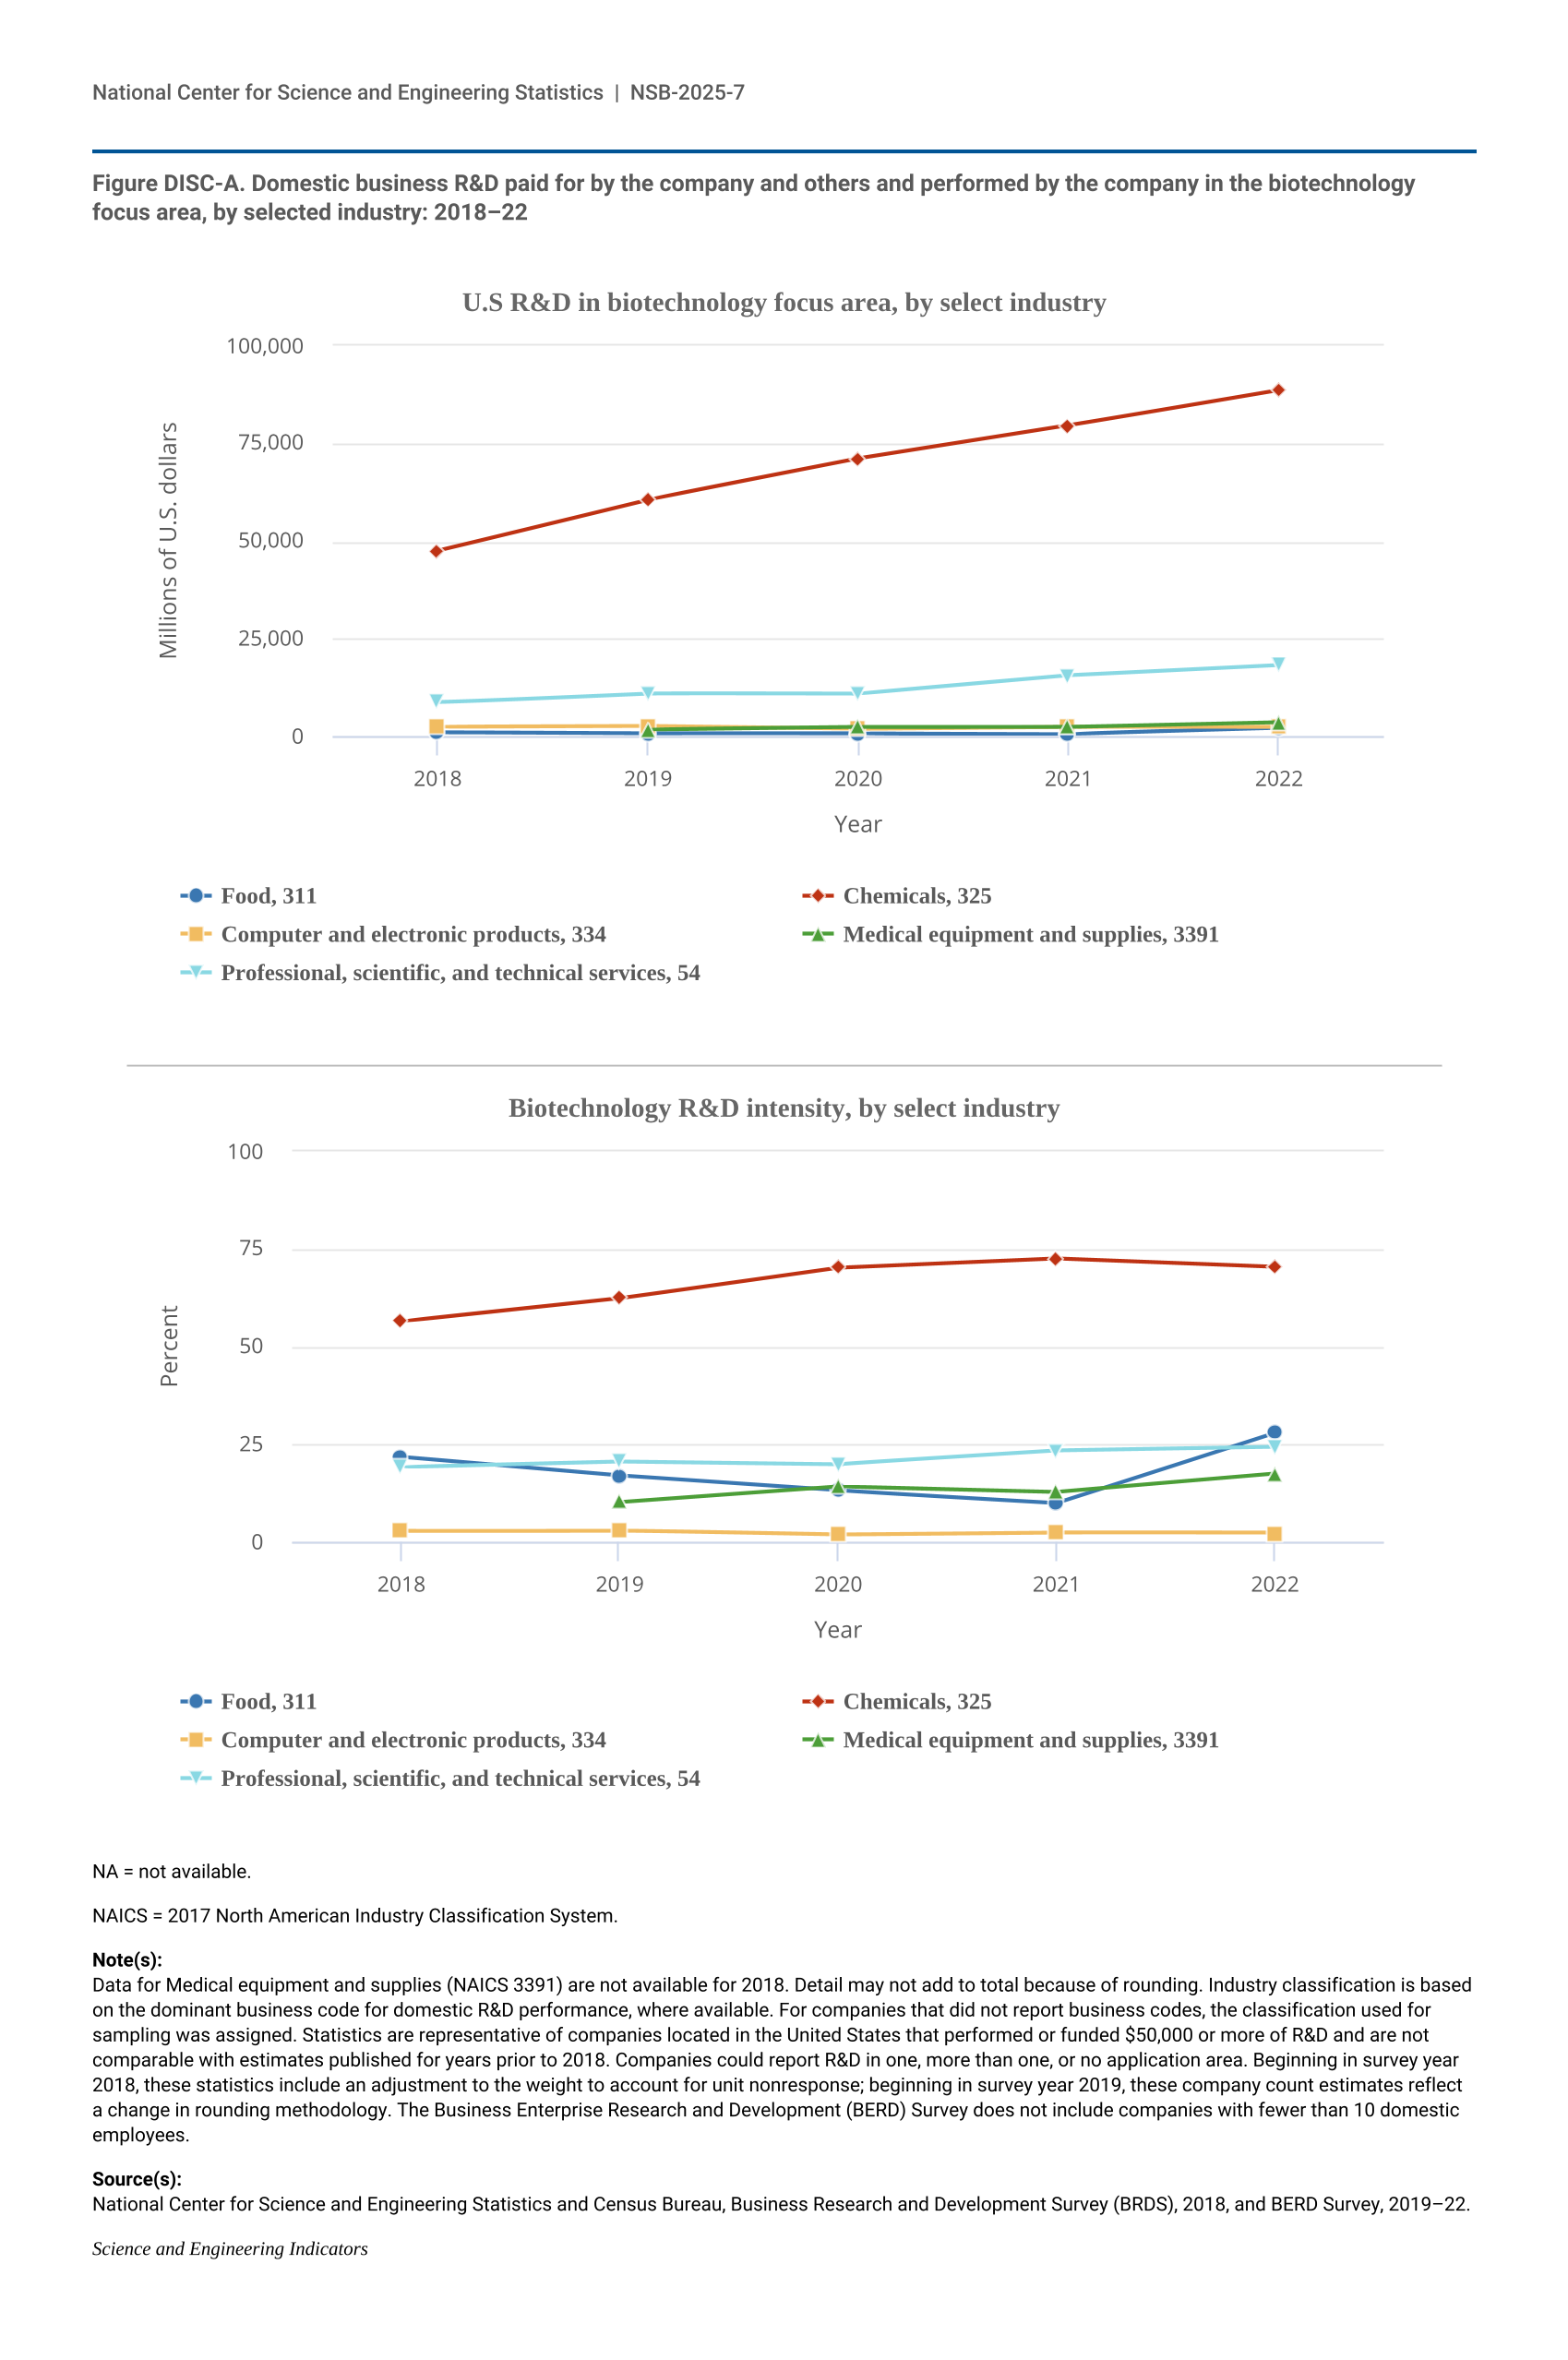
- Biotechnology R&D accounted for 17% of total U.S. business R&D performed by businesses with 10 or more domestic employees in 2022. Three-fourths (75%, or $87 billion) of biotechnology-focused R&D was performed within the pharmaceuticals and medicine manufacturing industry.
- U.S. businesses with 10 or more domestic employees performed $37 billion of R&D in the AI technology focus area in 2022, and 43% of AI R&D was performed in the information industry.
- Nanotechnology R&D accounted for only 5% of total U.S. business R&D performed by businesses with 10 or more domestic employees but made up 58% ($29 billion) of the R&D performed by the semiconductor manufacturing industry.
Global Research Publications
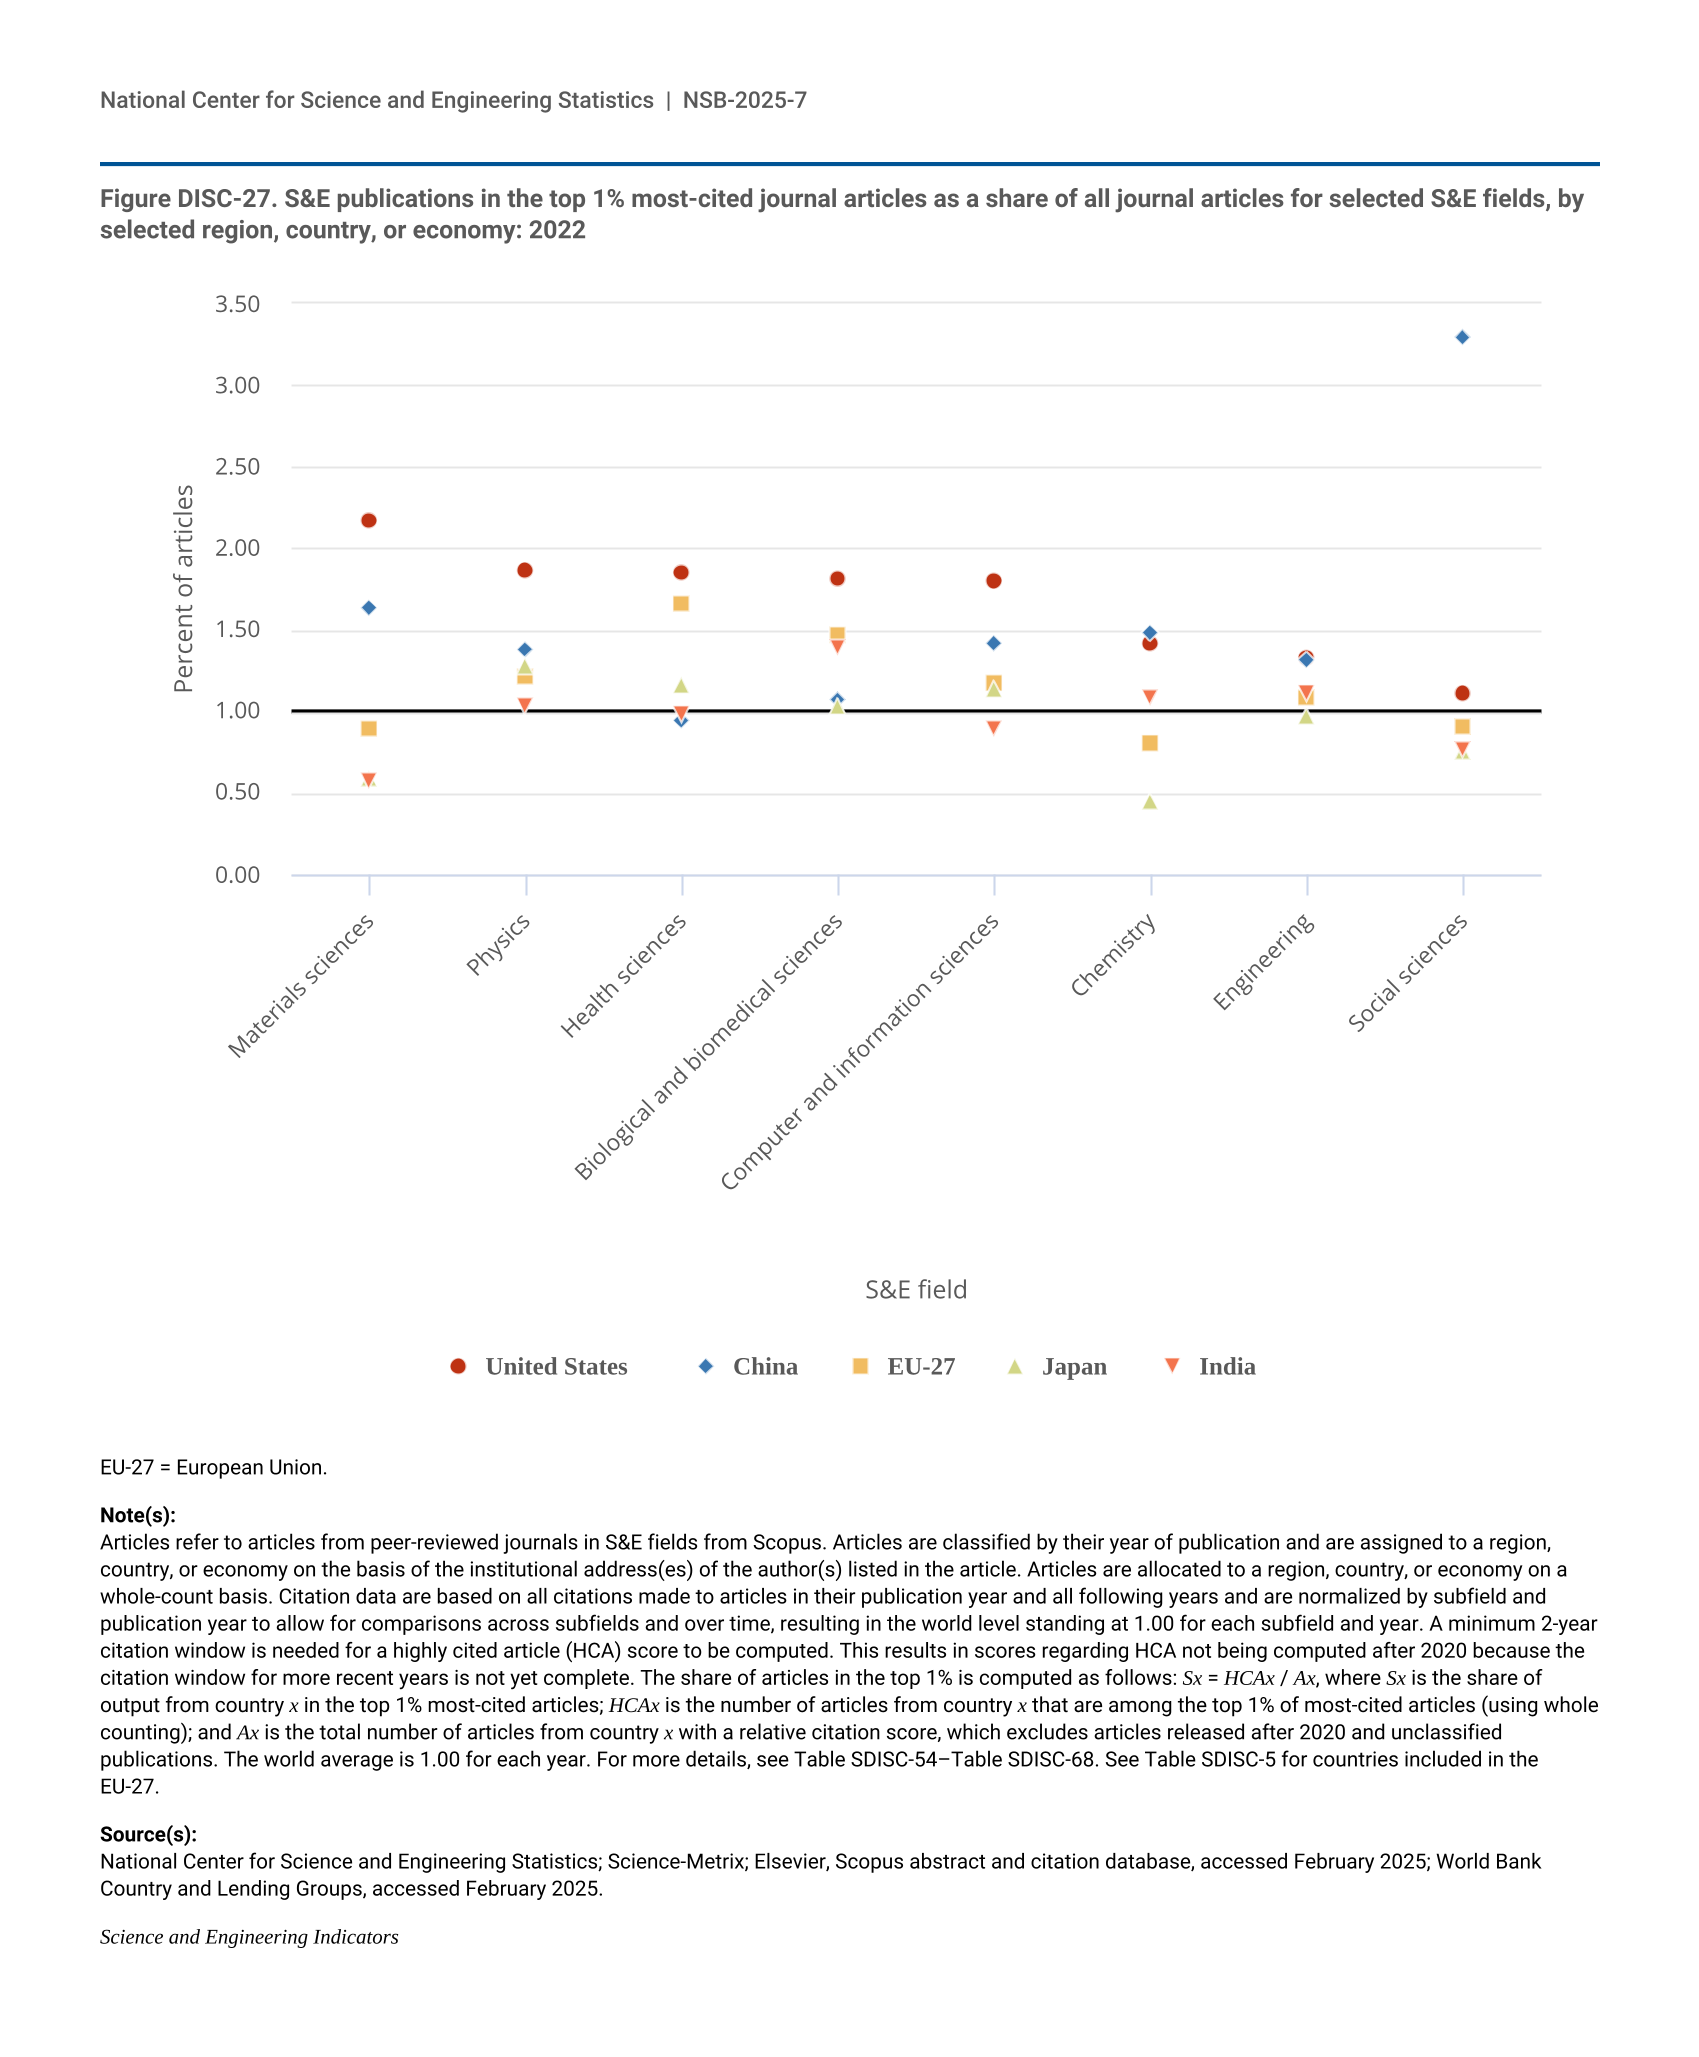
The United States maintained its position as a leading global producer of high-quality scientific research, demonstrating strength in research impact with high shares of highly cited publications in most S&E fields. However, China’s gross publication output and growth outpaced those of the United States.
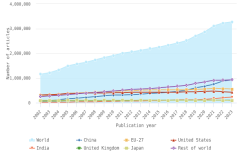
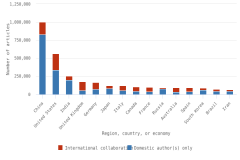
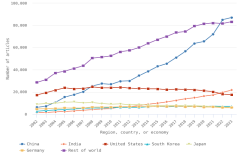
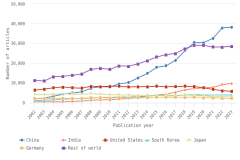
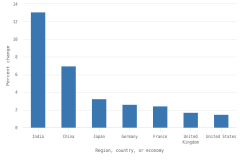
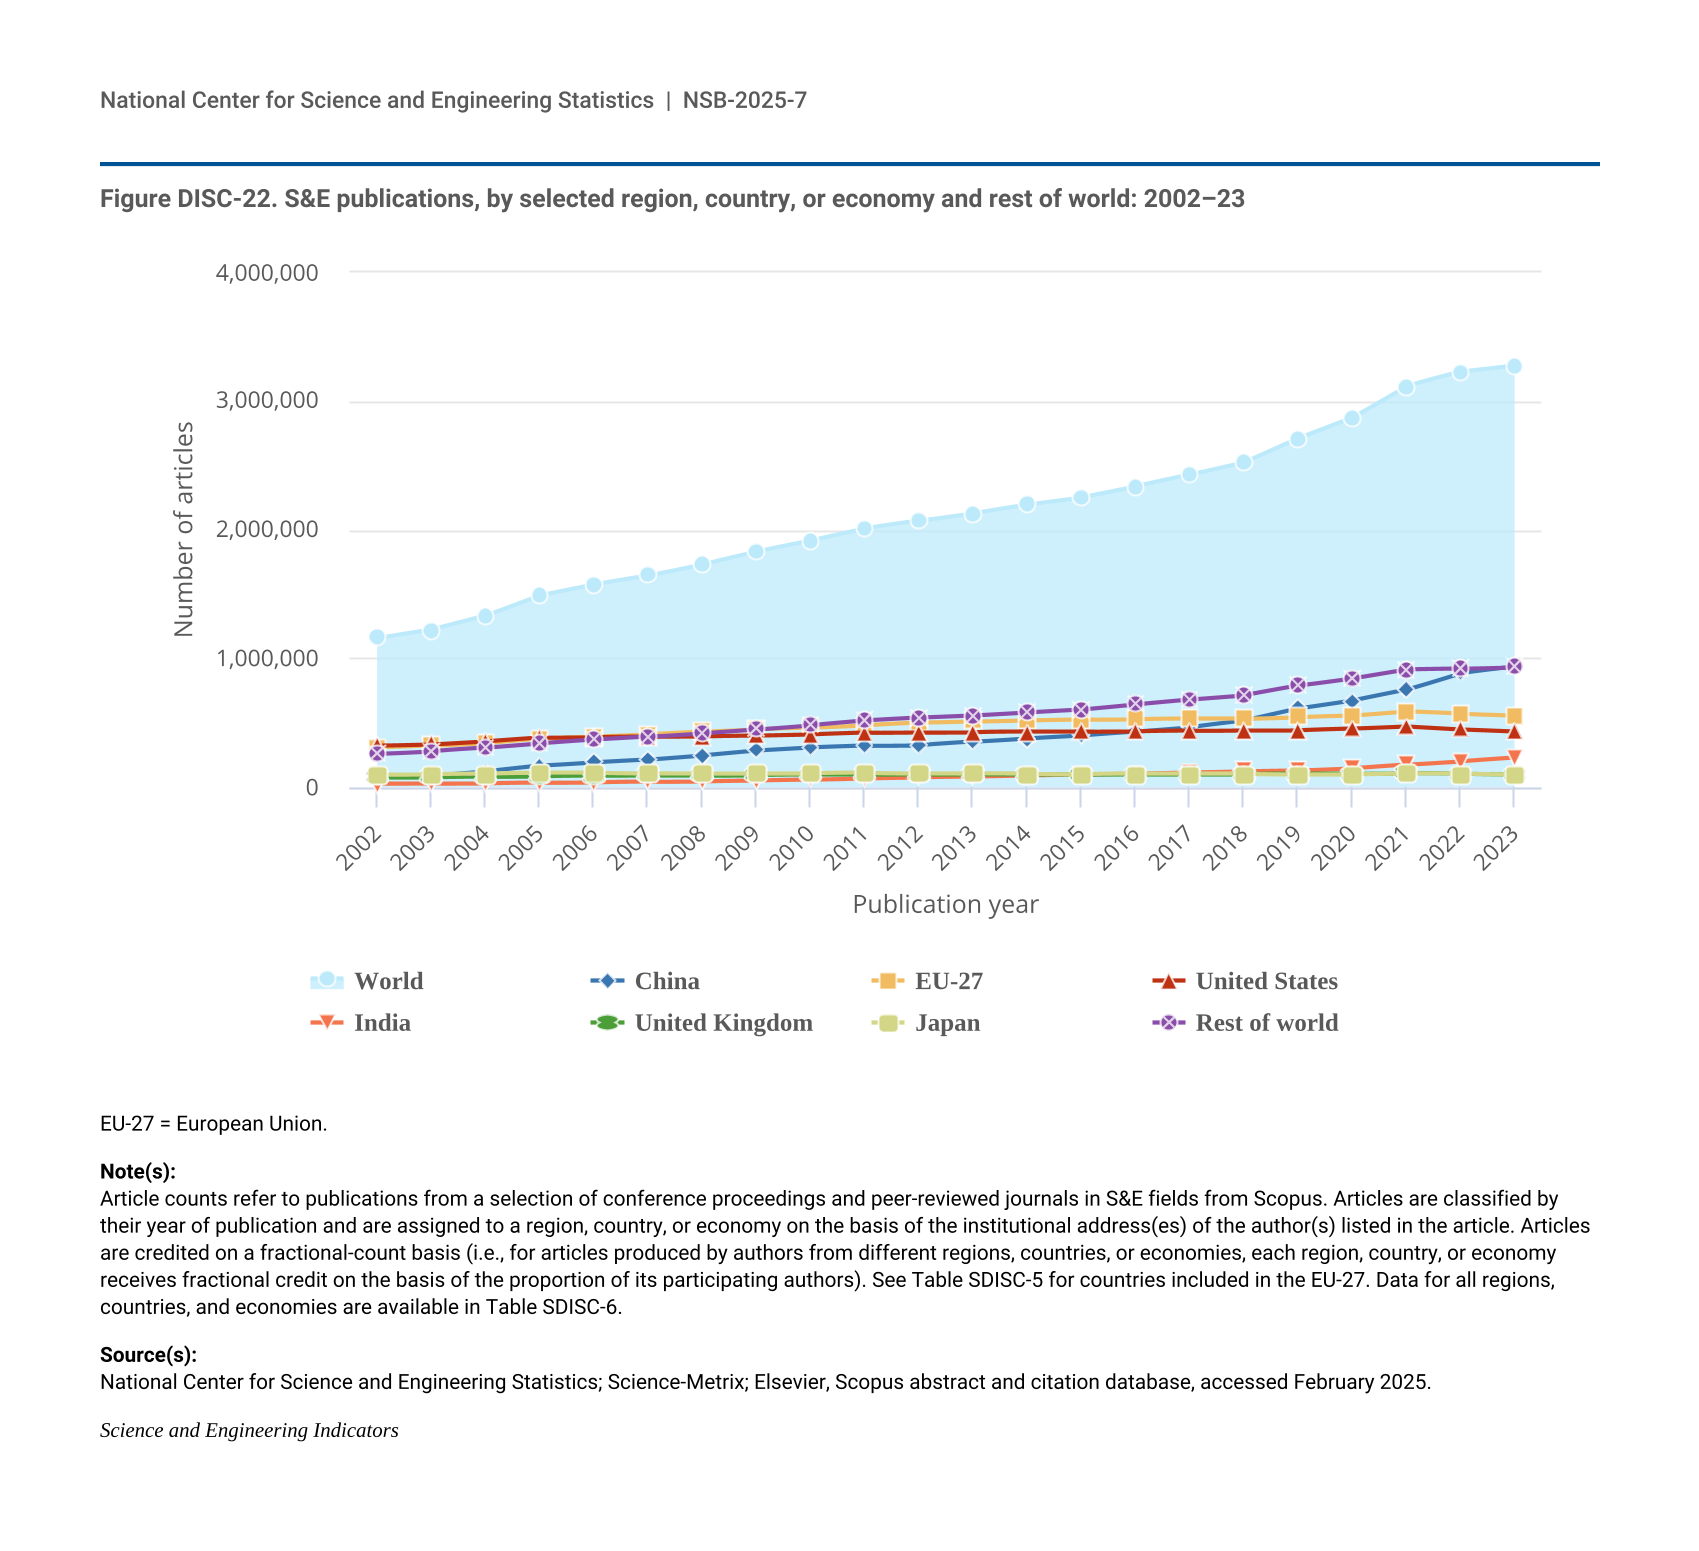
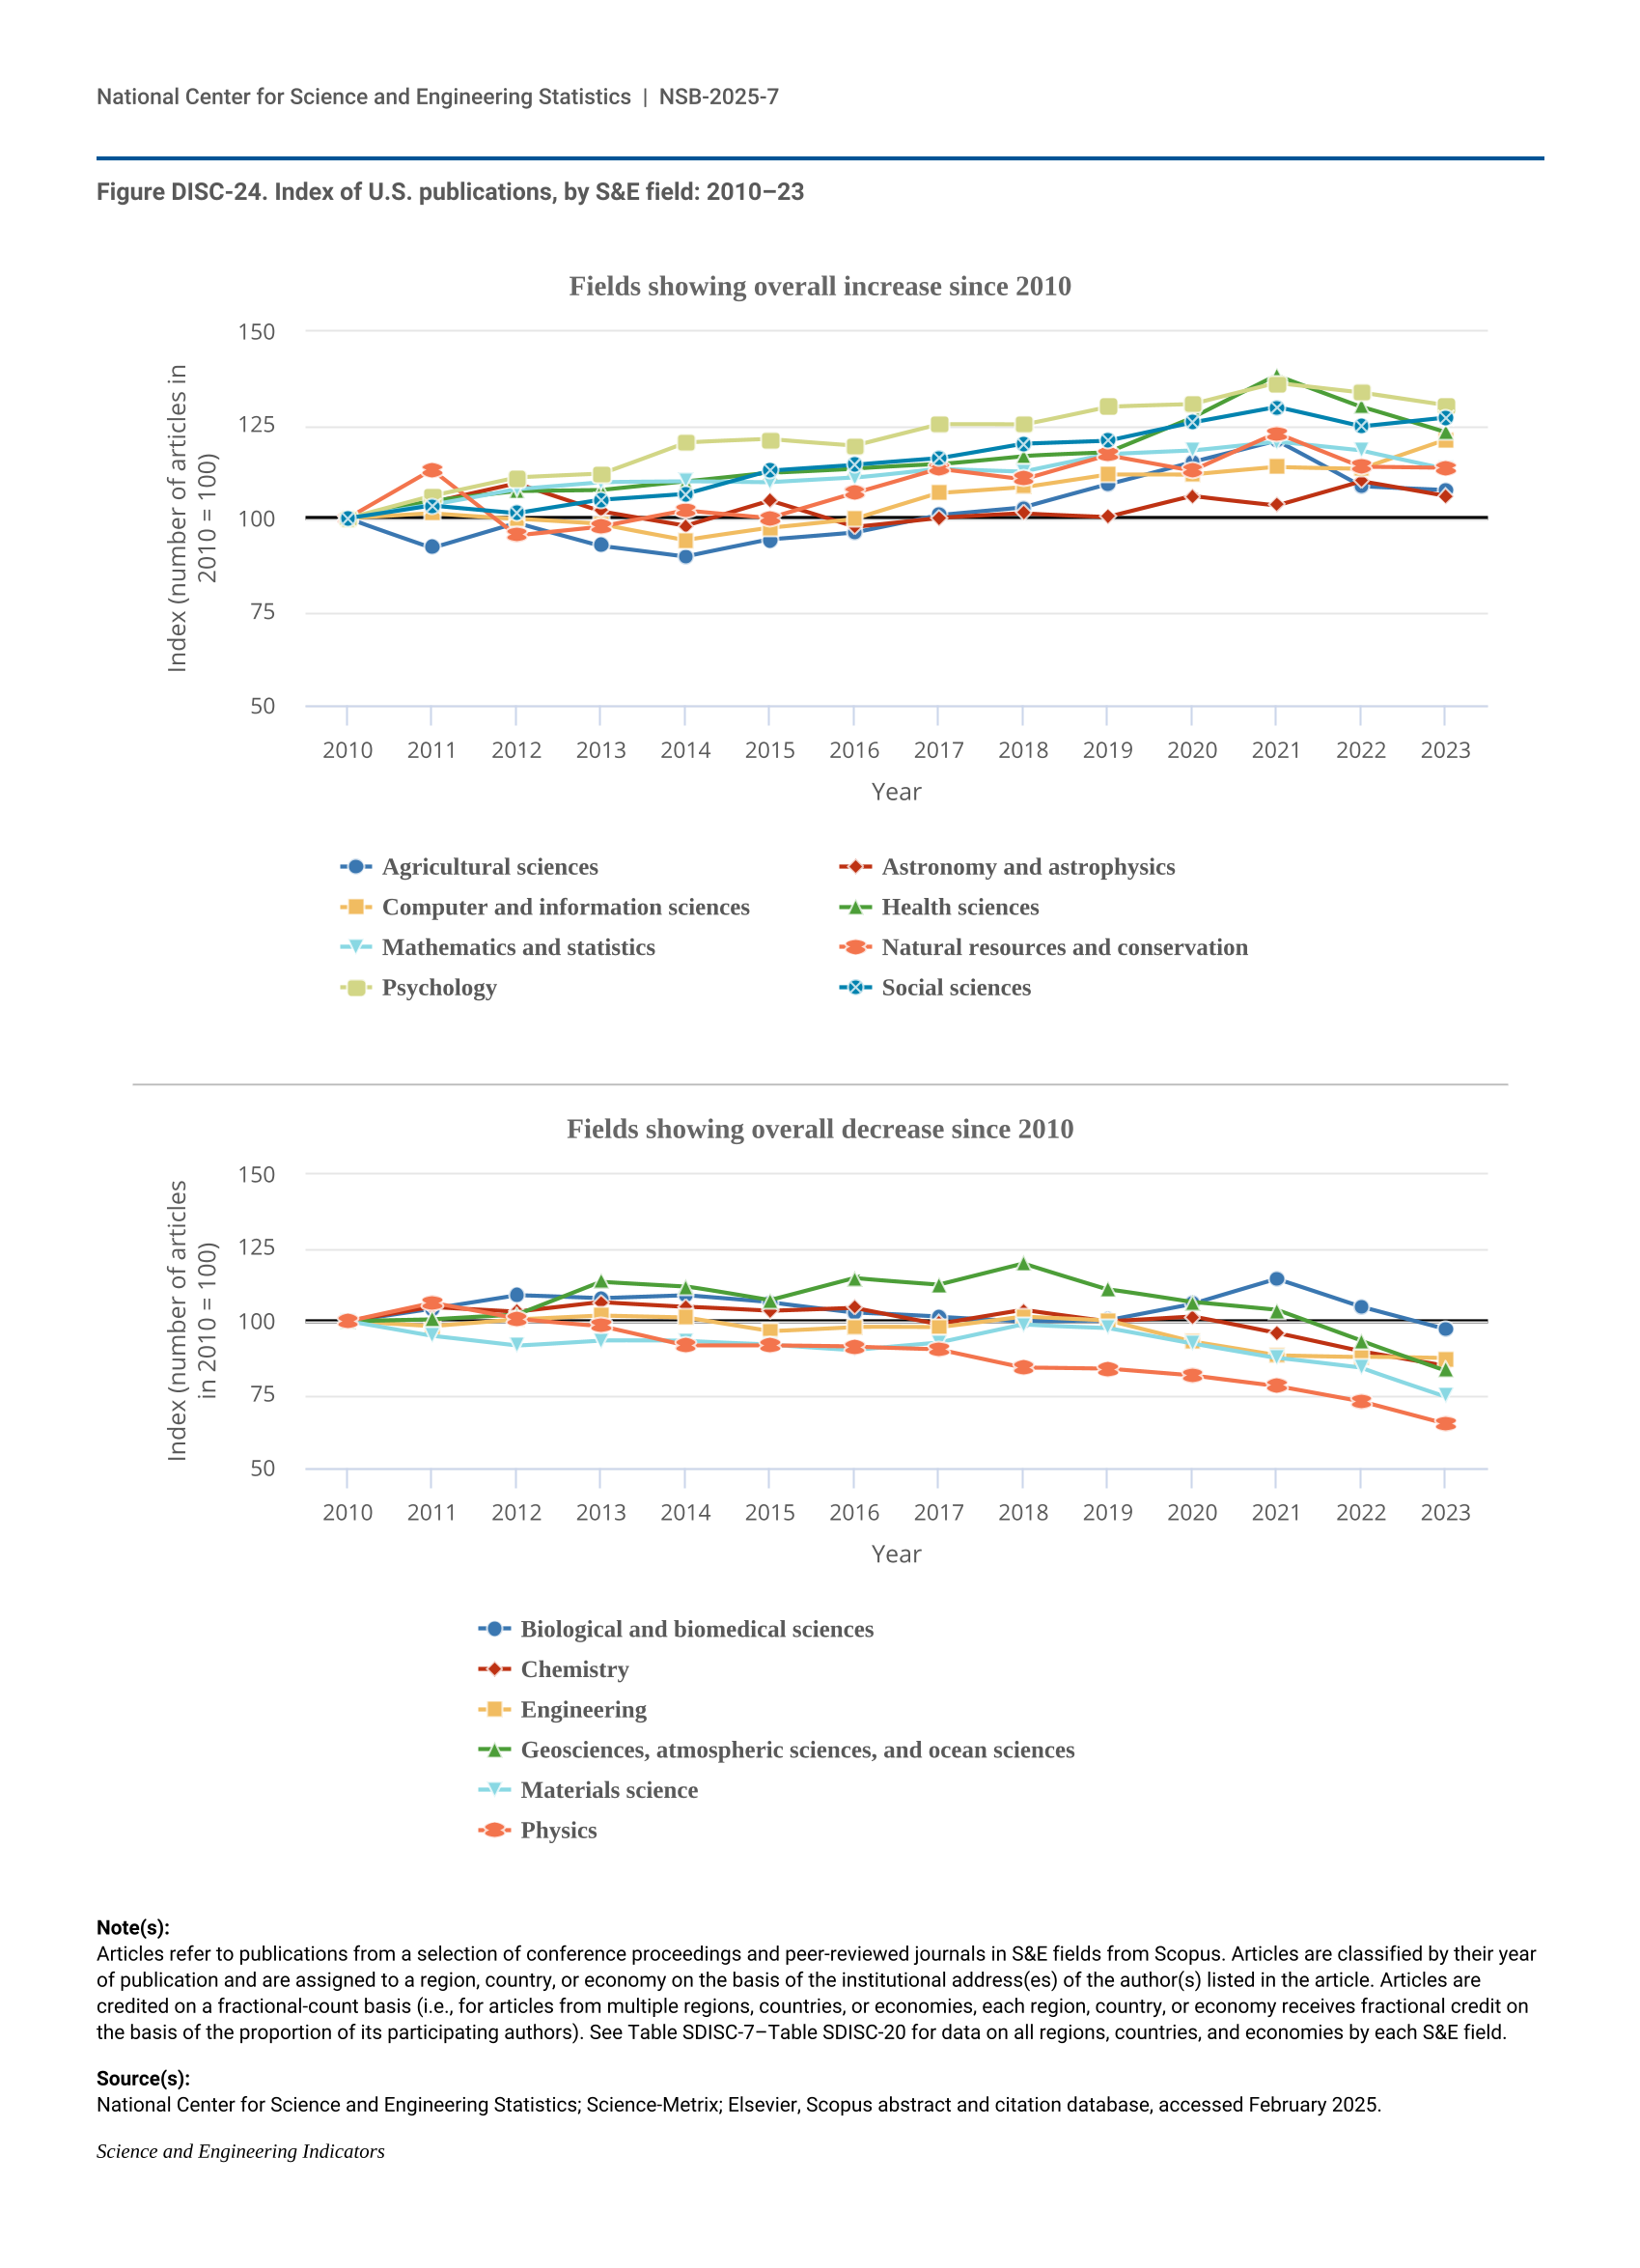
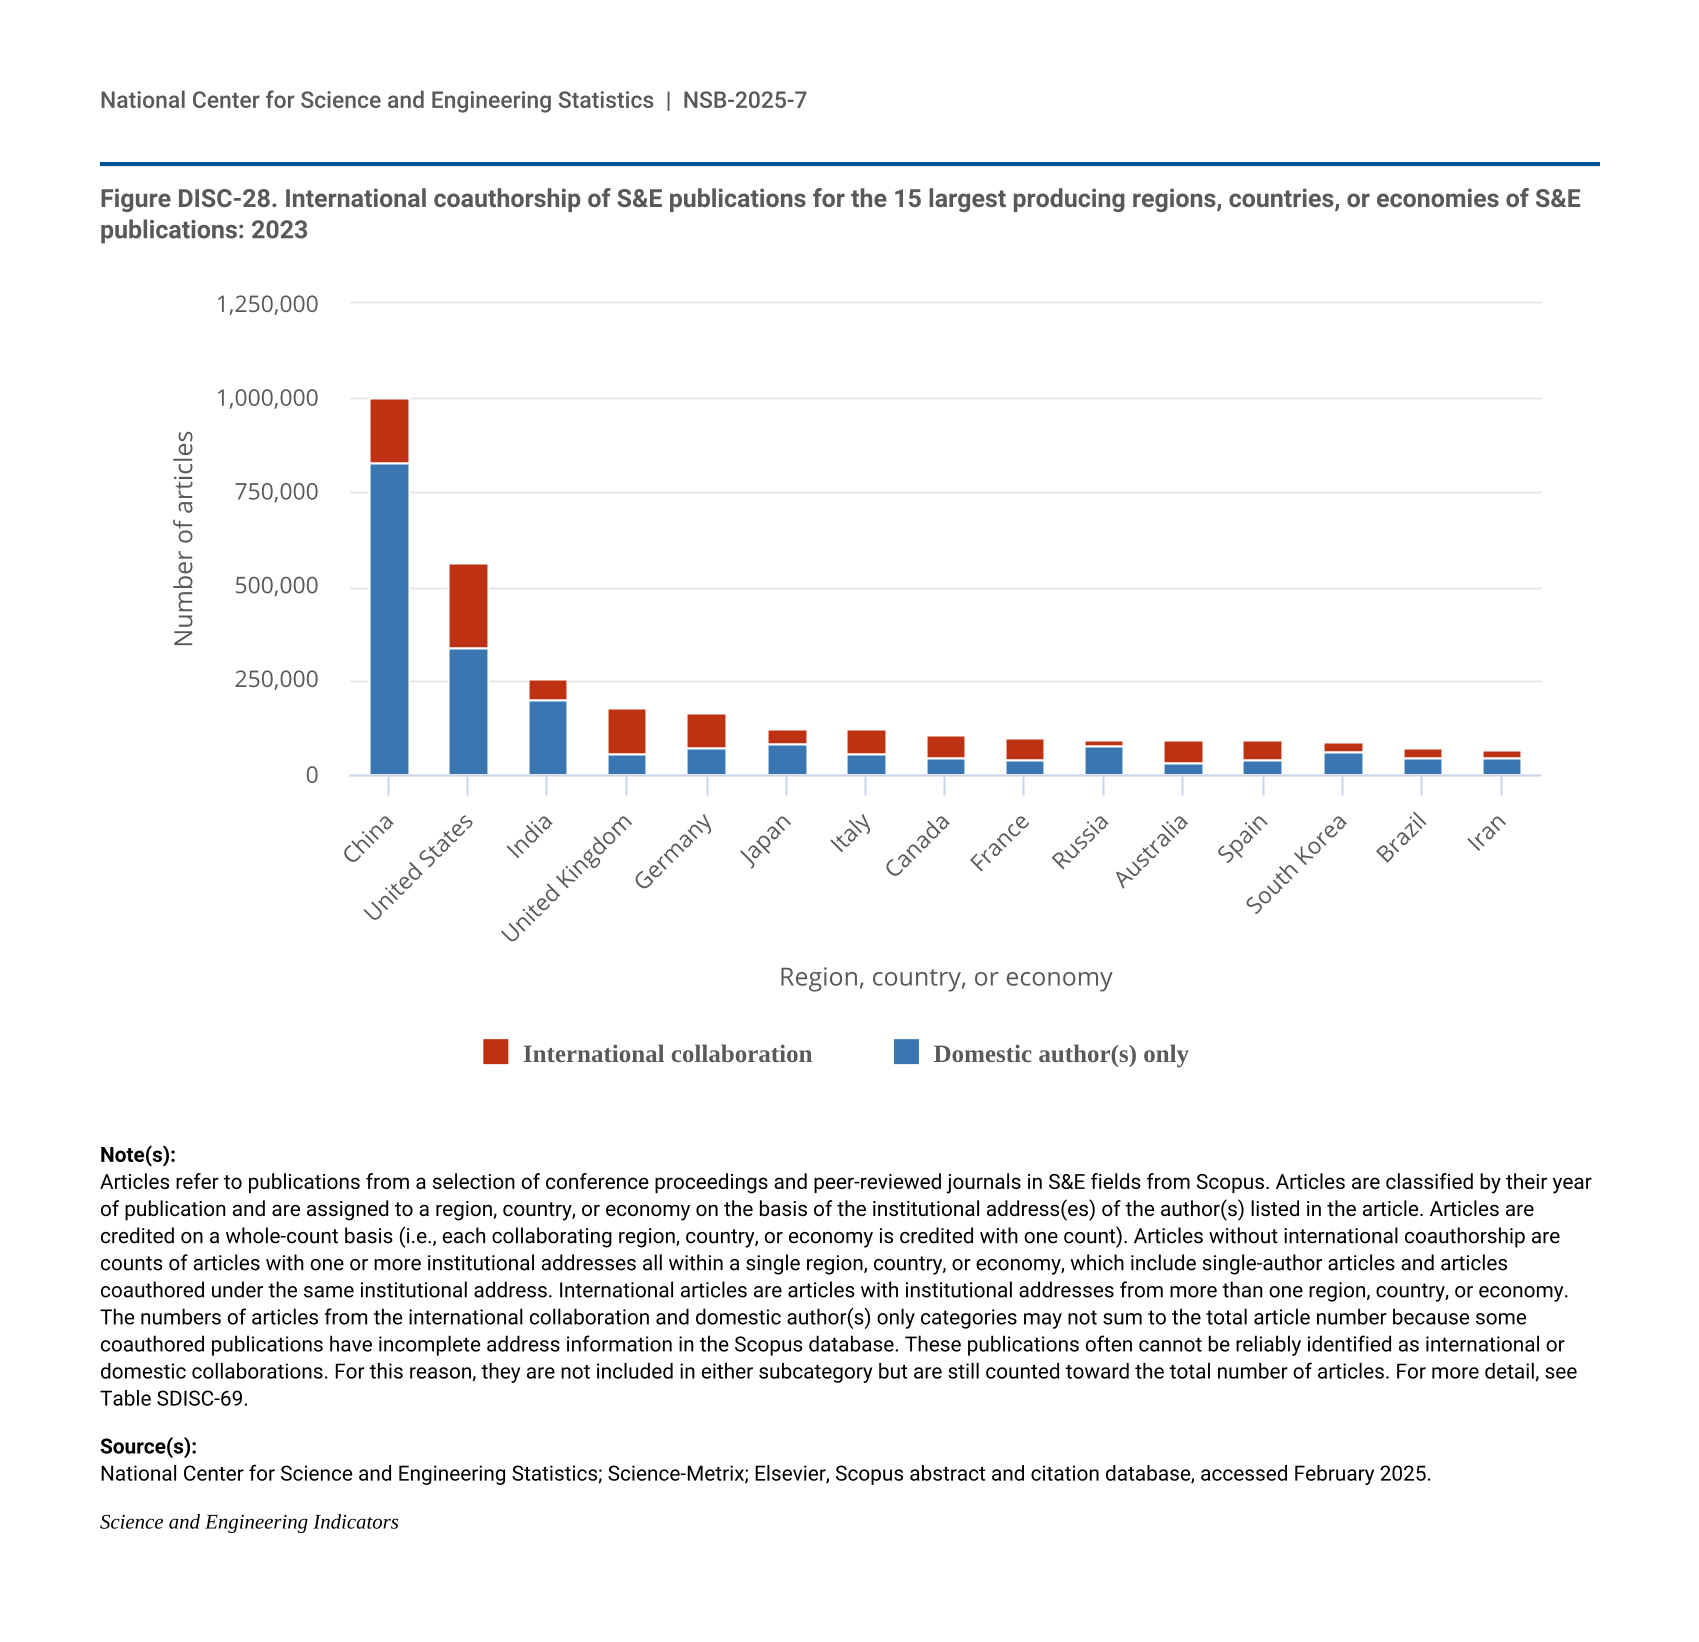
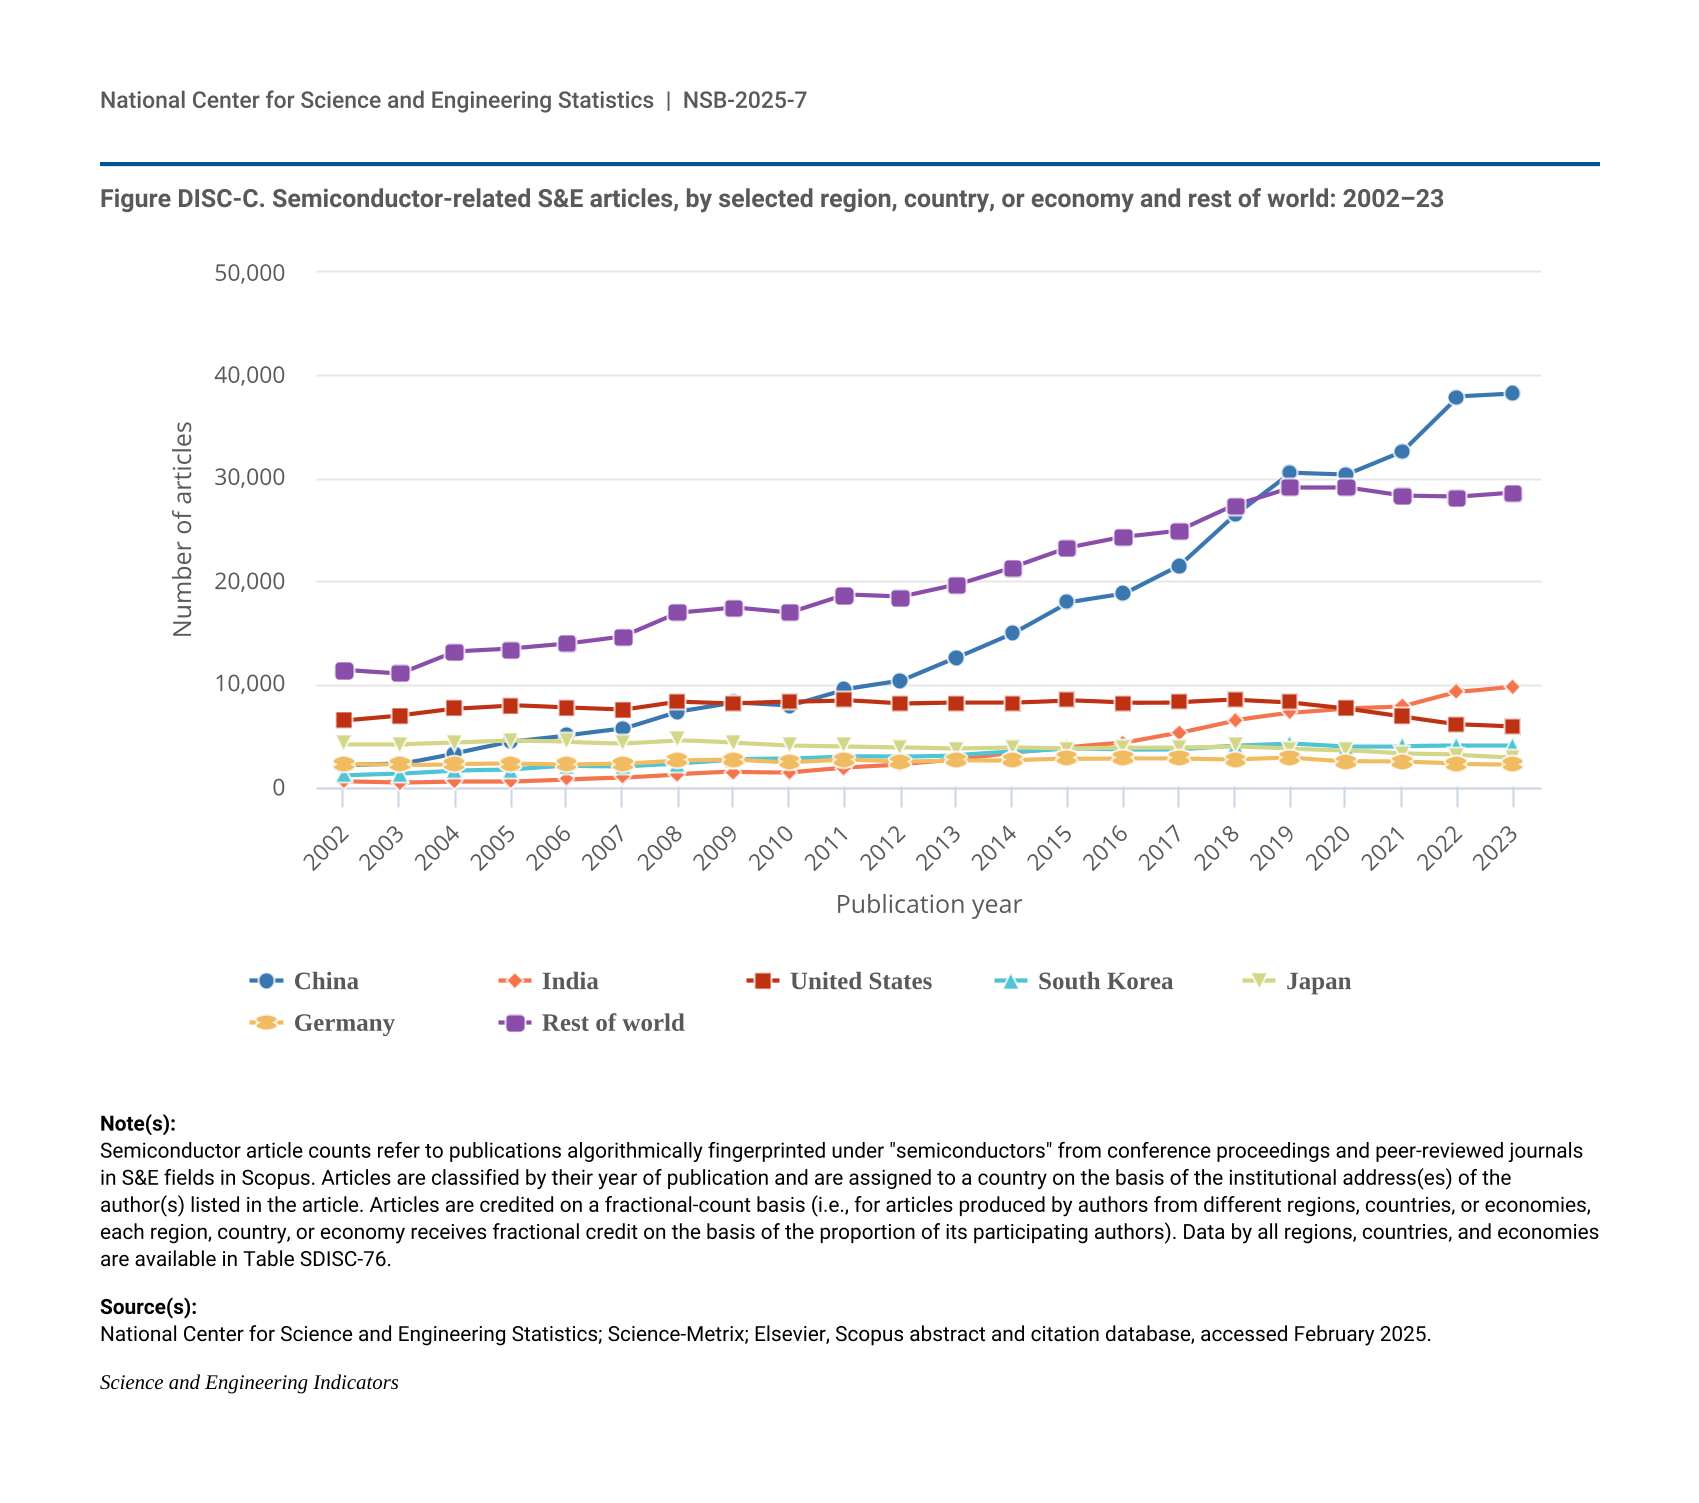
- In 2023, four countries each produced more than 100,000 peer-reviewed articles; combined, these countries accounted for over 50% of worldwide article output: China, the largest producer, followed by the United States, India, and Germany.
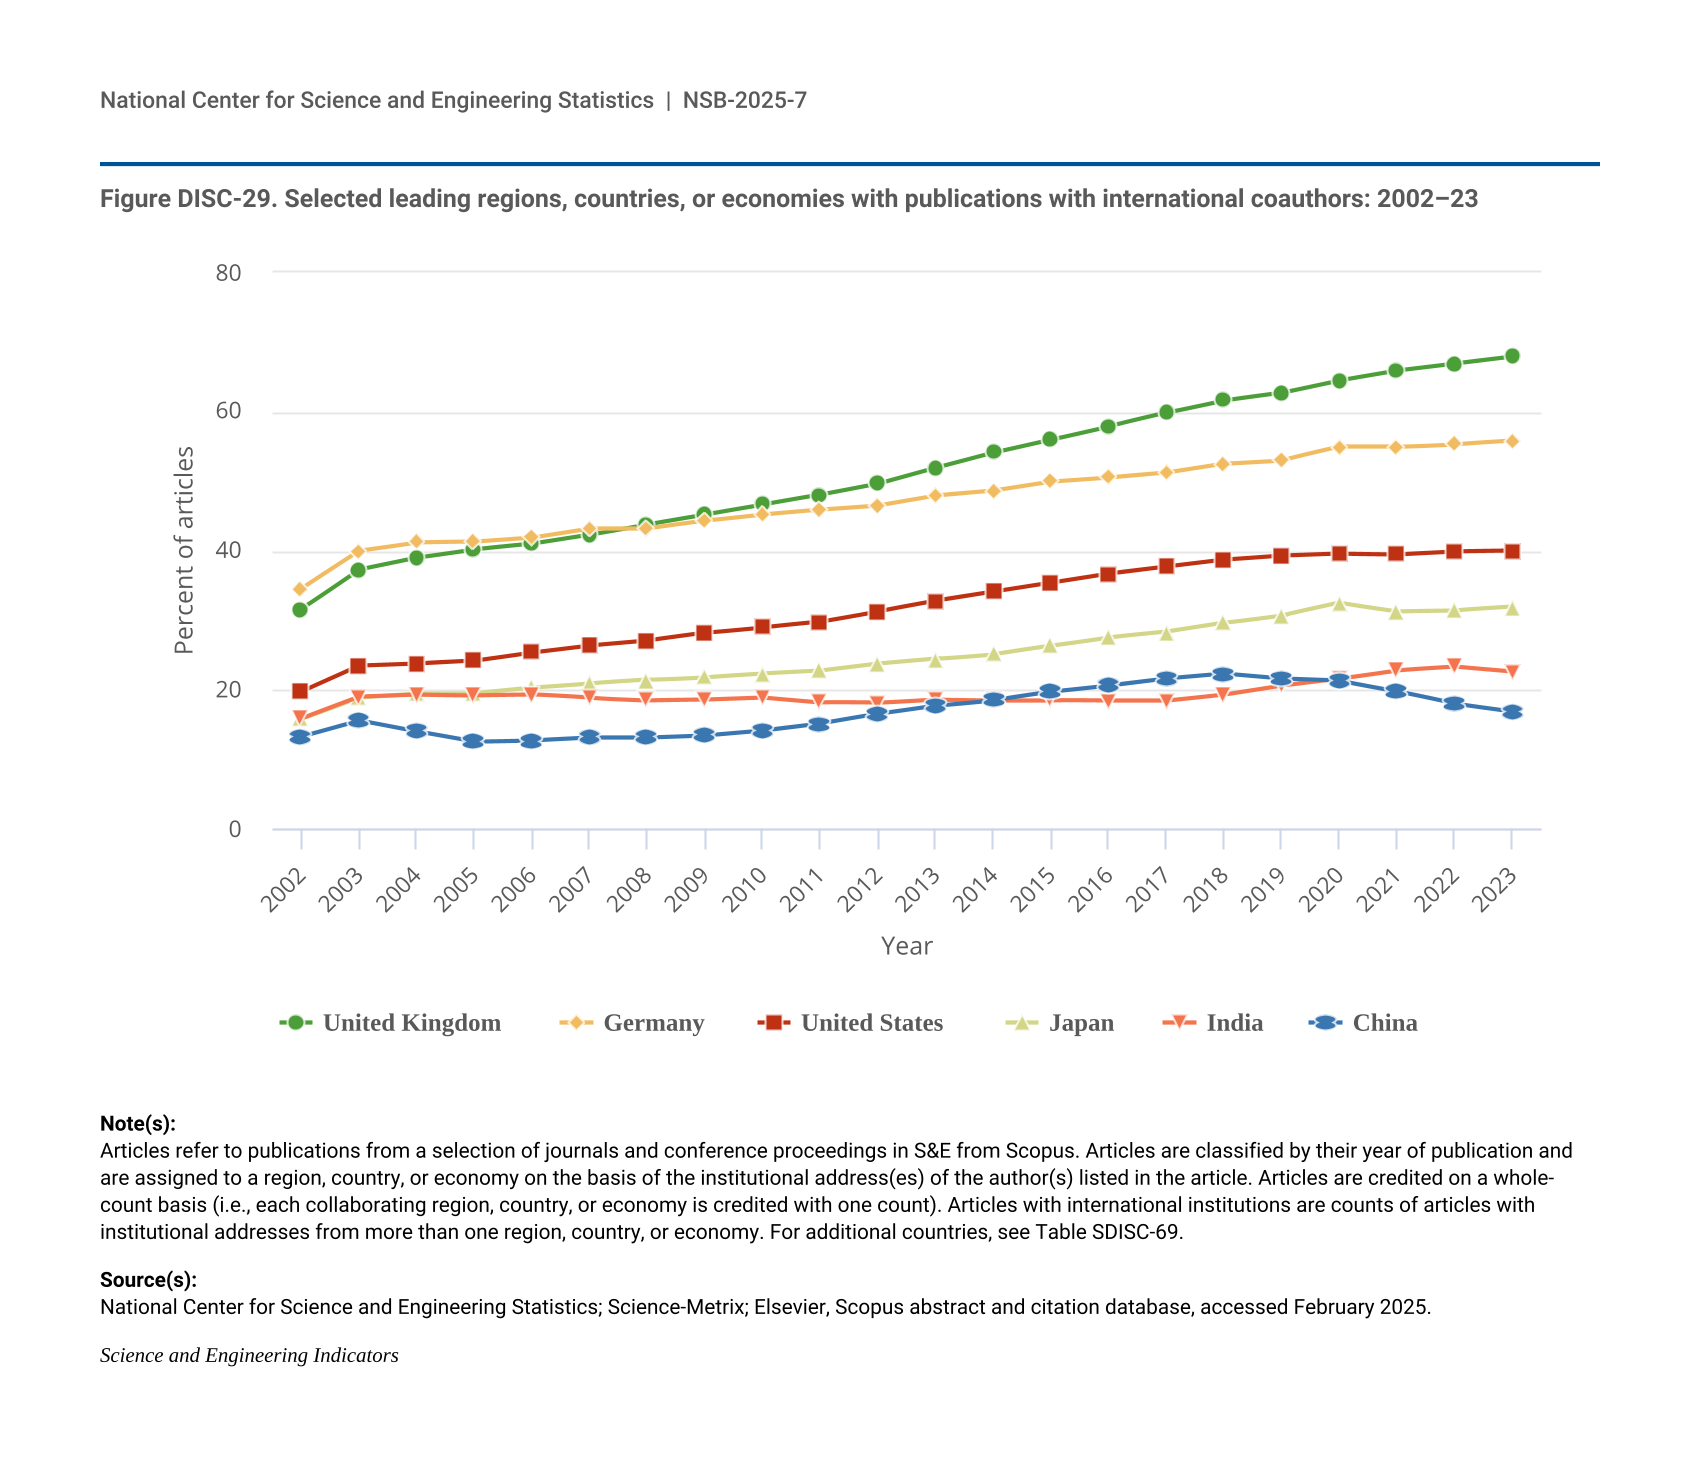
- China’s publication output has grown rapidly since 2003 and is now more than twice that of the United States.
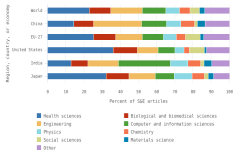
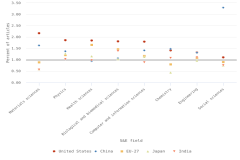
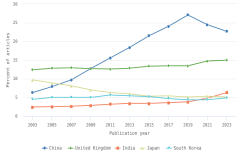
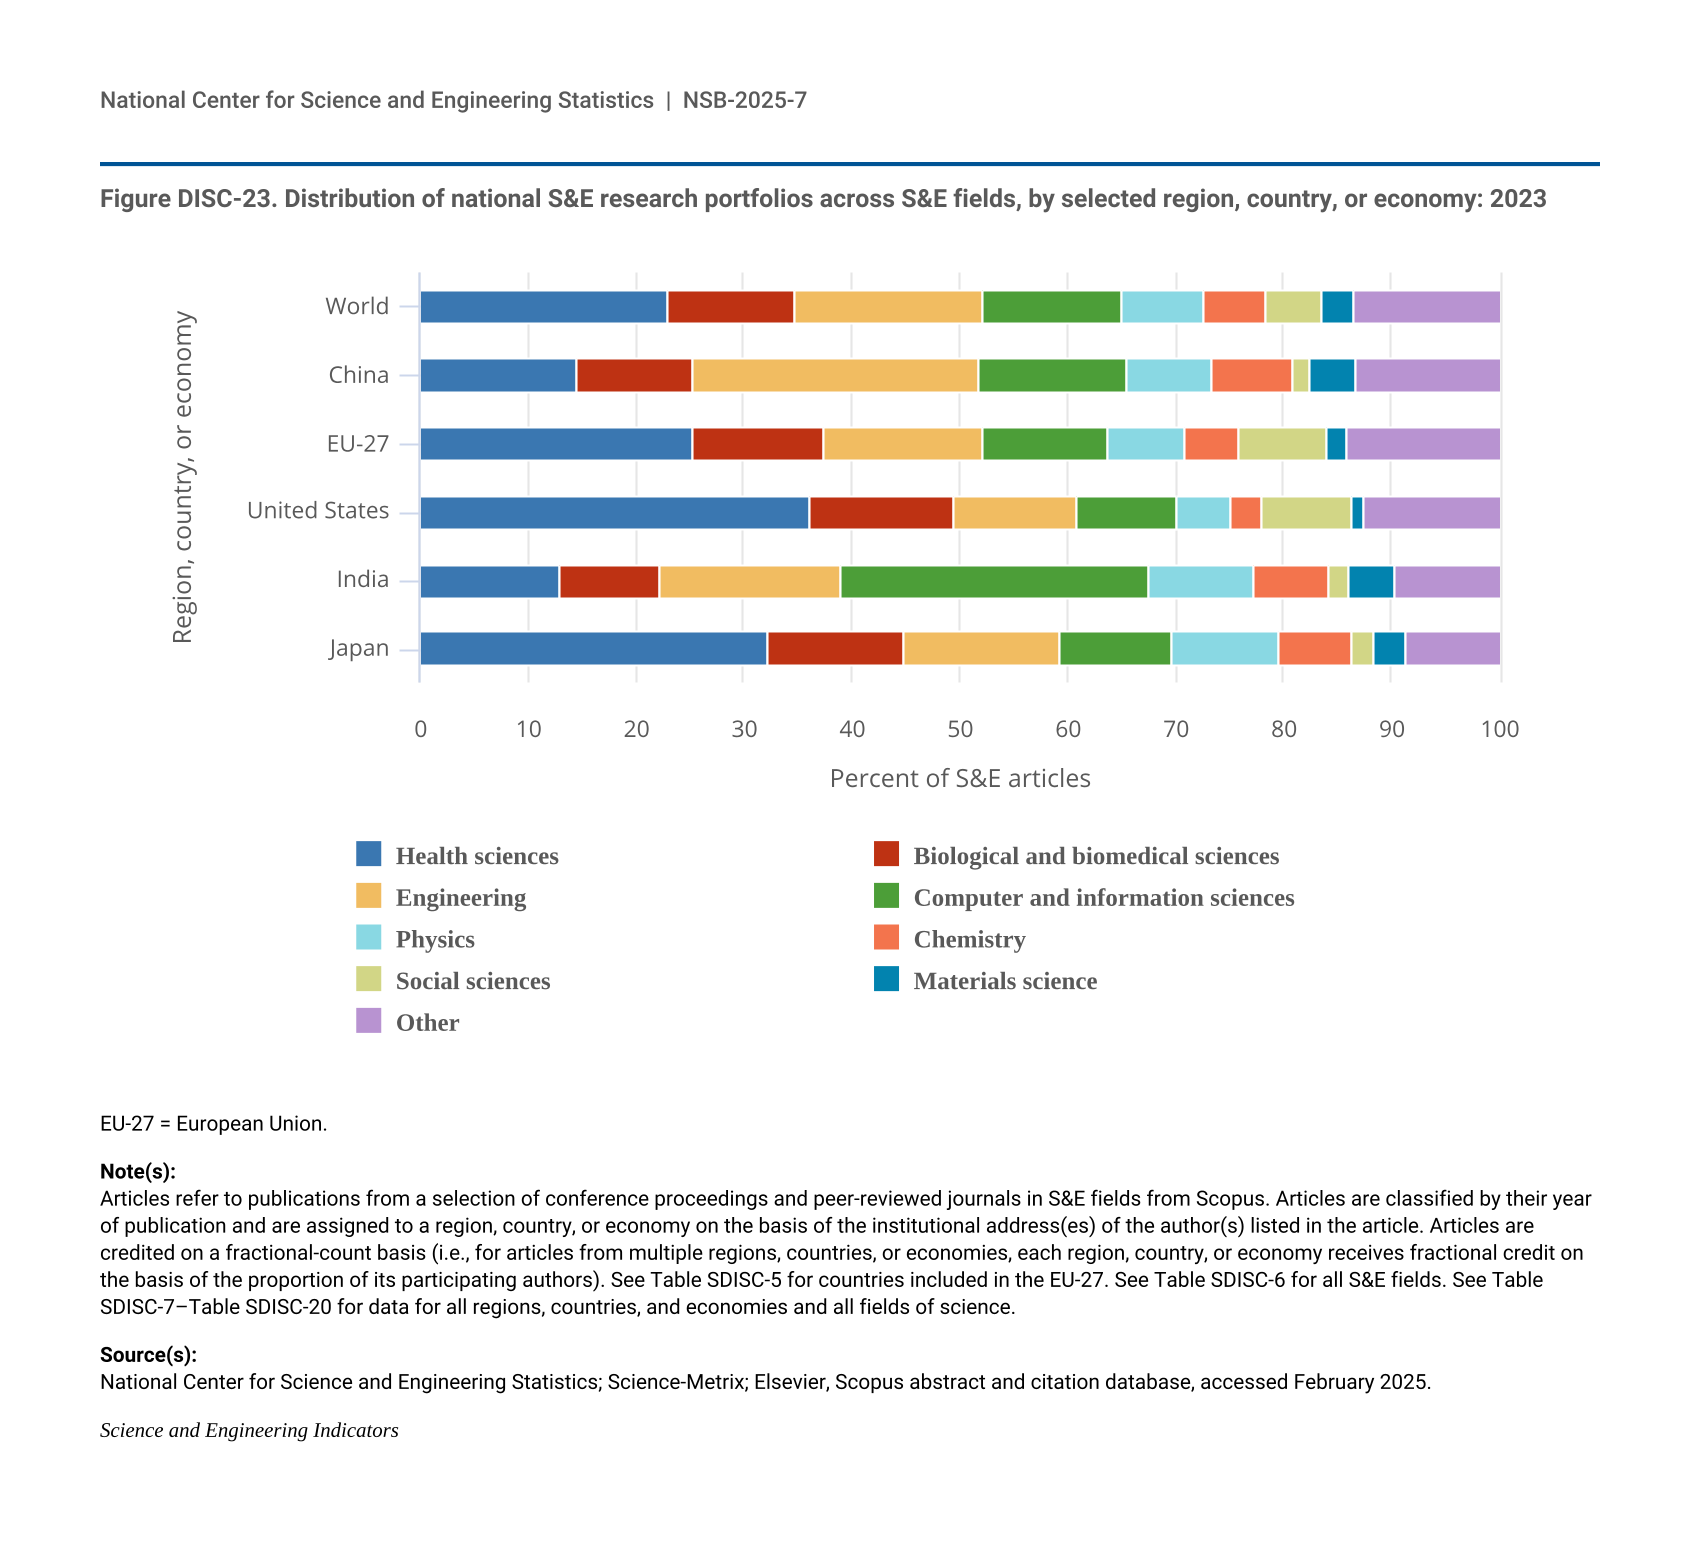
- The top field for authors based in China was engineering (26% of all publications); in the United States, it was health sciences (36% of all publications); in India, it was computer and information sciences (28% of all publications); and in Germany, it was health sciences (24% of all publications).
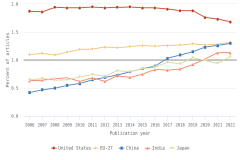
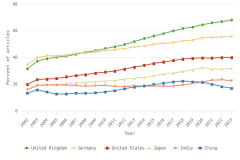
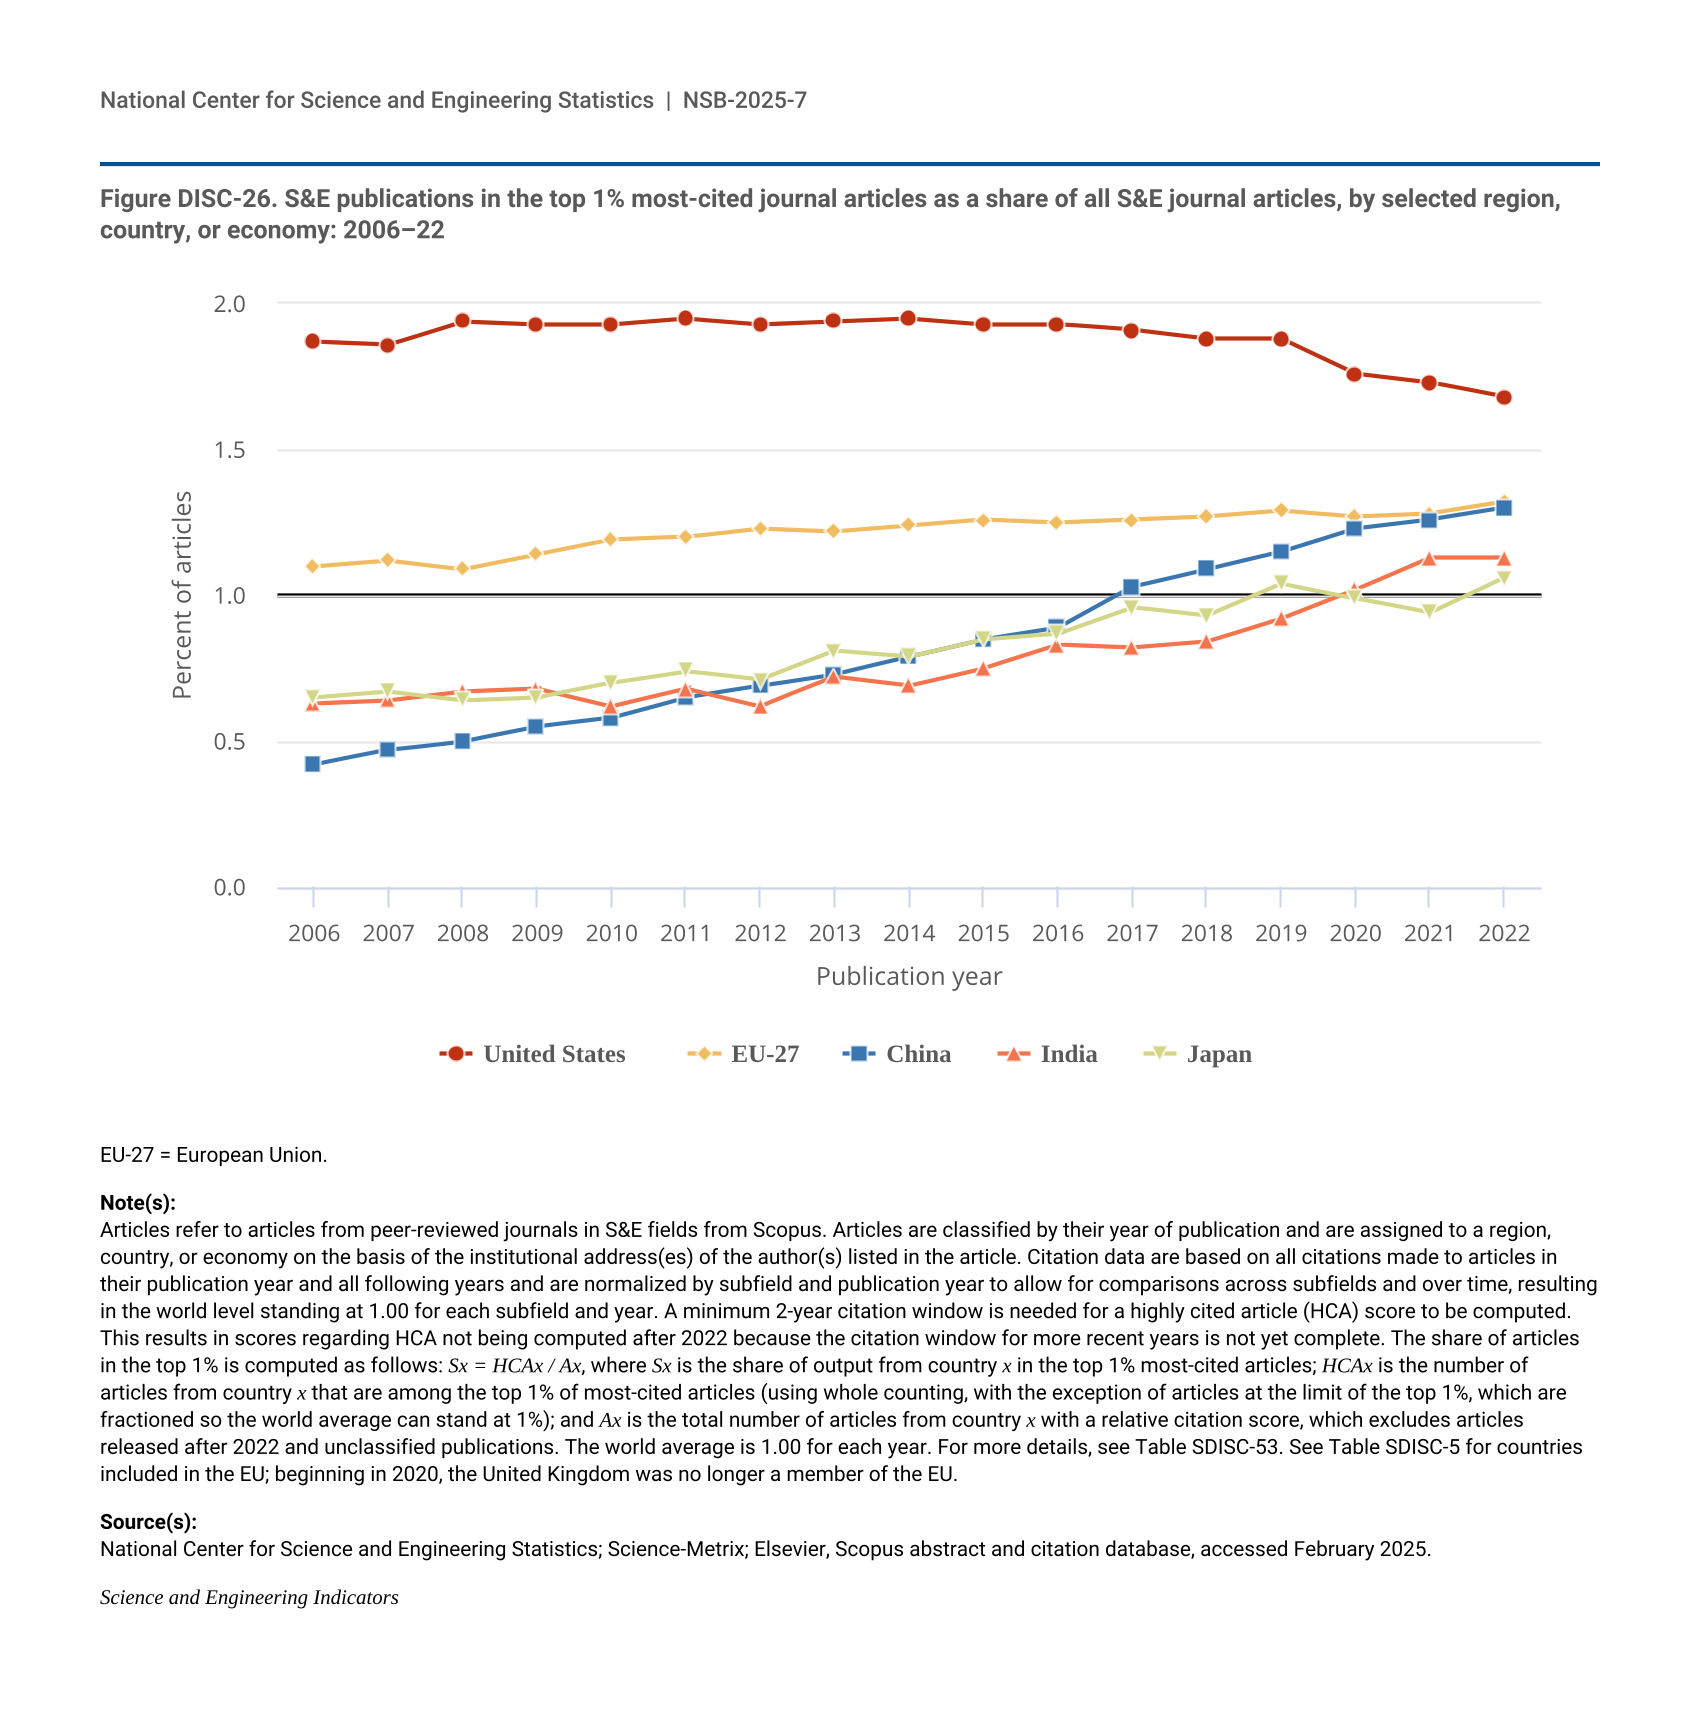
- Since 2006, authors in the United States and the EU-27 have continued to publish large shares of highly cited S&E articles relative to their total output. During this period, the relative share of highly cited S&E articles published by authors in China has increased steadily, although it remains below those of authors in the United States and the EU-27.
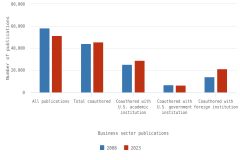
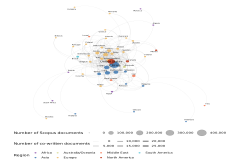
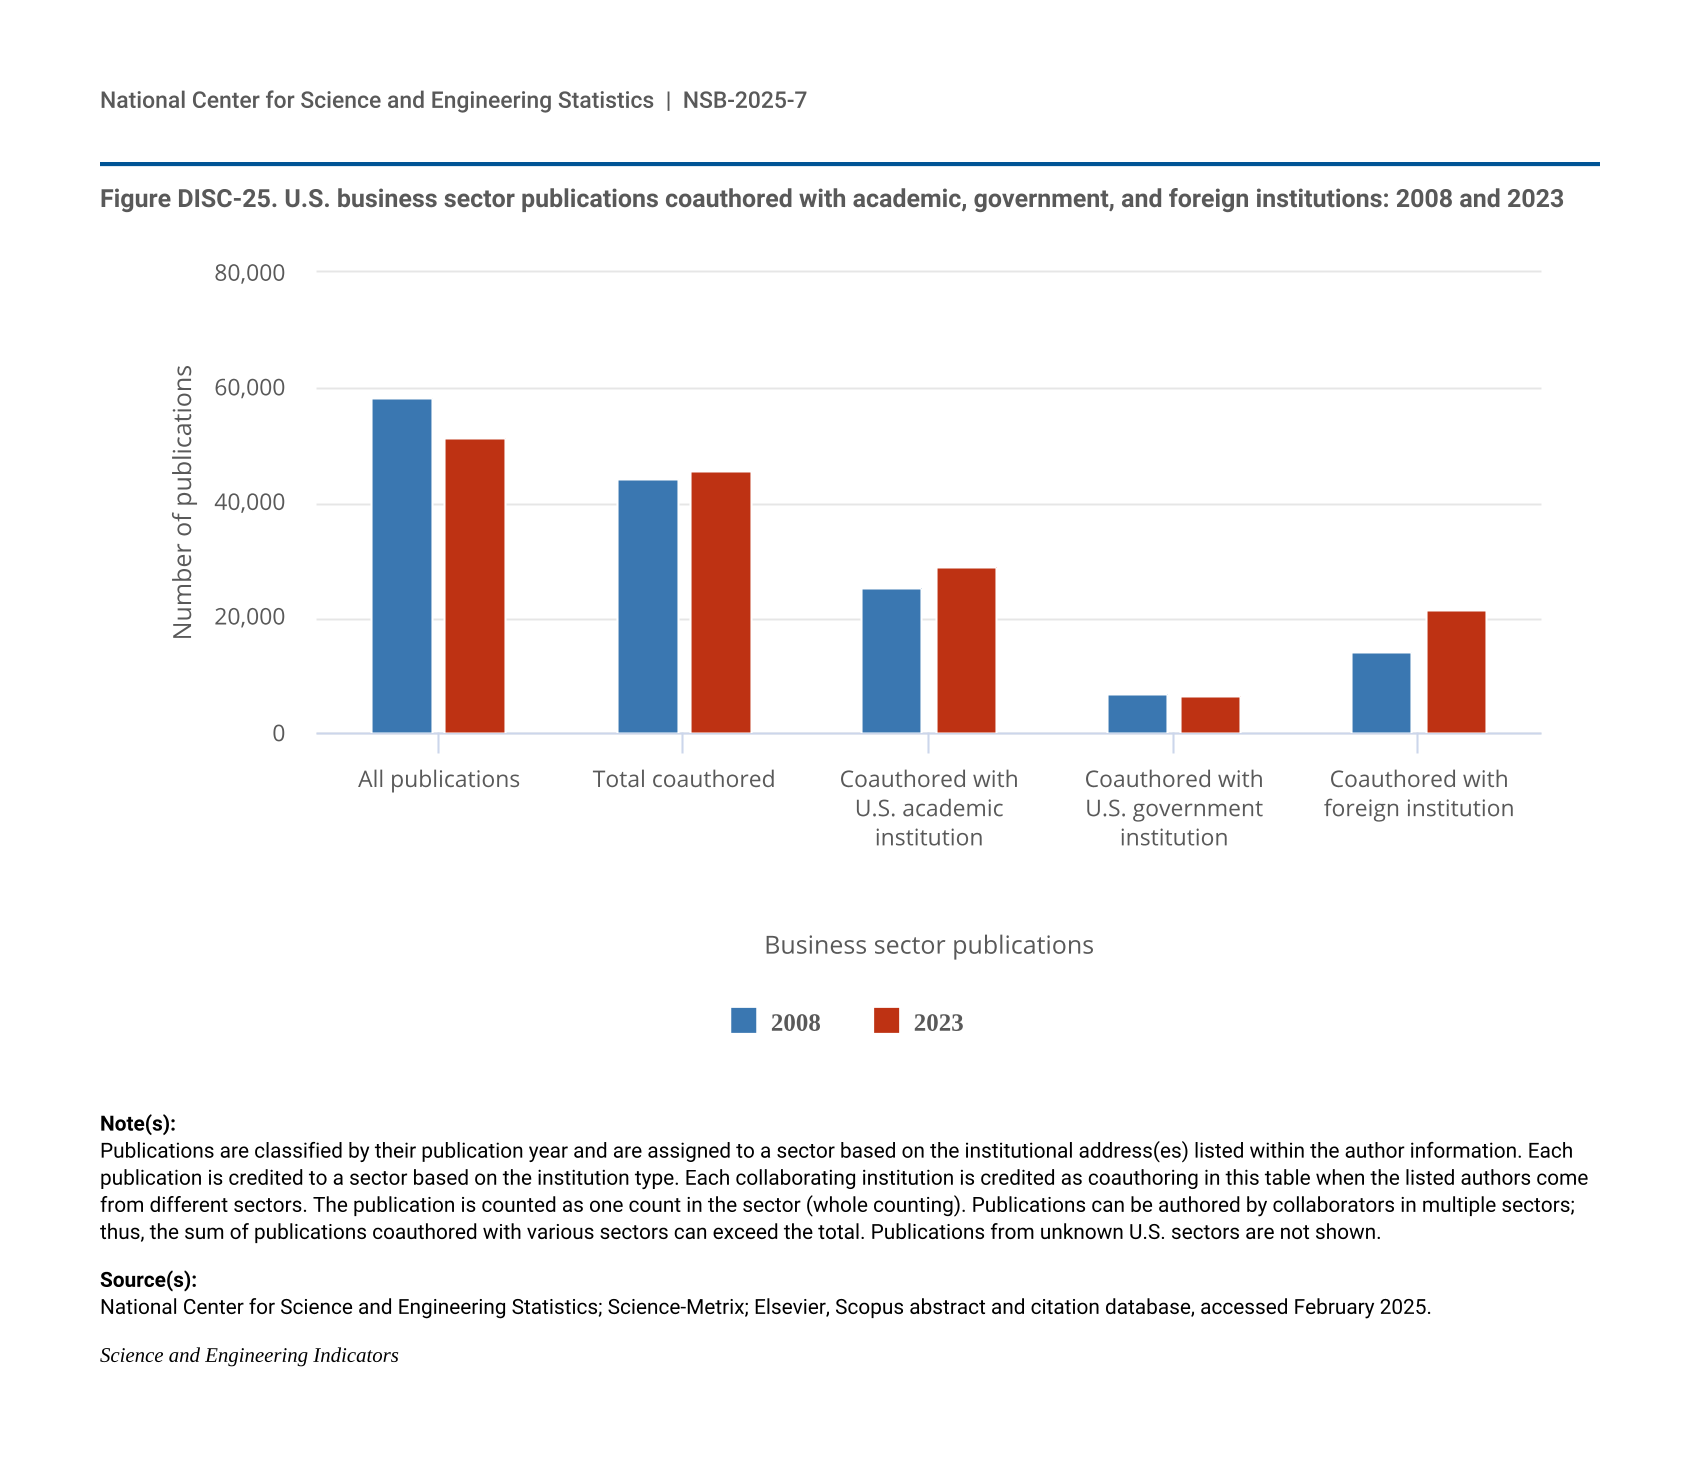
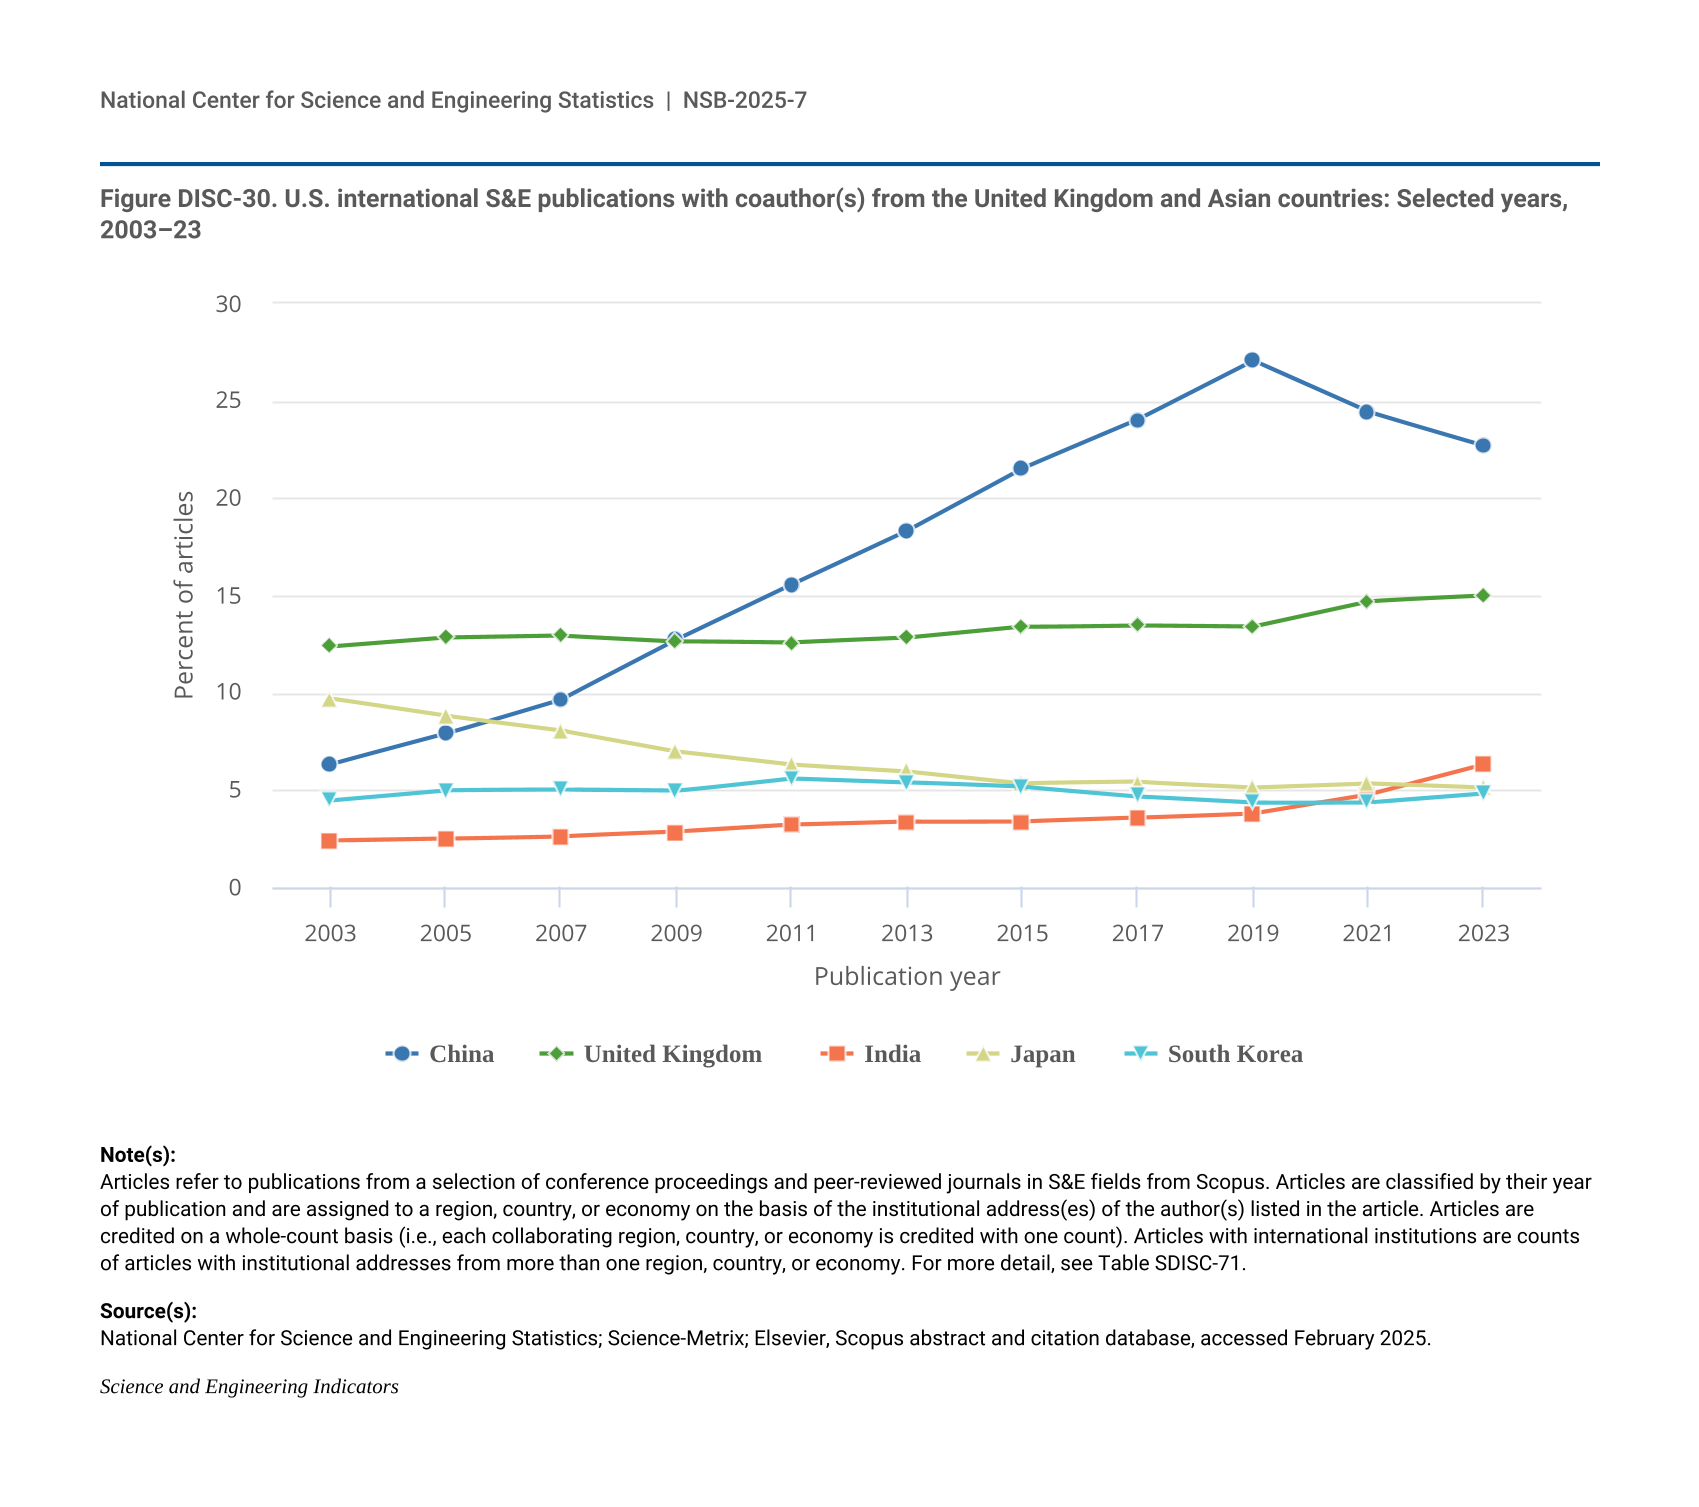
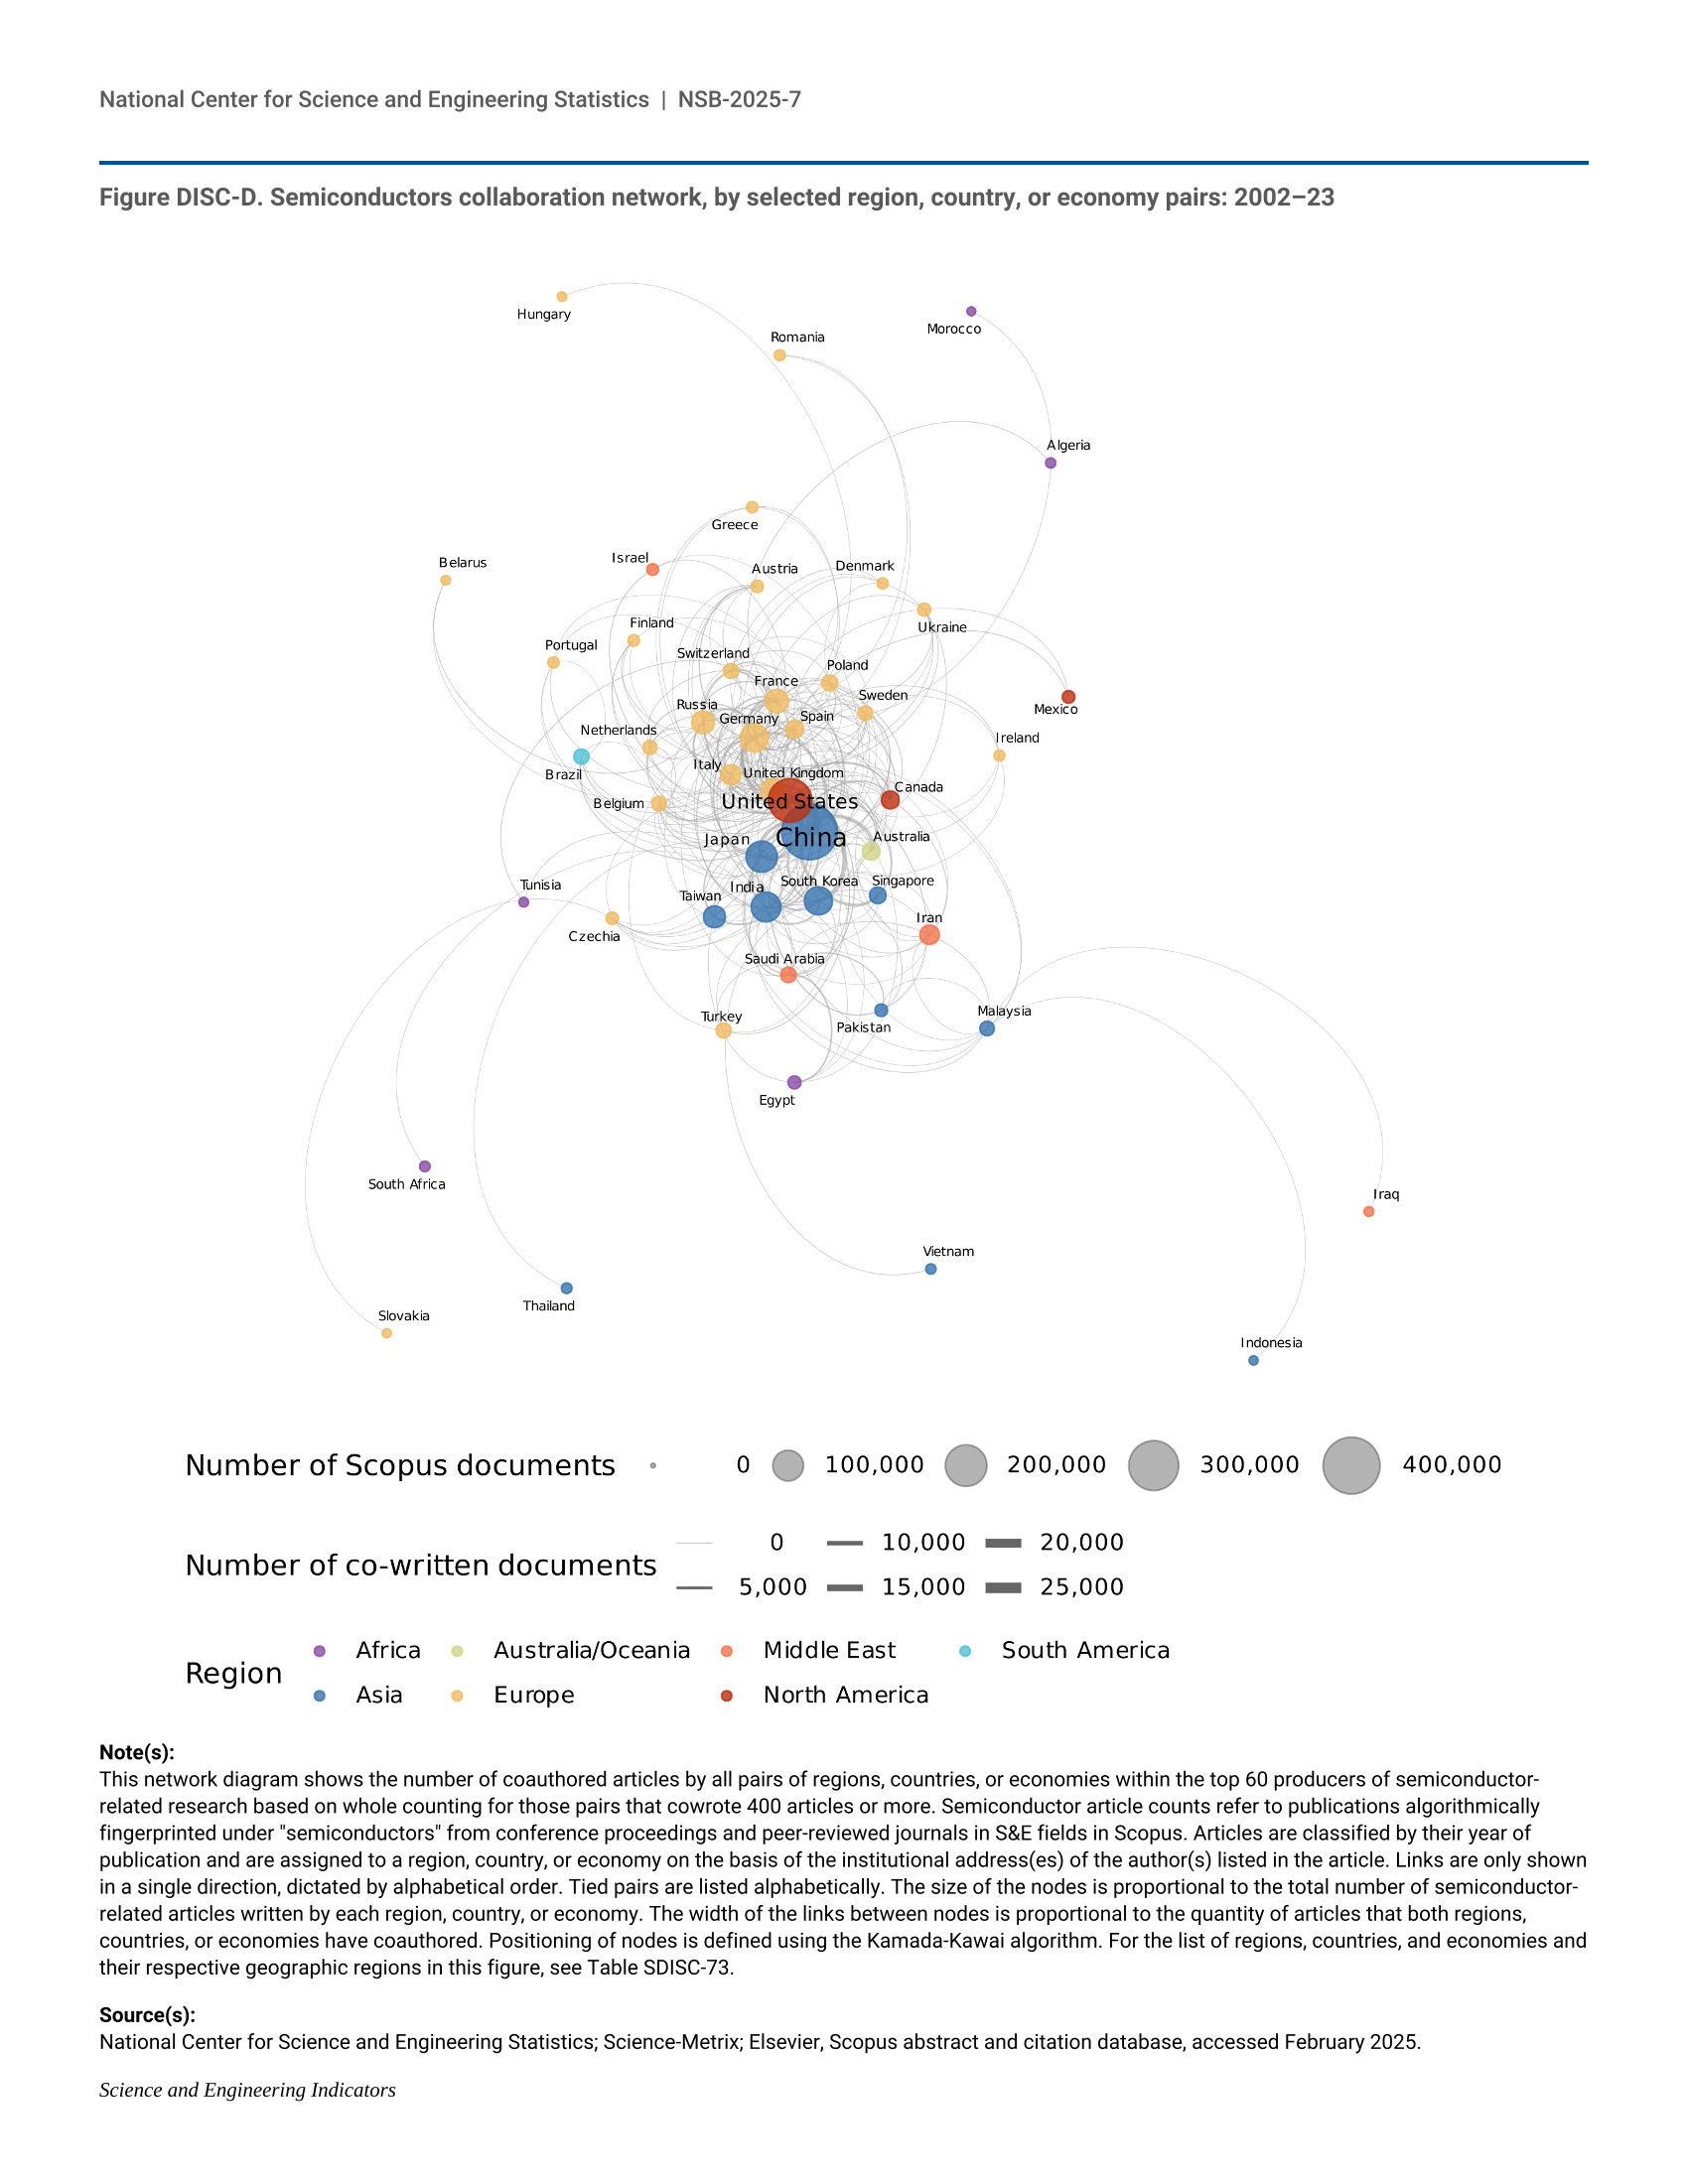
- S&E publications coauthored by U.S. researchers with international collaborators have increased in number and as a share of U.S. publication output over the last 15 years, with researchers in China as the most frequent collaborators, although collaborations with authors based in China have decreased since 2019.