 An official website of the United States government
 Federal Support for U.S. R&D
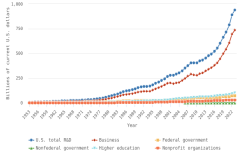
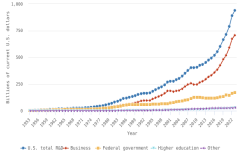
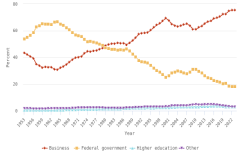
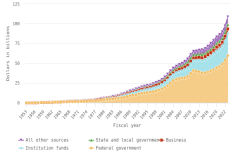
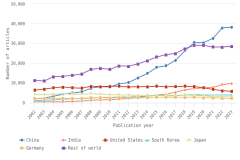
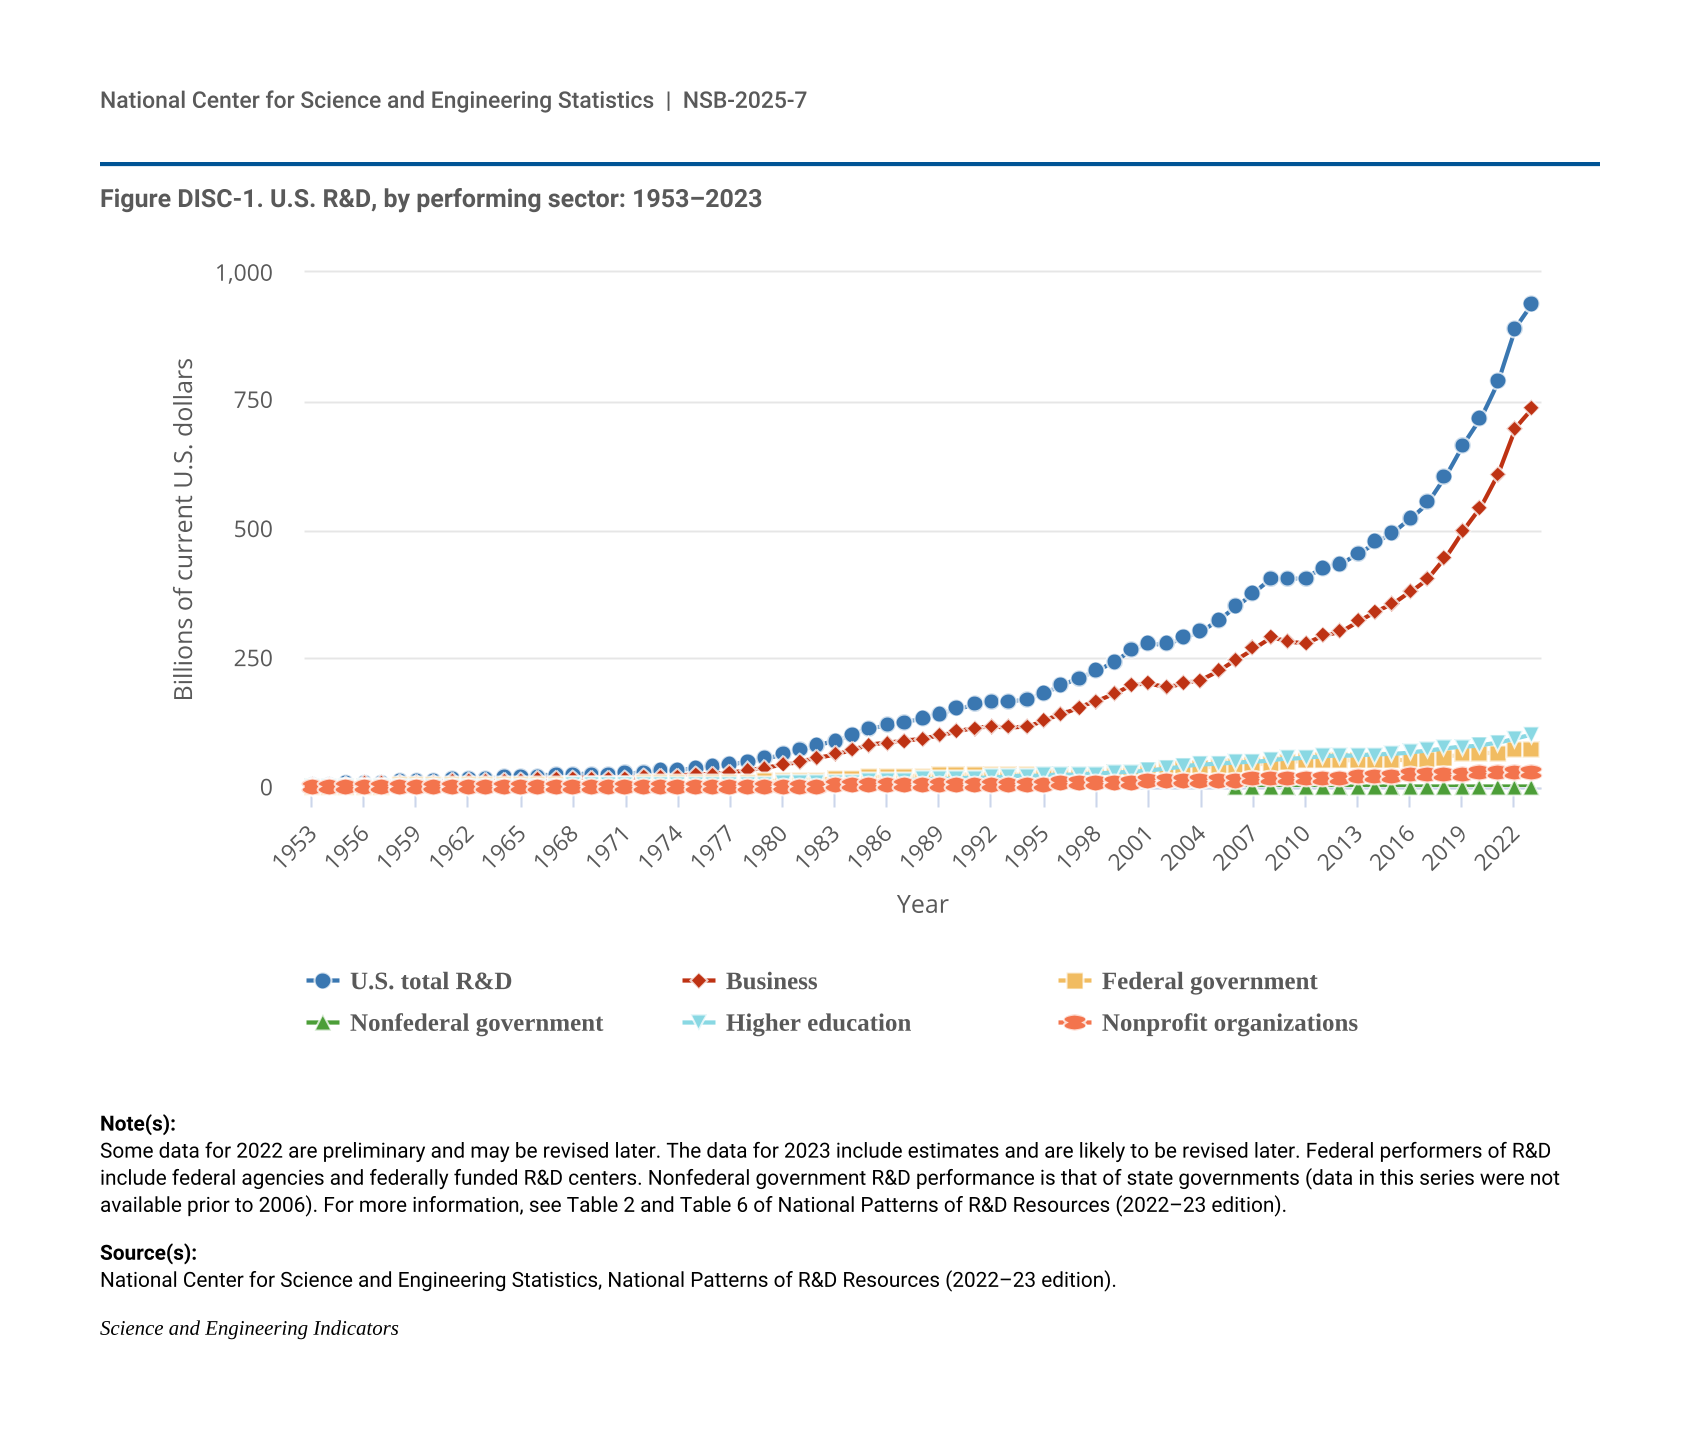
For many decades, federal funding for R&D has been a key feature of U.S. science and technology policy, supporting national defense, space exploration, energy, the environment, health, general science, and other national goals (CRS 2022b, 2023a; Mowery 1992; NASEM 2020), as reflected, for example, in publications output (NSB 2023: Figure PBS-A). More recently, federal obligations for R&D have seen two major spikes since 2008, in line with several supplemental appropriations: one in FYs 2009–10, and another beginning in FY 2021 and extending into FY 2024, the most recent year for which preliminary data are available (Table DISC-7).
na = not applicable; agency or subagency did not exist as such or in that organization in that year. NA = not available; data were not collected at that level for that fiscal year.
a Beginning with FY 2016, the totals reported for development obligations represent a refinement to this category by more narrowly defining it to be "experimental development." Most notably, totals for development do not include the Department of Defense (DOD) Budget Activity 7 (Operational Systems Development) obligations. Those funds, previously included in DOD's development obligation totals, support the development efforts to upgrade systems that have been fielded or have received approval for full-rate production and anticipate production funding in the current or subsequent fiscal year. Therefore, the data are not directly comparable with totals reported in previous years.
Because of rounding in source tables, detail may not add to total. This table lists (in general) agencies with R&D and R&D plant obligations greater than $100 million in FY 2023. Agency rankings are based on FY 2023 data. All other agencies includes the Social Security Administration, Department of Housing and Urban Development, Department of Labor, Department of State, Department of the Treasury, Administrative Office of the U.S. Courts, Appalachian Regional Commission, Consumer Product Safety Commission, Federal Communications Commission, Federal Trade Commission, Library of Congress, National Archives and Records Commission, Nuclear Regulatory Commission, Resources and Ecosystems Sustainability, Tourist Opportunities, and Revived Economies of the Gulf Coast States (RESTORE) Act Centers of Excellence Research Grants Program, Agency for Global Media, and Postal Service. FYs 2009–10 obligations include additional funding provided by the American Recovery and Reinvestment Act of 2009. Obligations for FYs 2020–22 include additional funding provided by supplemental COVID-19-related appropriations (e.g., Coronavirus Aid, Relief, and Economic Security [CARES] Act).
National Center for Science and Engineering Statistics, Survey of Federal Funds for Research and Development, Volume 73, FYs 2023–24.
Science and Engineering Indicators
Federal Obligations for R&D and R&D Plant by Major Agency
Two agencies accounted for 72% of FY 2023 federal R&D and R&D plant (R&D facilities and major equipment; see Glossary section) obligations. DOD obligated $86.2 billion, or 45% of the $192.1 billion in federal total obligations, and HHS obligated $53.0 billion (28% of total). Other top agencies included the Department of Energy (DOE) ($19.4 billion, or 10% of total), the National Aeronautics and Space Administration ($11.8 billion, or 6% of total), and NSF ($8.0 billion, or 4% of total) (Table DISC-7). In FY 2023, total federal obligations for R&D and R&D plant decreased slightly from FY 2022 ($192.1 billion and $196.6 billion, respectively), although they are expected to revert to a record high of $200.9 billion in current dollars in FY 2024 based on preliminary data. HHS funding decreased 29% in FY 2023 (down from $74.4 billion in FY 2022), driven largely by a reduction in COVID-19 pandemic-related obligations to the Center for the Biomedical Advanced Research and Development Authority within HHS (Pece 2024). This FY 2023 decrease followed two large increases in obligations in both FY 2020 (a 57% increase to $61.8 billion, up from $39.4 billion the year prior) and FY 2021 (up 25% to $77.1 billion from FY 2020).
R&D plant accounted for just 3% of the overall R&D and R&D plant obligations in FY 2023 ($5.7 billion of the total $192.1 billion) (Table DISC-8). DOE R&D plant obligations, which were primarily for FFRDCs, accounted for the majority of the total across agencies ($3.3 billion).
Because of rounding in source tables, detail may not add to total. R&D is basic research, applied research, and experimental development, and it does not include R&D plant. Intramural activities include actual intramural R&D performance and costs associated with planning and administration of both intramural and extramural programs by federal personnel, including federally funded R&D centers. Extramural performers includes federally funded R&D performed in the United States and U.S. territories by businesses, universities and colleges, other nonprofit institutions, state and local governments, and foreign organizations. All other agencies includes the Social Security Administration, Department of Labor, Department of State, Department of the Treasury, Agency for Global Media, Appalachian Regional Commission, Consumer Product Safety Commission, Federal Trade Commission, Library of Congress, Nuclear Regulatory Commission, Postal Service, and Resources and Ecosystems Sustainability, Tourist Opportunities, and Revived Economies of the Gulf Coast States (RESTORE) Act Centers of Excellence Research Grants Program.
National Center for Science and Engineering Statistics, Survey of Federal Funds for Research and Development, Volume 73, FYs 2023–24.
Science and Engineering Indicators
Federal Obligations by Performer and Type of R&D
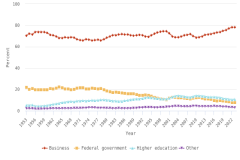
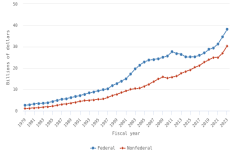
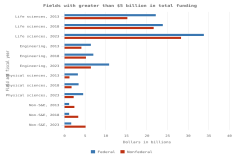
Agencies obligate funds for R&D and R&D plant to both intramural performers (federal agencies and FFRDCs) and extramural performers (those outside the federal government: businesses, institutions of higher education, nonprofit organizations, state and local governments, and foreign organizations). Two-thirds of federal R&D and R&D plant obligations ($128.0 billion) went to extramural performers in FY 2023. Intramural R&D performers accounted for 33% ($64.1 billion).
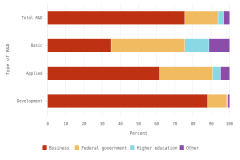
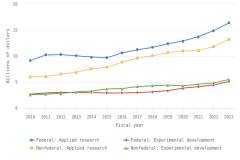
Across all agencies, 25% of federal R&D obligations were devoted to basic research ($47.3 billion), 29% to applied research ($54.3 billion), and 46% to experimental development ($84.8 billion) in FY 2023 (Table DISC-9). DOD obligated the majority of federal funding for experimental development ($74.3 billion of the total $84.8 billion). HHS obligated the most basic research funding ($22.7 billion of the total $47.3 billion) and applied research funding ($29.7 billion of the total $54.3 billion) among federal agencies.
This table lists all agencies covered in Table DISC-7 and as ranked there. Because of rounding in source tables, detail may not add to total. All other agencies includes the Social Security Administration, Department of Labor, Department of State, Department of the Treasury, Agency for Global Media, Appalachian Regional Commission, Consumer Product Safety Commission, Federal Trade Commission, Library of Congress, Nuclear Regulatory Commission, Postal Service, and Resources and Ecosystems Sustainability, Tourist Opportunities, and Revived Economies of the Gulf Coast States (RESTORE) Act Centers of Excellence Research Grants Program.
National Center for Science and Engineering Statistics, Survey of Federal Funds for Research and Development, Volume 73, FYs 2023–24.
Science and Engineering Indicators
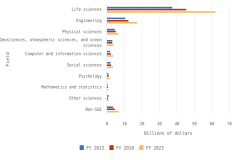
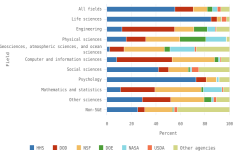
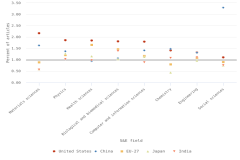
Federal Obligations for Research by S&E Fields
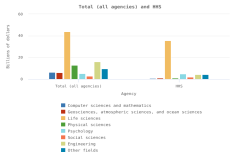
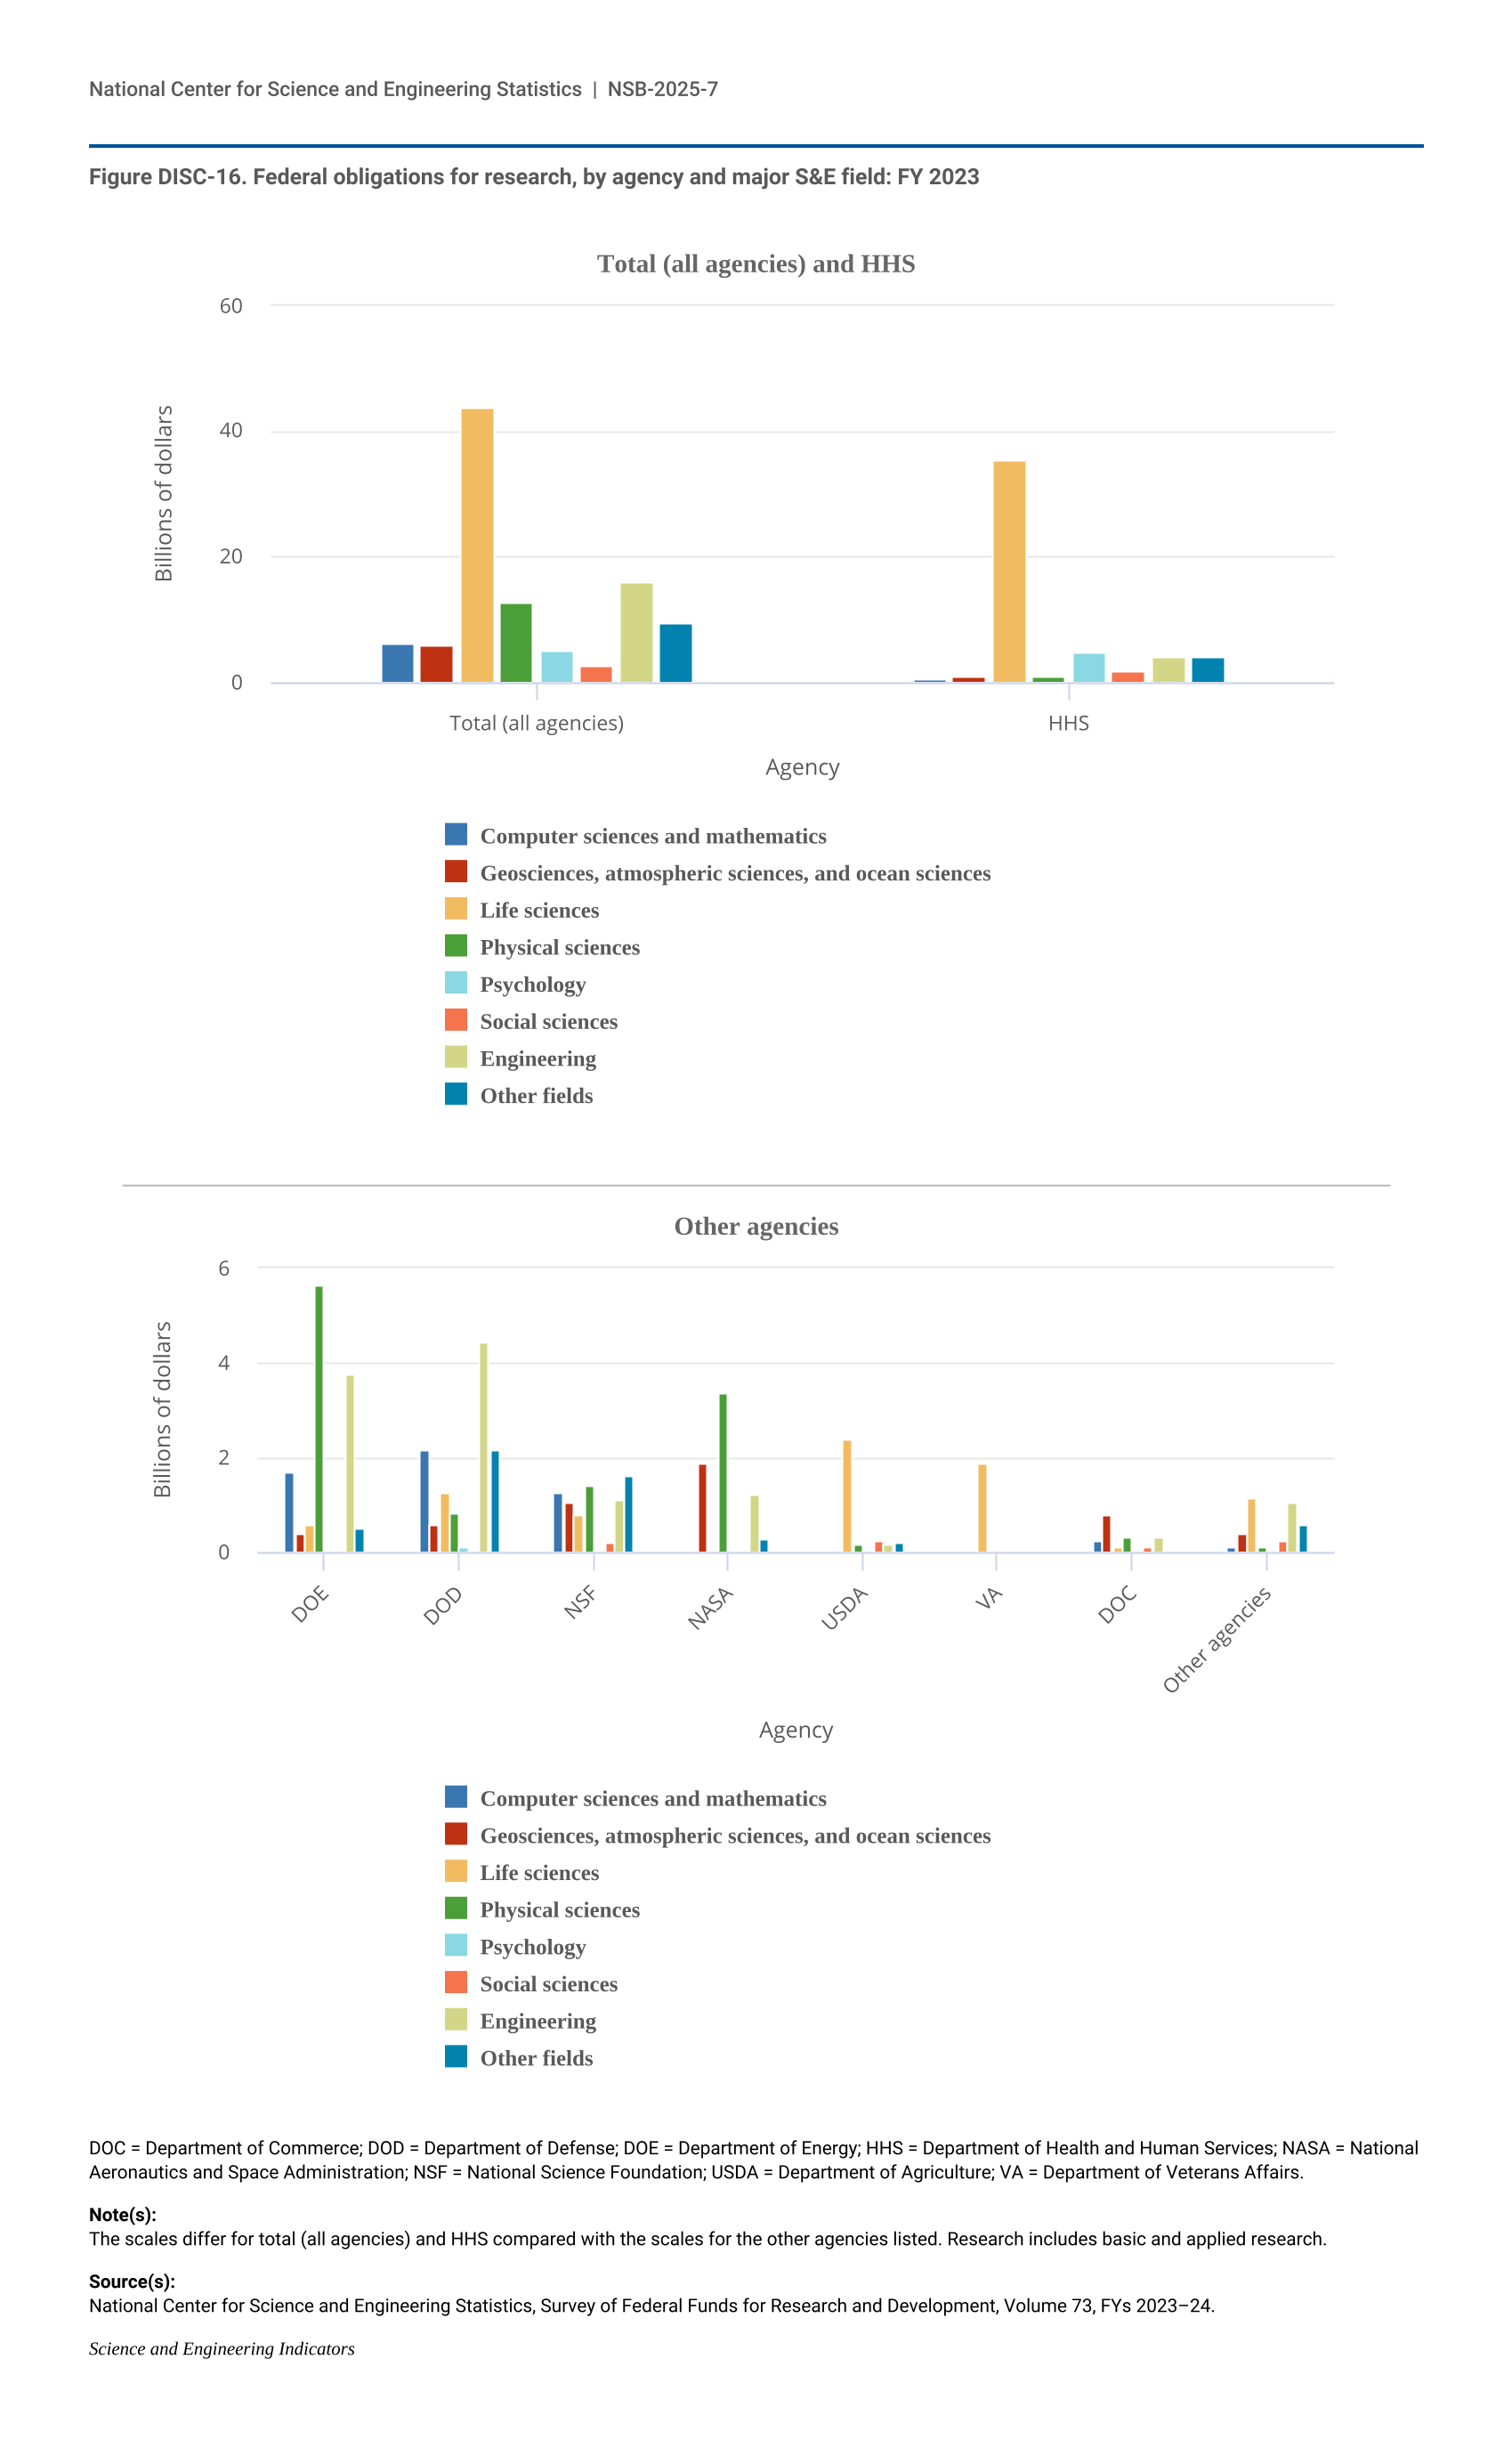
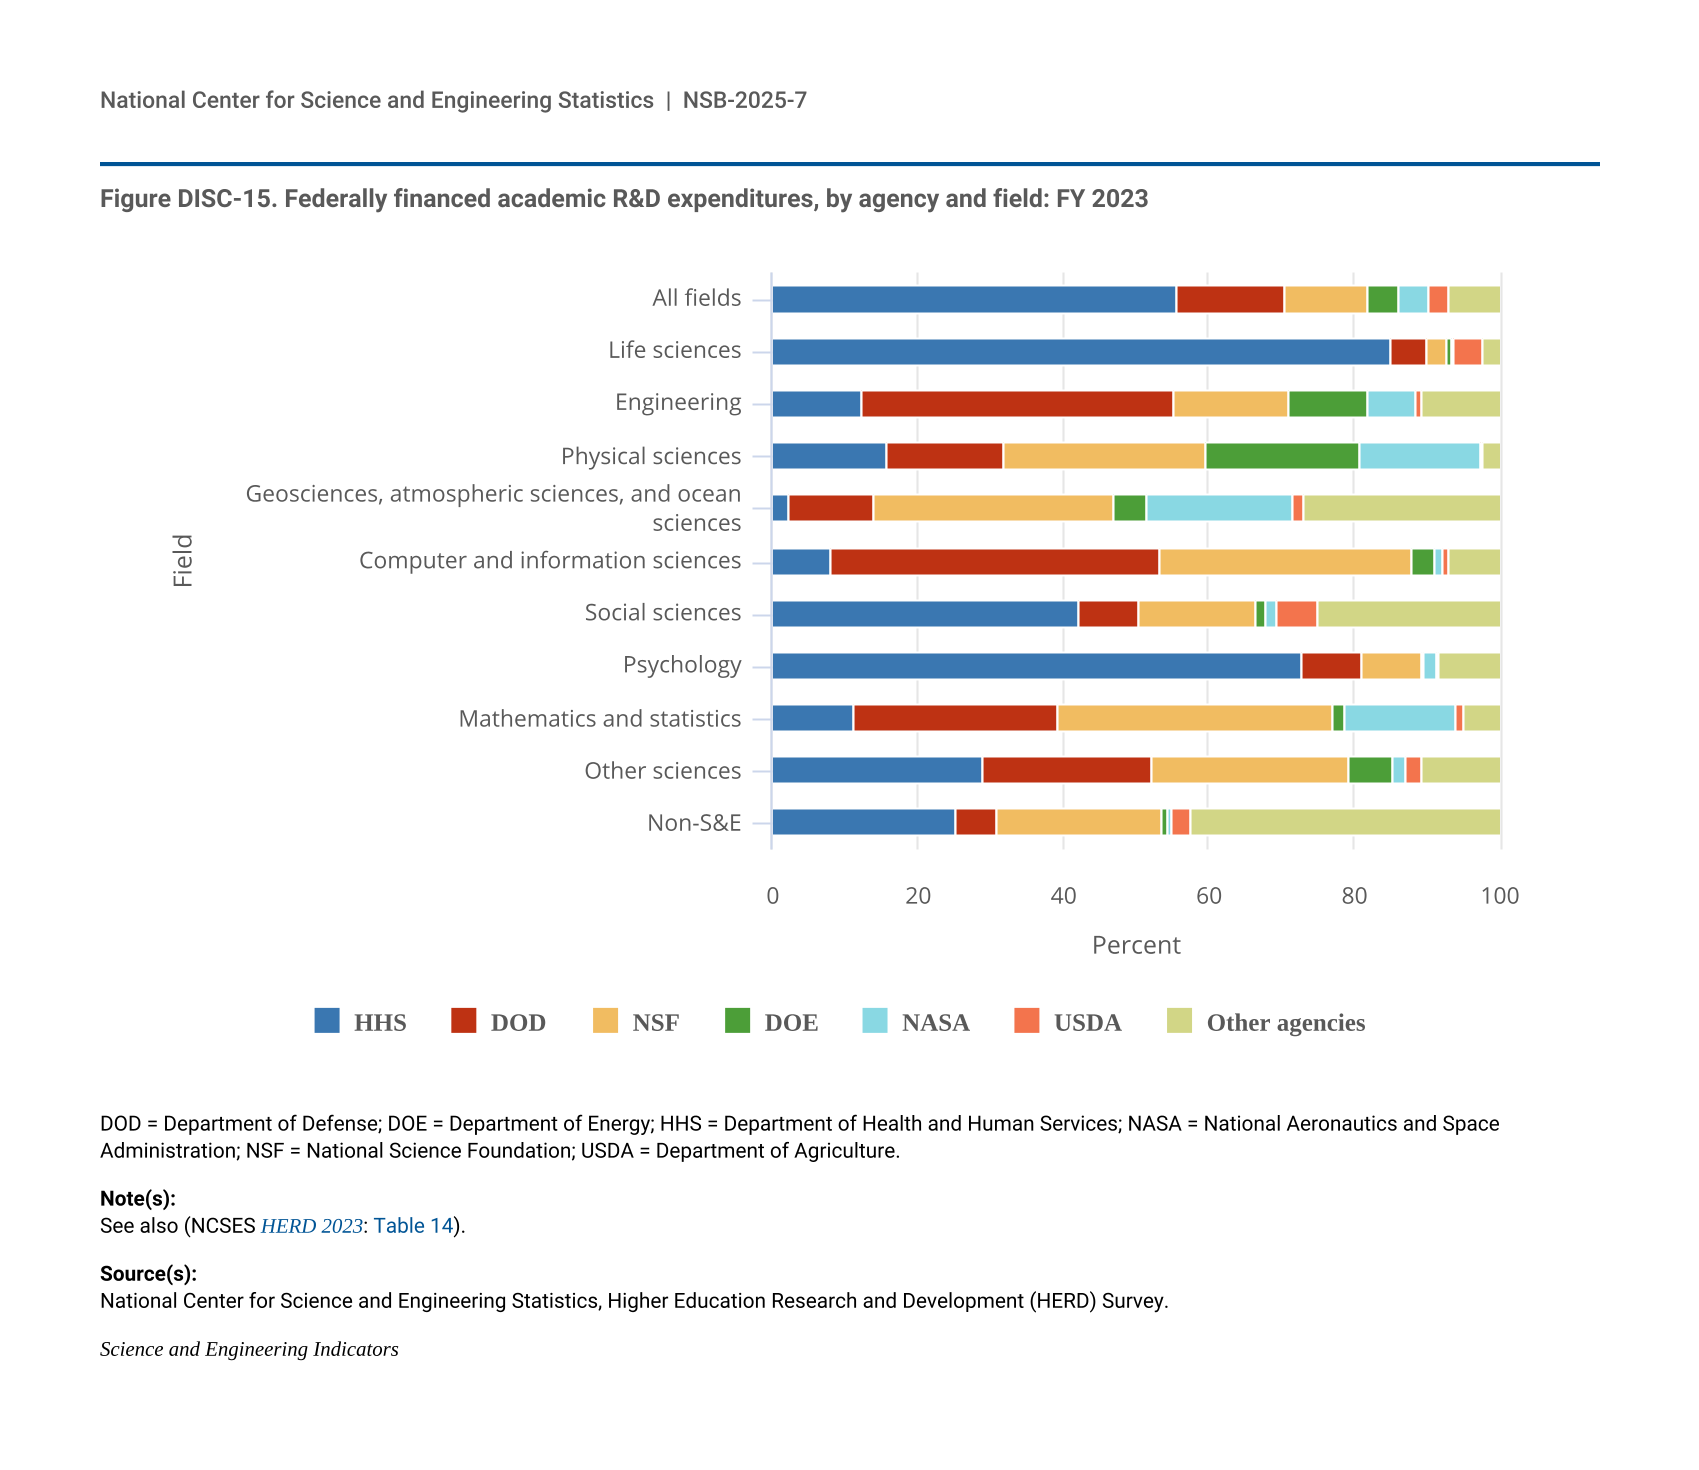
Federal agencies fund and perform research in a broad range of S&E fields, and each agency’s mission area is reflected in the major S&E fields in which it obligates funds. The information on federal obligations for research in S&E fields presented in this section addresses both basic research and applied research but does not include obligations for experimental development. In FY 2023, federal research obligations reached $101.6 billion across all S&E fields (Figure DISC-16; NCSES 2025b: Table 24), with over half of this total ($52.5 billion) obligated by HHS. Among S&E fields, obligations were highest in the life sciences ($43.7 billion, or 43% of total obligations), and the largest federal funder of life sciences research was HHS (81% of the total in the field). HHS also obligates nearly all federal funding for psychology research (96% of the $4.9 billion total). Other top agencies include DOE, with $5.6 billion obligated for physical sciences (44% of the total $12.7 billion in that field) and $3.8 billion for engineering (23% of the total $16.0 billion), and DOD, with $2.2 billion for computer sciences and mathematics research (35% of the total) and $4.5 billion for engineering (28% of the total).
| Agency | Computer sciences and mathematics | Geosciences, atmospheric sciences, and ocean sciences | Life sciences | Physical sciences | Psychology | Social sciences | Engineering | Other fields |
|---|---|---|---|---|---|---|---|---|
| Total (all agencies) | 6.1 | 5.9 | 43.7 | 12.7 | 4.9 | 2.7 | 16.0 | 9.5 |
| HHS | 0.6 | 0.8 | 35.5 | 0.9 | 4.8 | 1.8 | 4.0 | 4.2 |
| Agency | Computer sciences and mathematics | Geosciences, atmospheric sciences, and ocean sciences | Life sciences | Physical sciences | Psychology | Social sciences | Engineering | Other fields |
|---|---|---|---|---|---|---|---|---|
| DOE | 1.67 | 0.40 | 0.59 | 5.64 | 0.00 | 0.00 | 3.76 | 0.52 |
| DOD | 2.16 | 0.57 | 1.26 | 0.82 | 0.12 | 0.05 | 4.45 | 2.14 |
| NSF | 1.27 | 1.07 | 0.79 | 1.40 | 0.03 | 0.21 | 1.10 | 1.62 |
| NASA | 0.00 | 1.90 | 0.03 | 3.39 | 0.00 | 0.00 | 1.20 | 0.26 |
| USDA | 0.04 | 0.03 | 2.40 | 0.15 | 0.01 | 0.24 | 0.17 | 0.18 |
| VA | 0.00 | 0.00 | 1.88 | 0.00 | 0.00 | 0.00 | 0.00 | 0.00 |
| DOC | 0.24 | 0.77 | 0.11 | 0.31 | 0.00 | 0.13 | 0.31 | 0.01 |
| Other agencies | 0.13 | 0.38 | 1.15 | 0.12 | 0.03 | 0.24 | 1.07 | 0.59 |
DOC = Department of Commerce; DOD = Department of Defense; DOE = Department of Energy; HHS = Department of Health and Human Services; NASA = National Aeronautics and Space Administration; NSF = National Science Foundation; USDA = Department of Agriculture; VA = Department of Veterans Affairs.
The scales differ for total (all agencies) and HHS compared with the scales for the other agencies listed. Research includes basic and applied research.
National Center for Science and Engineering Statistics, Survey of Federal Funds for Research and Development, Volume 73, FYs 2023–24.
Science and Engineering Indicators