 An official website of the United States government
 Notes
1 Research publications are often used as an output metric in R&D efficiency or R&D productivity studies, especially for academic research (Rotolo et al. 2022; Shelton 2008; Thomas, Sharma, and Jain 2011; Tijssen and Winnink 2018).
2 It is important to note that scientific papers do not represent all types of early research products, which also include PhD dissertations and research data sets (Aksnes et al. 2017; Arora et al. 2023; Sugimoto and Larivière 2018).
3 Estimated 2023 national R&D performance is based in part on 2023 projected R&D reported on the 2022 Business Enterprise Research and Development (BERD) Survey, preliminary information from the 2023 BERD Survey, and trends for business R&D performance. Every survey year, some of the variation in BERD estimates is due to changes in individual respondent reporting practices. For details, see NCSES (2024a).
4 For longer-term U.S. R&D trends, see Anderson, Jankowski, and Boroush (2023) and NCSES (2025d). All comparative statements in this report have undergone statistical testing and are significant at the 90% confidence level, except for statements reliant on modeled estimates.
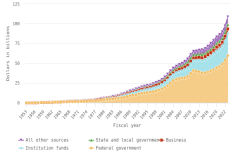
5 Starting in 2016, the business R&D data reported by the National Patterns series include the R&D expenditures reported by microbusinesses (generally, companies with fewer than 10 employees). These new statistics come from NCSES surveys fielded for 2016 and onward: the 2016 Business R&D and Innovation Survey–Microbusiness, which collected statistics on the R&D activities of businesses with 1–5 employees; for 2017–18, the Annual Business Survey (ABS), which collected statistics on the R&D activities of businesses with 1–9 employees. The totals for business R&D performance are from $4 billion to $5 billion higher for 2016 and beyond as a result of microbusiness R&D being included.
6 The National Patterns statistics for higher education R&D appearing in this section adjust the academic fiscal year basis of NCSES’s Higher Education Research and Development (HERD) Survey data to calendar year and net out pass-throughs of research funds to remove double counting in the national totals. Accordingly, the higher education statistics included in this section differ from those based on fiscal year from the HERD Survey discussed further below. For further details, see https://ncses.nsf.gov/data-collections/national-patterns/2021-2022#methodology.
7 U.S. R&D funded and performed by the business sector (by far the largest component as noted above) comprises own company funds of domestic R&D-performing businesses, funds from other domestic businesses, and funds from foreign businesses.
8 FFRDCs are R&D-performing organizations that are exclusively or substantially financed by the federal government. An FFRDC is operated to provide R&D capability to serve federal agency mission objectives or, in some cases, to provide major facilities at universities for research and associated training purposes. Each FFRDC is administered by an industrial firm, a university, a nonprofit institution, or a consortium. NCSES maintains a current Master Government List of Federally Funded R&D Centers, which is available at https://www.nsf.gov/statistics/ffrdclist/.
9 For more information on R&D performed by businesses with 10 or more employees, see the Business Enterprise Research and Development (BERD) survey at https://ncses.nsf.gov/surveys/business-enterprise-research-development/2022. For information on R&D performed by microbusinesses (1–9 employees), see the ABS at https://ncses.nsf.gov/surveys/annual-business-survey/2023. Microbusinesses are a small but important segment of business R&D and innovation (Anderson and Kindlon 2019; Knott and Vieregger 2020).
10 For foreign R&D by multinational enterprises, see Bureau of Economic Analysis (2024) and Moris (2021).
11 At the same time, the U.S. R&D manufacturing share has declined over the years. See BERD Survey Table 59, Domestic R&D paid for by the company and others and performed by the company, by industry and company size: 2008–21, available at https://ncses.nsf.gov/surveys/business-enterprise-research-development/2021#data.
12 See https://ncses.nsf.gov/surveys/business-enterprise-research-development/2022#data. For new statistics on state R&D value added in the context of U.S. GDP accounts, see https://www.bea.gov/data/special-topics/research-and-development-satellite-account. See also Moris (2019) and Moylan and Okubo (2020) for R&D investment measures in U.S. GDP statistics.
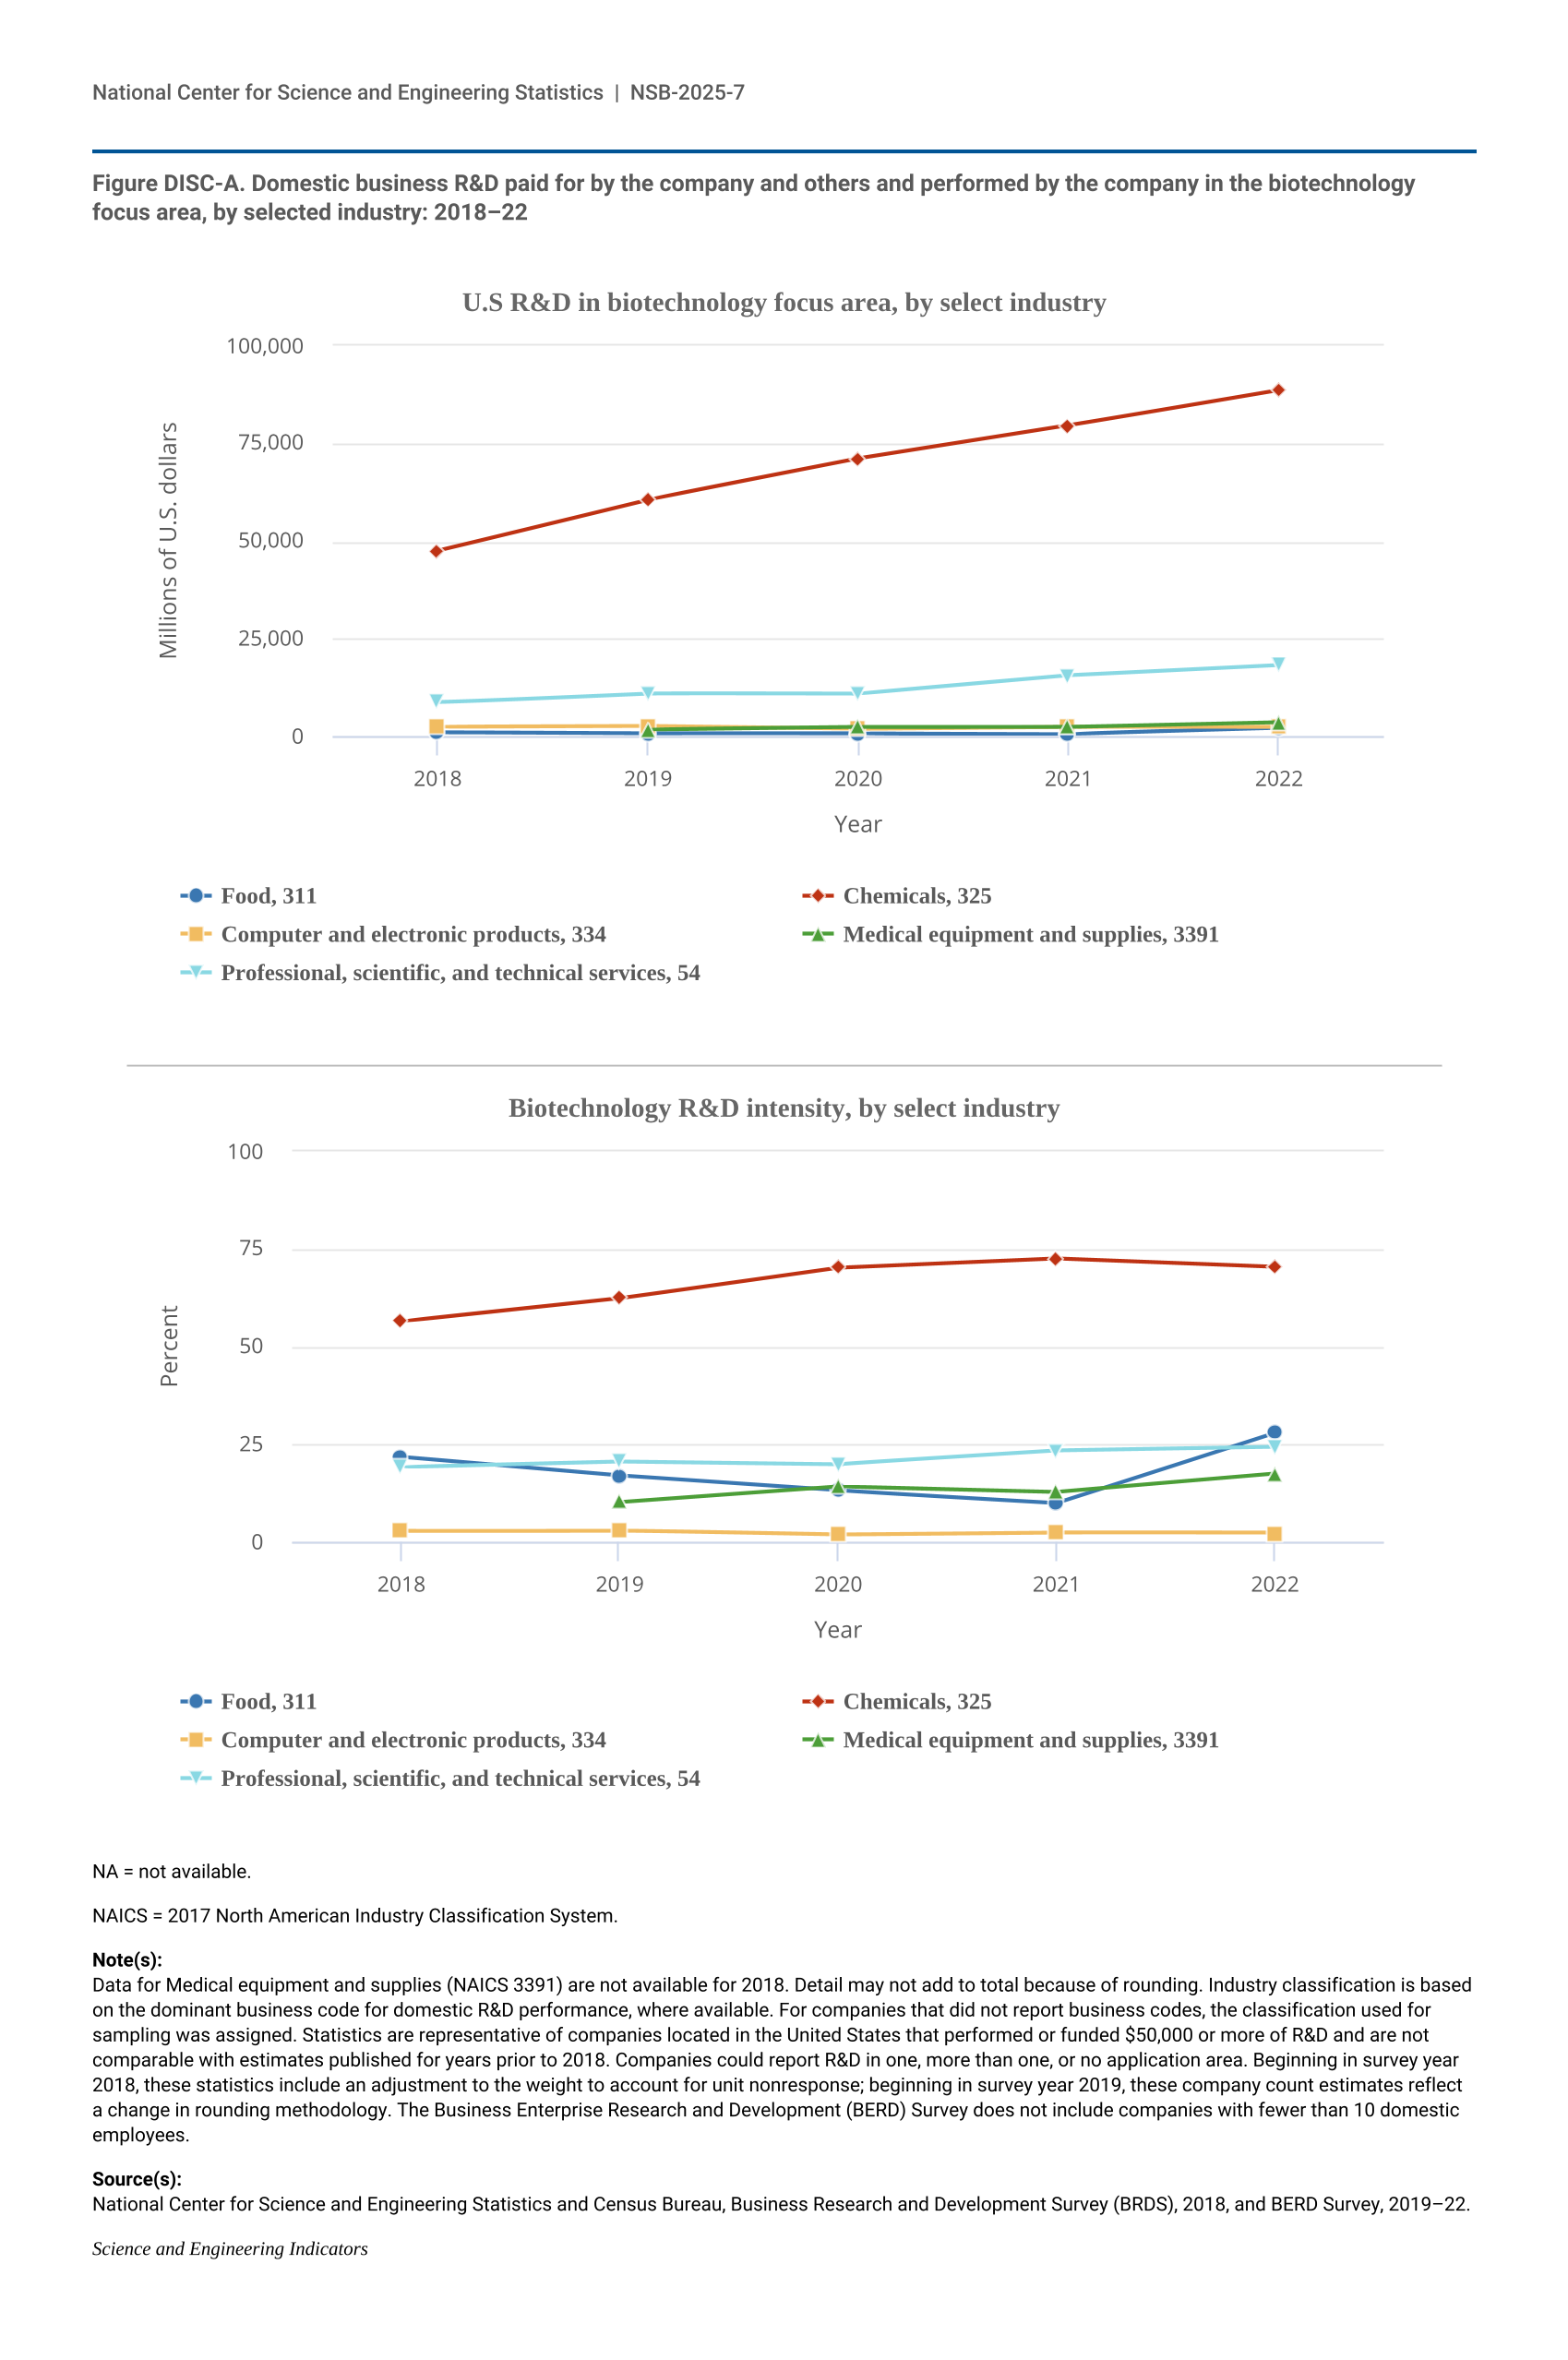
13 R&D-intensive manufacturing industries may engage in advanced manufacturing and intelligent manufacturing. Examples include additive or nano-based manufacturing and biotechnology and biomanufacturing. For additional information, see Brocal, Sebastián, and González (2019) and the President’s Council of Advisors on Science and Technology (2020).
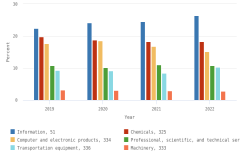
14 Companies could report expenditures on the same R&D project in one, more than one, or no technology category.
15 The share of software-focused R&D was 32% in 2016 and 20% in 2006 (Moris 2019).
16 HERD Survey data in this section are collected and reported by academic fiscal year, which runs from July through June. The NCSES HERD Survey collects data on universities’ annual R&D spending, the sources of funds supporting that spending, and how the spending is distributed across types of R&D, fields of research, and institutions with specific features. Academic institutions that had $150,000 or more in separately budgeted R&D expenditures for the previous year and were geographically separate campuses headed by a president, chancellor, or equivalent were included in the survey. For further details, see https://ncses.nsf.gov/surveys/higher-education-research-development/2022#methodology.
17 Institutional funds include institutionally financed research (all R&D funded by the institution from accounts that are only used for research, excluding institution research administration and support), cost sharing (committed), and unrecovered indirect costs (the portion of indirect costs associated with a sponsored project that was not reimbursed by the sponsor in accordance with the institution’s negotiated indirect cost rate). For further details, see https://ncses.nsf.gov/surveys/higher-education-research-development/2023#methodology.
18 Many R&D activities require dedicated research space. In FY 2023, academic institutions reported allocating 240.2 million square feet of space to S&E research, up from 236.1 million in 2021 and 226.9 million in 2019 (Gibbons 2024b). The three S&E research components with the highest amount of S&E research space in 2023 are biological and medical sciences (61.2 million square feet), medical school spaces (52.2 million square feet), and engineering (42 million square feet) (NCSES Facilities 2023: Table 1).
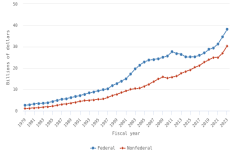
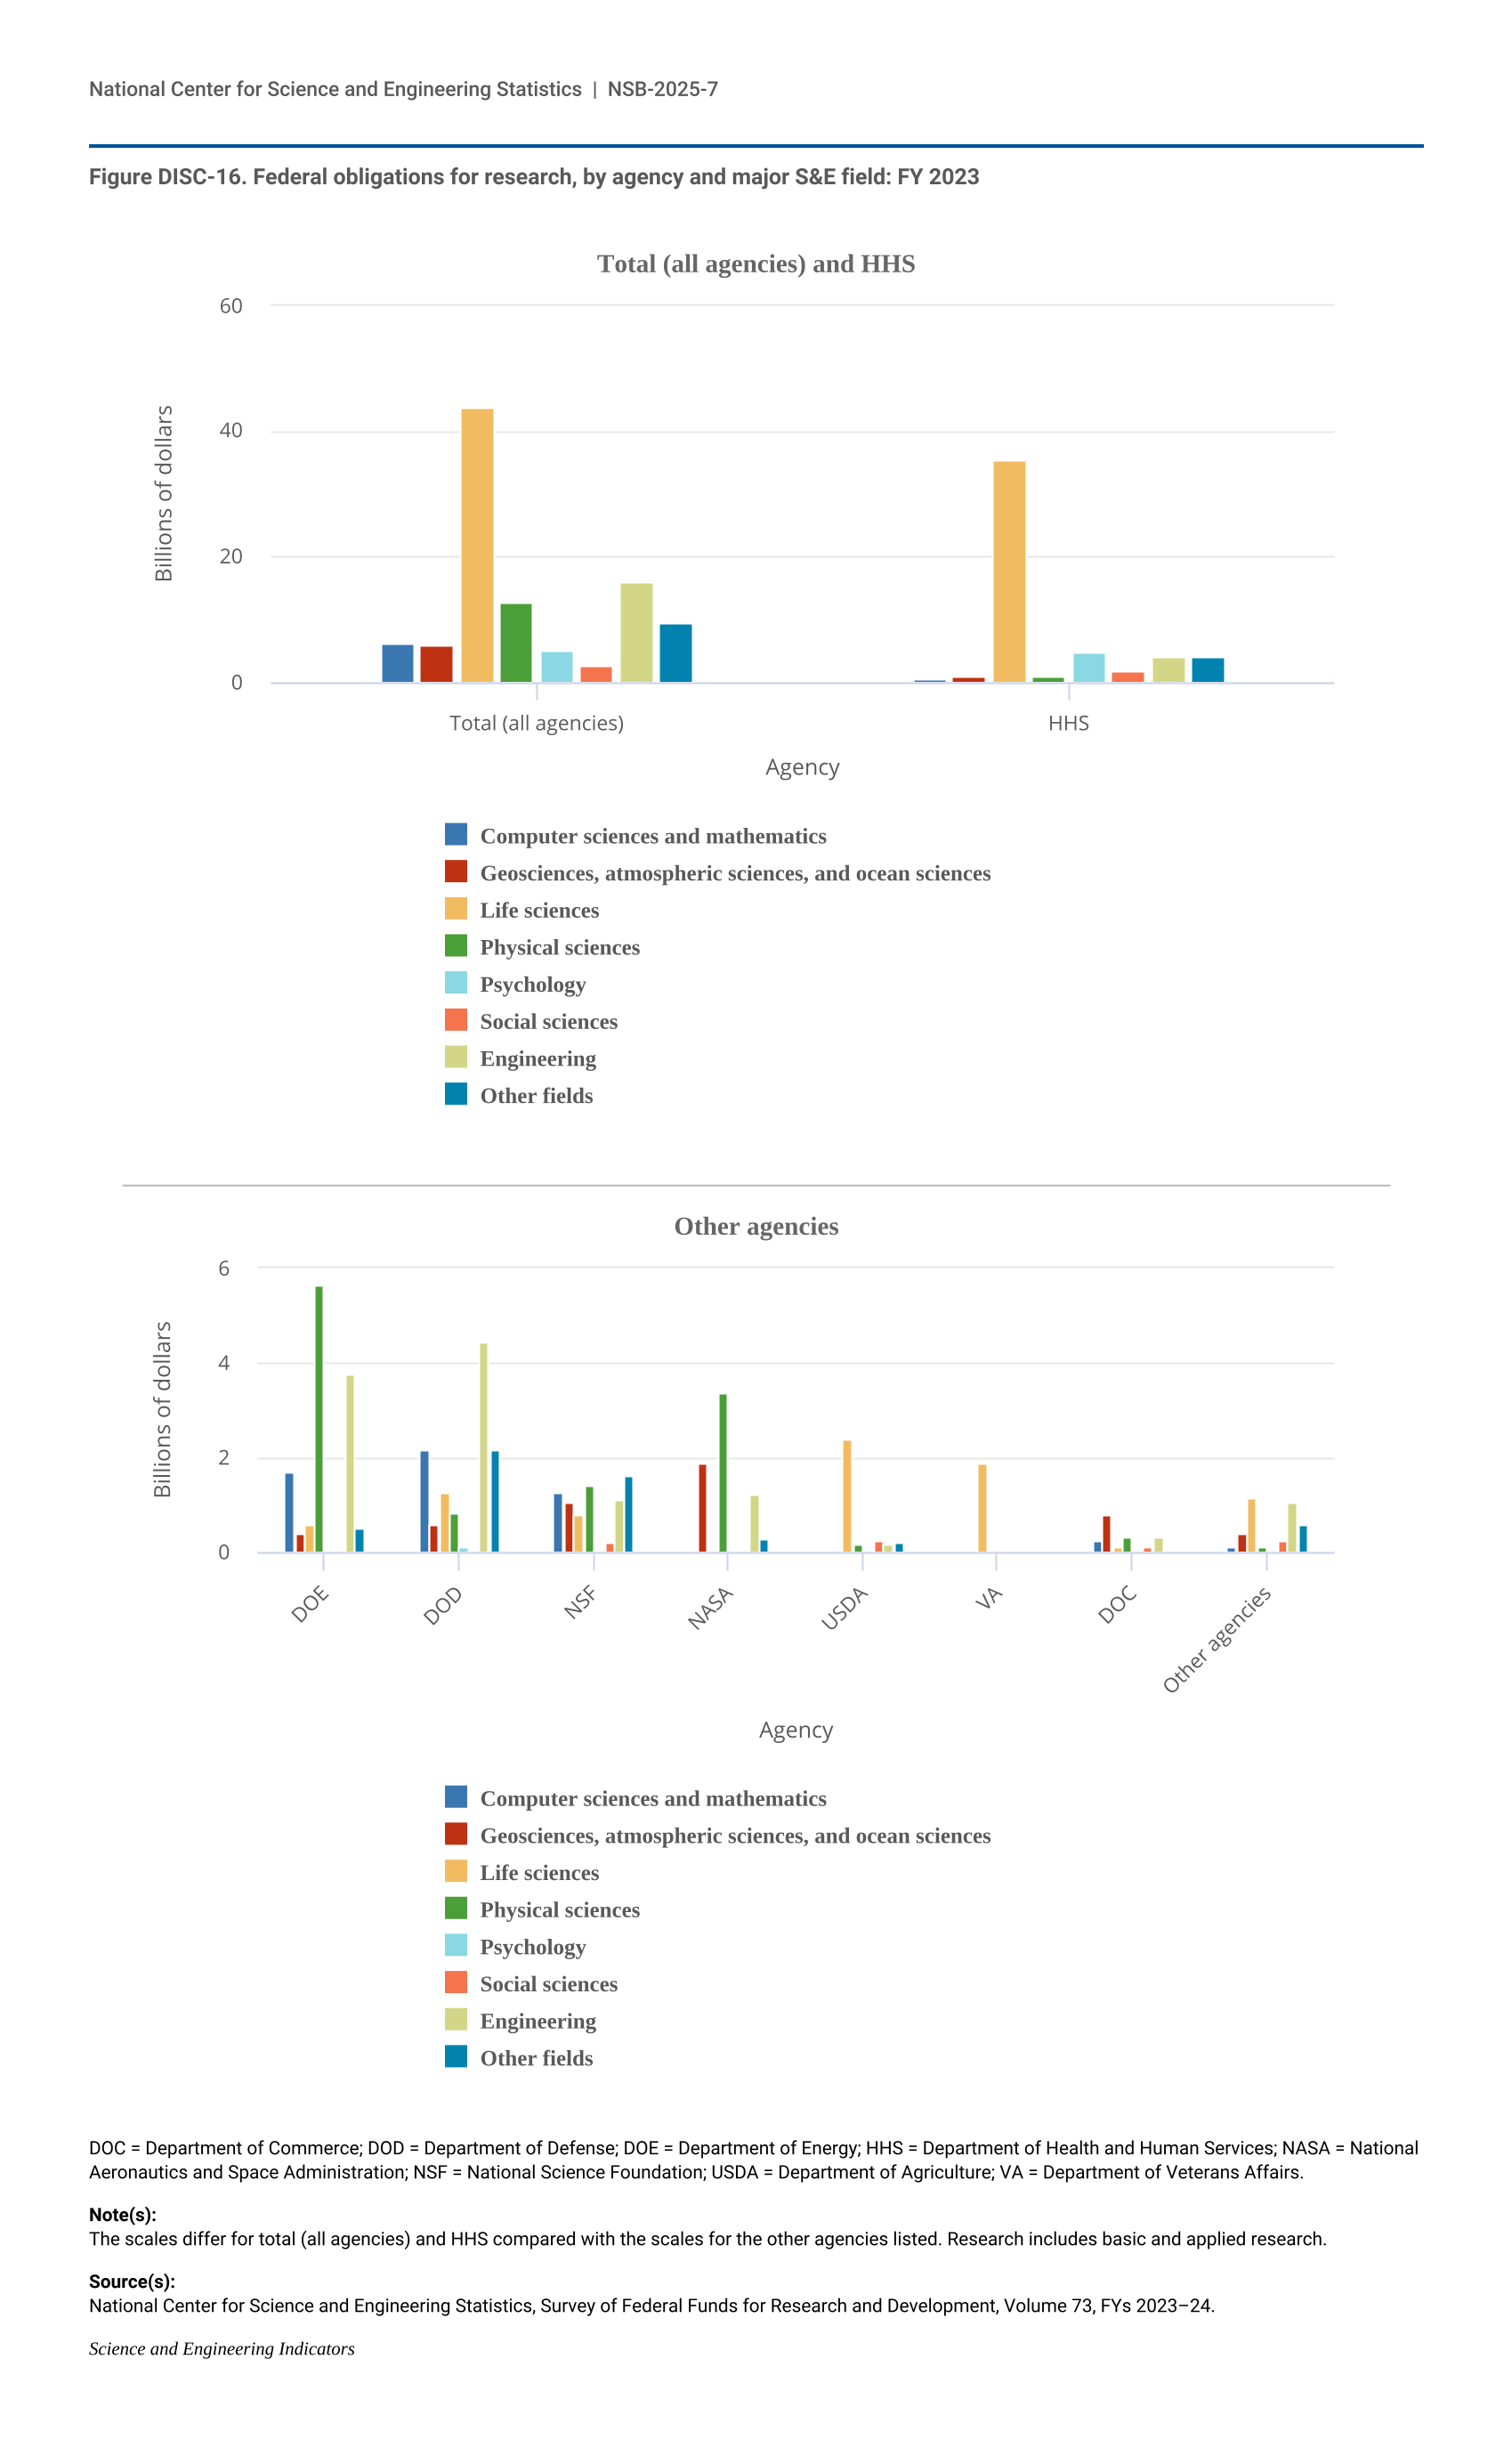
19 Data in this section are reported by federal fiscal years. For additional information on the impact of supplemental appropriations on federal R&D obligations, including Public Law (P.L.) 111-5, P.L. 117-58, P.L. 117-167, and P.L. 117-169; see Pece (2023, 2024) and NCSES (2025c: Figure 1).
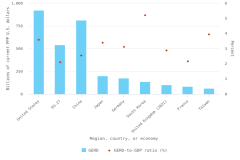
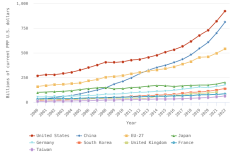
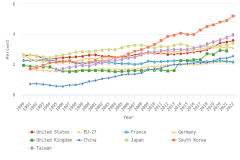
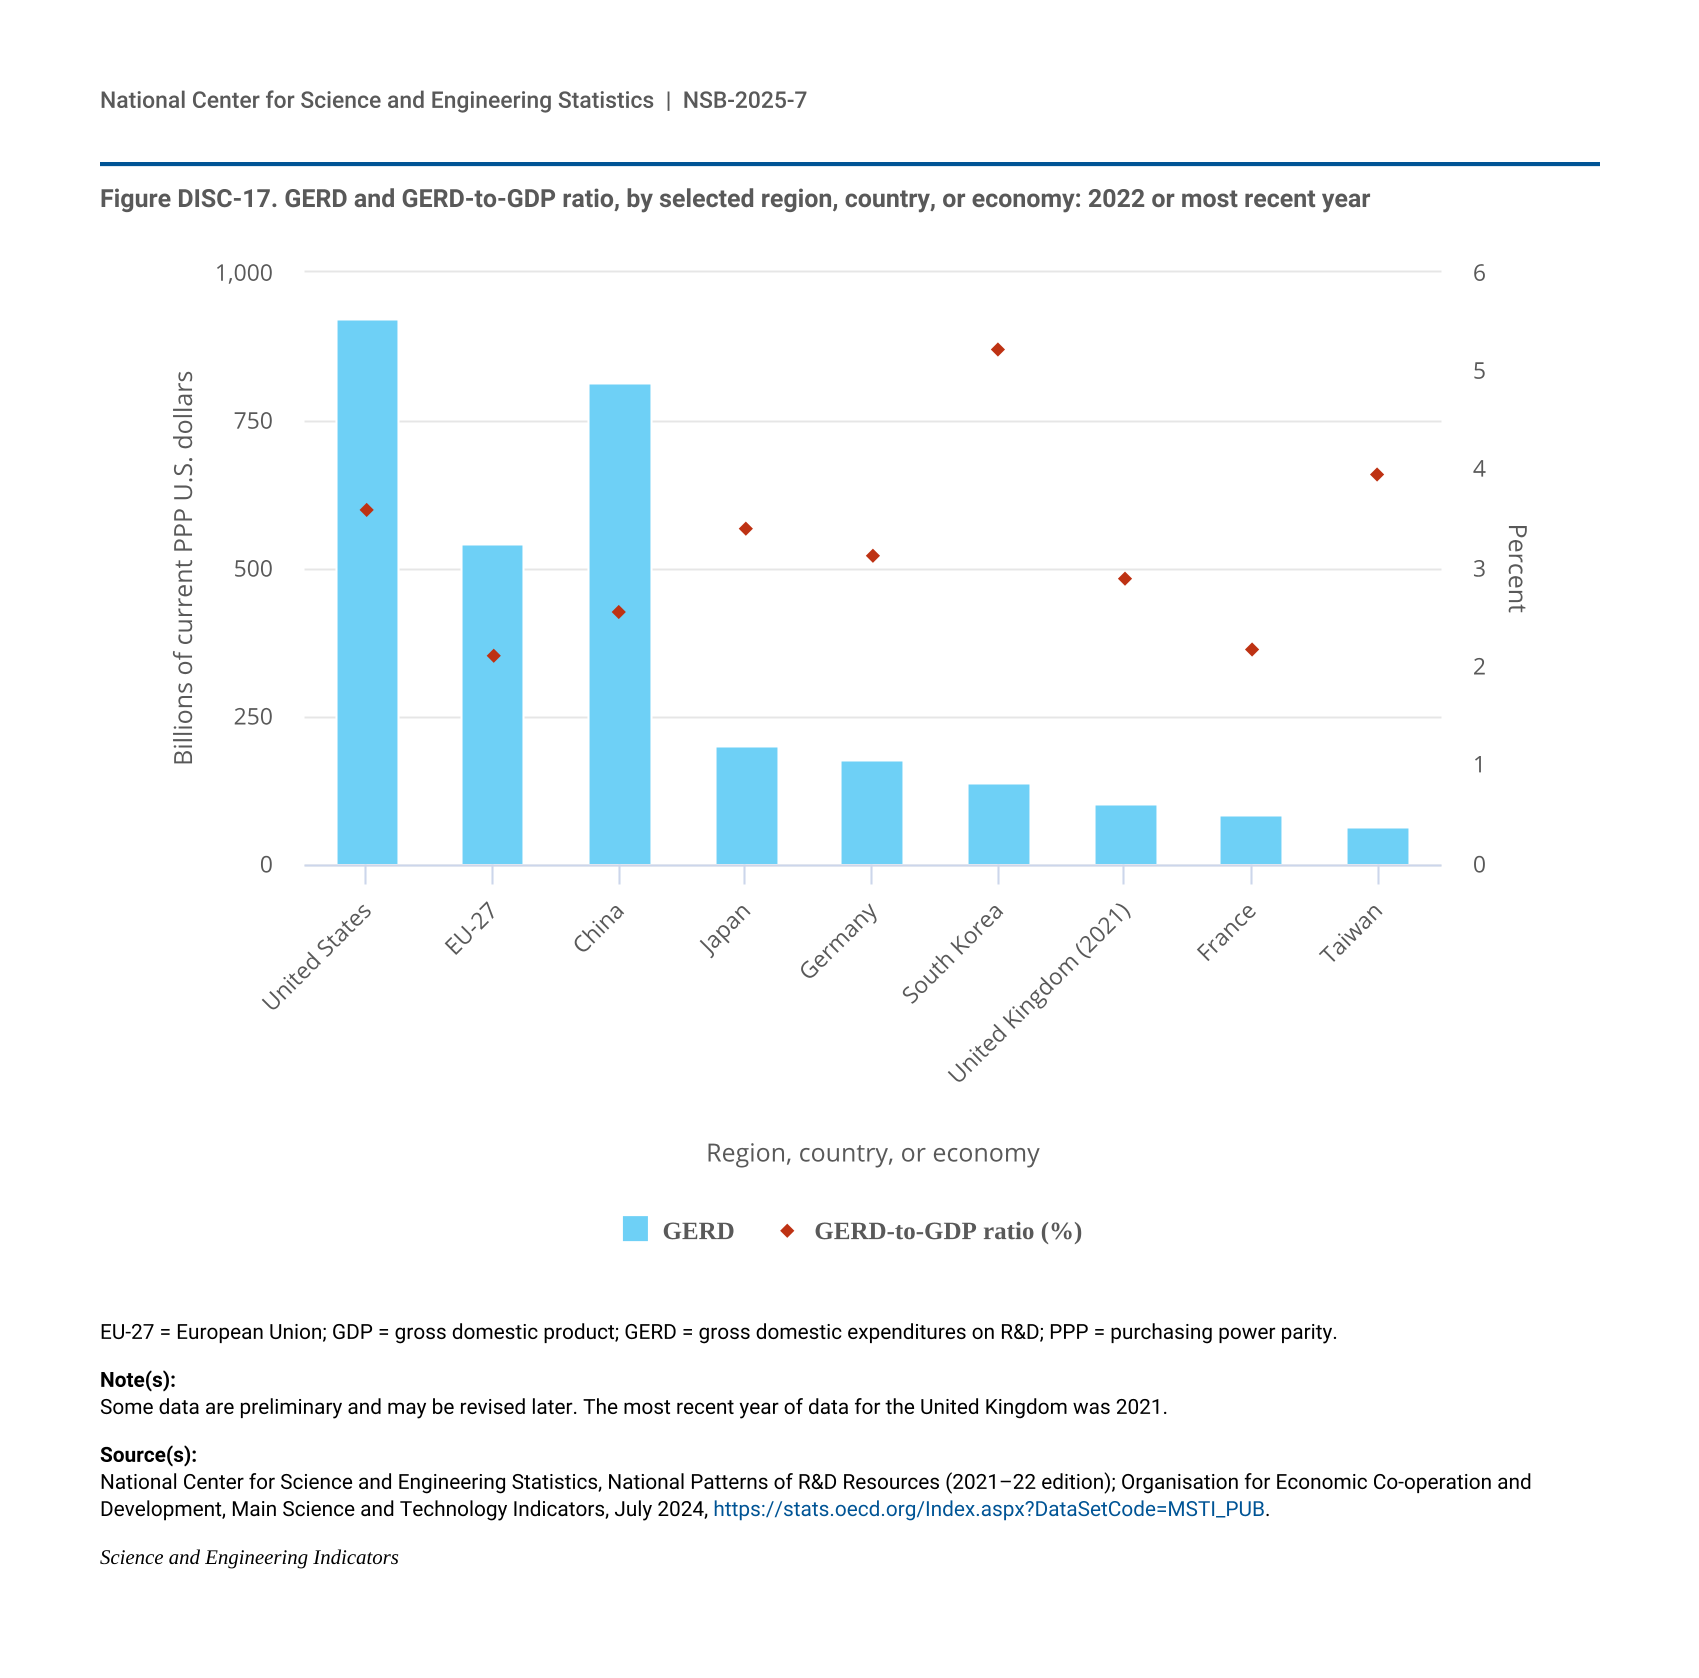
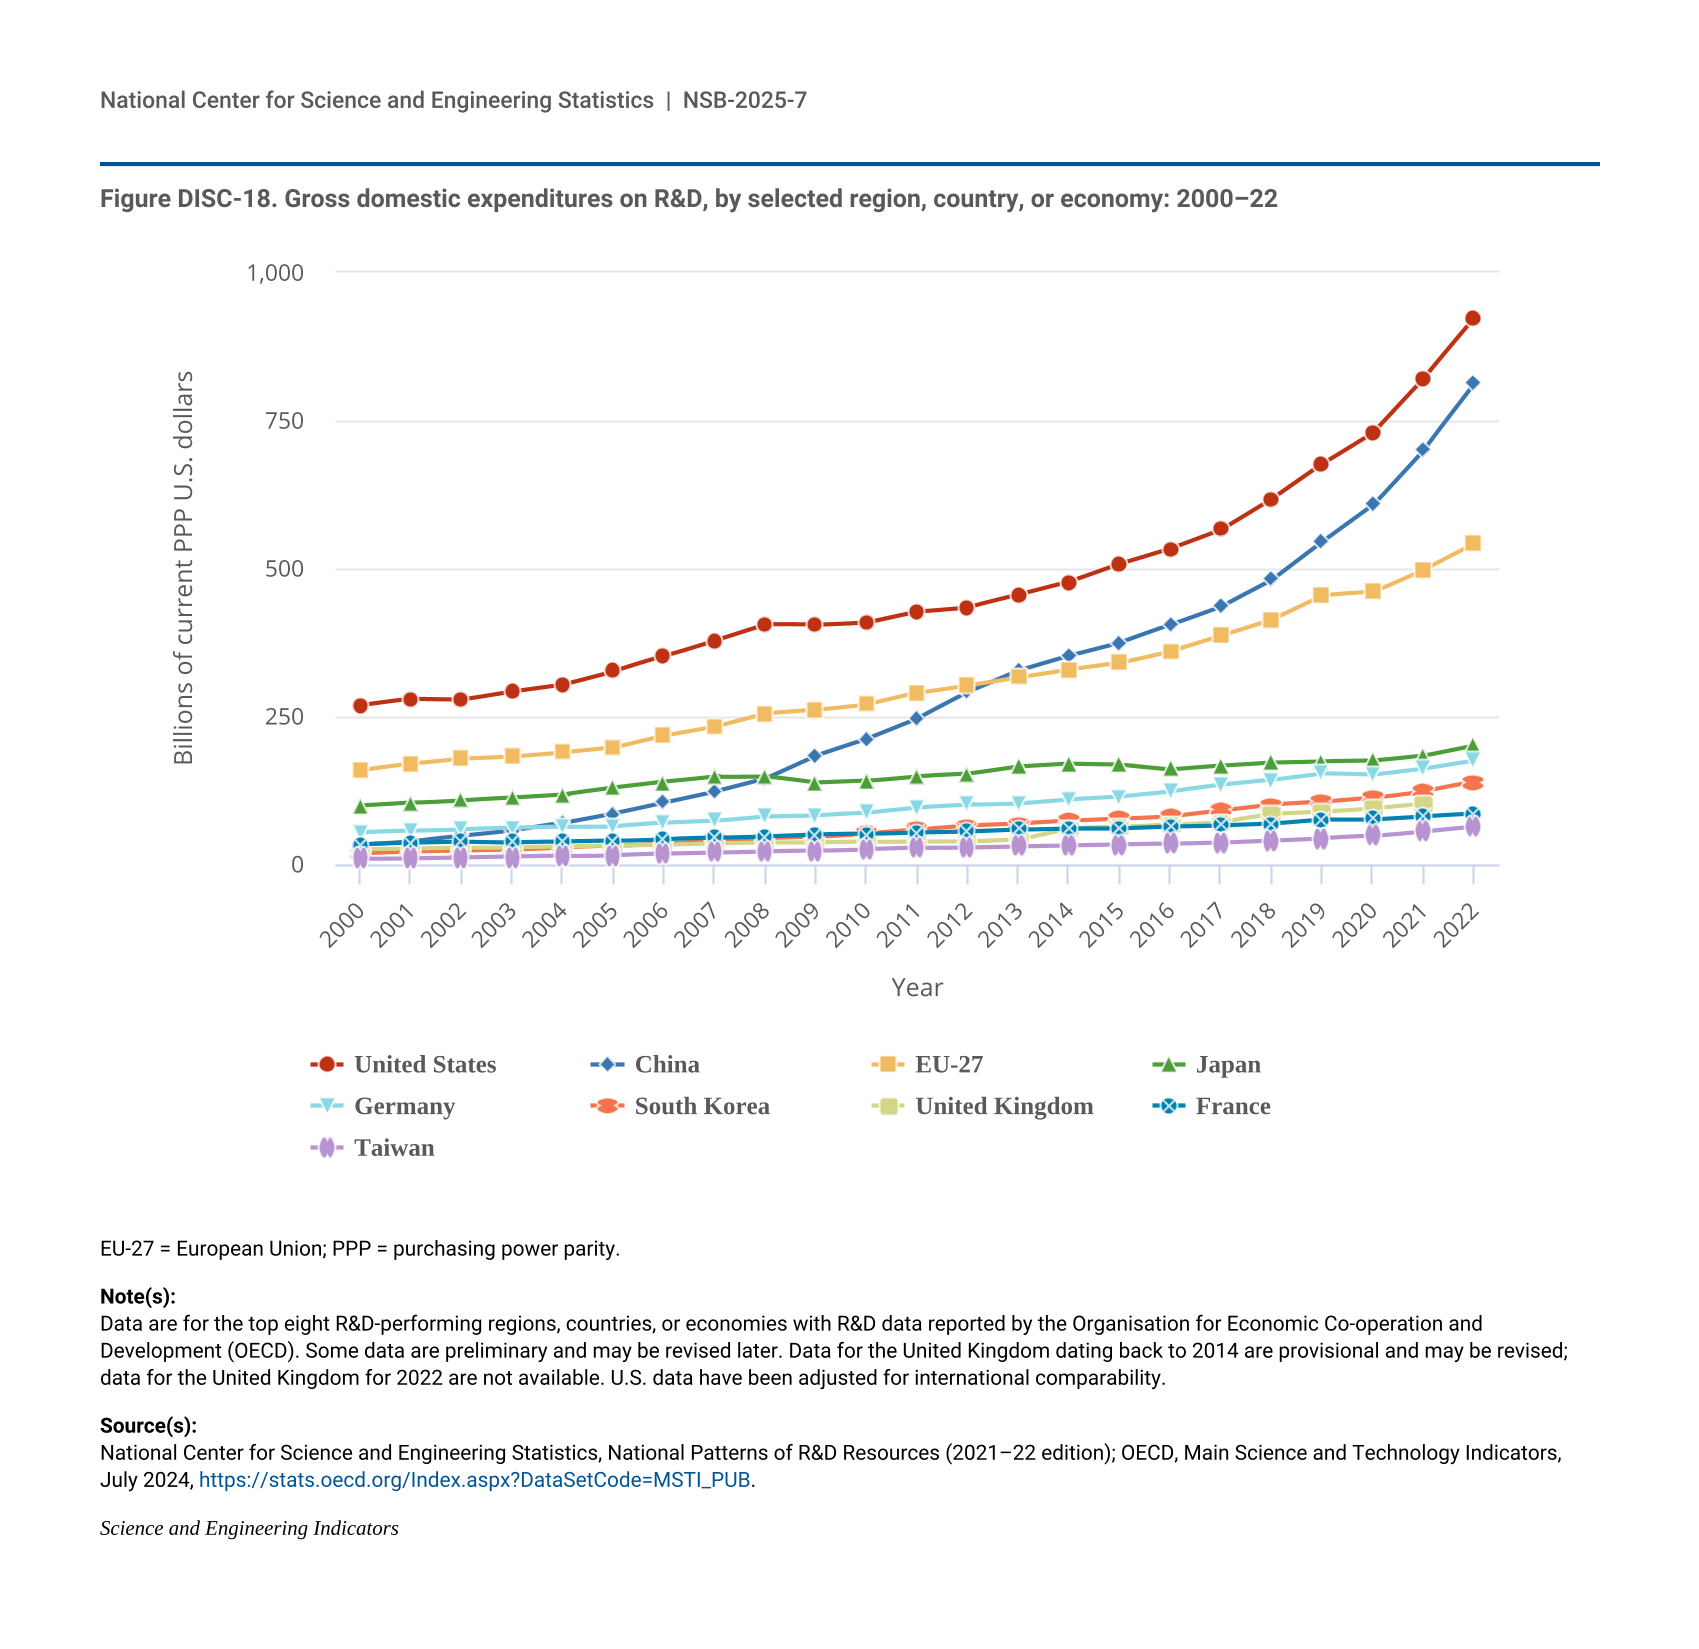
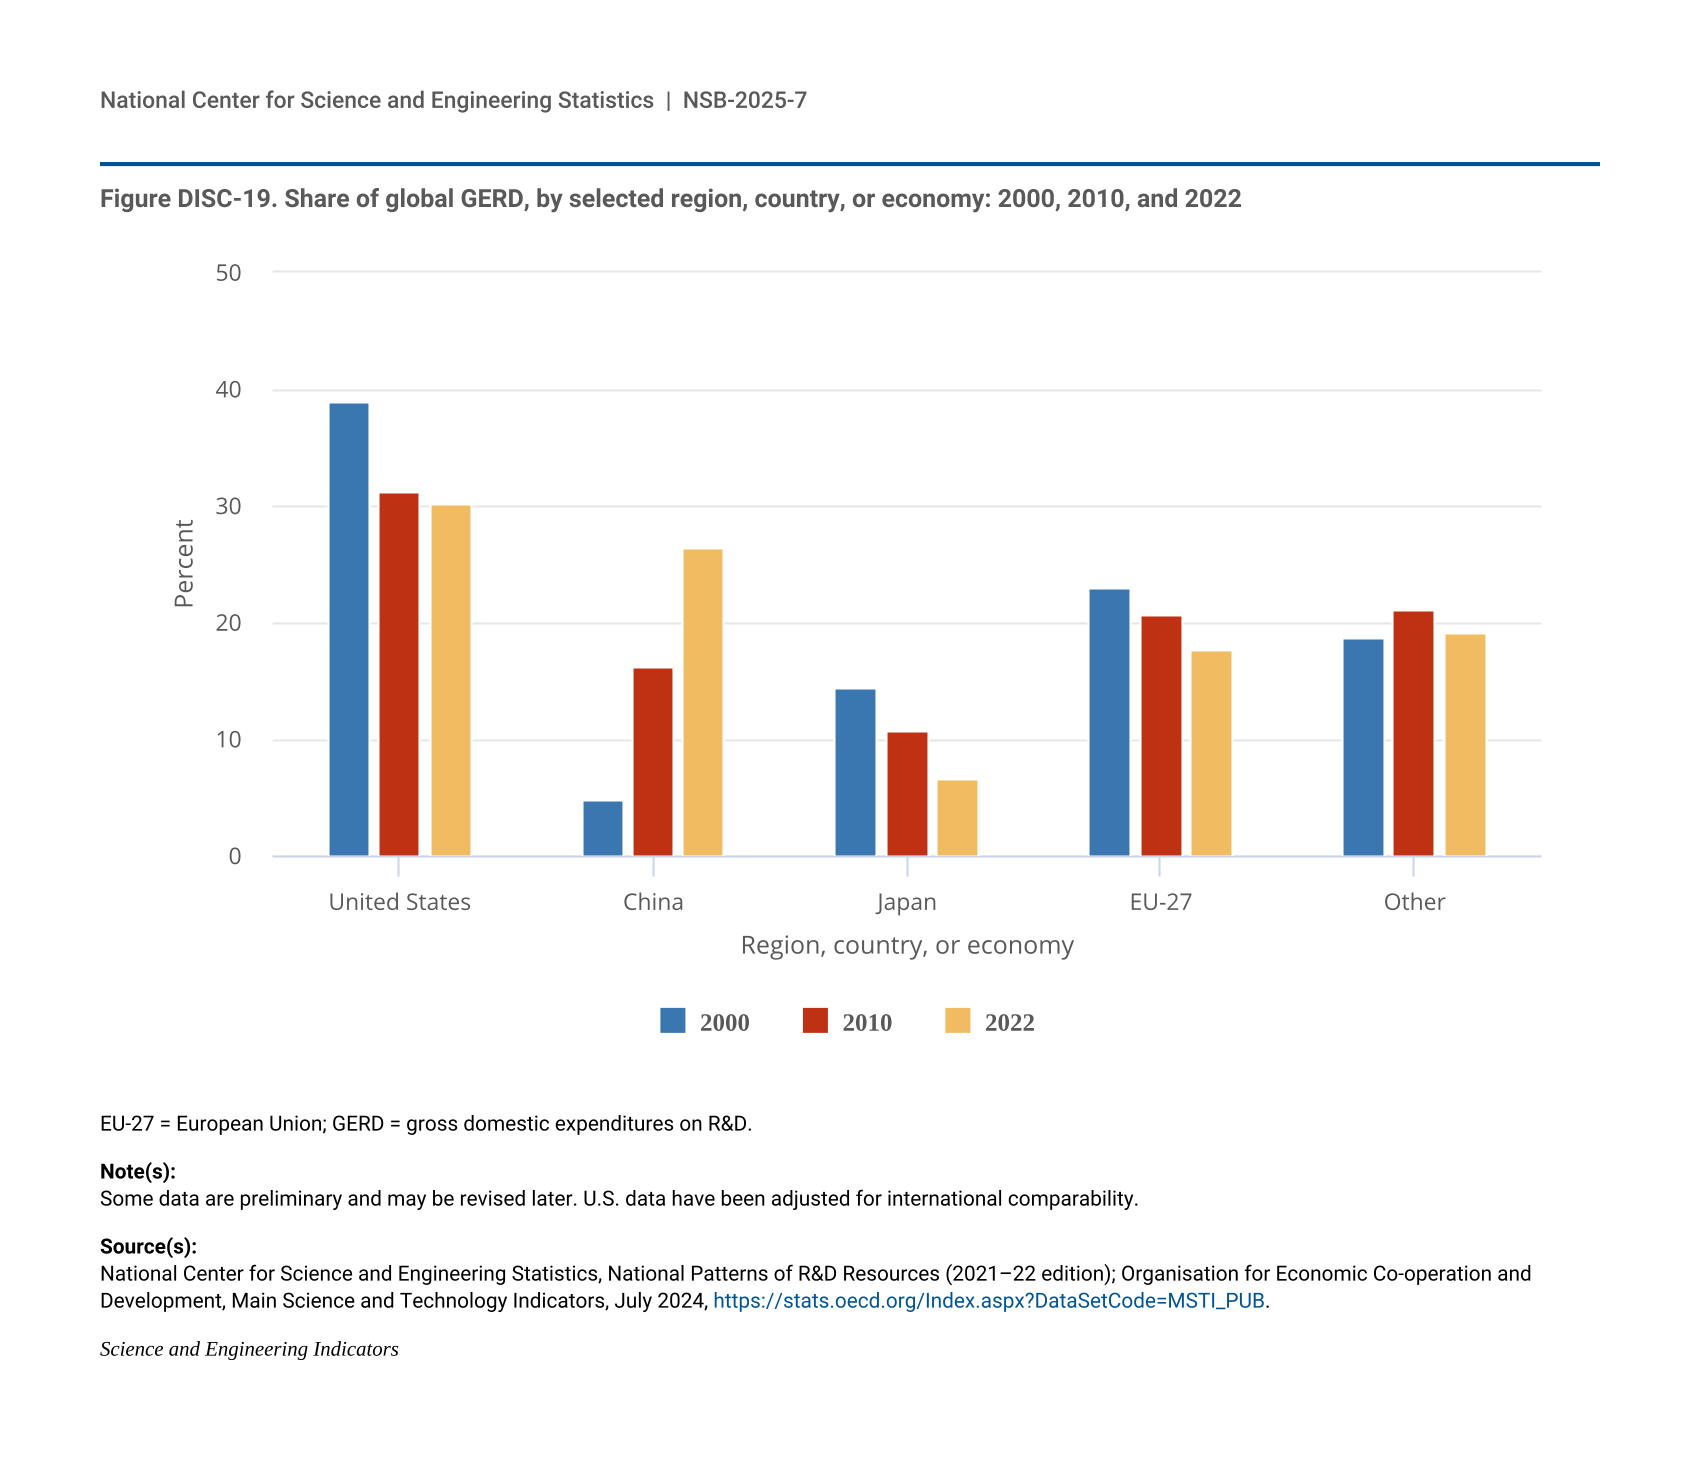
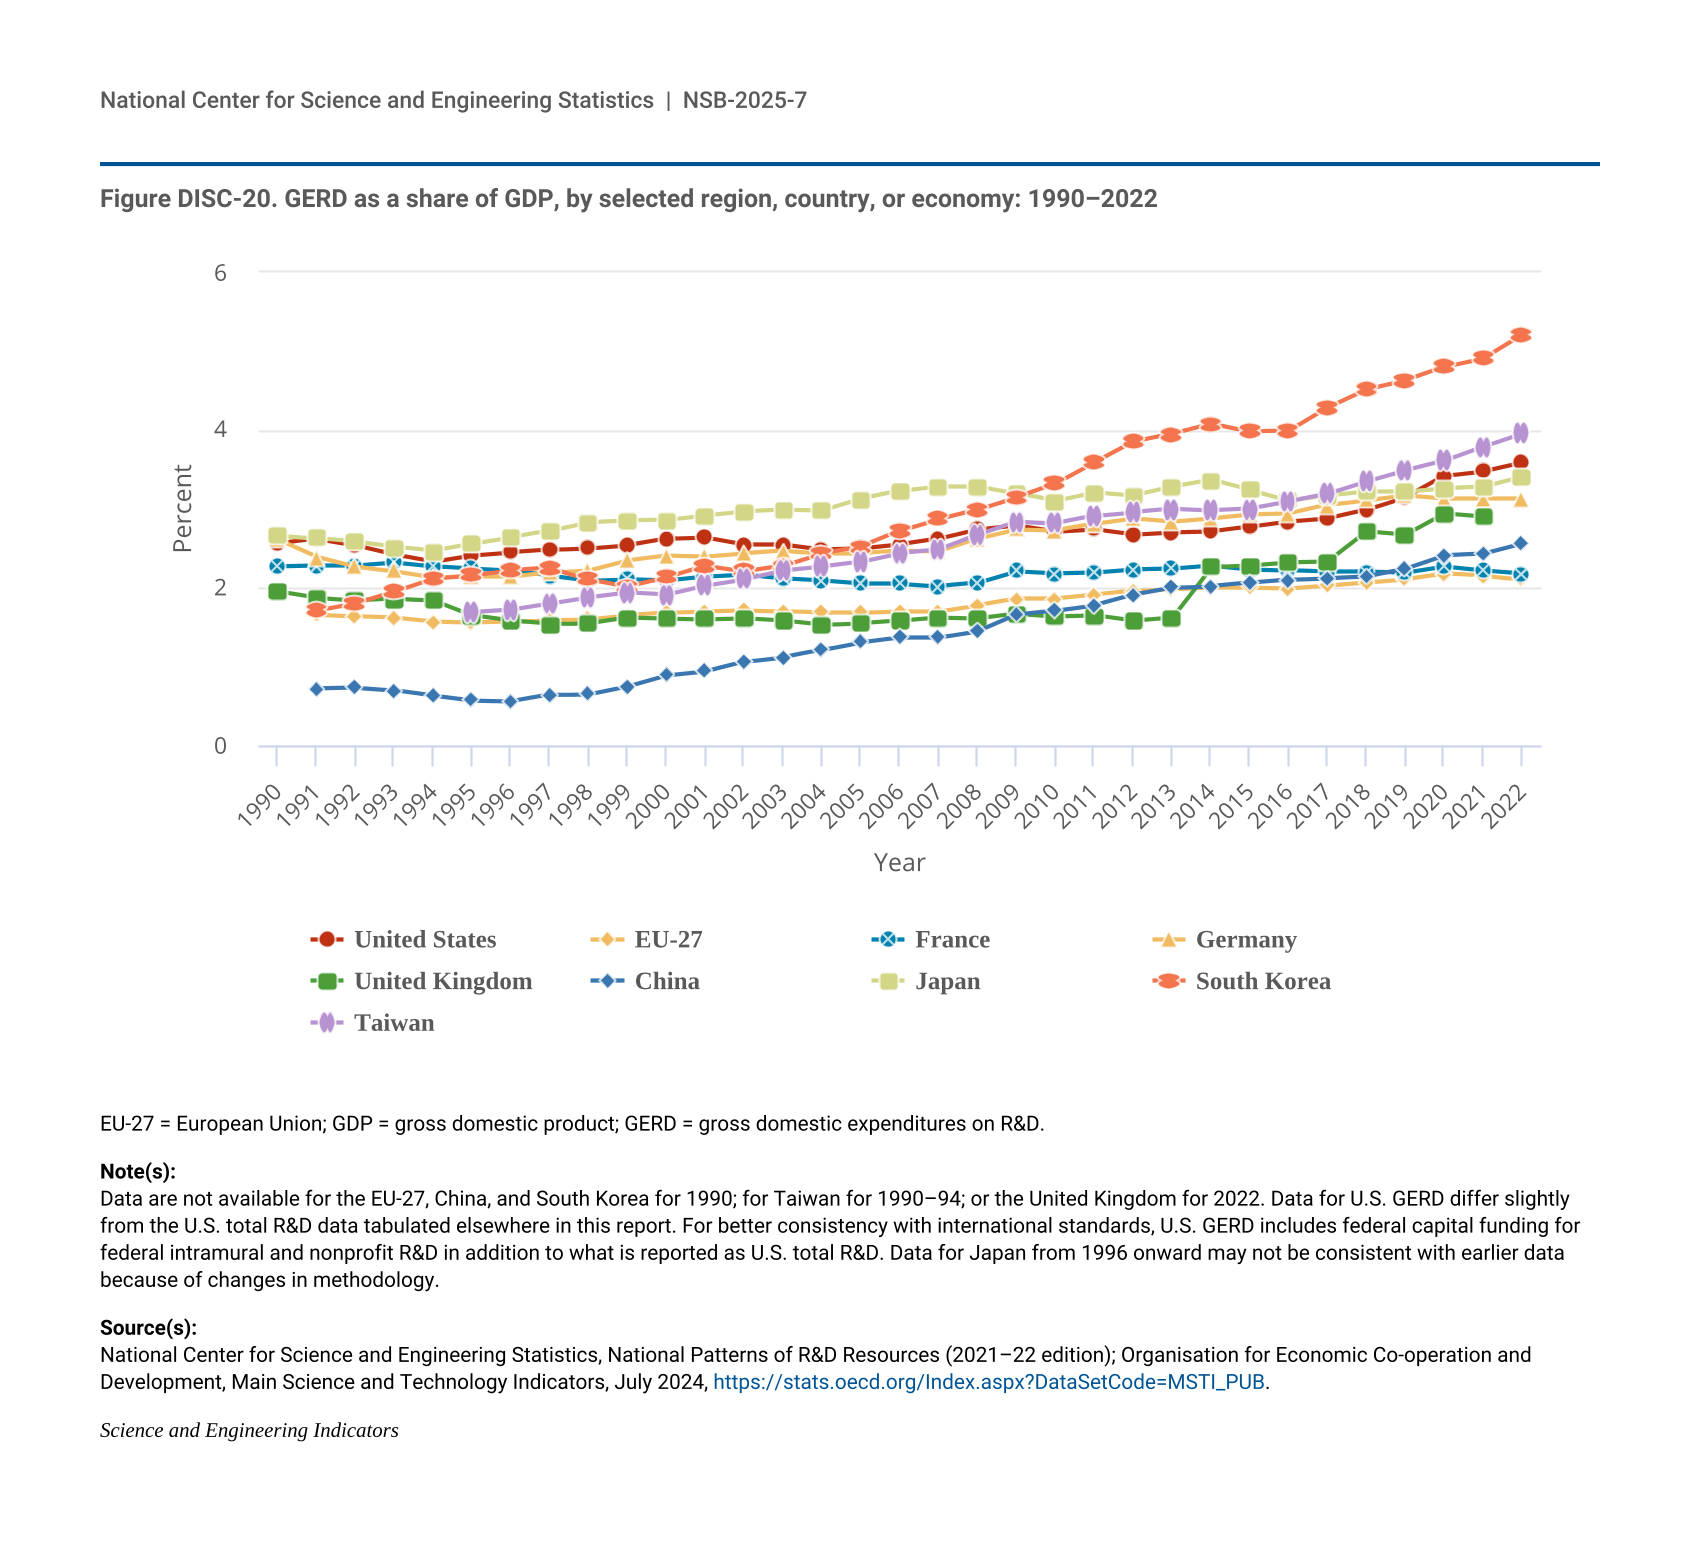
20 The global total is based on 2022 or, for countries with missing data in the OECD database, the latest available year. Comparable data on R&D were not available from the United Nations Educational, Scientific and Cultural Organization database, where most non-OECD R&D statistics were obtained in previous reports.
21 U.S. GERD as reported by OECD differs slightly from the U.S. total domestic R&D performance tabulated earlier in this report. For consistency with international standards for the measurement of GERD, OECD includes U.S. domestic expenditures on capital for R&D, excludes depreciation on U.S. domestic R&D capital, and makes certain adjustments for foreign sources of funding of domestic R&D.
22 United Kingdom GERD data are for 2021. Statistics in this section cover available data from MSTI (OECD 2024d) and are reported in U.S. dollars using purchasing power parity (PPP). PPP converts different currencies to a common currency while adjusting for differences in price levels between economies, allowing for cross-country comparisons.
23 For international comparative measures of other forms of R&D support by governments such as tax incentives, see the OECD INNOTAX Portal (OECD 2024c).
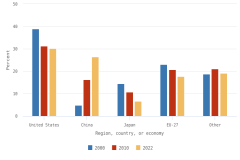
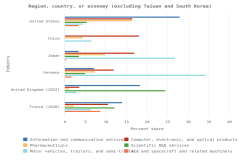
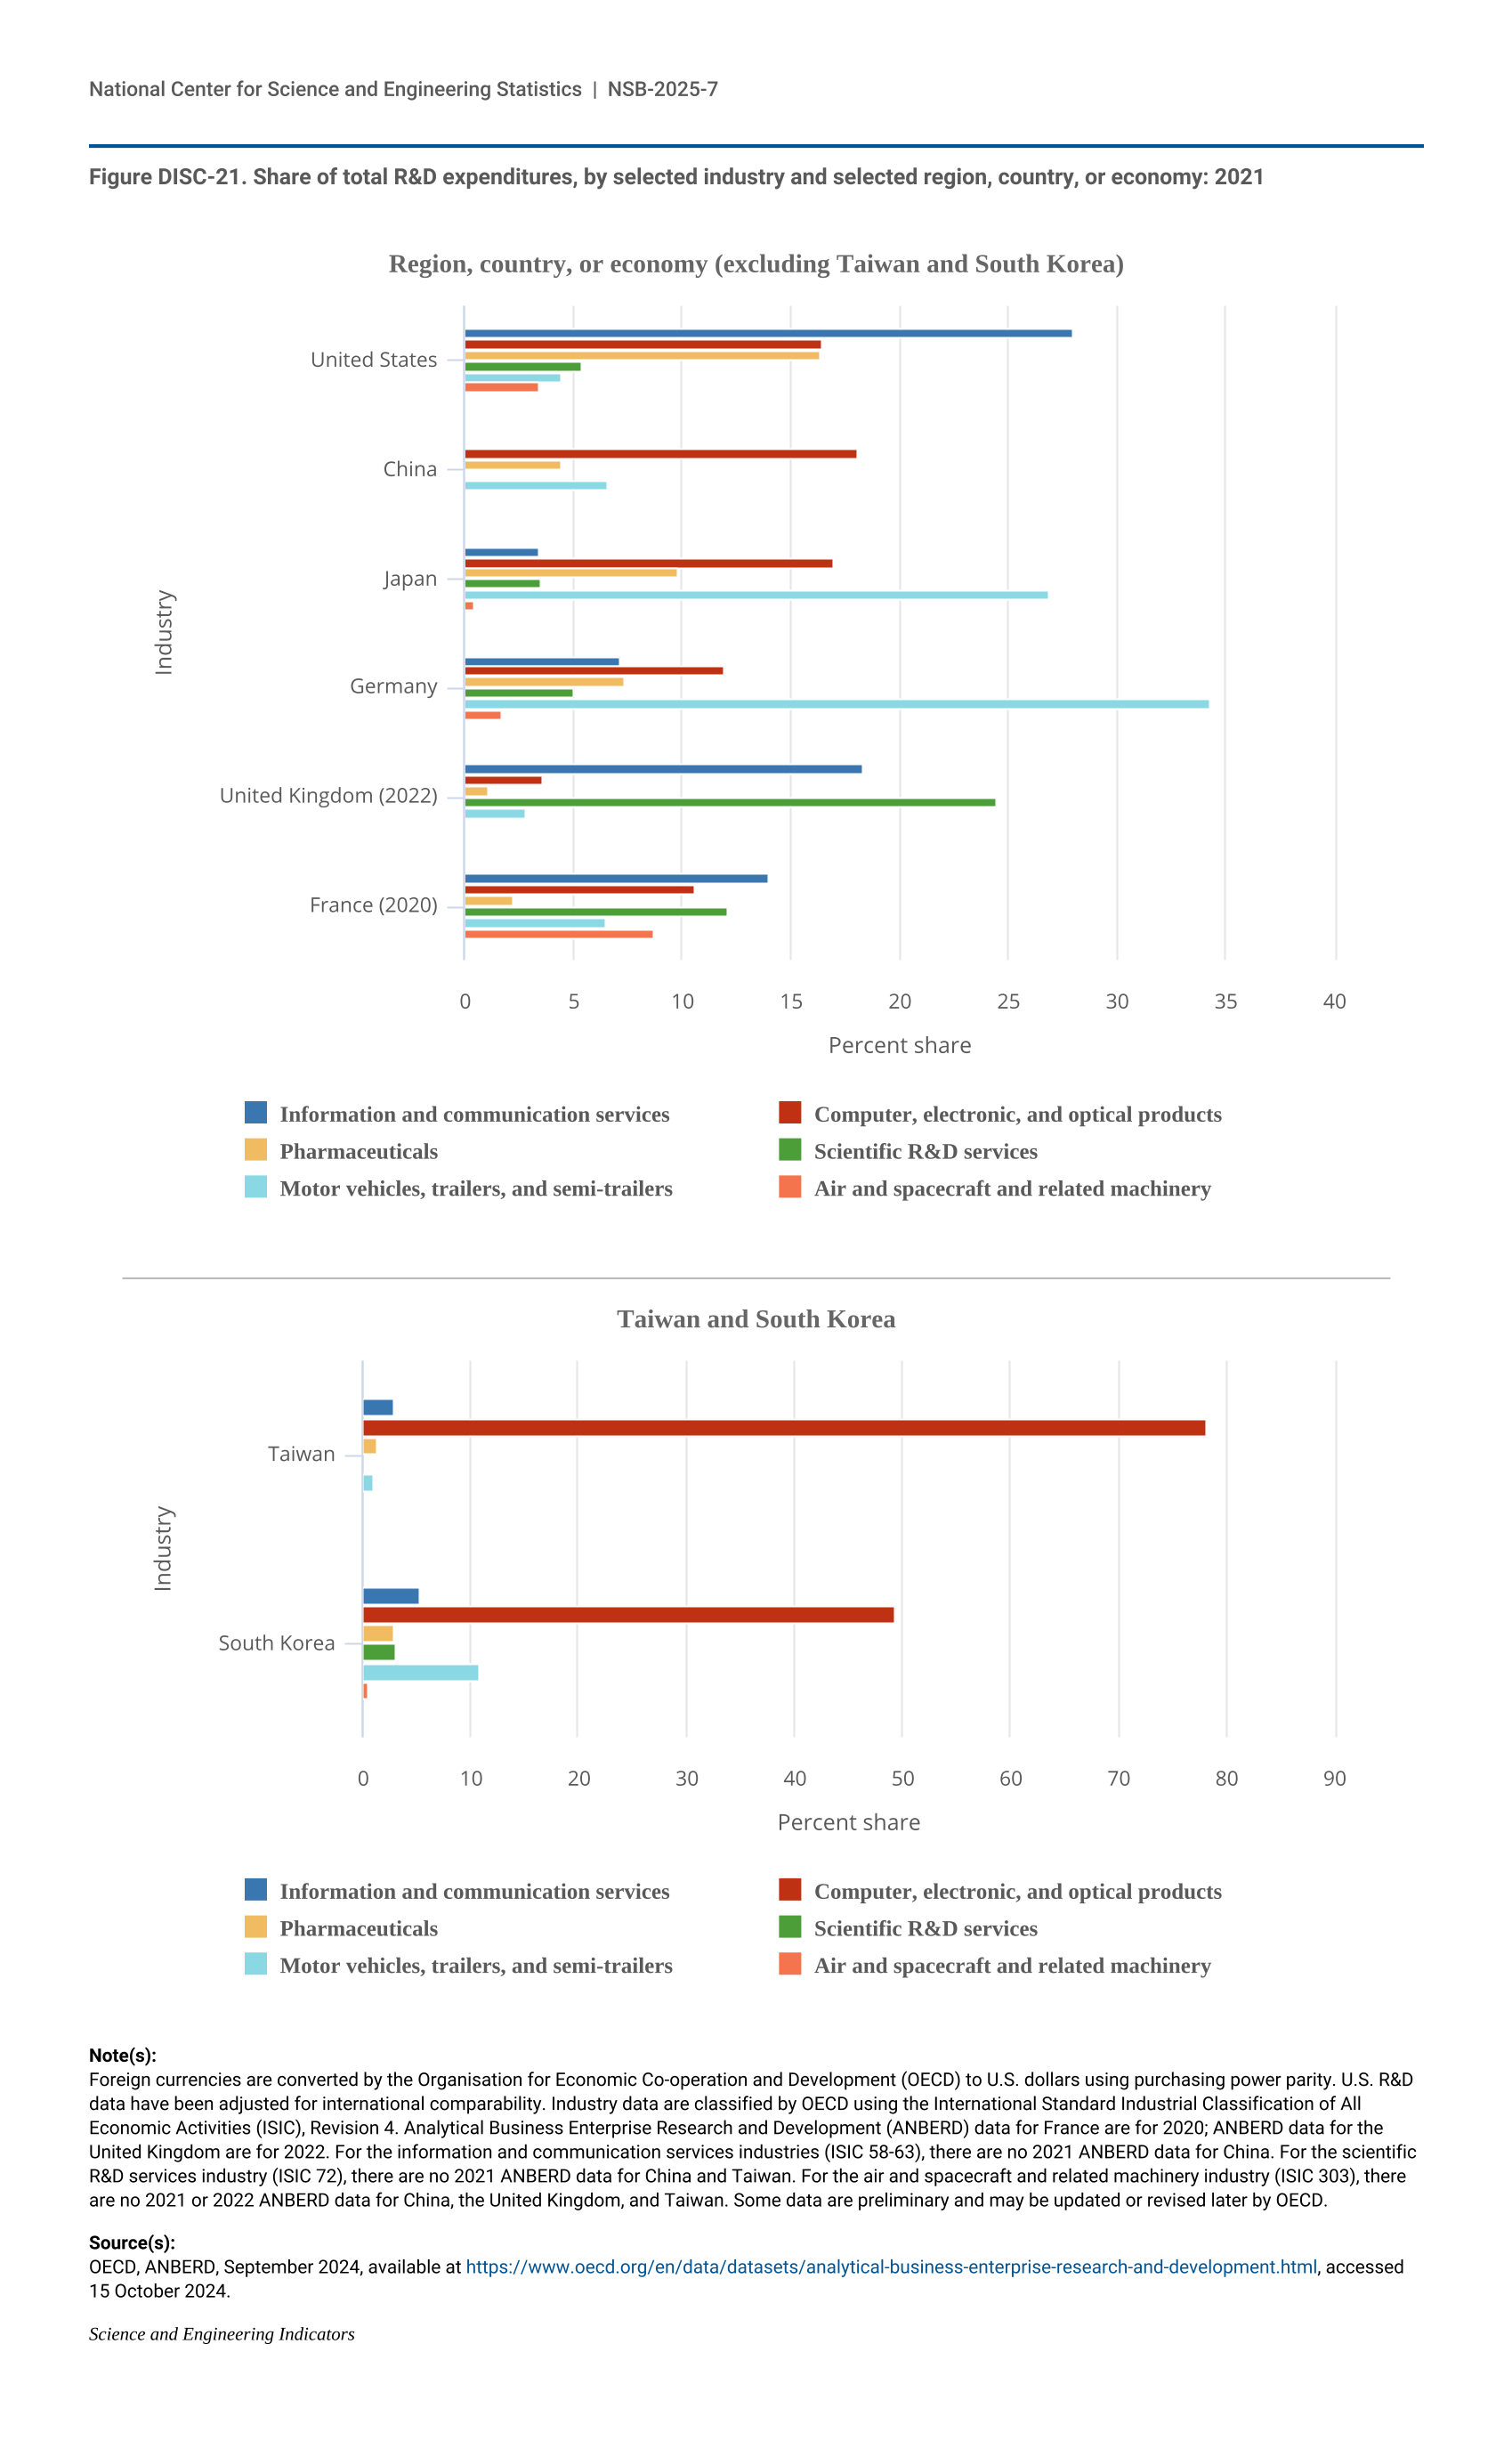
24 OECD ANBERD data are classified according to the International Standard Industrial Classification of All Economic Activities (ISIC 4), Revision 4. Data for France are for 2020, and data for the United Kingdom are for 2022. For the information and communication services industries (ISIC 58-63), there is no 2021 information in the OECD ANBERD database for China.
25 For the scientific R&D services industry (ISIC 72), there is no 2021 information in the OECD ANBERD database for China and Taiwan.
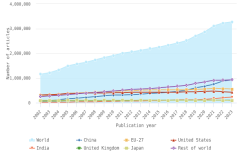
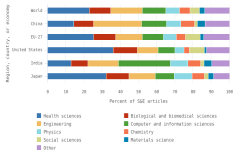
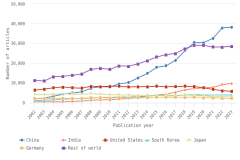
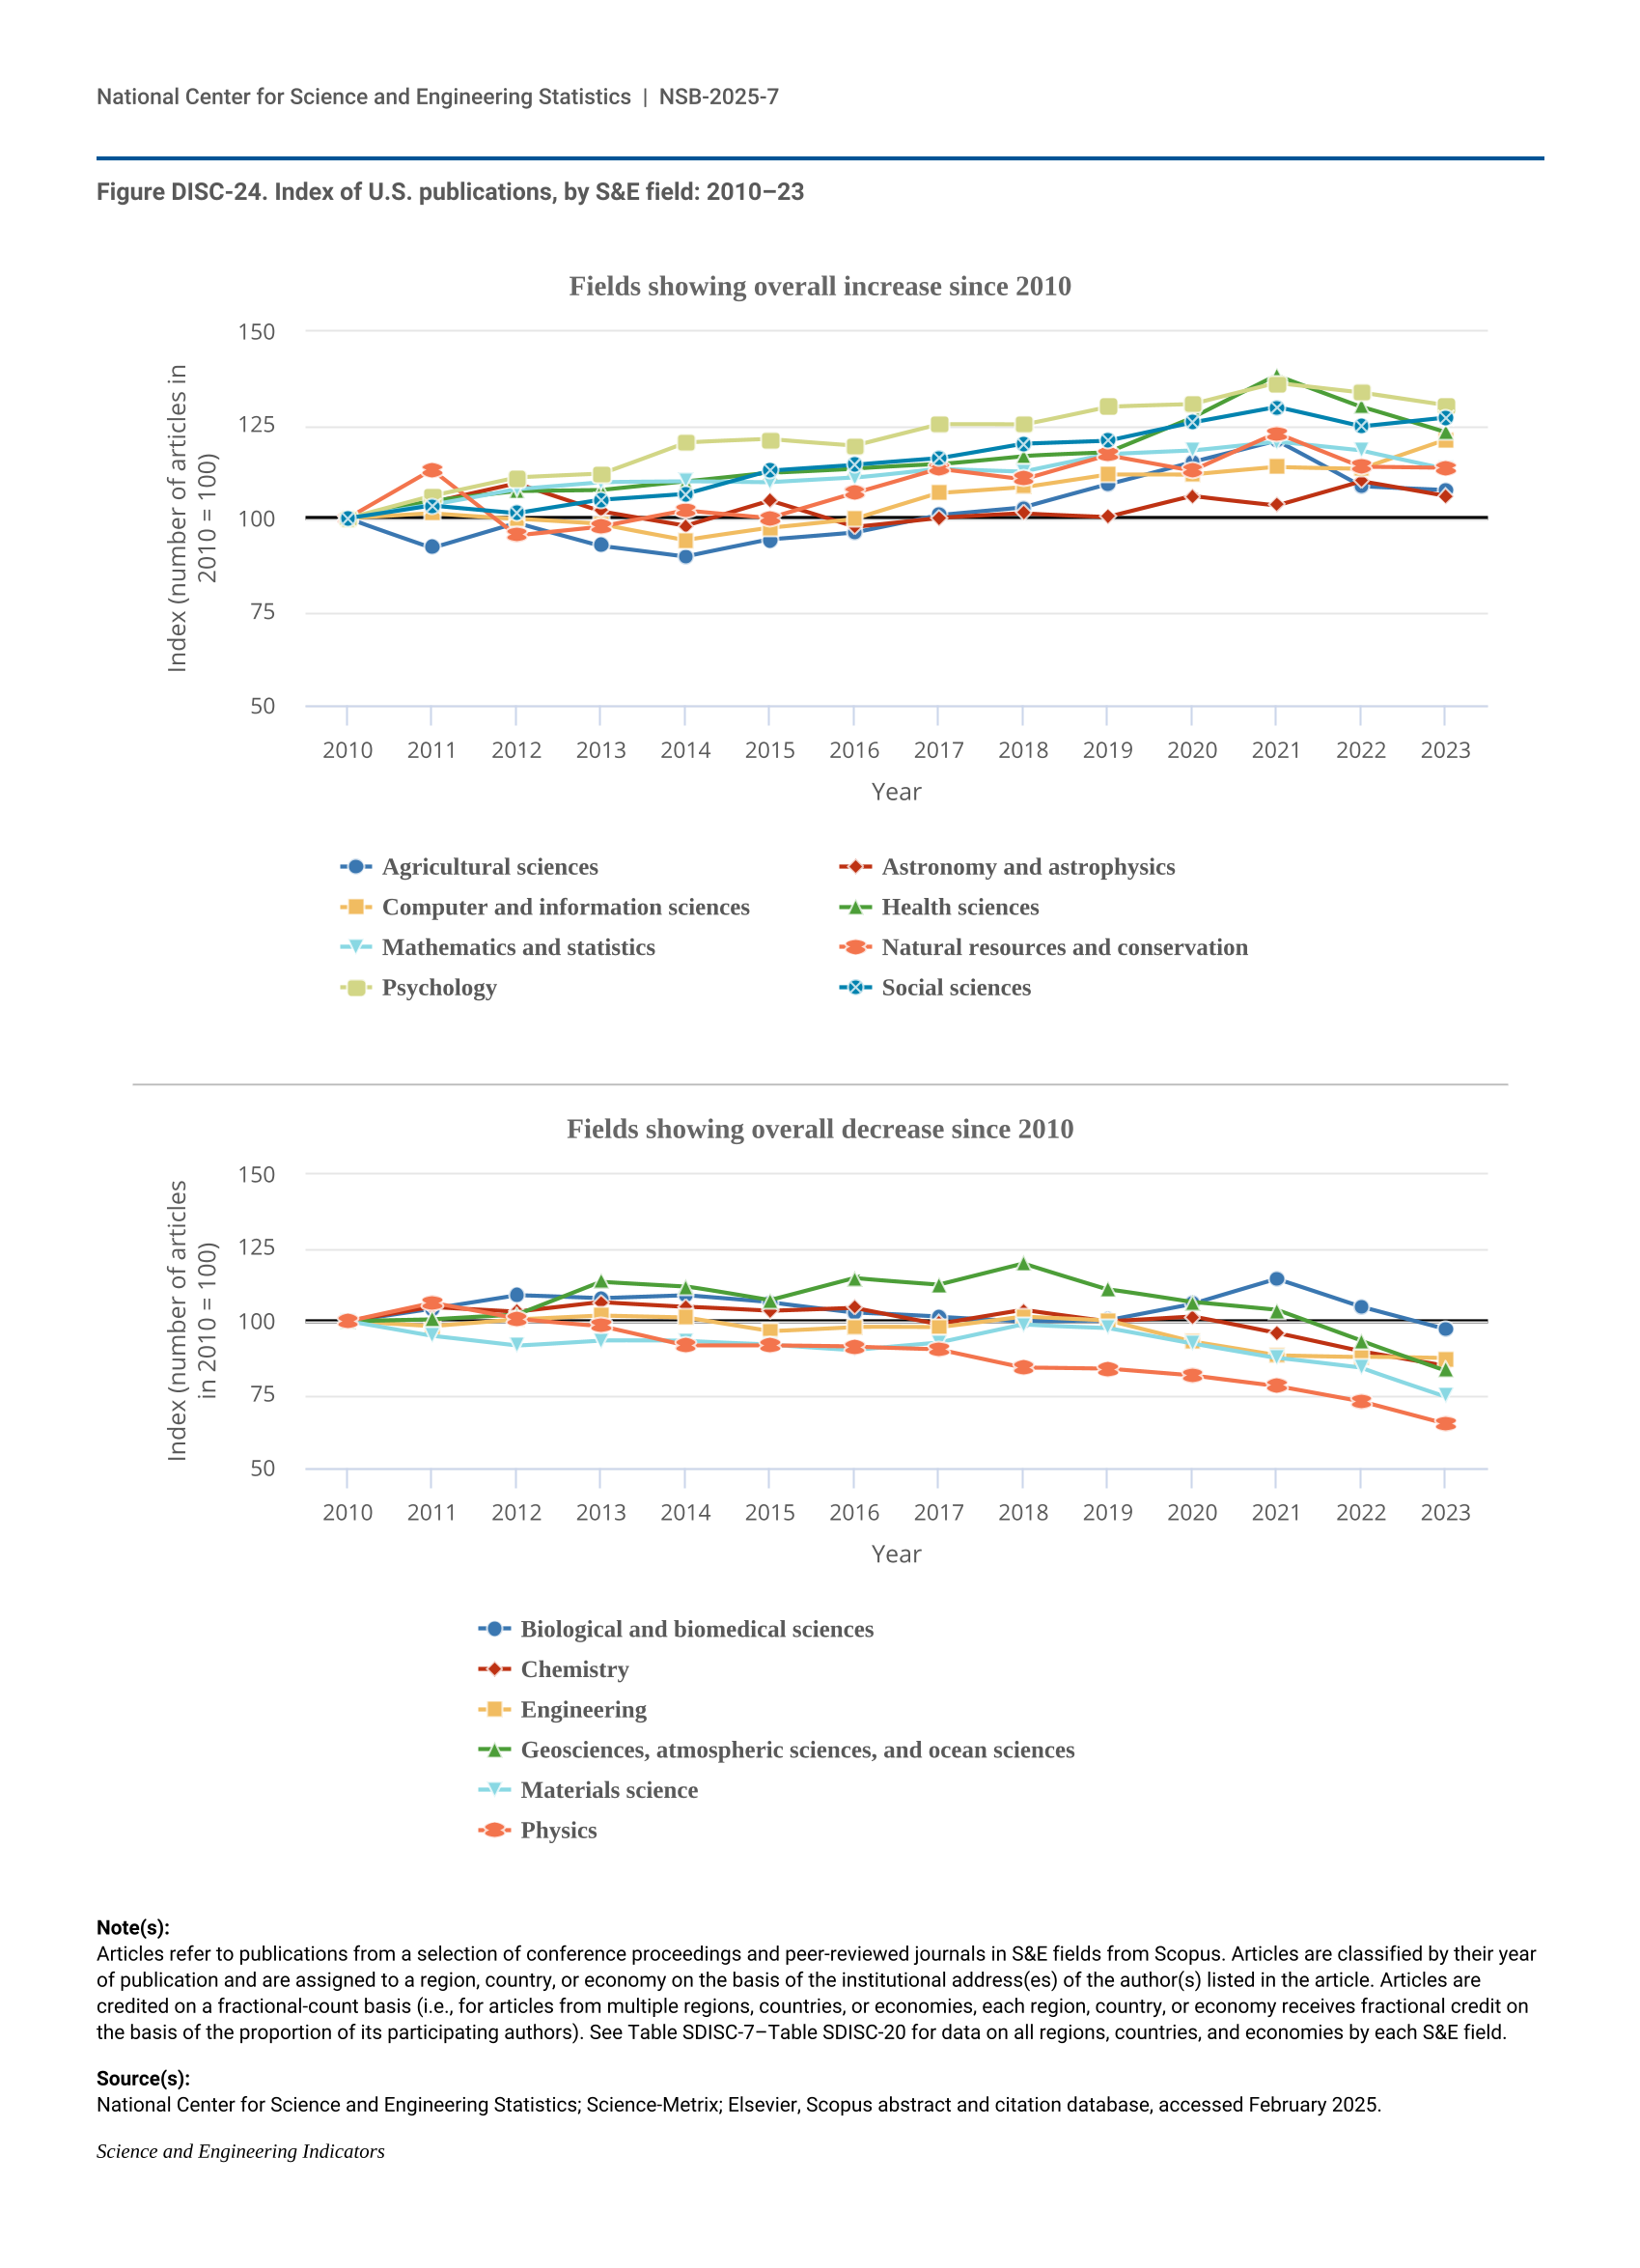
26 For the air and spacecraft and related machinery industry (ISIC 303), there is no 2021 or 2022 information in the OECD ANBERD database for China, the United Kingdom, and Taiwan. All top six industries highlighted here account for about three-fourths of U.S. and South Korea BERD expenditures based on OECD/ISIC data, close to two-thirds for Germany and Japan BERD expenditures, and 83% for Taiwan BERD expenditures. Other countries have missing data as noted earlier.
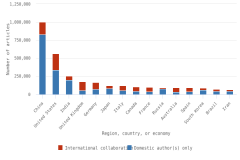
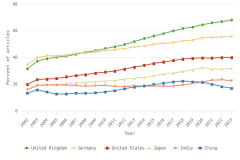
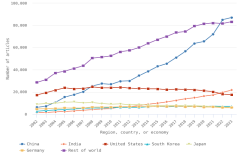
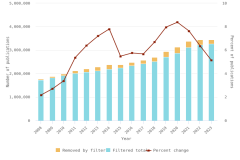
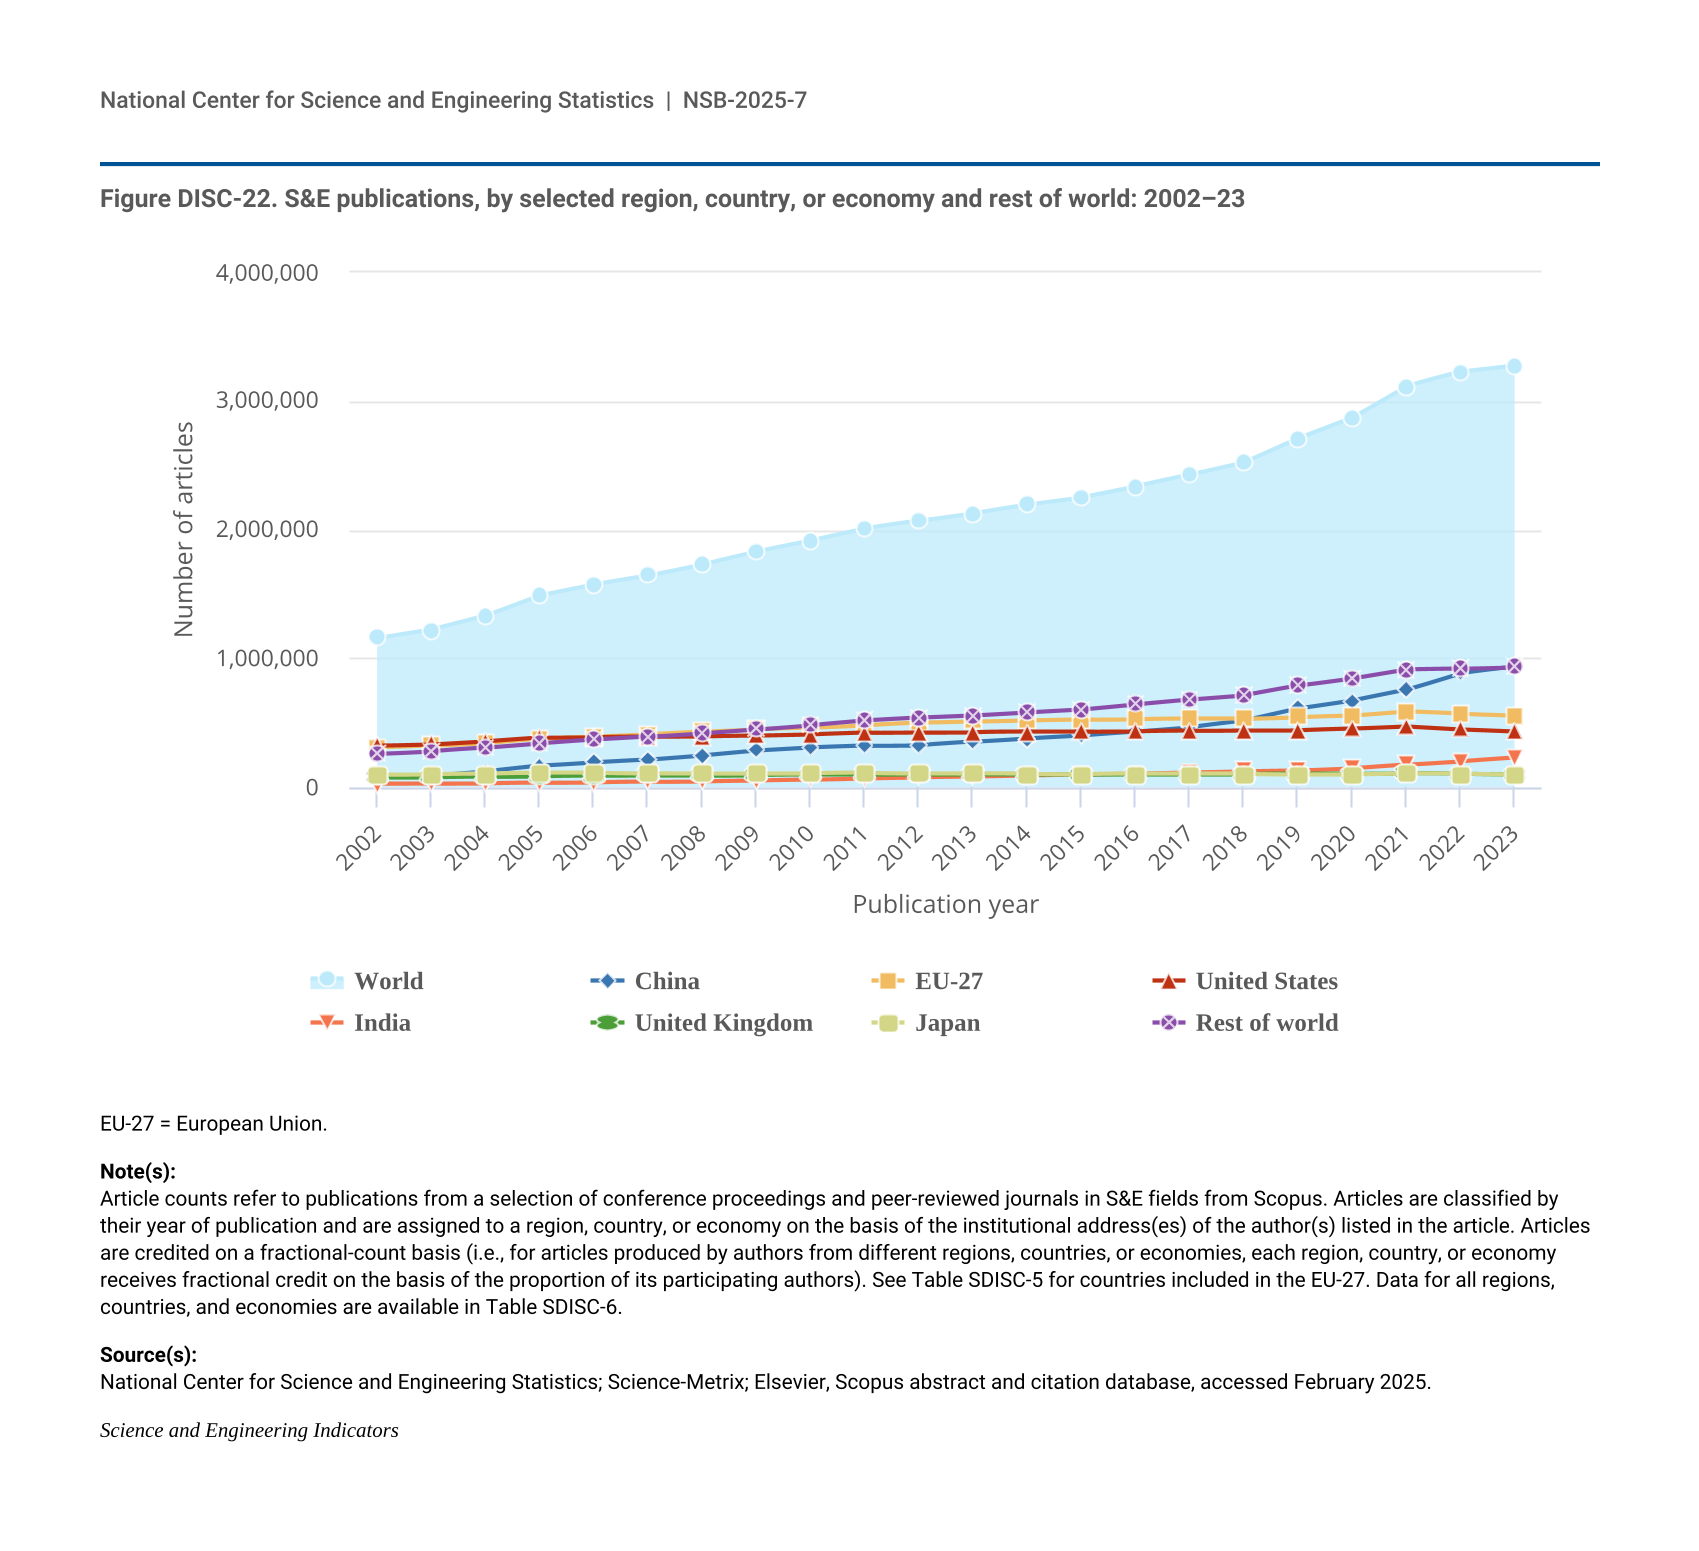
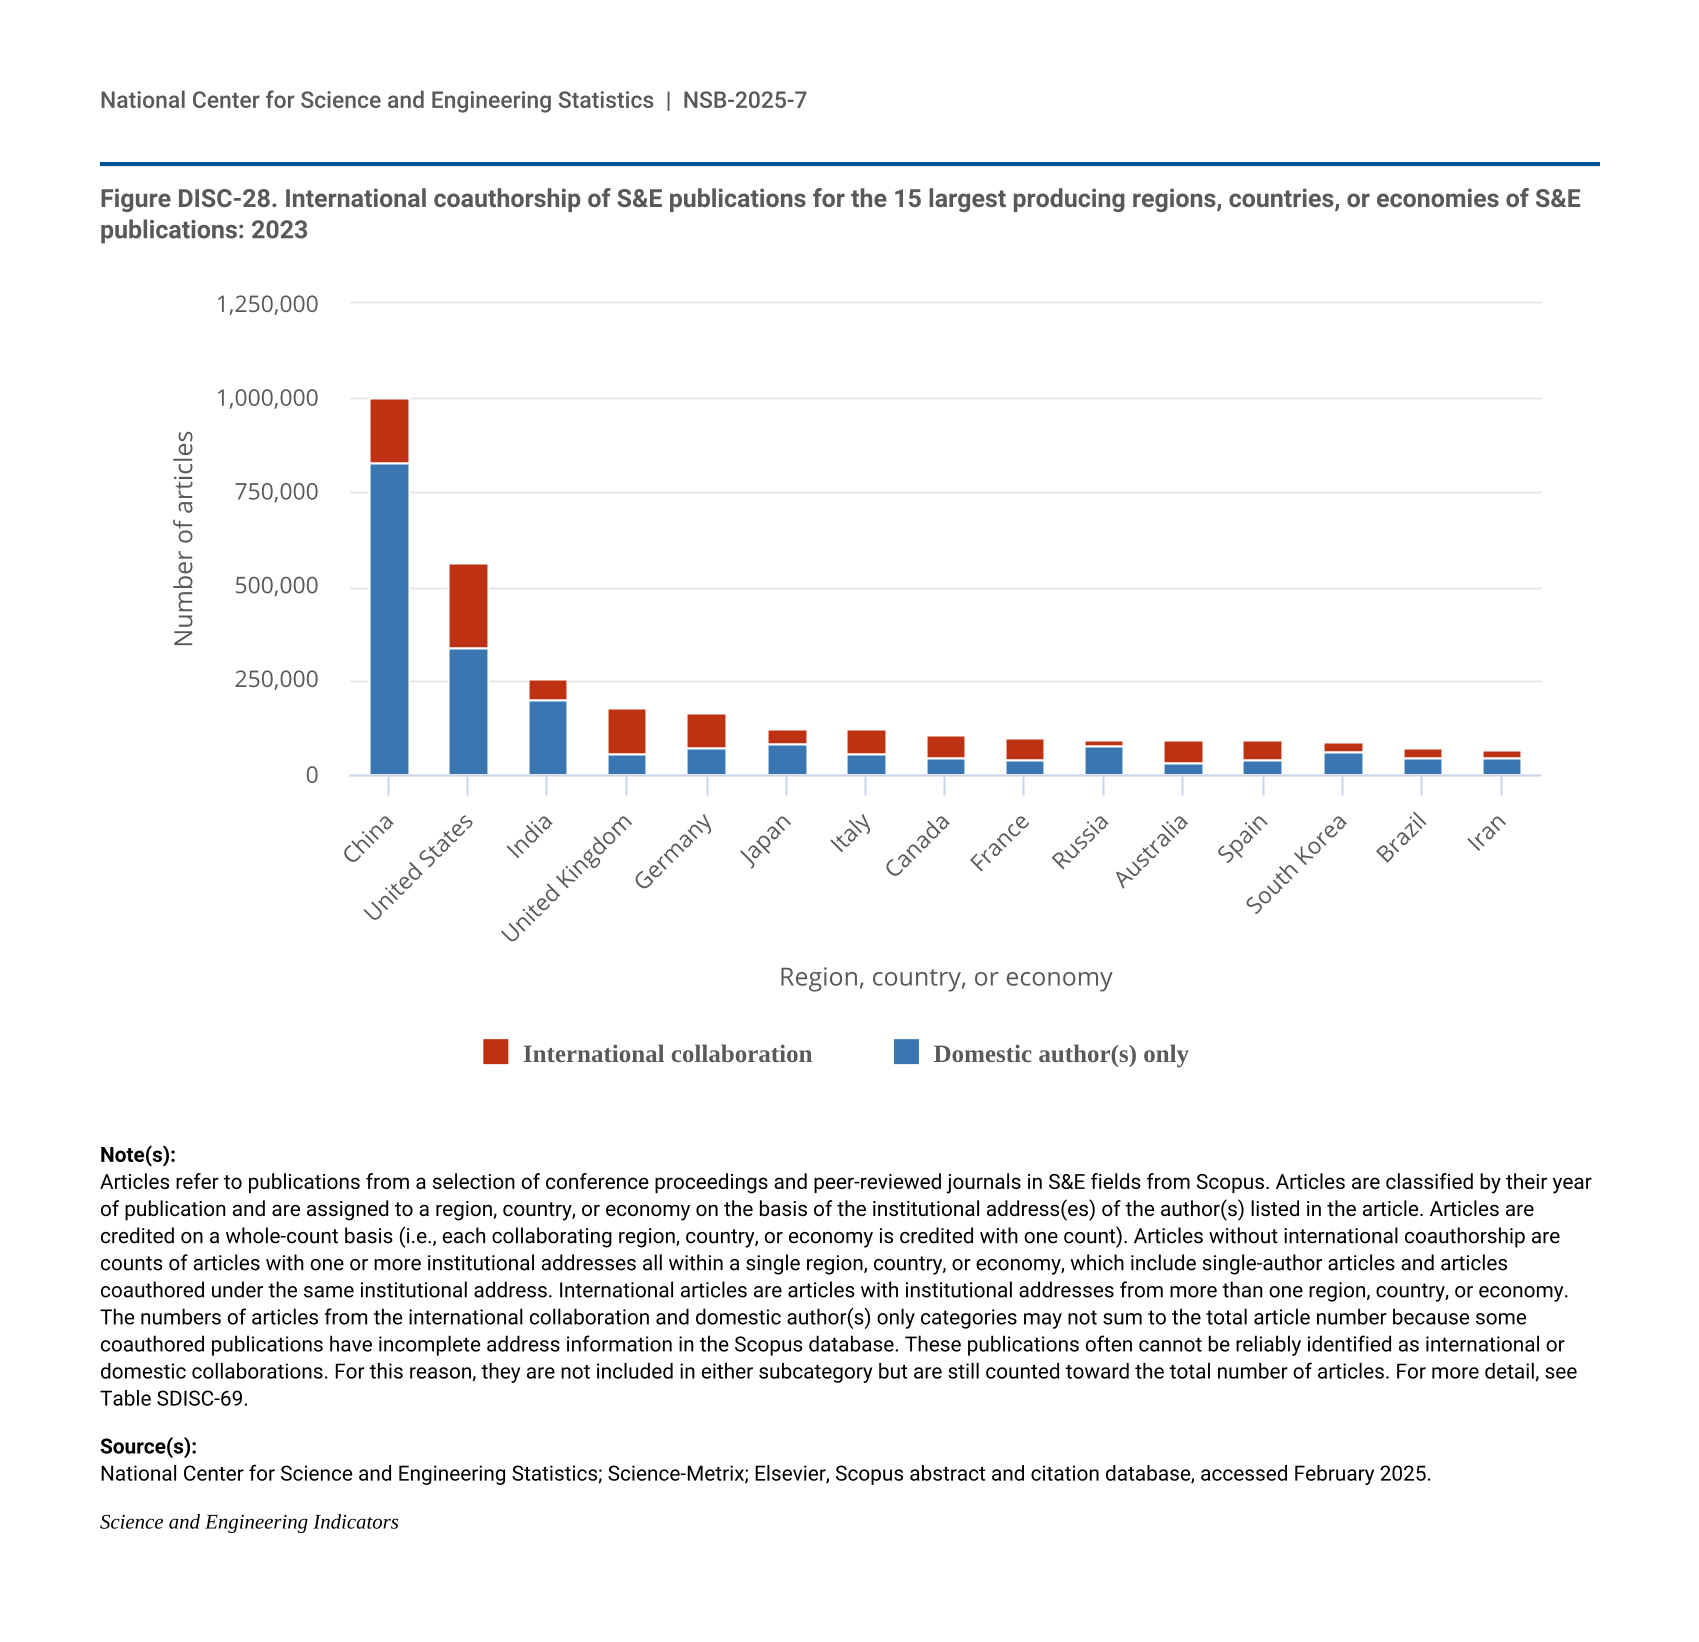
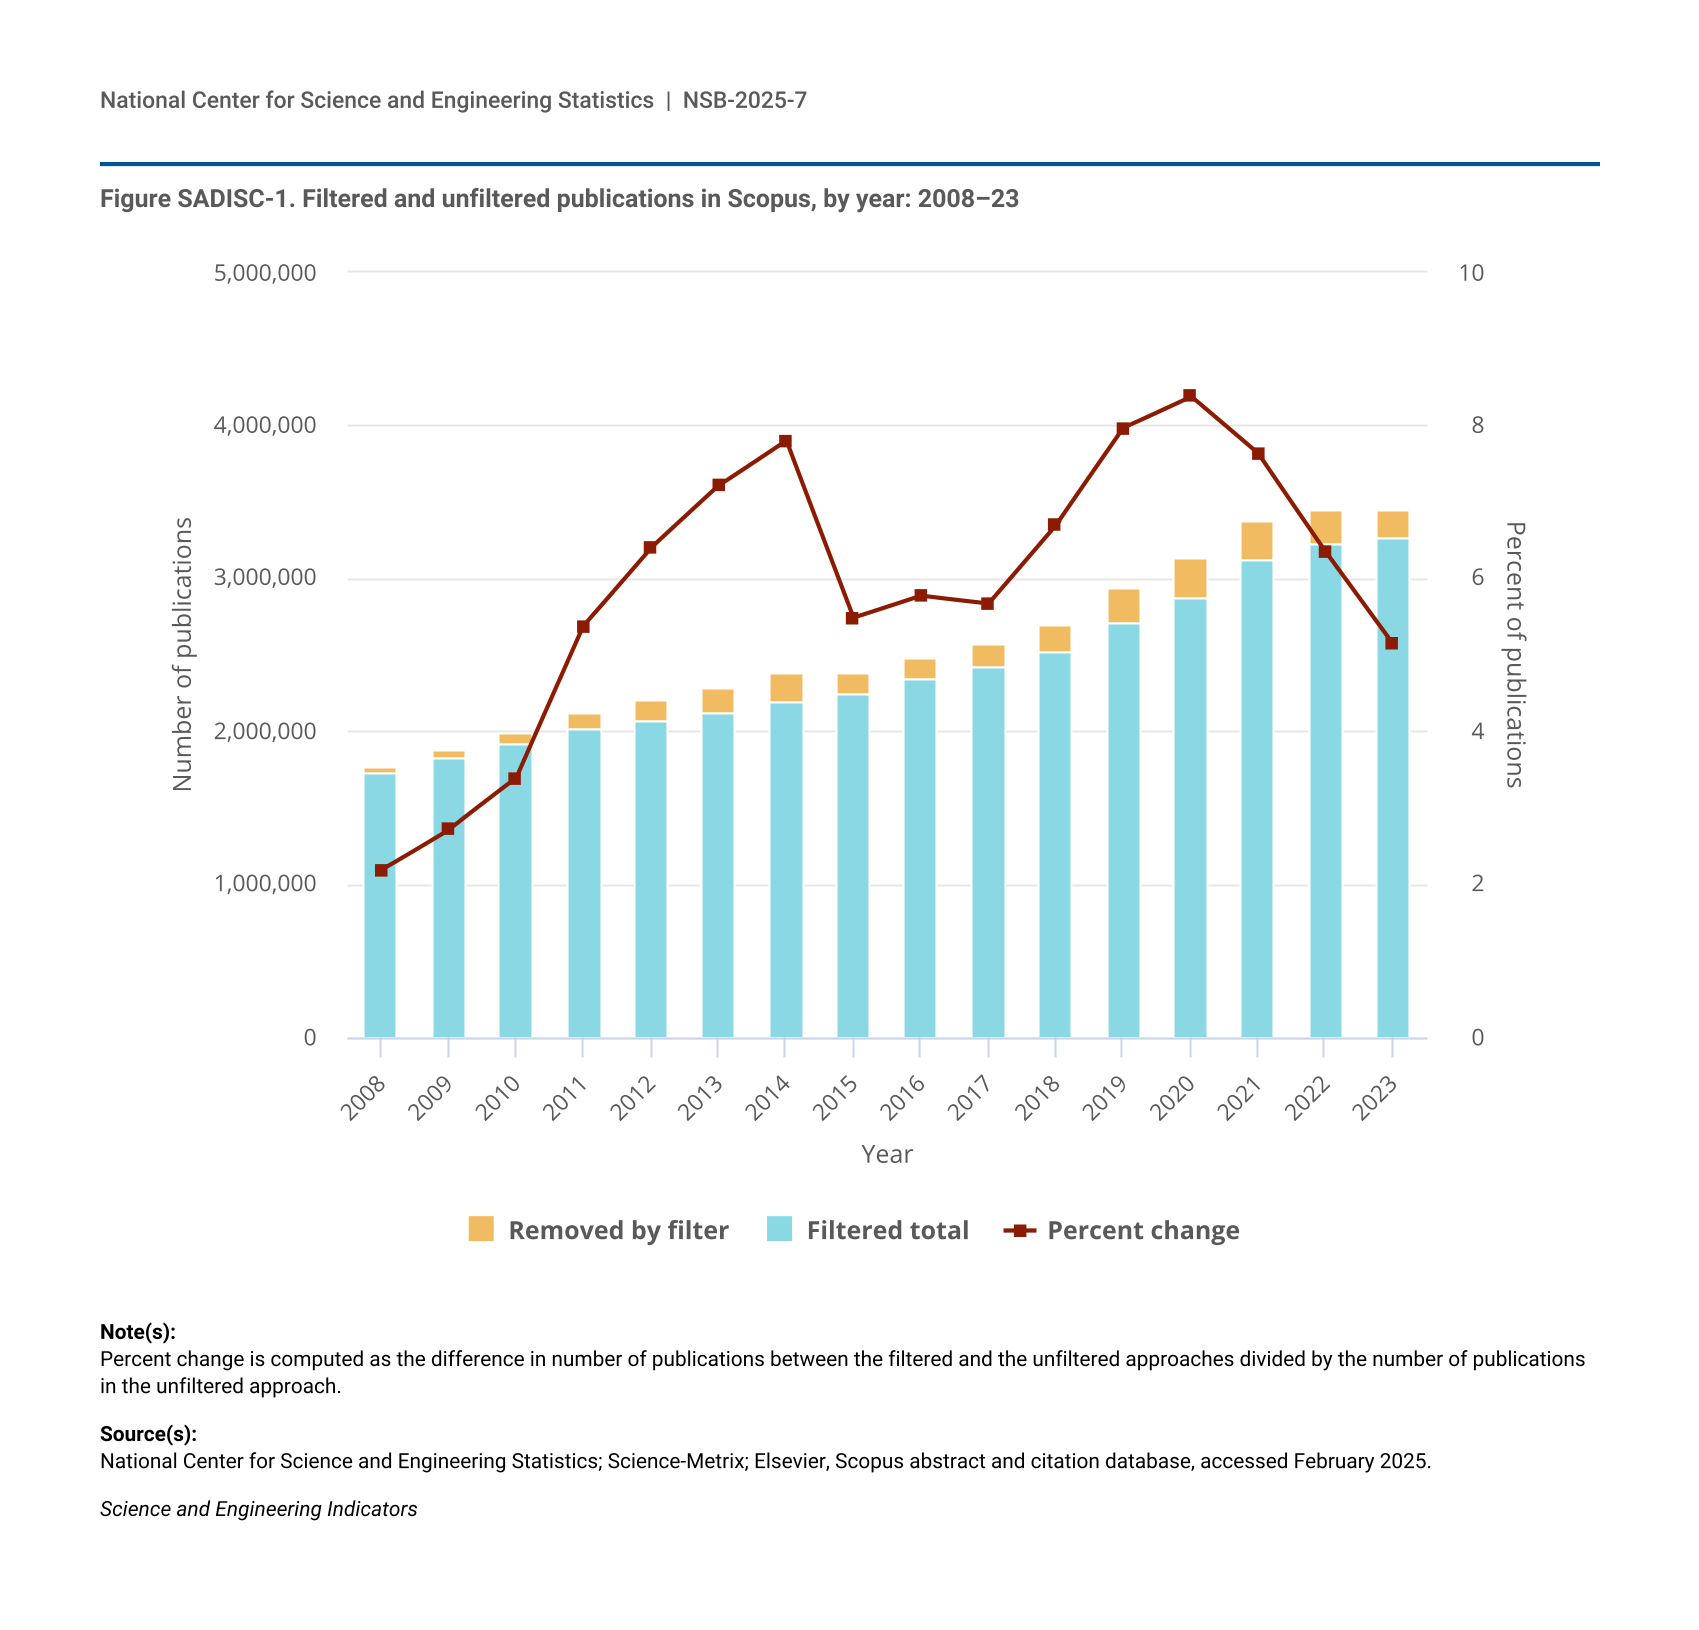
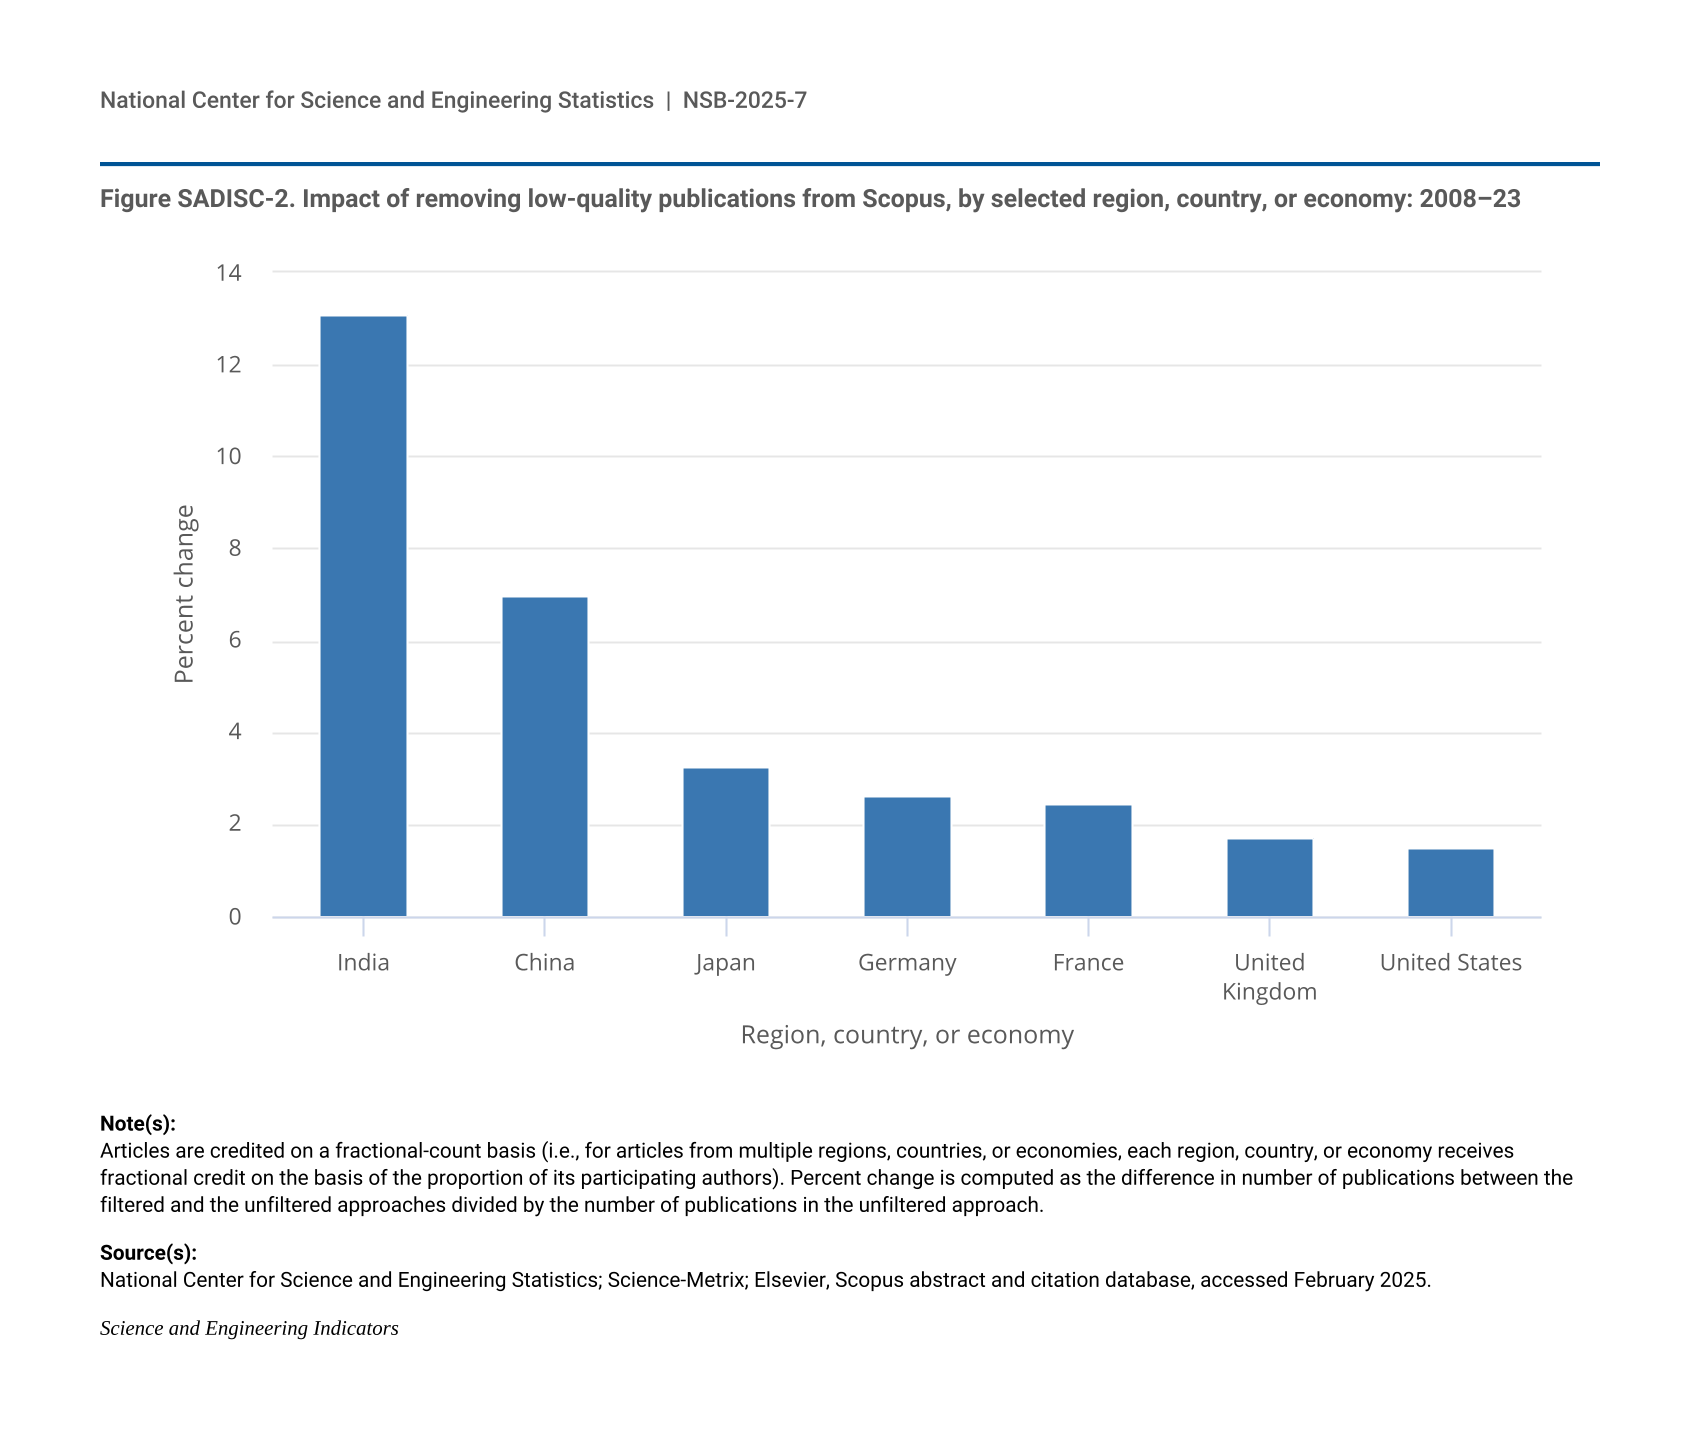
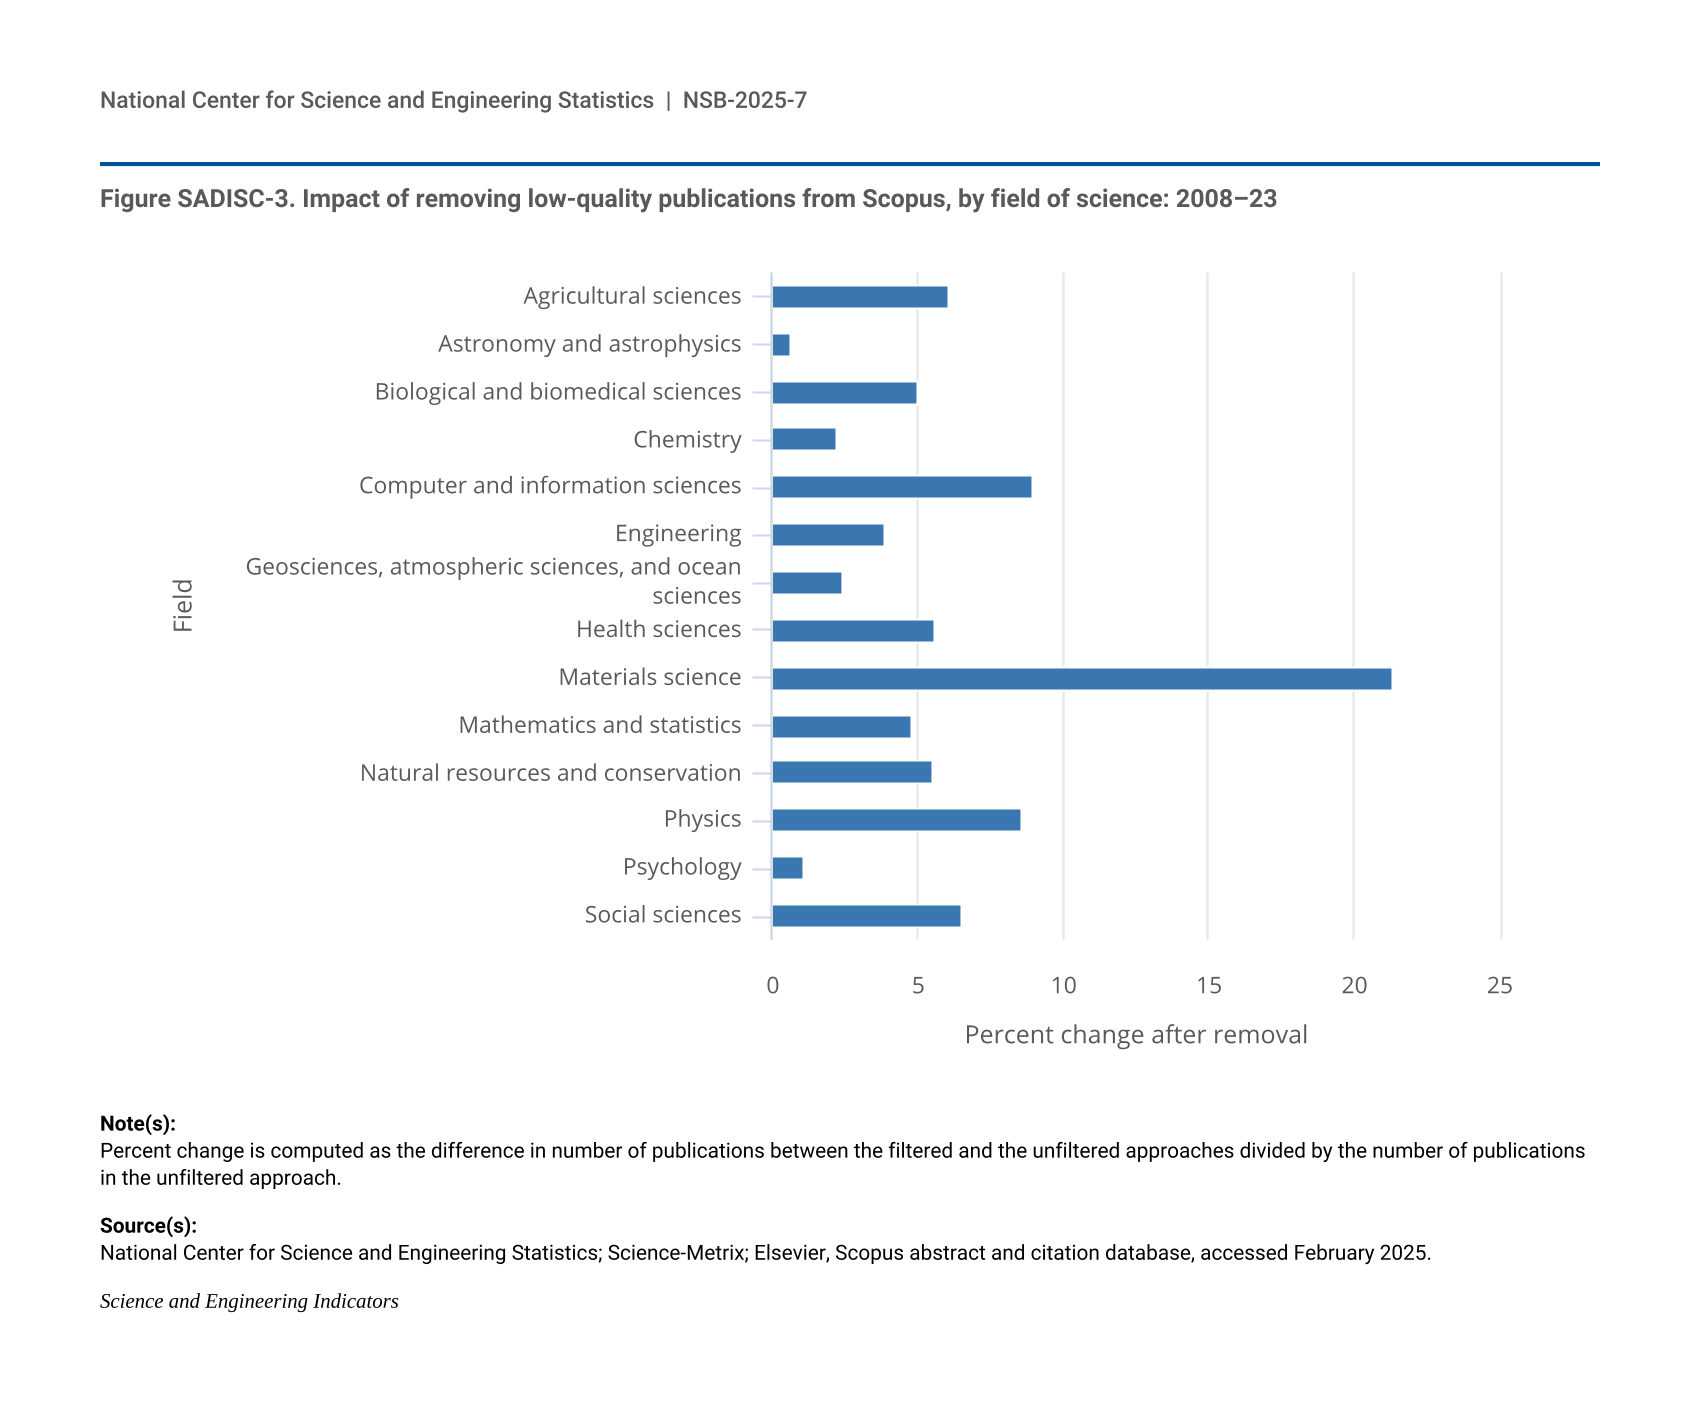
27 Publication output includes only those indexed in the Scopus database. The publication output discussion uses fractional counting, which credits coauthored publications according to the collaborating institutions or regions, countries, or economies based on the proportion of their participating authors. Country assignments refer to the institutional address of authors, with partial credit given for each international coauthorship. As part of the data analysis, filters were employed on the raw Scopus S&E publication data to remove publications with questionable quality, which appear in what are sometimes called predatory journals (NSB Indicators 2018: Bibliometric Data Filters).
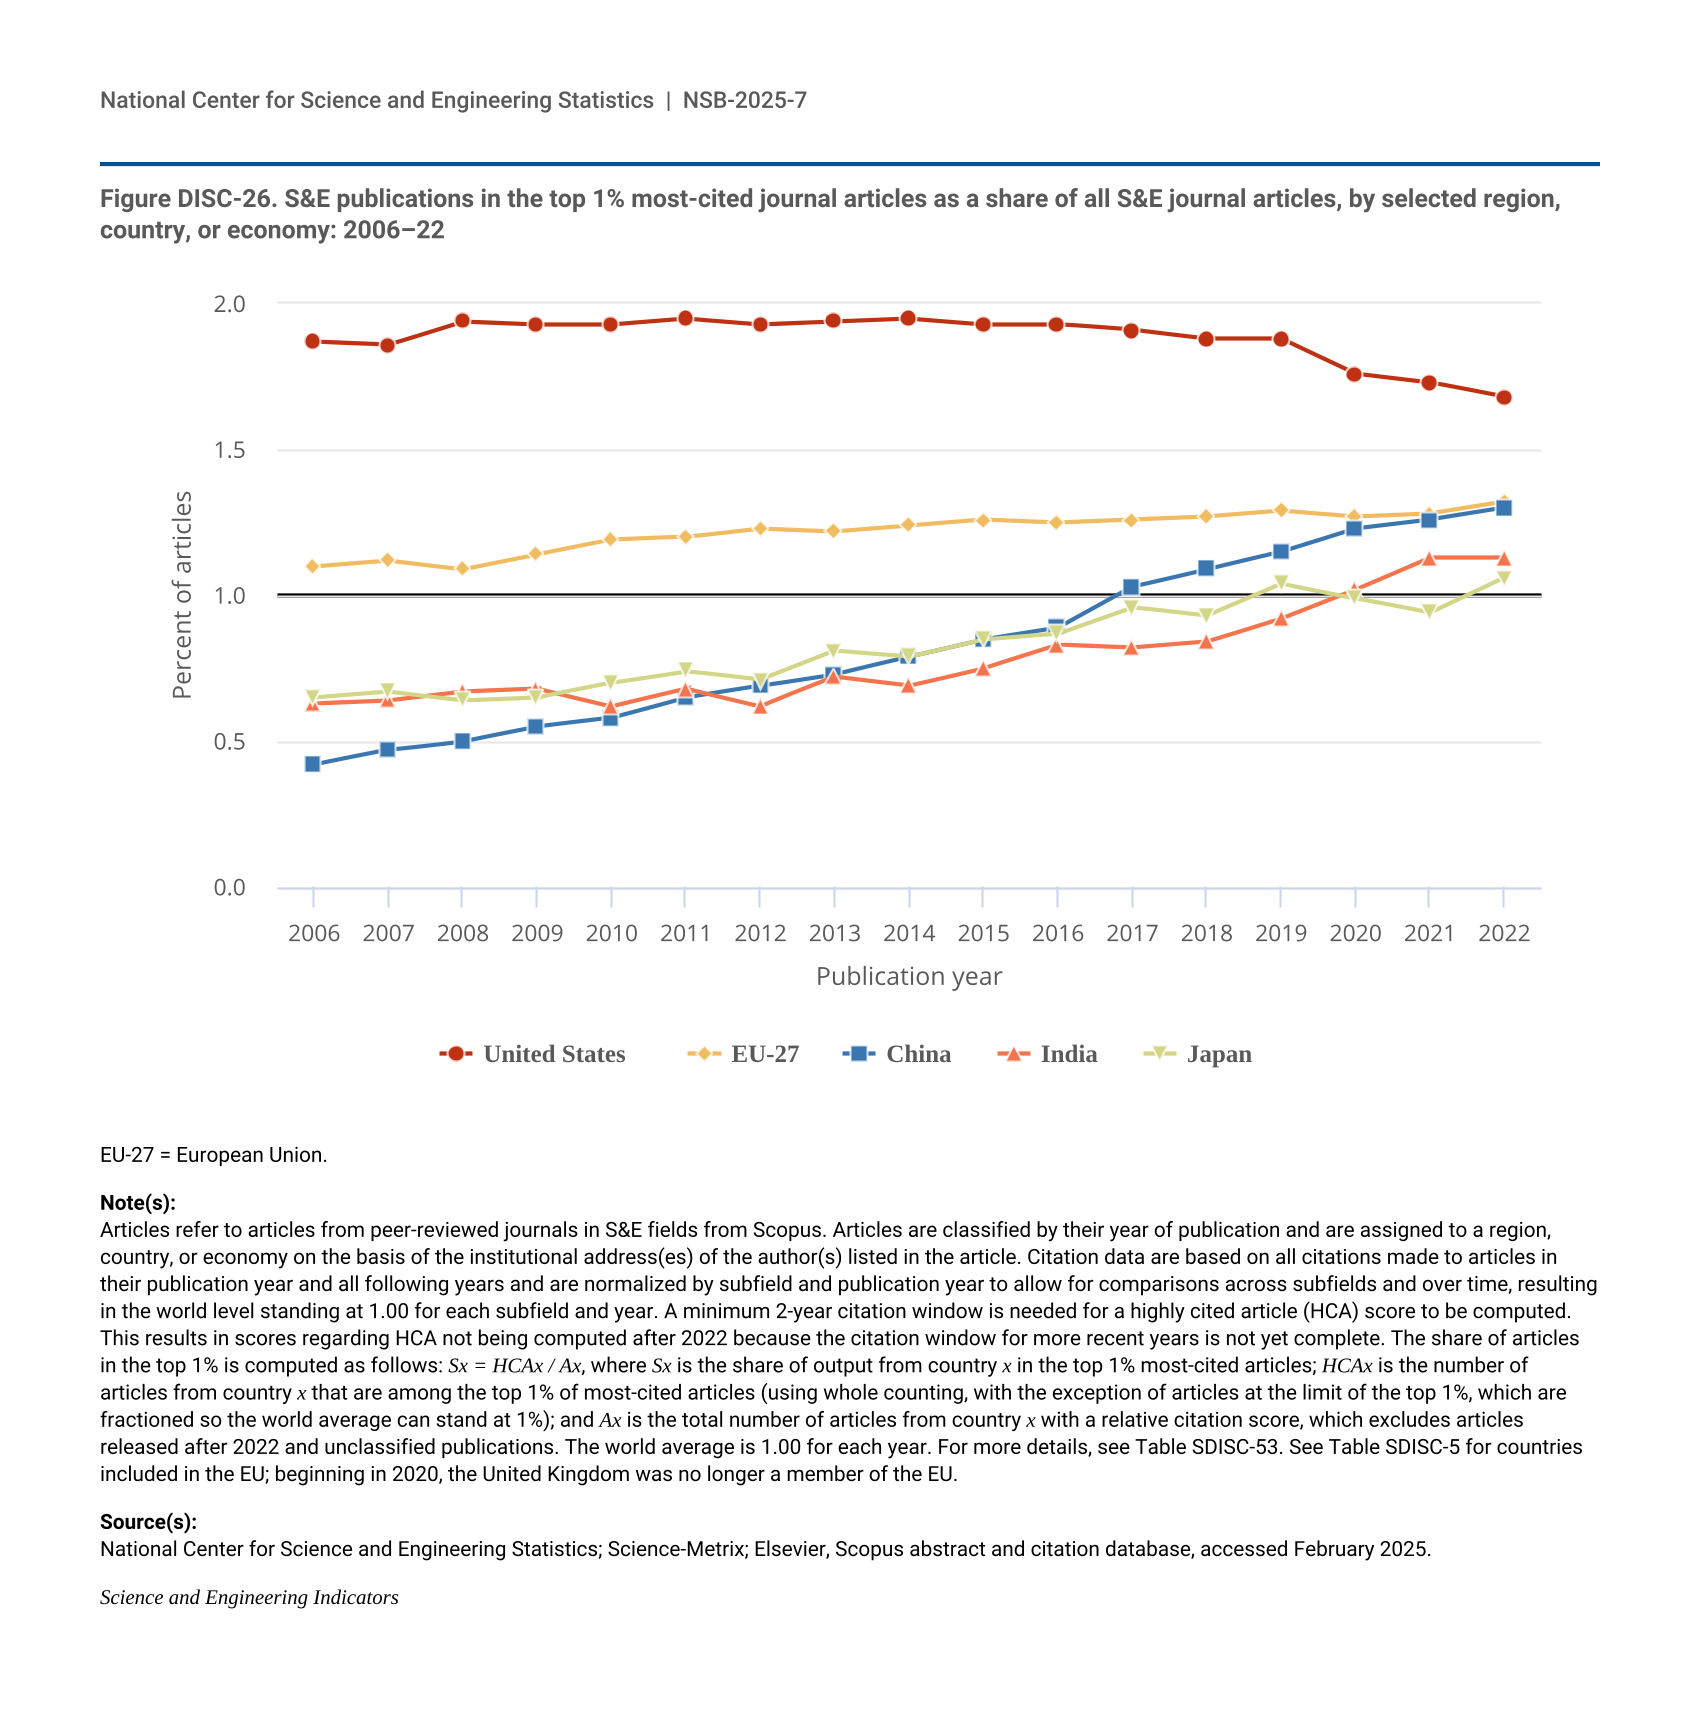
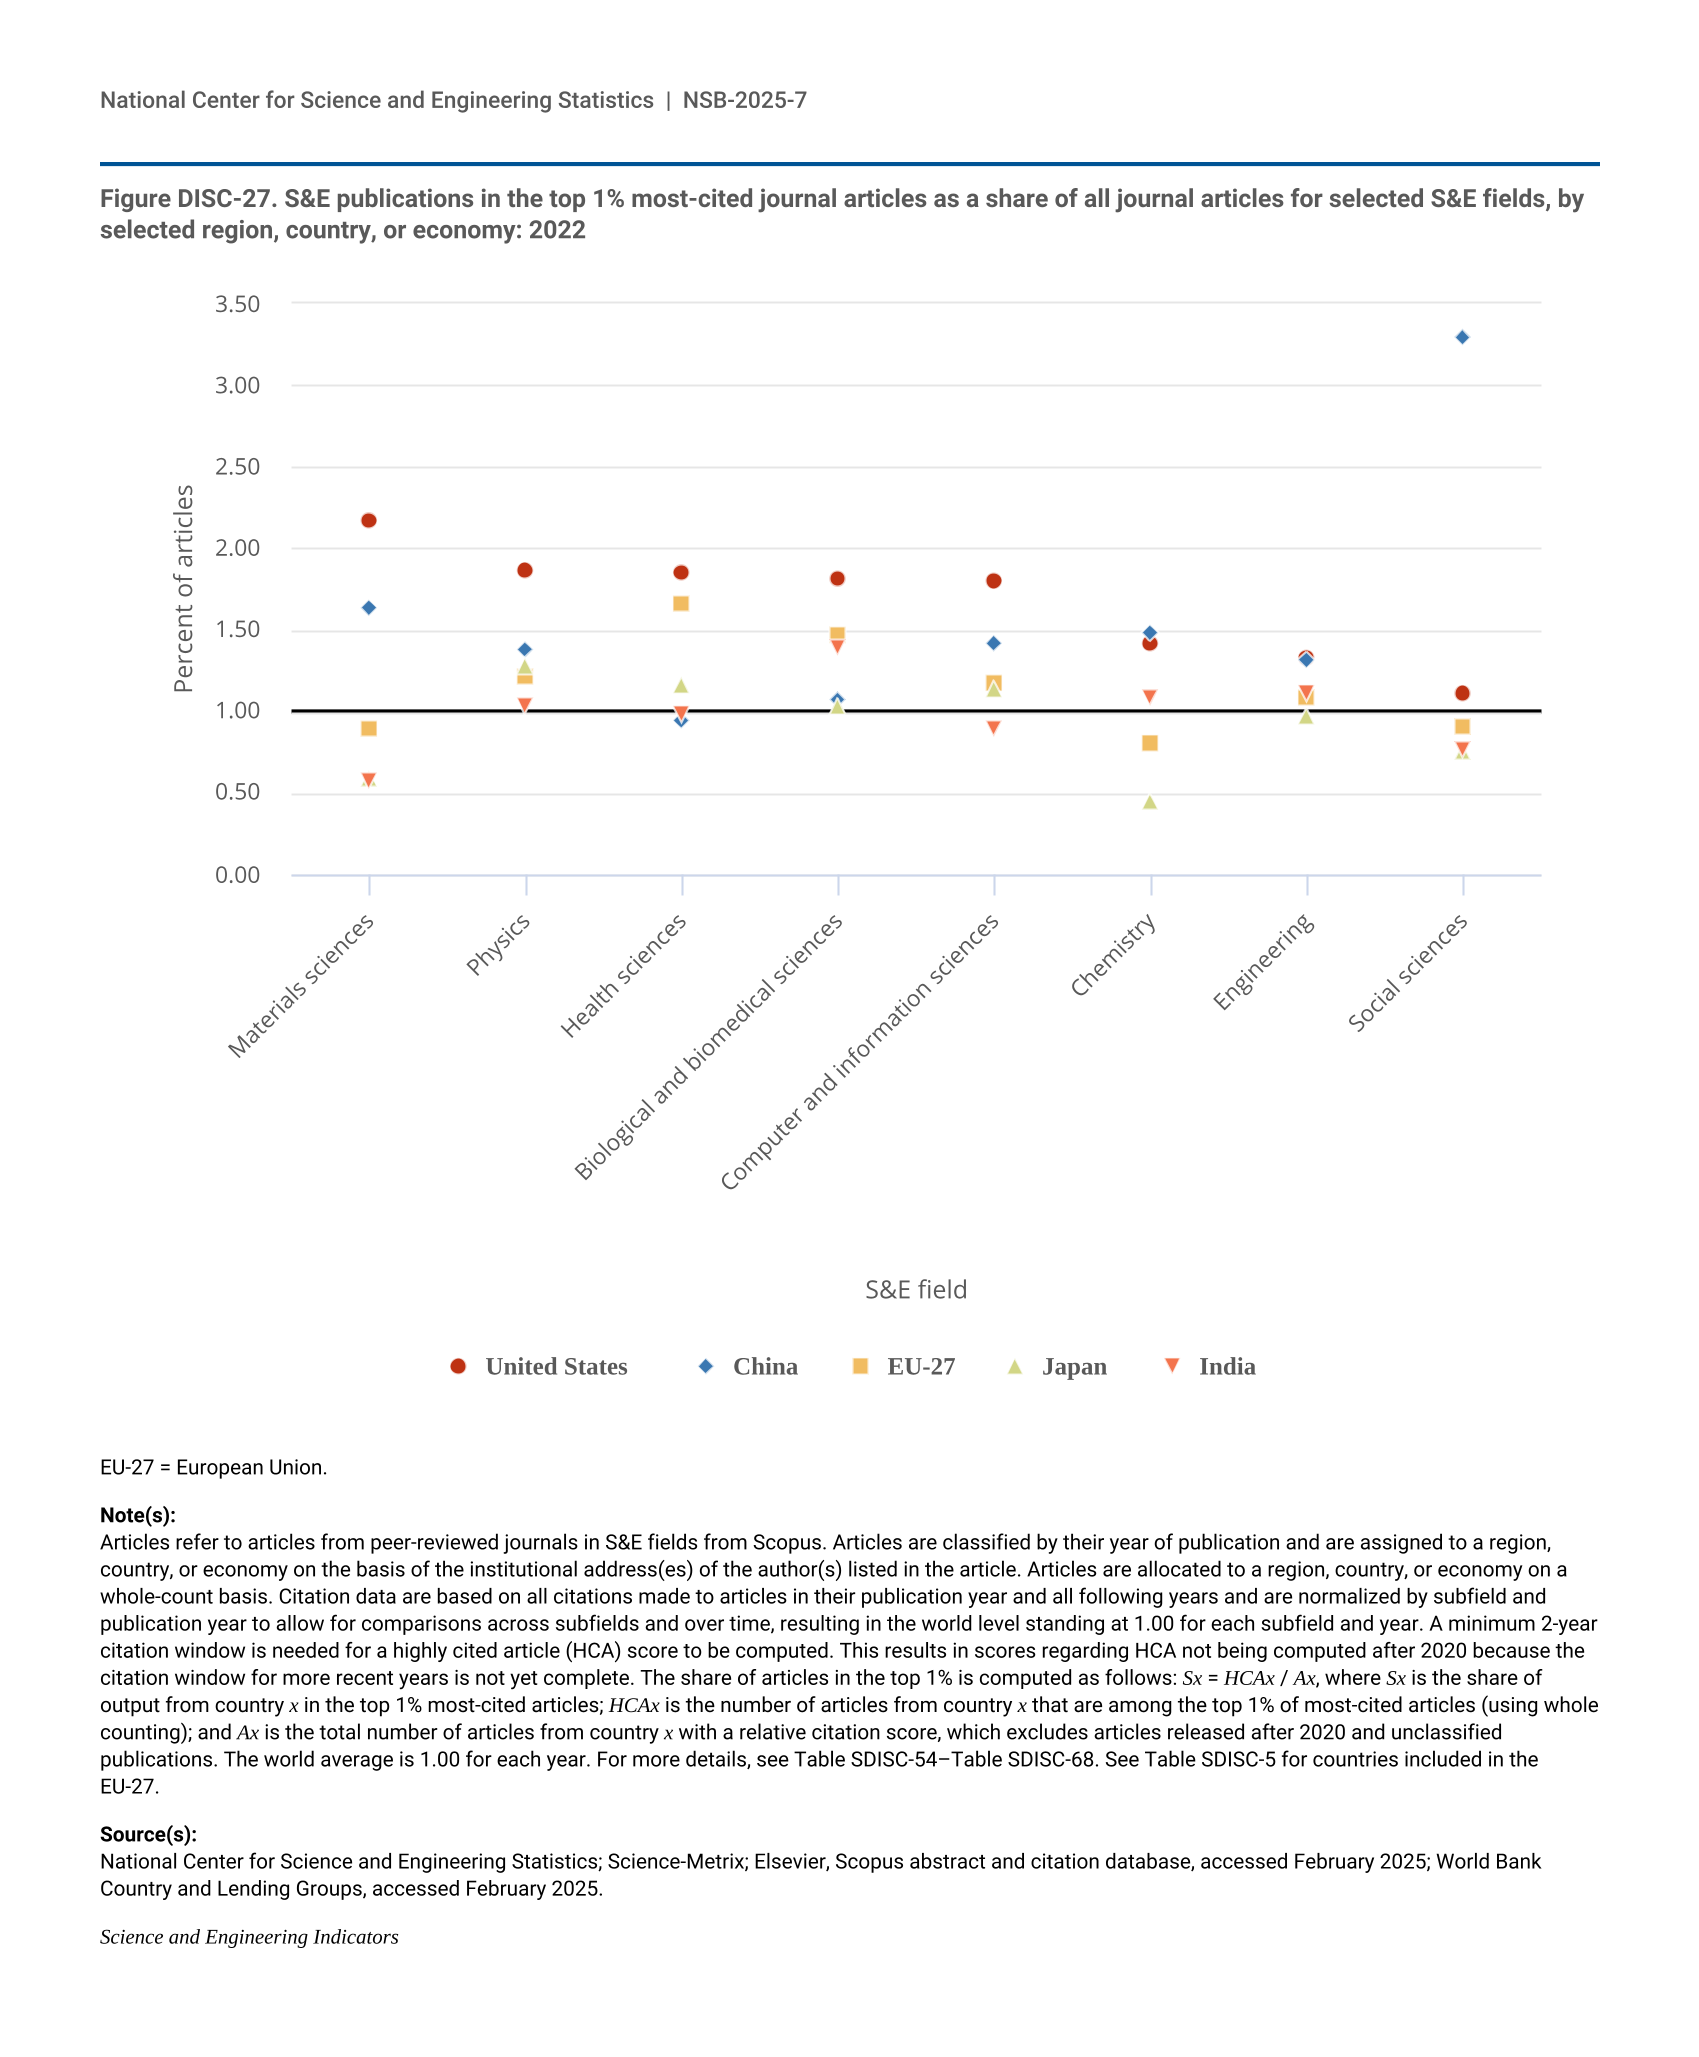
28 The proportion of output attributable to the large producers is consistent whether using fractional counting, as in Figure DISC-22 and Table DISC-12, or whole counting, as in Table SDISC-21. There is a slight difference between the United States and China when looking at the whole-counting total production numbers. Using whole counting for 2023, the United States had 568,973 articles, whereas China had 1,003,473. A whole-counting measure allocates one full count to each region, country, or economy with an author contributing to the article; in fractional counting, each region, country, or economy receives a proportion of the count based on the number of authors from that region, country, or economy. For example, if an article had four authors—two from the United States, one from China, and one from Brazil—the fractional scores would be half for the United States, a quarter for China, and a quarter for Brazil. The use of whole counting or fractional counting to tally the publication output of countries can change the calculated publication count based on the degree to which a country is involved in international collaborations.
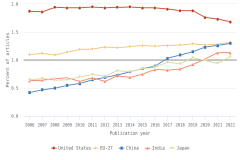
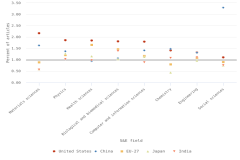
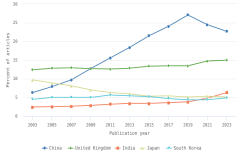
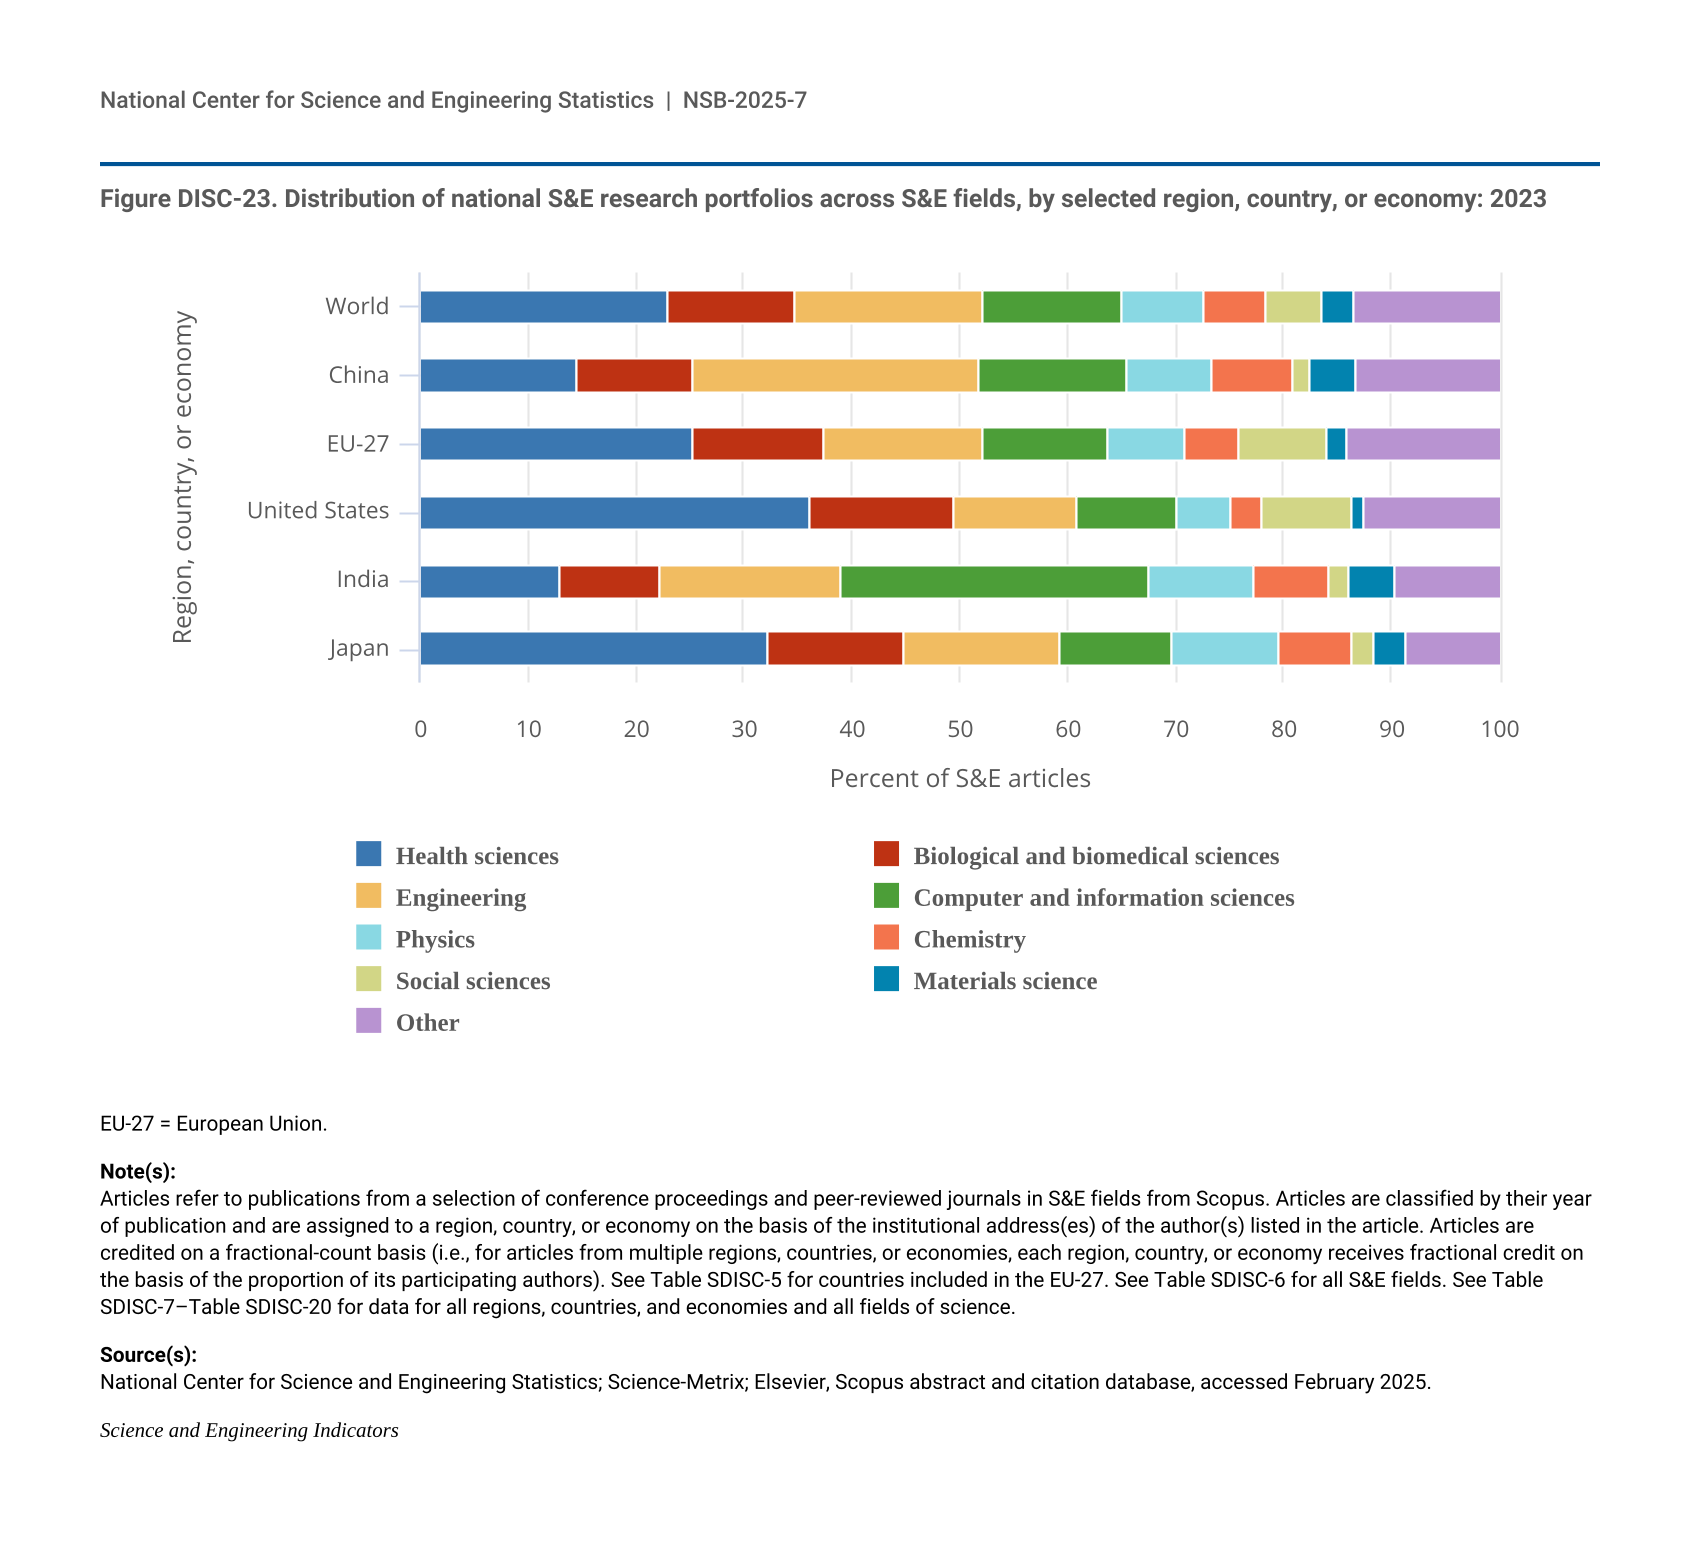
29 In mathematical terms, a region, country, or economy’s HCA ratio (the share of the articles ranked in the highest 1% based on citations) is computed as follows: Sx = HCAx / Ax, where Sx is the share of output from country x in the top 1% most-cited articles, HCAx is the number of articles from country x that are among the top 1% of most-cited articles, and Ax is the total number of articles from country x with a relative citation (RC) score. HCAx and Ax are based on whole counting. The RC score is a normalized citation score assigned to a publication and is used to rank articles into the top 1%. The RC score takes into consideration the citation behavior between fields and years of publication. Based on the observation that distinct differences in the citation rates of articles appear 2 years or more after publication, the HCA ratio is calculated with a time lag of at least 2 years (meaning that in 2024, the HCA ratios were calculated based on publications issued in 2022).
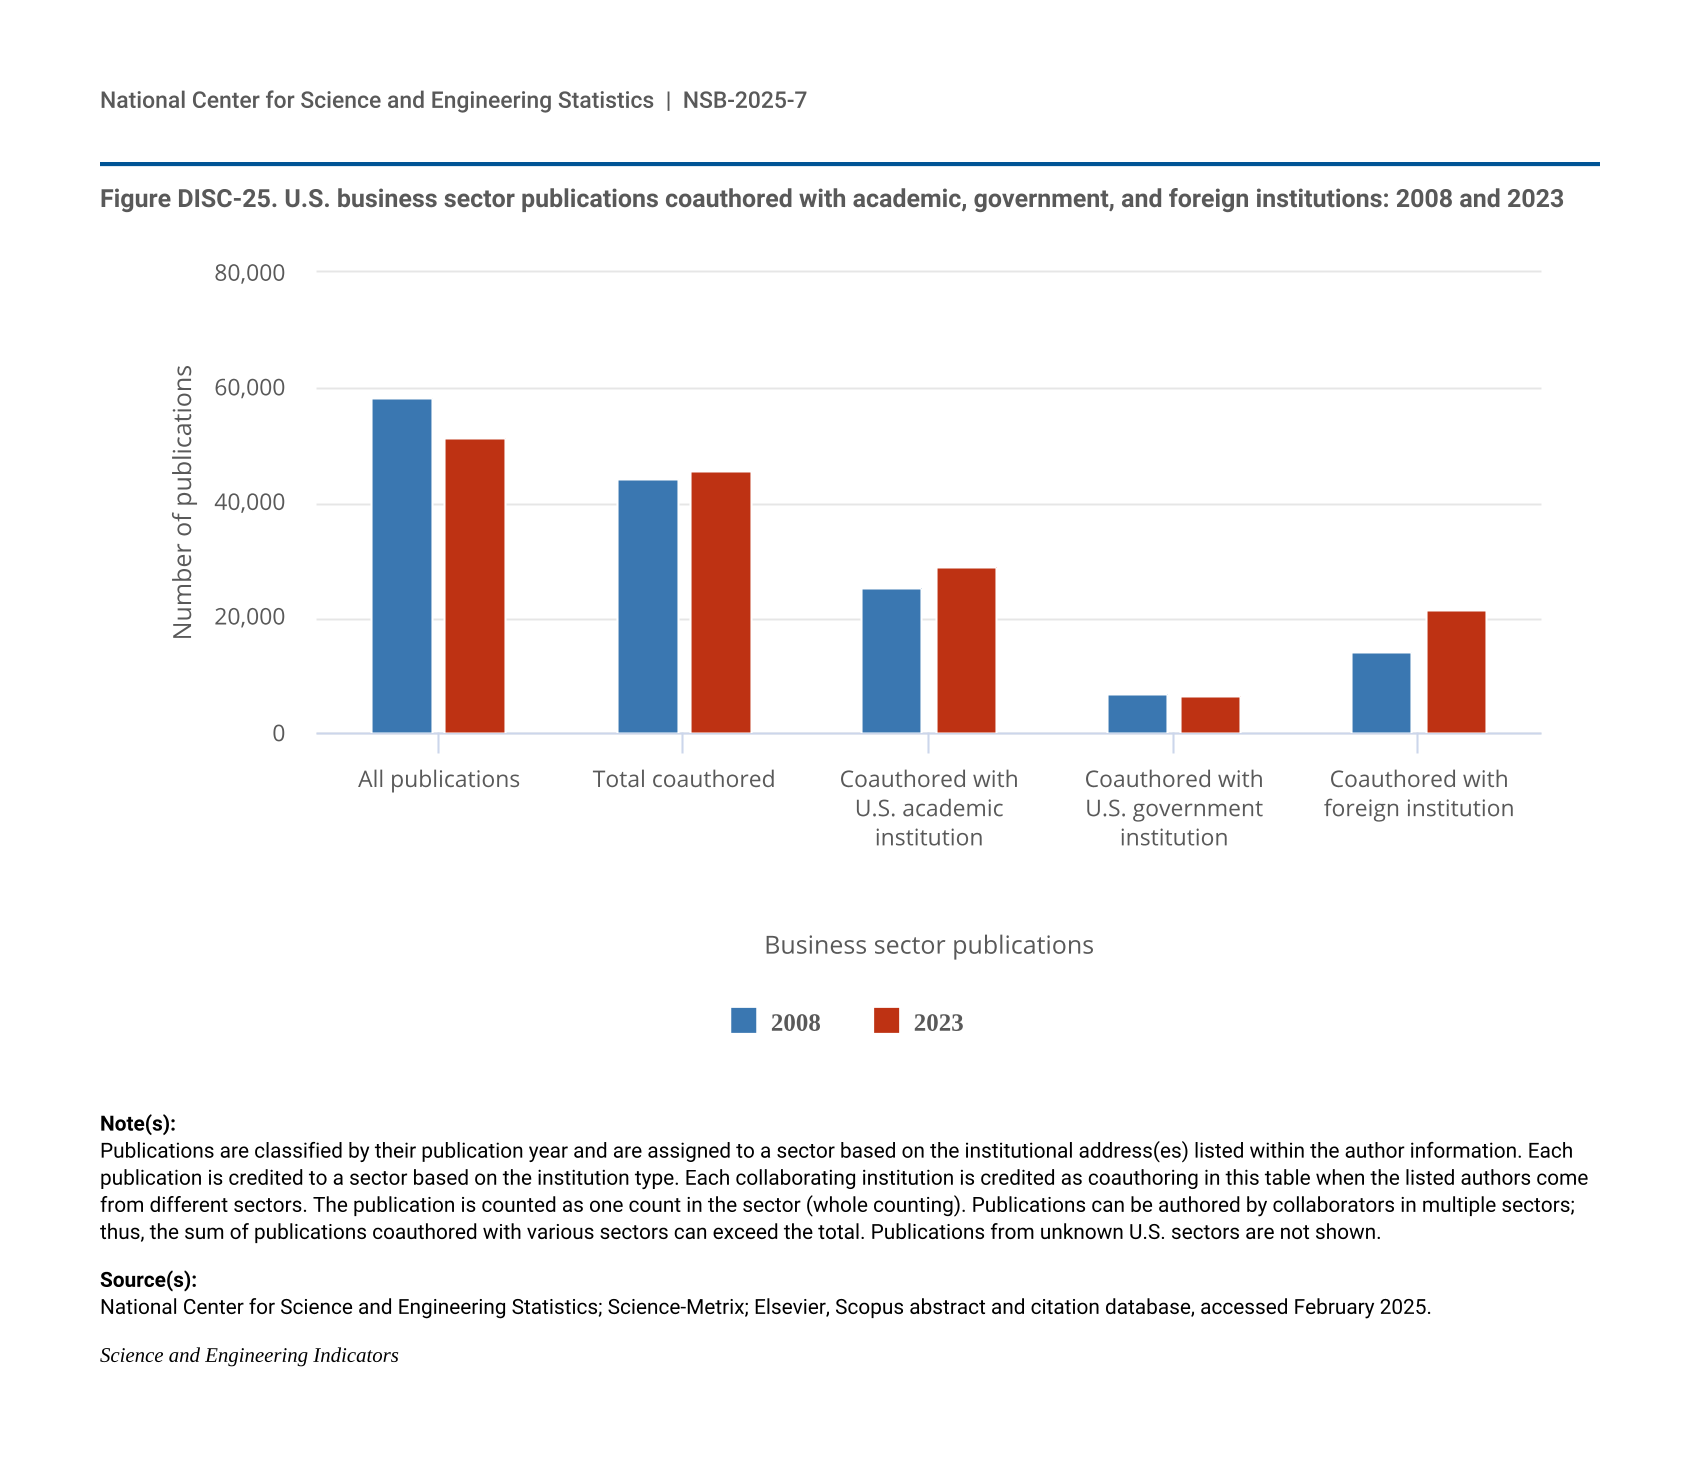
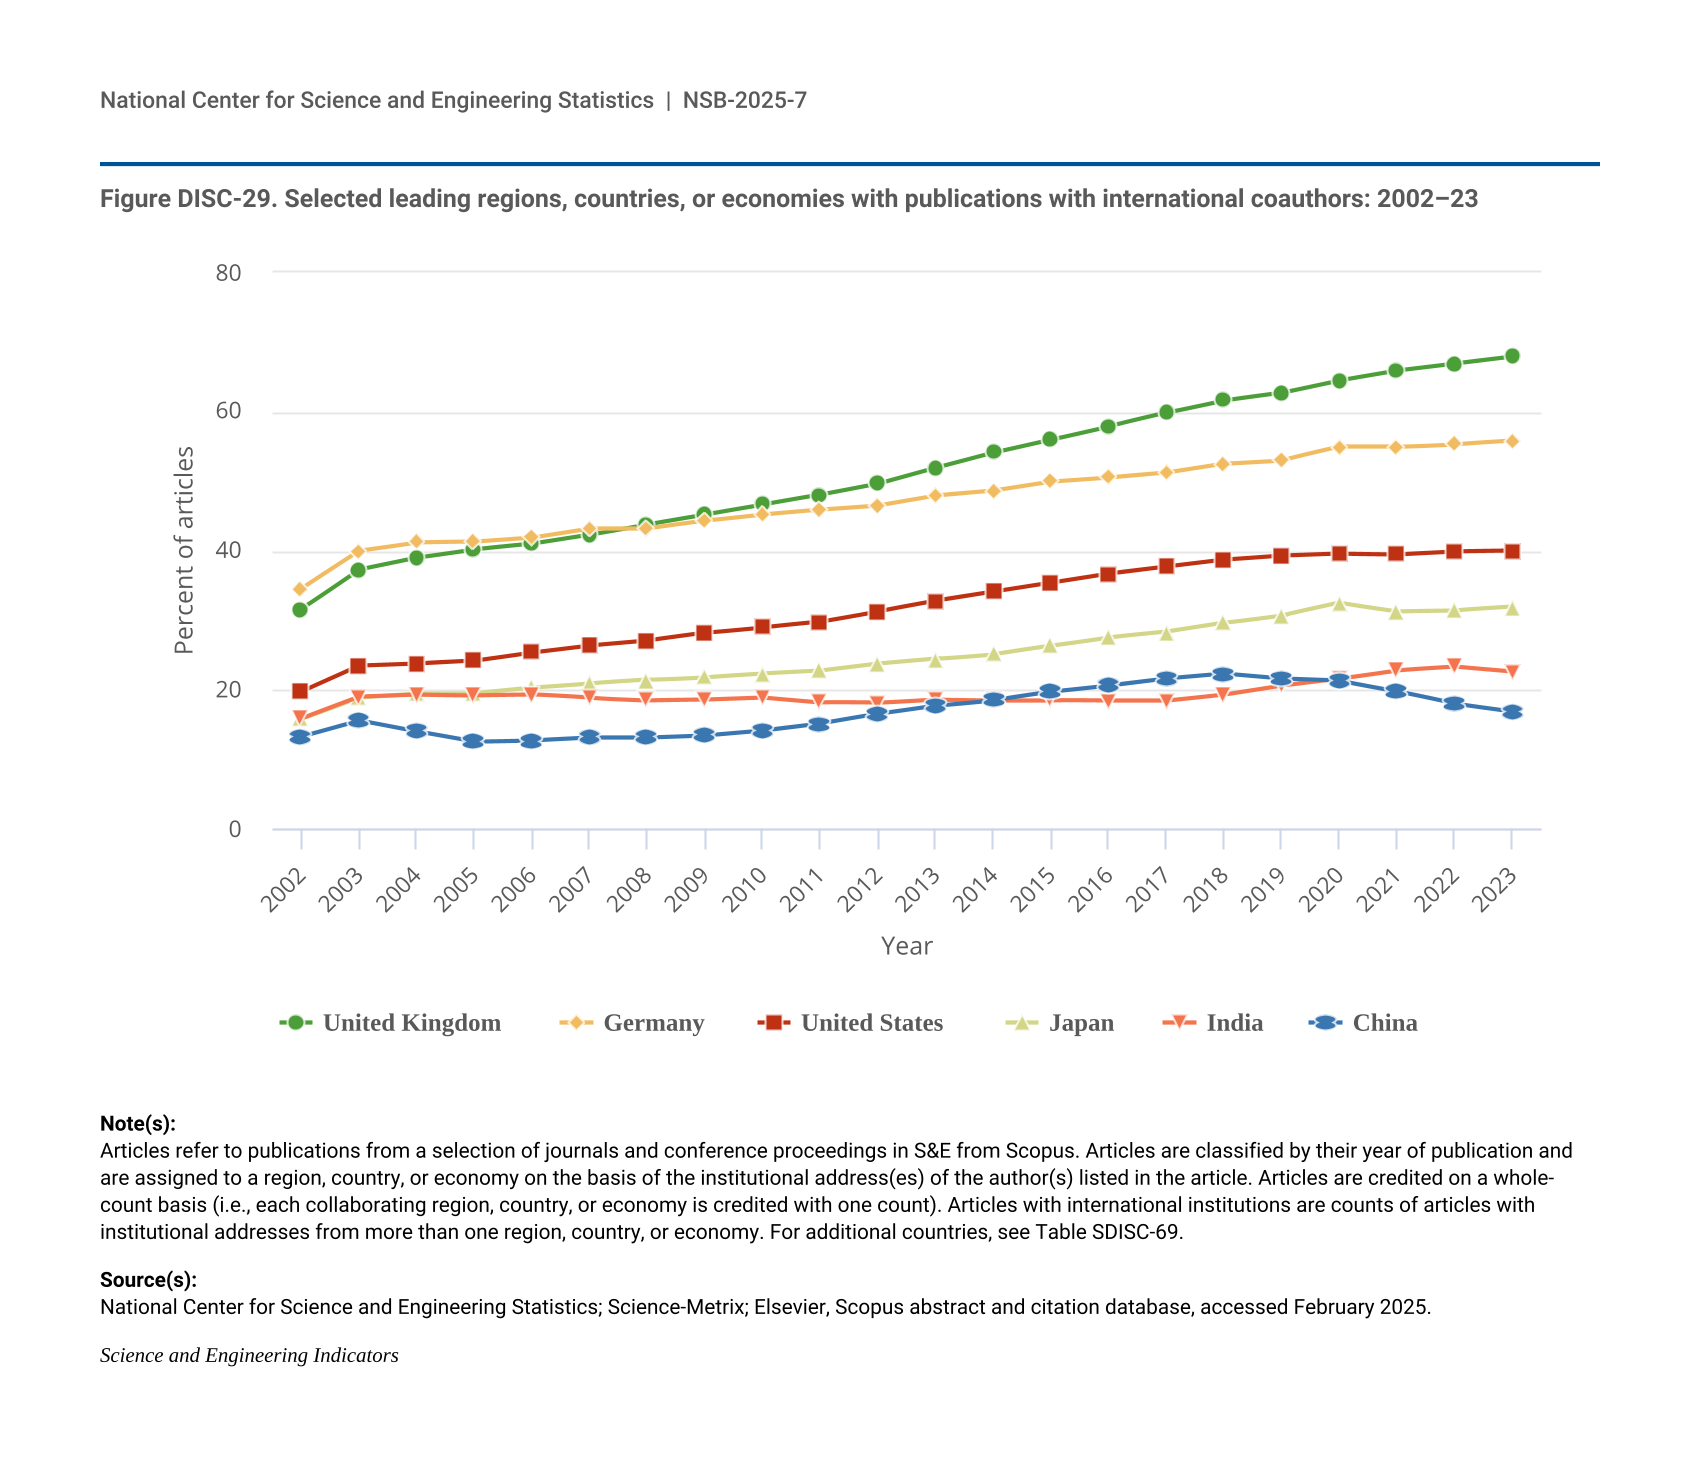
30 The unrounded HCA share of U.S. health science articles in 2023 was 1.8499%.
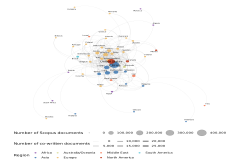
31 The total international collaboration rate differs from the rate of co-publications of individual regions, countries, or economies. Individual scores use whole counting, in which each geographic location with an institutional address on the publication receives 1 point. Therefore, the count for individual regions, countries, or economies will be larger than the number of publications that have authors with institutional addresses from two or more regions, countries, or economies, which is the basis for computing the total international collaboration rate.