 An official website of the United States government
 Publication Output by Geography and Scientific Field
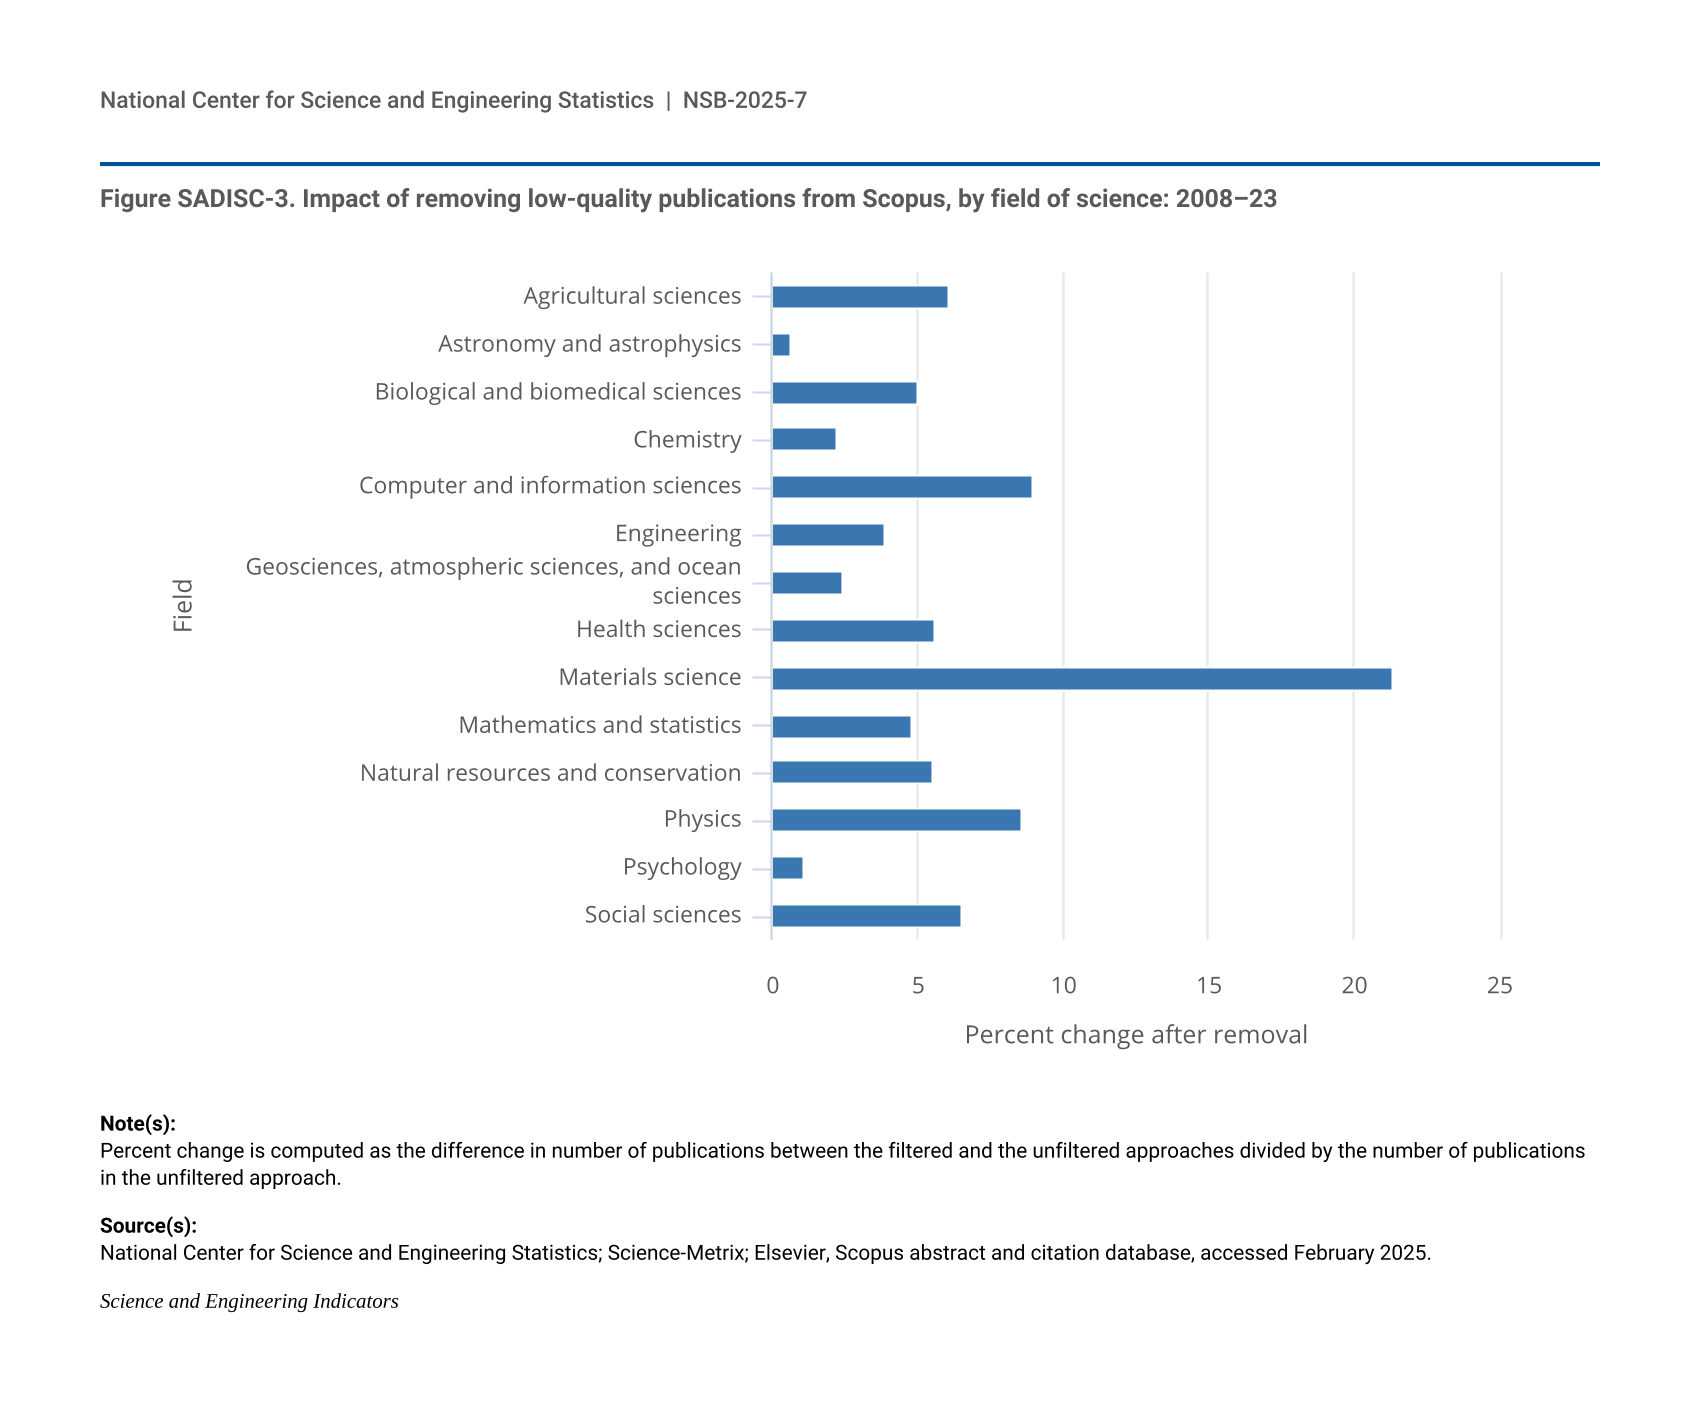
Research publications are an early output of R&D activity, especially academic R&D, and an important medium for disseminating and sharing scientific discoveries. The bibliometric analysis presented in this section includes papers with English-language titles and abstracts published in conference proceedings and research articles with English-language titles and abstracts published in peer-reviewed scientific and technical journals (collectively referred to as articles). The analysis excludes PhD dissertations, working papers, and preprints. It also excludes editorials, errata, letters, and other materials that do not typically present new scientific data, theories, methods, apparatuses, or experiments. The analysis also excludes articles published in journals that lack substantive peer review, sometimes referred to as predatory journals (Grudniewicz et al. 2019).
When aggregated, bibliometric indicators shed light on countrywide priorities across scientific fields. The scientific impact of publications through widely cited papers is an indicator of research quality. International collaborations in scientific publications show how researchers from different geographic locations pool resources and expertise to produce cutting-edge research or address global scientific challenges.
Output by Geography, S&E Field, and Sector
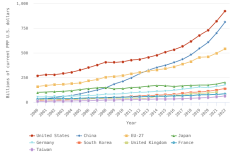
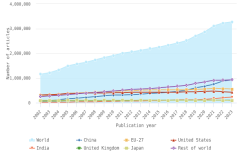
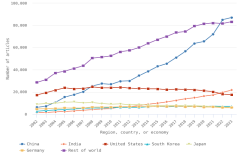
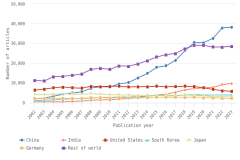
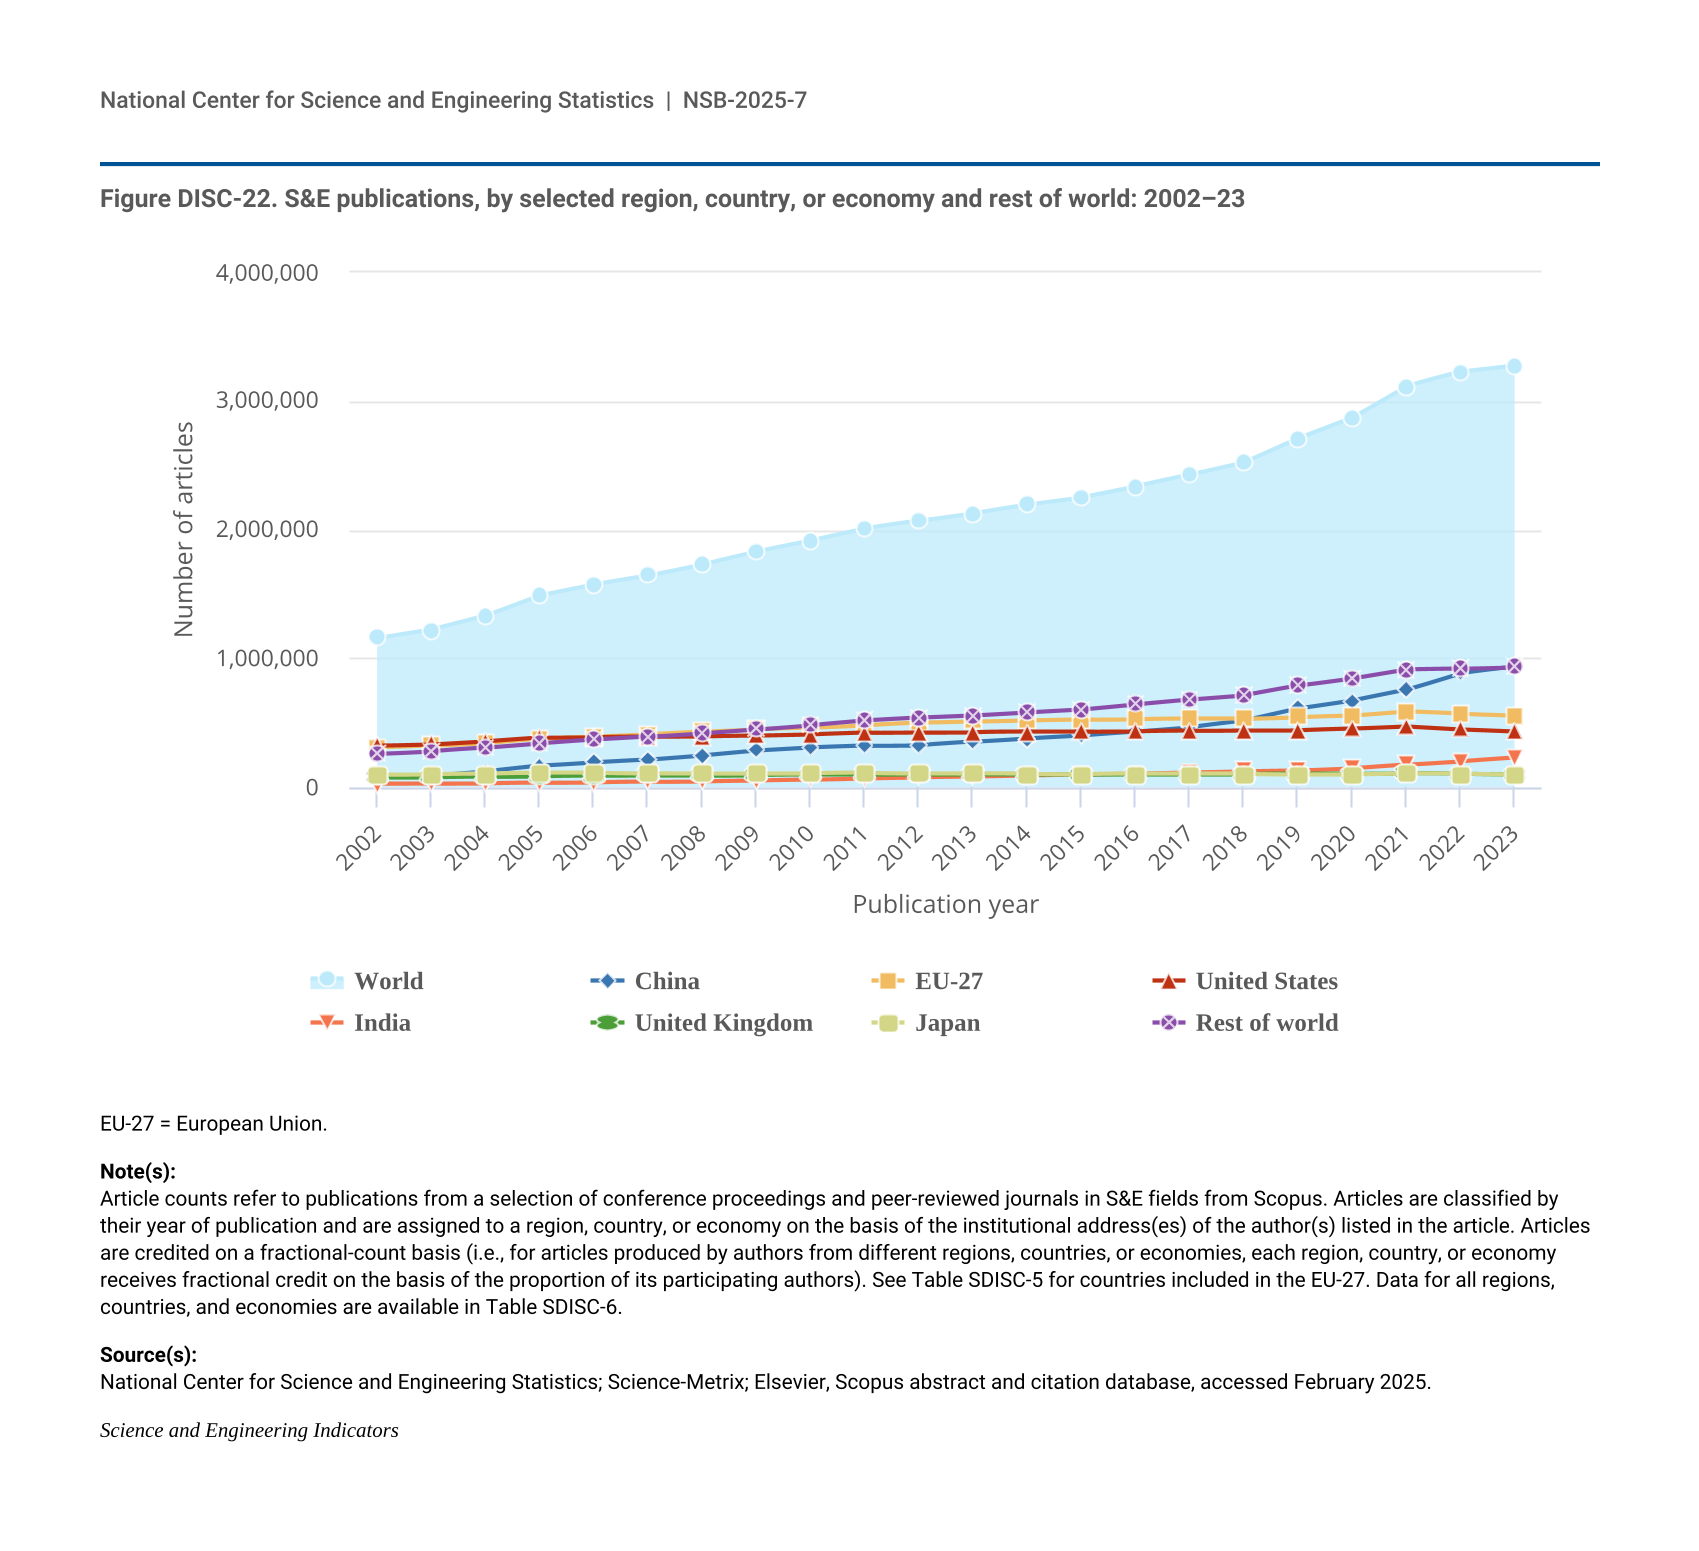
Worldwide S&E publication output totaled 3.3 million articles in 2023, based on entries in the Scopus database. In 2023, four countries each produced more than 100,000 articles: China, the United States, India, and Germany. Together, they accounted for over 50% of the worldwide total in 2023 (Table DISC-12). The majority of the growth in worldwide annual publication output from 2.2 million in 2014 to 3.3 million in 2023 was driven by authors from two countries: China (51% of additional publications during that period) and India (13%) (Figure DISC-22). Articles from the United States and the EU-27 grew modestly from 2014 to 2023, but both have since decreased from their peak years in 2021. Publications from the United Kingdom and Japan decreased since 2021.
na = not applicable.
The countries or economies are ranked based on the 2023 total. Article counts refer to publications from conference proceedings and peer-reviewed journal articles in S&E and indexed in Scopus (see "Technical Appendix" for more details). Articles are classified by their year of publication and are assigned to a region, country, or economy on the basis of the institutional address(es) of the author(s) listed in the article. Articles are credited on a fractional-count basis (i.e., for articles from multiple regions, countries, or economies, each country, region, or economy receives fractional credit on the basis of the proportion of its participating authors). Detail may not add to total because of regions, countries, or economies that are not shown. Proportions are based on the world total excluding unclassified addresses (data not presented). Data were extracted in February 2025. See Table SDISC-5 for groupings of regions, countries, or economies. Data by all regions, countries, and economies are available in Table SDISC-6.
National Center for Science and Engineering Statistics; Science-Metrix; Elsevier, Scopus abstract and citation database, accessed February 2025.
Science and Engineering Indicators
| Publication year | World | China | EU-27 | United States | India | United Kingdom | Japan | Rest of world |
|---|---|---|---|---|---|---|---|---|
| 2002 | 1,157,942 | 74,940 | 307,259 | 321,622 | 23,697 | 74,894 | 98,708 | 256,822 |
| 2003 | 1,222,350 | 87,586 | 319,973 | 332,537 | 26,124 | 76,100 | 101,128 | 278,901 |
| 2004 | 1,330,675 | 120,909 | 338,573 | 356,186 | 28,041 | 79,861 | 103,608 | 303,497 |
| 2005 | 1,491,231 | 165,262 | 374,012 | 385,012 | 32,138 | 84,953 | 111,936 | 337,918 |
| 2006 | 1,576,555 | 192,021 | 392,756 | 387,808 | 37,022 | 88,295 | 112,743 | 365,910 |
| 2007 | 1,644,647 | 212,955 | 410,767 | 390,237 | 41,304 | 90,883 | 108,598 | 389,904 |
| 2008 | 1,732,822 | 246,970 | 430,826 | 392,571 | 46,505 | 90,802 | 106,637 | 418,511 |
| 2009 | 1,832,273 | 284,471 | 449,914 | 397,790 | 51,851 | 92,979 | 107,477 | 447,789 |
| 2010 | 1,916,968 | 307,848 | 461,646 | 407,406 | 58,296 | 93,218 | 107,213 | 481,340 |
| 2011 | 2,010,556 | 320,967 | 480,846 | 420,414 | 69,056 | 94,938 | 109,048 | 515,285 |
| 2012 | 2,068,879 | 326,401 | 500,130 | 425,174 | 75,559 | 97,119 | 107,470 | 537,025 |
| 2013 | 2,129,076 | 351,526 | 510,177 | 427,373 | 80,195 | 98,613 | 106,968 | 554,226 |
| 2014 | 2,195,509 | 379,466 | 519,982 | 428,018 | 88,316 | 97,947 | 103,354 | 578,426 |
| 2015 | 2,251,810 | 401,136 | 525,923 | 429,258 | 94,794 | 99,583 | 100,597 | 600,519 |
| 2016 | 2,337,464 | 430,350 | 528,513 | 431,808 | 104,740 | 100,100 | 101,167 | 640,787 |
| 2017 | 2,426,377 | 464,154 | 530,740 | 435,377 | 115,045 | 100,864 | 101,854 | 678,343 |
| 2018 | 2,523,089 | 513,575 | 530,444 | 441,100 | 123,053 | 101,075 | 101,999 | 711,843 |
| 2019 | 2,712,000 | 608,625 | 543,786 | 442,657 | 128,580 | 102,036 | 100,156 | 786,161 |
| 2020 | 2,873,196 | 671,731 | 554,457 | 453,890 | 145,711 | 103,342 | 100,403 | 843,662 |
| 2021 | 3,117,036 | 756,203 | 588,274 | 471,378 | 173,096 | 108,096 | 106,310 | 913,679 |
| 2022 | 3,225,981 | 885,963 | 568,739 | 447,539 | 200,488 | 101,776 | 102,423 | 919,053 |
| 2023 | 3,275,079 | 932,712 | 558,077 | 430,843 | 228,174 | 97,536 | 96,543 | 931,193 |
EU-27 = European Union.
Article counts refer to publications from a selection of conference proceedings and peer-reviewed journals in S&E fields from Scopus. Articles are classified by their year of publication and are assigned to a region, country, or economy on the basis of the institutional address(es) of the author(s) listed in the article. Articles are credited on a fractional-count basis (i.e., for articles produced by authors from different regions, countries, or economies, each region, country, or economy receives fractional credit on the basis of the proportion of its participating authors). See Table SDISC-5 for countries included in the EU-27. Data for all regions, countries, and economies are available in Table SDISC-6.
National Center for Science and Engineering Statistics; Science-Metrix; Elsevier, Scopus abstract and citation database, accessed February 2025.
Science and Engineering Indicators
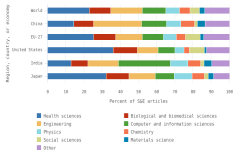
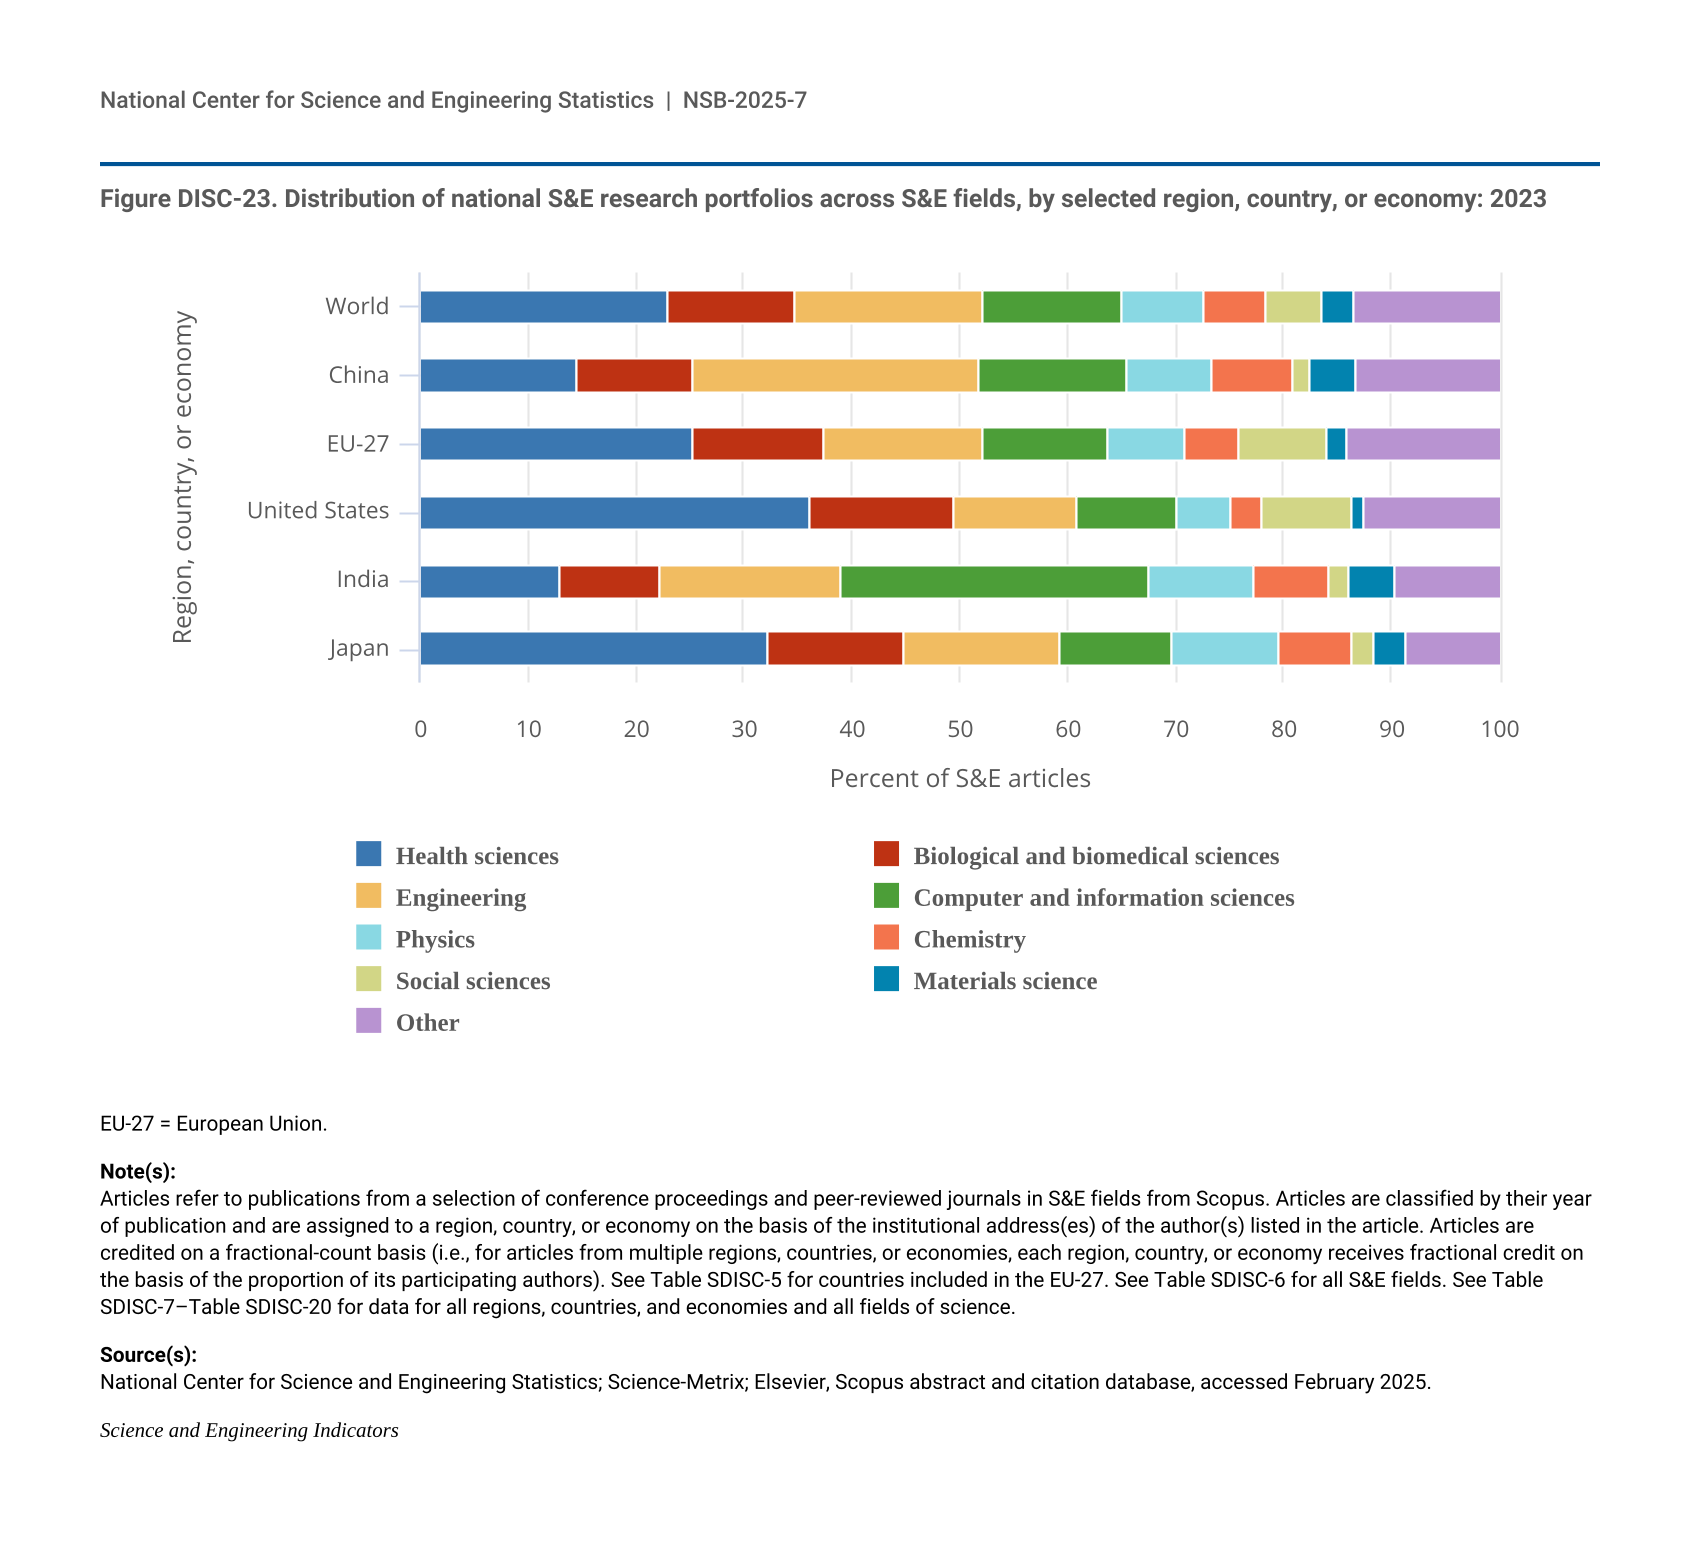
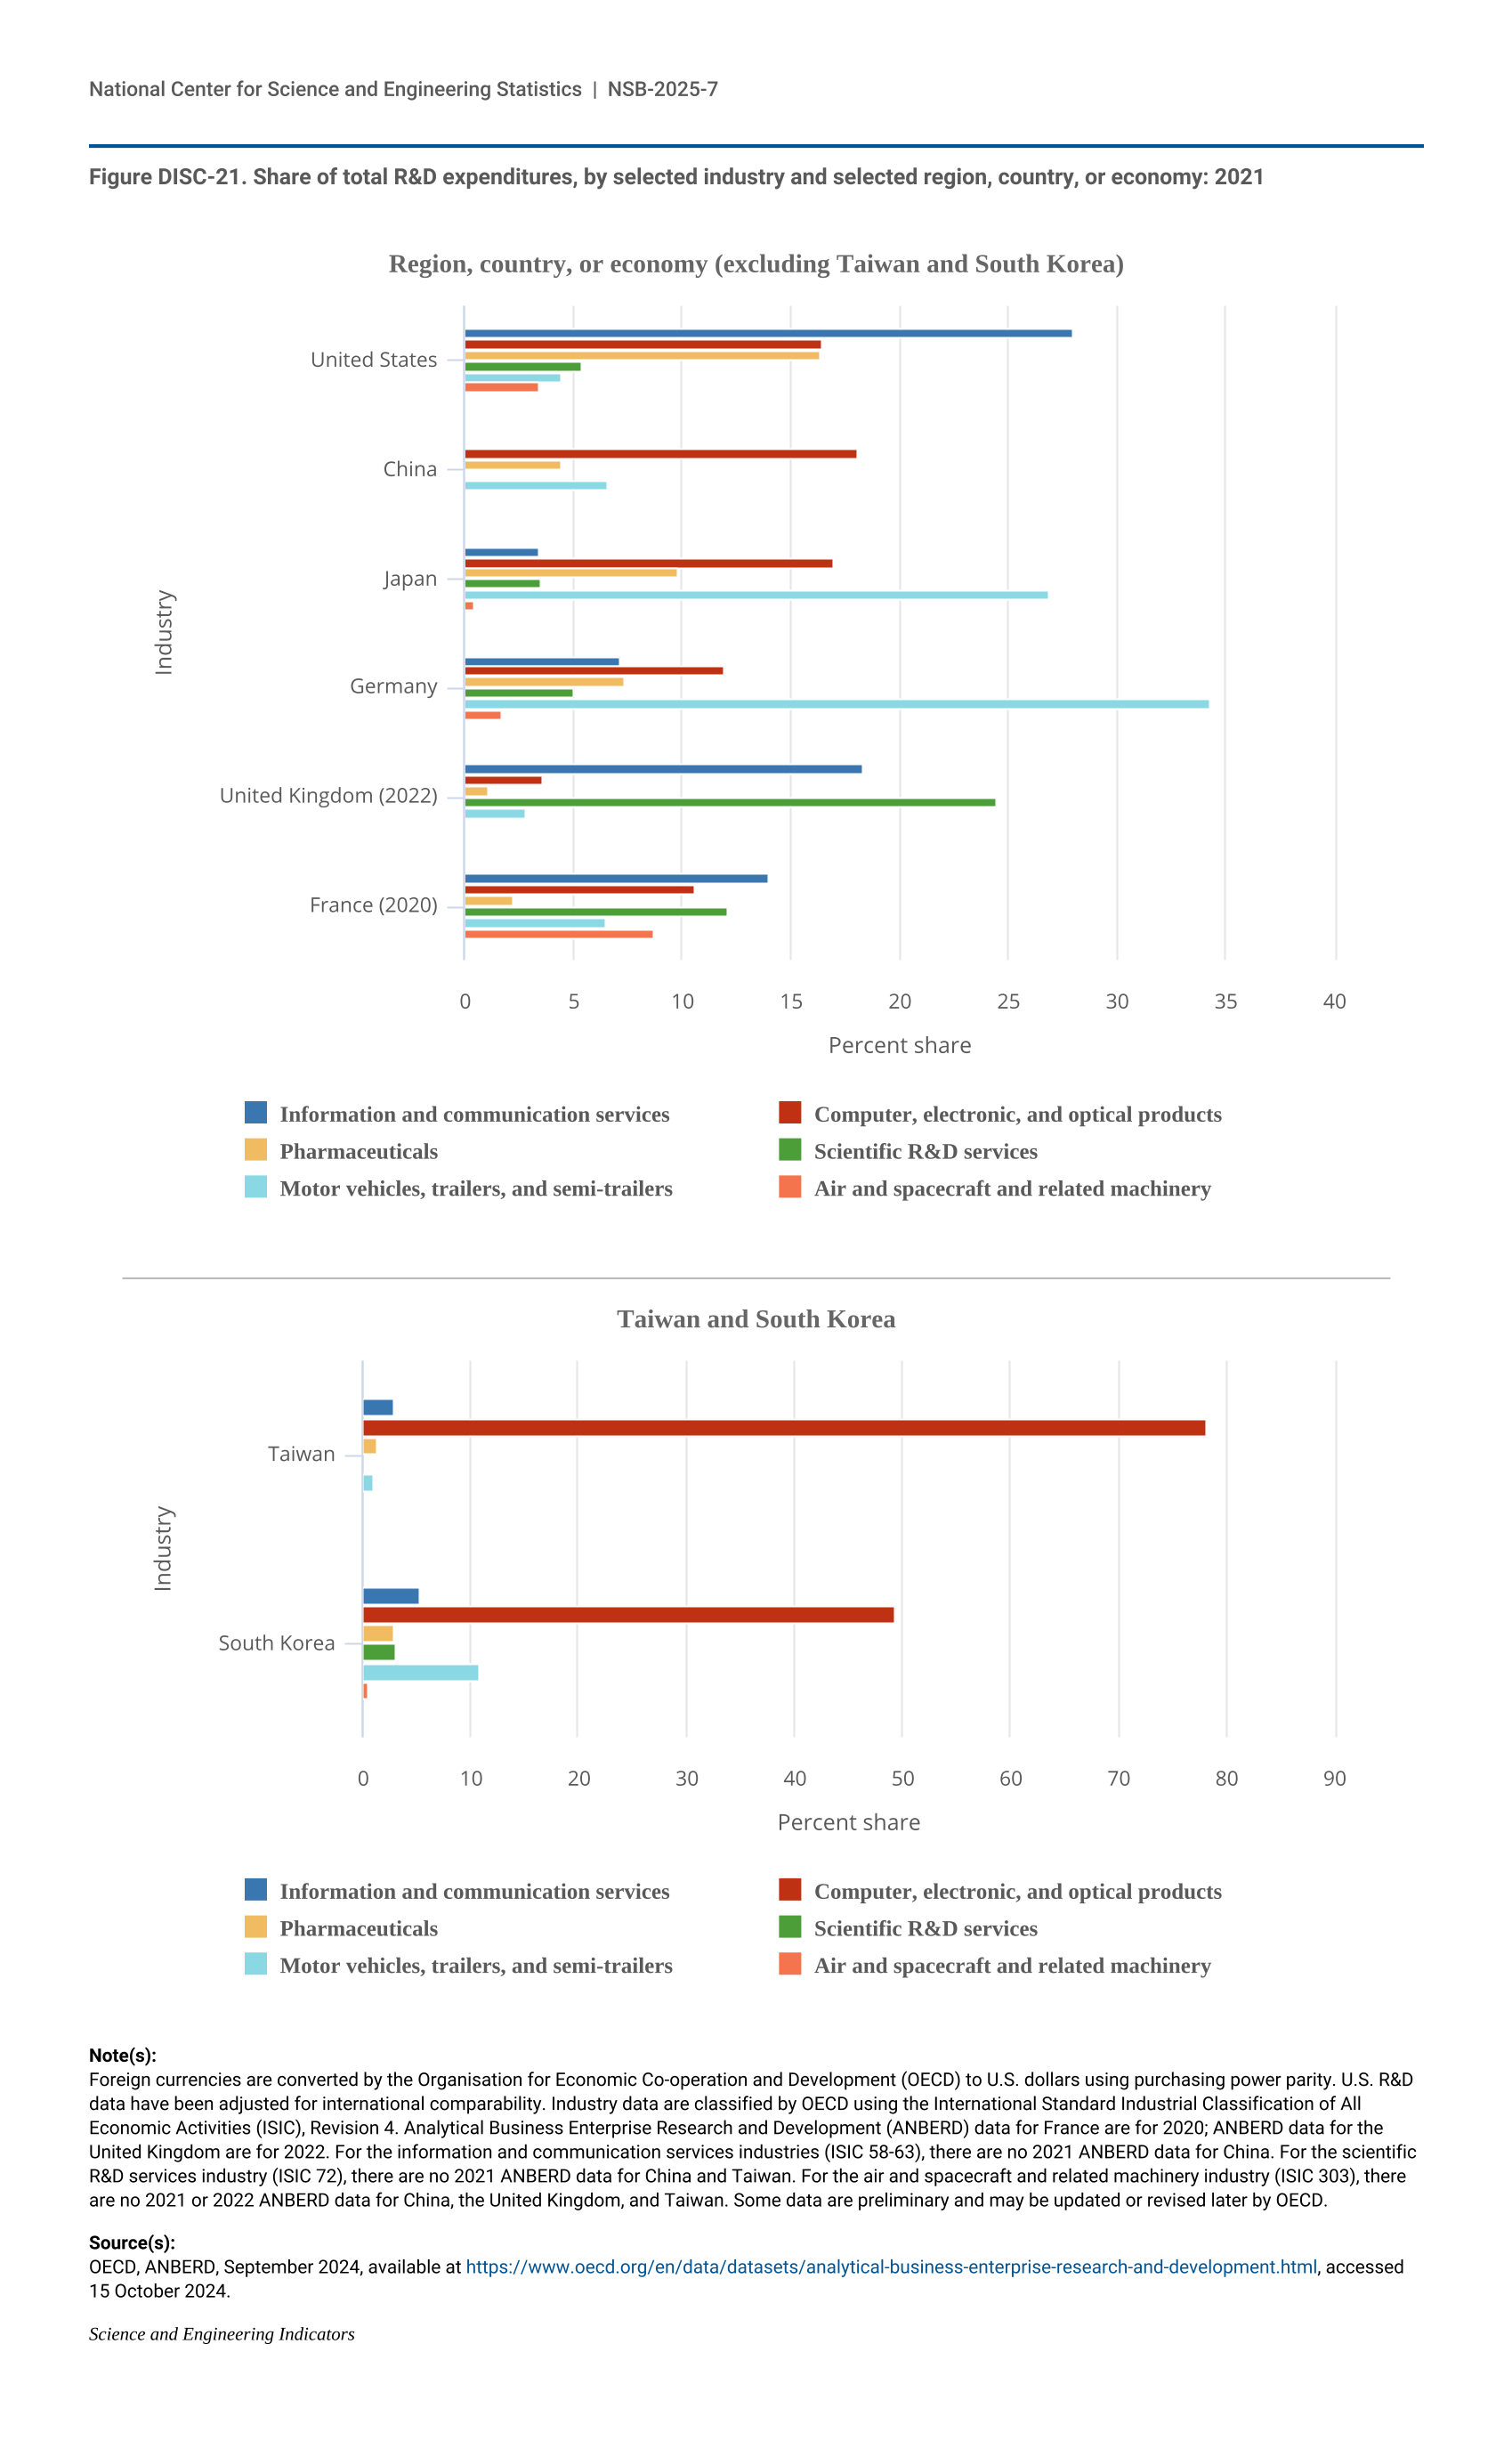
The distribution of publications by field of science across geographies may indicate research priorities and capabilities. Globally, health sciences represented 23% of all publications in 2023, the highest output of any field (Figure DISC-23). Other fields with large numbers of publications included engineering (17% of publications in 2023), computer and information sciences (13%), and biological and biomedical sciences (12%). Among top producers, authors in three regions, countries, or economies had their highest concentration of publications in health sciences in 2023: the United States (36% of its total publications), Japan (32%), and the EU-27 (25%). Meanwhile, authors from China had the most publications in engineering (26%), and authors from India had the most publications in computer and information sciences (28%).
| Region, country, or economy | Health sciences | Biological and biomedical sciences | Engineering | Computer and information sciences | Physics | Chemistry | Social sciences | Materials science | Other |
|---|---|---|---|---|---|---|---|---|---|
| World | 22.90 | 11.85 | 17.42 | 12.88 | 7.58 | 5.66 | 5.32 | 2.79 | 13.61 |
| China | 14.43 | 10.93 | 26.43 | 13.67 | 7.83 | 7.65 | 1.46 | 4.31 | 13.28 |
| EU-27 | 25.37 | 12.16 | 14.67 | 11.53 | 7.13 | 4.94 | 8.12 | 1.90 | 14.17 |
| United States | 36.13 | 13.26 | 11.43 | 9.24 | 5.03 | 2.95 | 8.30 | 1.08 | 12.58 |
| India | 12.90 | 9.23 | 16.90 | 28.48 | 9.78 | 6.97 | 1.83 | 4.26 | 9.65 |
| Japan | 32.30 | 12.43 | 14.50 | 10.46 | 9.92 | 6.61 | 2.22 | 2.79 | 8.76 |
EU-27 = European Union.
Articles refer to publications from a selection of conference proceedings and peer-reviewed journals in S&E fields from Scopus. Articles are classified by their year of publication and are assigned to a region, country, or economy on the basis of the institutional address(es) of the author(s) listed in the article. Articles are credited on a fractional-count basis (i.e., for articles from multiple regions, countries, or economies, each region, country, or economy receives fractional credit on the basis of the proportion of its participating authors). See Table SDISC-5 for countries included in the EU-27. See Table SDISC-6 for all S&E fields. See Table SDISC-7–Table SDISC-20 for data for all regions, countries, and economies and all fields of science.
National Center for Science and Engineering Statistics; Science-Metrix; Elsevier, Scopus abstract and citation database, accessed February 2025.
Science and Engineering Indicators
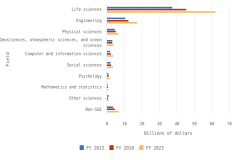
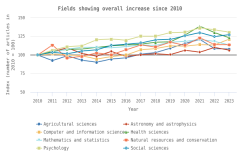
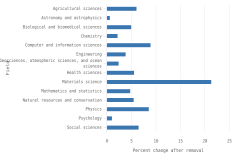
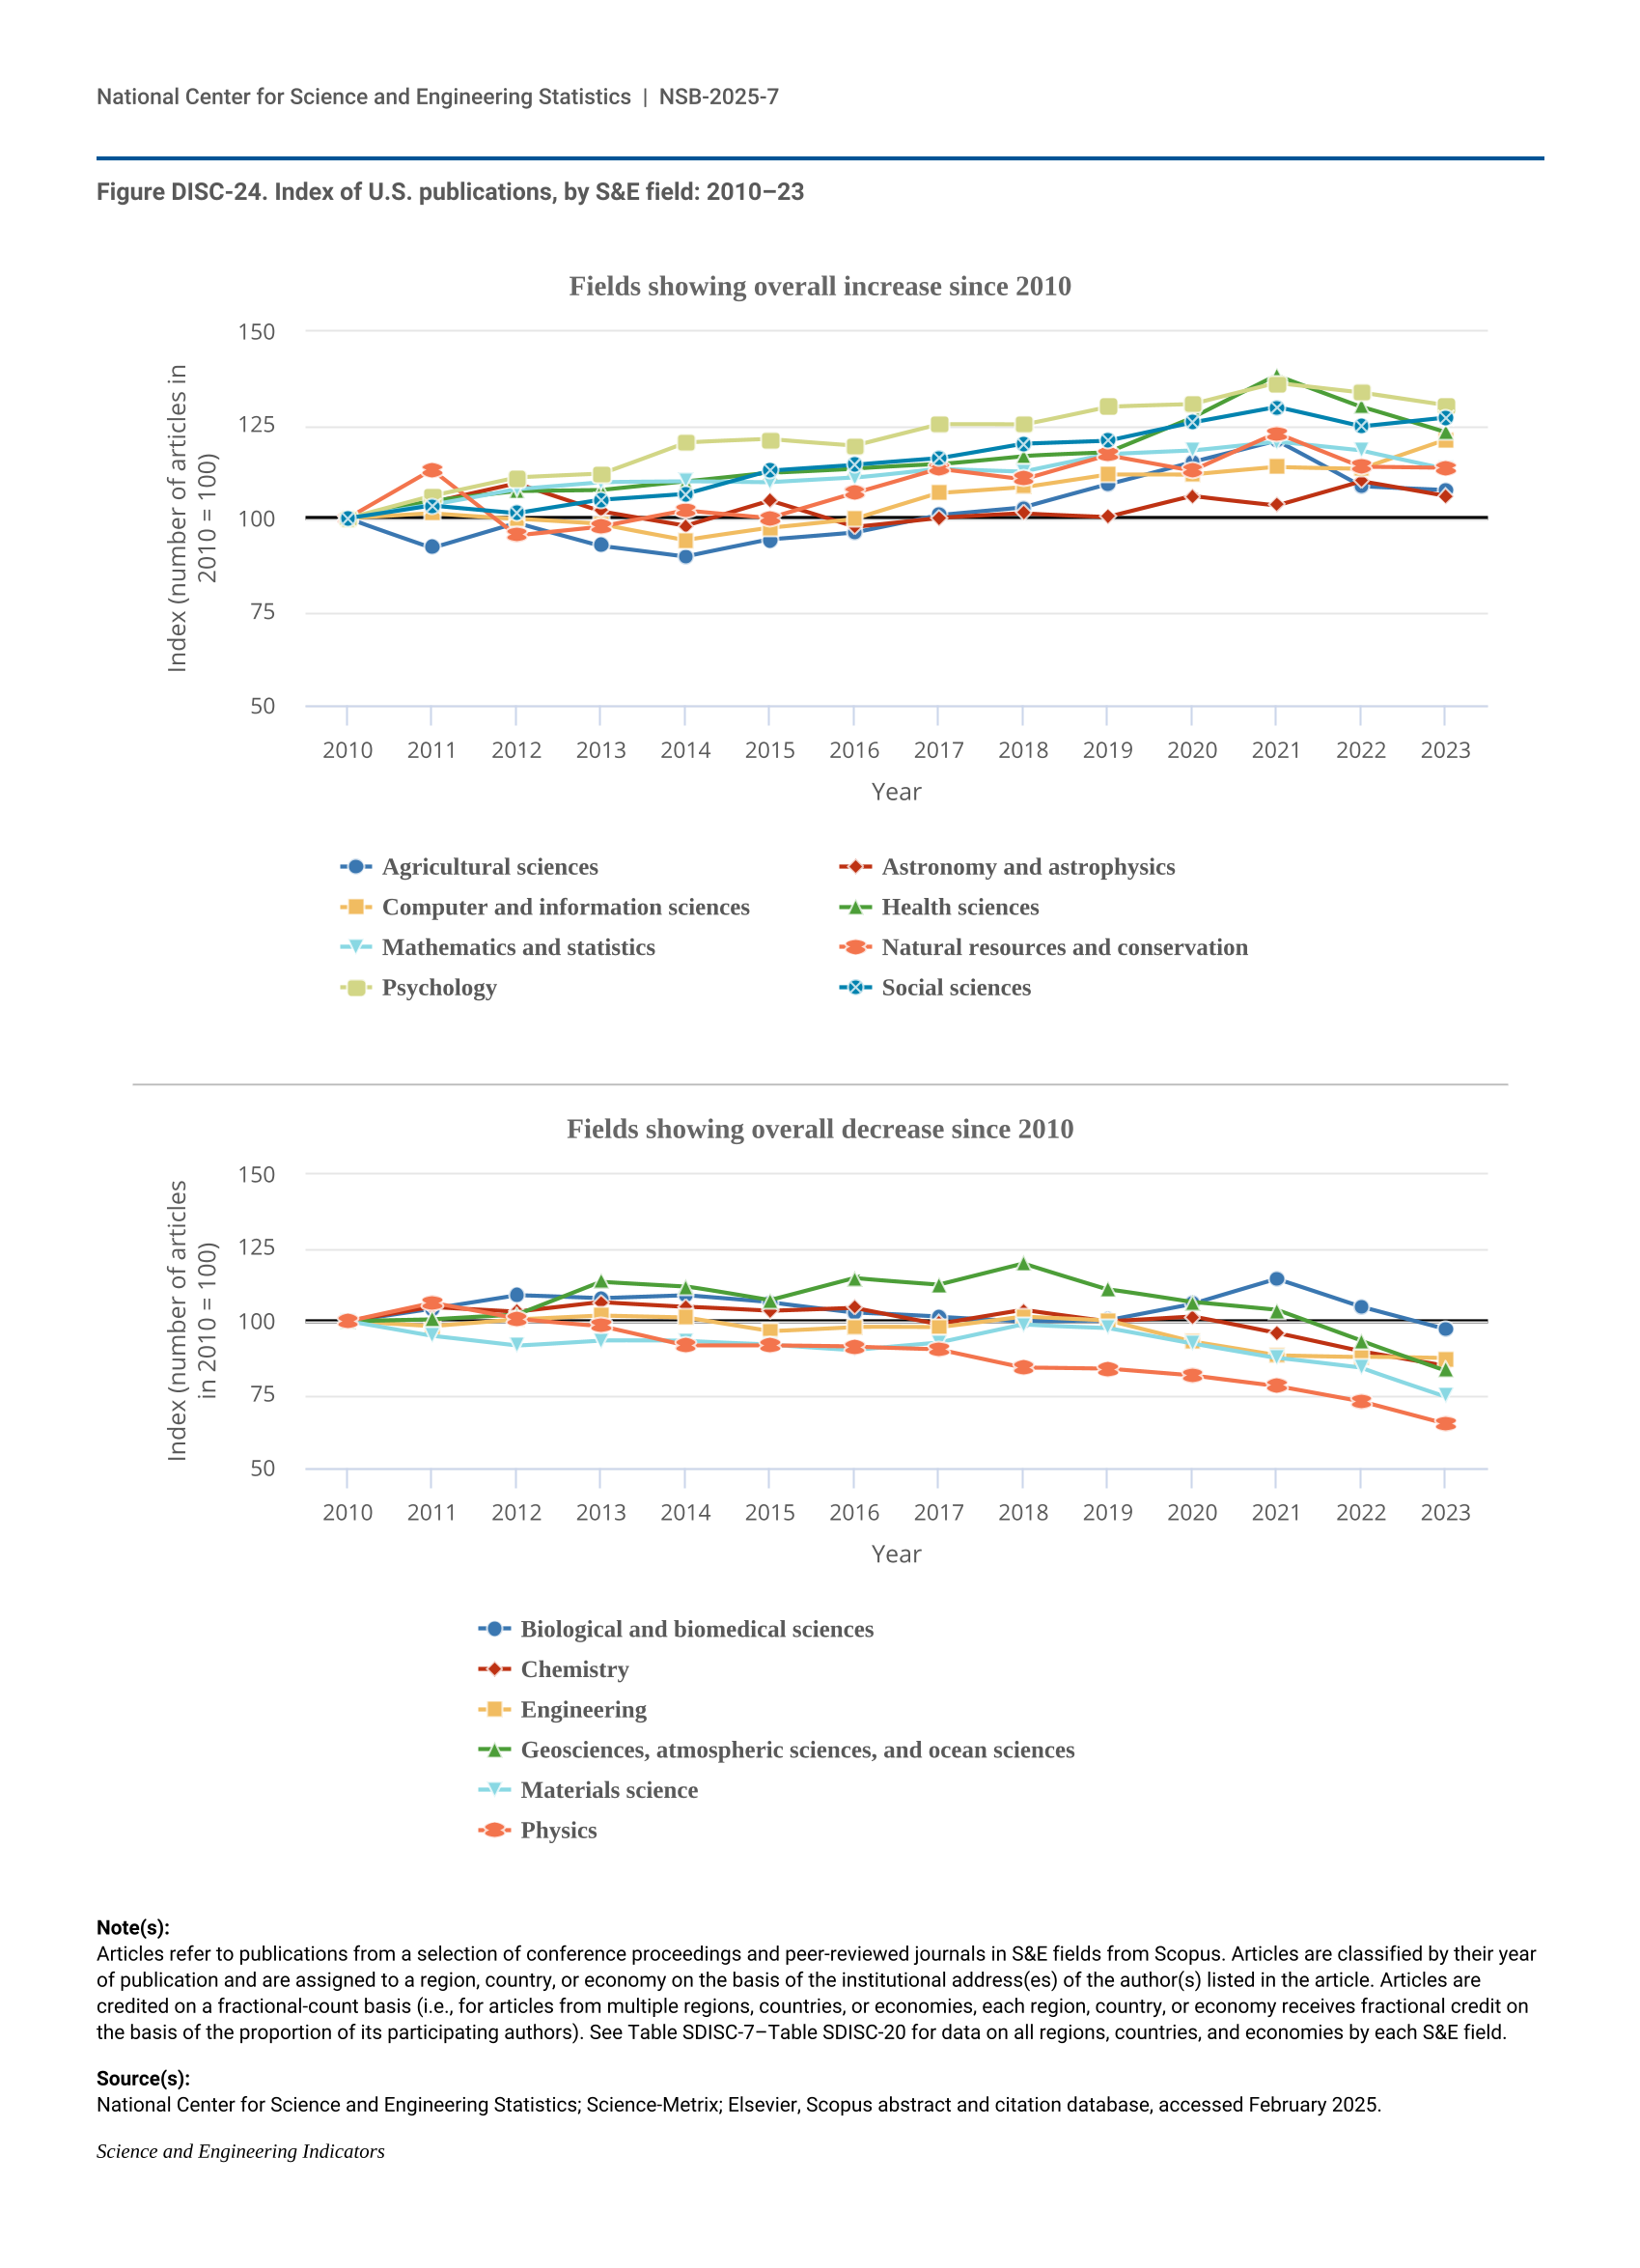
Within the United States, the fastest-growing scientific fields from 2010 to 2023 were psychology (up 30%), social sciences (up 27%), and health sciences (up 23%) (Figure DISC-24). Meanwhile, fields with the largest decreases in U.S. publications included physics (down 35% from 2010 to 2023), materials science (down 26%), and geosciences, atmospheric sciences, and ocean sciences (down 17%).
| Year | Agricultural sciences | Astronomy and astrophysics | Computer and information sciences | Health sciences | Mathematics and statistics | Natural resources and conservation | Psychology | Social sciences |
|---|---|---|---|---|---|---|---|---|
| 2010 | 100.00 | 100.00 | 100.00 | 100.00 | 100.00 | 100.00 | 100.00 | 100.00 |
| 2011 | 92.21 | 104.29 | 101.36 | 104.66 | 103.63 | 112.98 | 106.06 | 103.47 |
| 2012 | 98.90 | 109.31 | 99.93 | 107.27 | 107.92 | 95.60 | 110.93 | 101.48 |
| 2013 | 92.75 | 101.90 | 98.45 | 107.56 | 109.78 | 97.93 | 111.91 | 105.05 |
| 2014 | 89.82 | 98.09 | 94.31 | 109.85 | 109.96 | 102.16 | 120.34 | 106.66 |
| 2015 | 94.33 | 104.80 | 97.49 | 112.24 | 109.65 | 100.21 | 121.19 | 112.89 |
| 2016 | 96.22 | 97.75 | 99.90 | 113.40 | 110.87 | 106.82 | 119.55 | 114.39 |
| 2017 | 100.90 | 100.21 | 106.76 | 114.51 | 113.36 | 113.38 | 125.22 | 116.07 |
| 2018 | 102.93 | 101.35 | 108.37 | 116.77 | 112.63 | 110.53 | 125.09 | 120.02 |
| 2019 | 109.03 | 100.49 | 111.83 | 117.60 | 117.16 | 116.94 | 129.92 | 120.80 |
| 2020 | 115.13 | 106.03 | 111.80 | 126.88 | 118.11 | 112.83 | 130.53 | 125.65 |
| 2021 | 120.83 | 103.59 | 113.76 | 138.23 | 120.51 | 122.76 | 136.17 | 129.80 |
| 2022 | 108.54 | 110.05 | 113.37 | 129.92 | 118.10 | 113.83 | 133.64 | 124.54 |
| 2023 | 107.57 | 106.07 | 121.08 | 122.98 | 113.31 | 113.49 | 130.29 | 126.92 |
| Year | Biological and biomedical sciences | Chemistry | Engineering | Geosciences, atmospheric sciences, and ocean sciences | Materials science | Physics |
|---|---|---|---|---|---|---|
| 2010 | 100.00 | 100.00 | 100.00 | 100.00 | 100.00 | 100.00 |
| 2011 | 104.29 | 104.78 | 98.22 | 100.60 | 94.90 | 106.23 |
| 2012 | 108.86 | 103.23 | 100.50 | 102.19 | 91.58 | 100.76 |
| 2013 | 107.75 | 106.50 | 101.84 | 113.47 | 93.38 | 98.42 |
| 2014 | 108.74 | 104.98 | 101.20 | 111.91 | 93.18 | 91.74 |
| 2015 | 106.33 | 103.50 | 96.53 | 107.02 | 92.05 | 91.67 |
| 2016 | 102.92 | 104.56 | 98.01 | 114.59 | 90.19 | 91.26 |
| 2017 | 101.44 | 99.04 | 97.80 | 112.48 | 92.63 | 90.41 |
| 2018 | 100.05 | 103.74 | 101.51 | 119.65 | 98.81 | 84.27 |
| 2019 | 100.35 | 99.93 | 100.26 | 110.92 | 97.77 | 83.84 |
| 2020 | 105.86 | 101.61 | 93.05 | 106.42 | 92.44 | 81.49 |
| 2021 | 114.34 | 95.86 | 88.36 | 103.70 | 87.50 | 77.89 |
| 2022 | 104.78 | 89.57 | 87.86 | 93.20 | 83.98 | 72.58 |
| 2023 | 97.15 | 84.69 | 87.27 | 83.27 | 74.37 | 64.97 |
Articles refer to publications from a selection of conference proceedings and peer-reviewed journals in S&E fields from Scopus. Articles are classified by their year of publication and are assigned to a region, country, or economy on the basis of the institutional address(es) of the author(s) listed in the article. Articles are credited on a fractional-count basis (i.e., for articles from multiple regions, countries, or economies, each region, country, or economy receives fractional credit on the basis of the proportion of its participating authors). See Table SDISC-7–Table SDISC-20 for data on all regions, countries, and economies by each S&E field.
National Center for Science and Engineering Statistics; Science-Metrix; Elsevier, Scopus abstract and citation database, accessed February 2025.
Science and Engineering Indicators
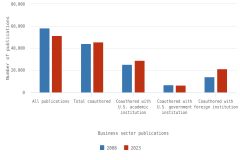
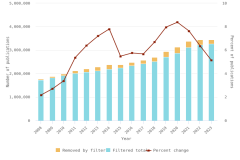
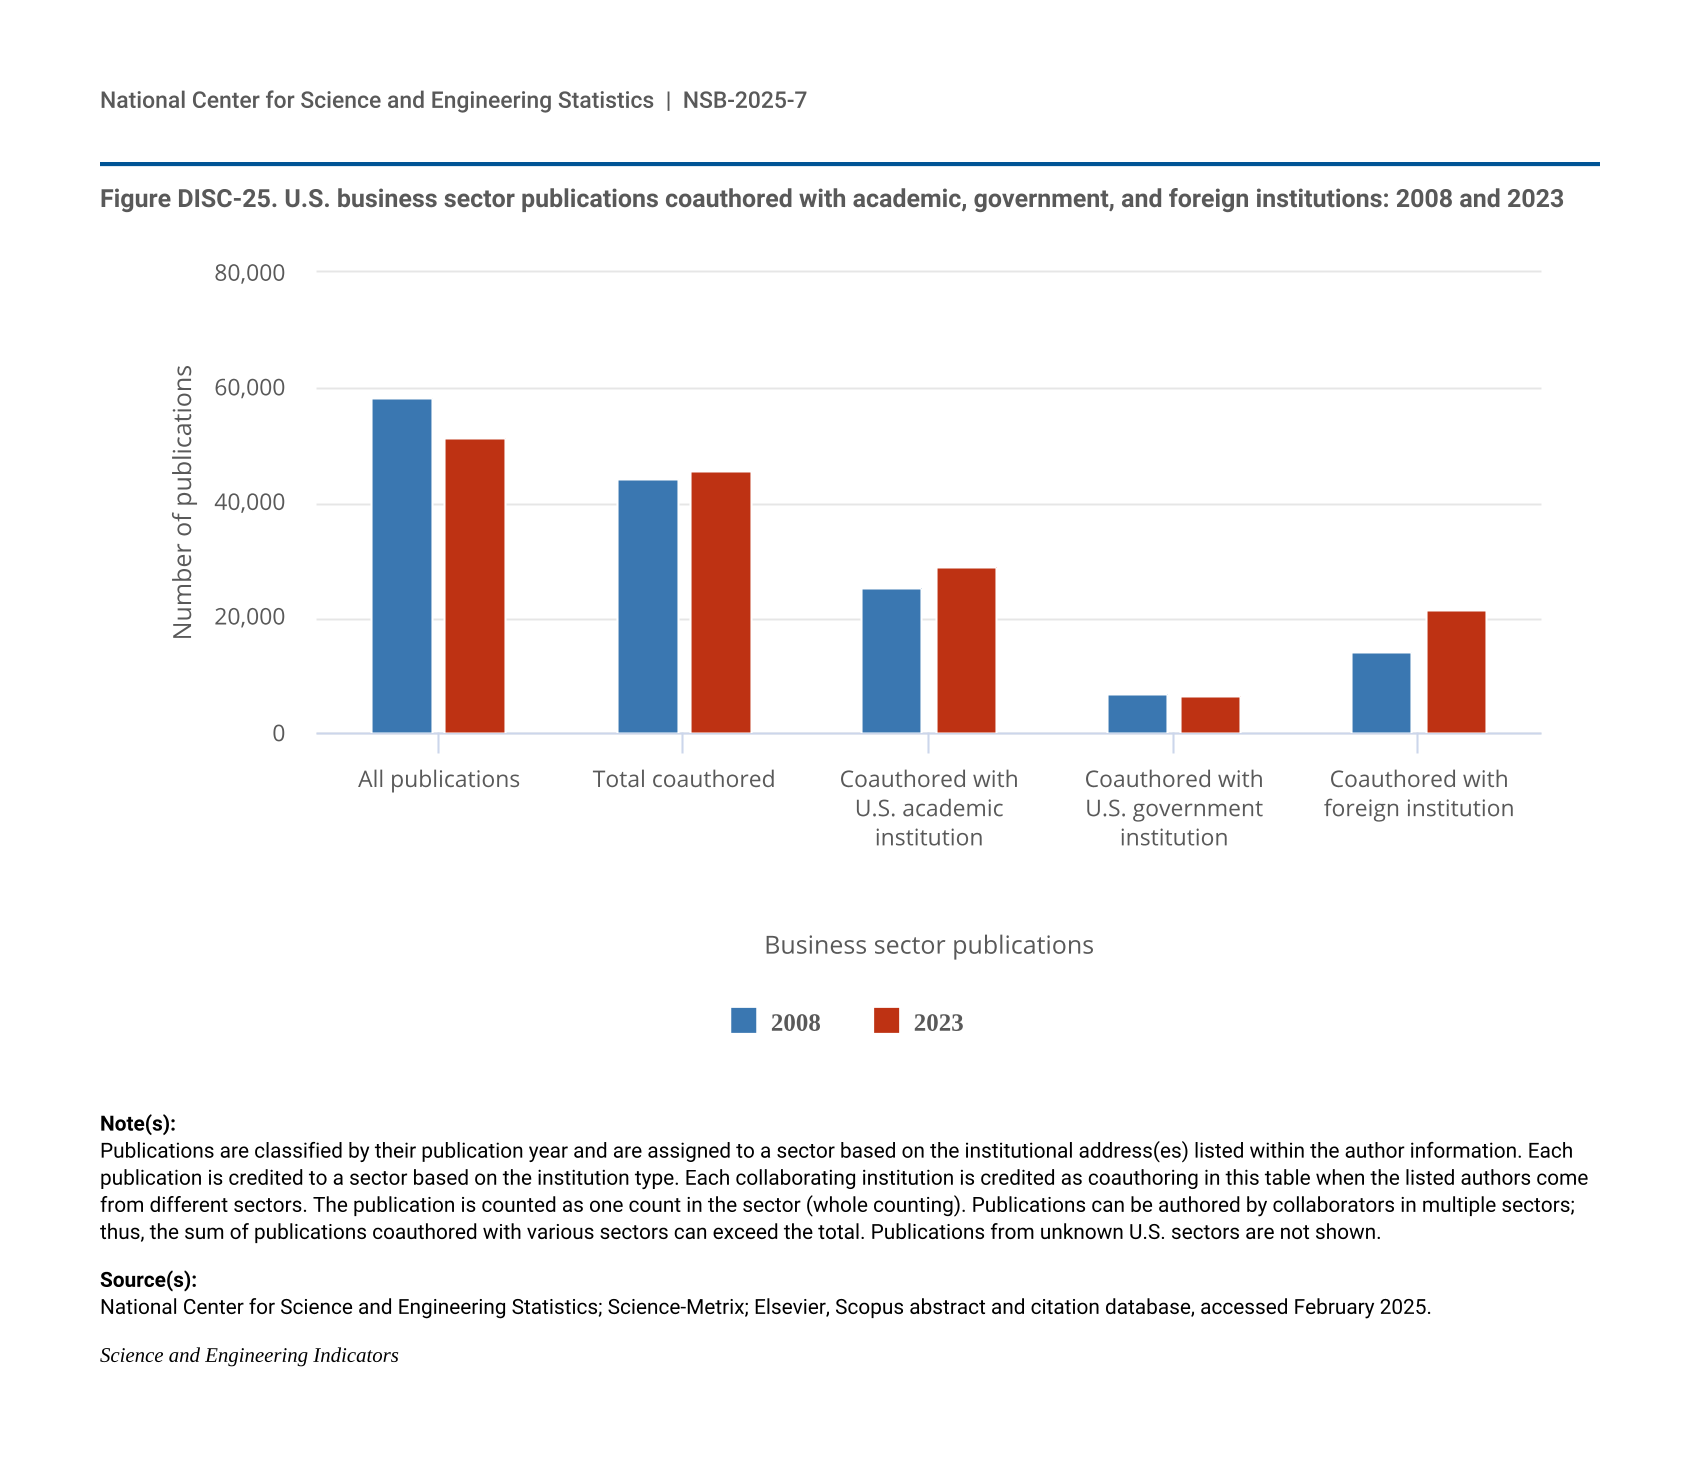
Research can be conducted in different sectors—such as academia, business, or government—with publication output serving as an indicator for resulting discoveries and collaboration. While students, faculty, and other academic staff may be more incentivized to produce peer-reviewed articles than authors from the business sector (Hicks 1995; Simeth and Raffo 2013), companies do benefit from publications by their scientists and engineers (Rotolo et al. 2022) resulting from their R&D activities (see section U.S. Business R&D), along with other research outputs such as patenting and licensing (see Indicators 2026 report “Translation to Impact: U.S. and Global Science, Technology, and Innovation Output” [NSB forthcoming]). In the United States, the overall number of publications with business sector authors decreased from 2008 (58,346 articles) to 2023 (51,293). At the same time, an increasing share of articles with business sector authors were published collaboratively with authors outside the business sector. Coauthorship with colleagues from U.S. academic institutions produced the highest business publications output in 2023 (28,956), followed by collaboration with foreign (21,306) and U.S. government institutions (6,509) (Figure DISC-25).
| Business sector publications | 2008 | 2023 |
|---|---|---|
| All publications | 58,346 | 51,293 |
| Total coauthored | 44,040 | 45,639 |
| Coauthored with U.S. academic institution | 25,184 | 28,956 |
| Coauthored with U.S. government institution | 6,742 | 6,509 |
| Coauthored with foreign institution | 14,290 | 21,306 |
Publications are classified by their publication year and are assigned to a sector based on the institutional address(es) listed within the author information. Each publication is credited to a sector based on the institution type. Each collaborating institution is credited as coauthoring in this table when the listed authors come from different sectors. The publication is counted as one count in the sector (whole counting). Publications can be authored by collaborators in multiple sectors; thus, the sum of publications coauthored with various sectors can exceed the total. Publications from unknown U.S. sectors are not shown.
National Center for Science and Engineering Statistics; Science-Metrix; Elsevier, Scopus abstract and citation database, accessed February 2025.
Science and Engineering Indicators
Impact of Published Research
In addition to the total production of articles, indicators gauging the significance of published articles help assess the vitality and competitiveness of the U.S. S&E enterprise. Generally, authors of scientific articles cite previously published articles that influenced or informed their own research (Merton 1973; Tahamtan and Bornmann 2018). Thus, when an article is cited by many other articles, it is deemed to have scientific impact (Garfield 1973). Articles may accumulate citations over time, and although most scientific articles garner few or no citations, a small share receives hundreds or thousands of citations (Van Noorden, Maher, and Nuzzo 2014). Counting the citations earned by an article at least 2 years after publication provides sufficient time for high-impact articles to receive a distinguishing number of citations, although only articles published in the same field and the same year may be compared (Wang 2012). For this reason, the most recent available year for HCA-rated indicators is 2022.
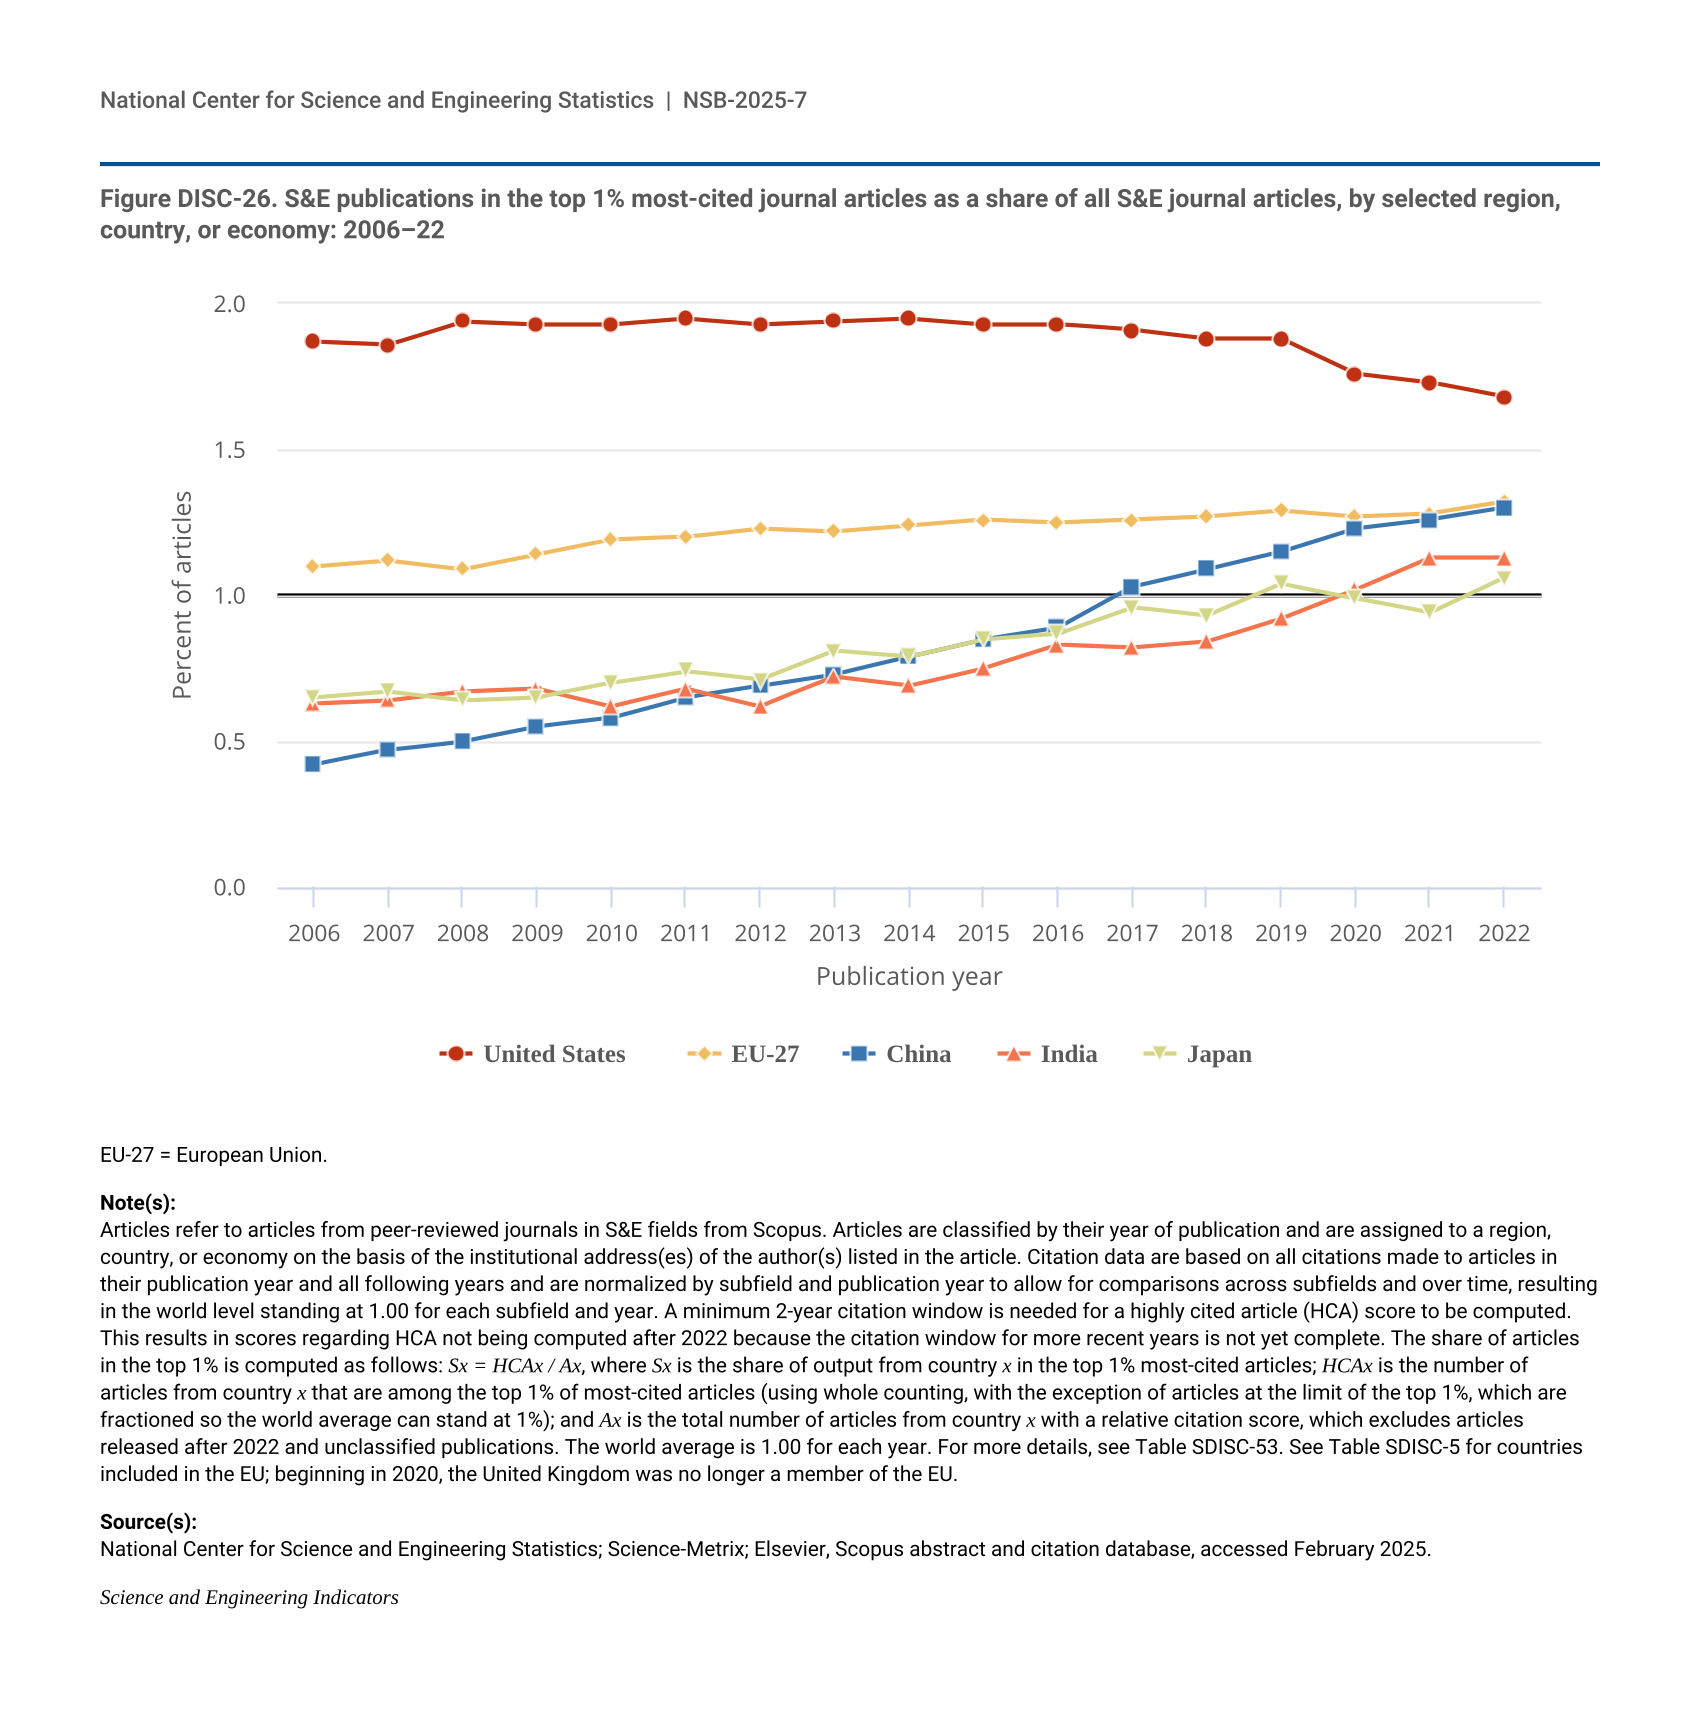
Articles in the top 1% of all published articles in a given year and field are designated as highly cited articles (HCAs). For each geographic location (region, country, or economy), the proportion of HCAs relative to its total publication output is called its HCA share, and this indicator of scientific impact relative to total publication is comparable across different-sized producers. An HCA share above 1.00 means that more than 1% of the country’s articles achieved HCA status, indicating that the country’s published research has disproportionately higher impact given the overall number of articles its researchers produce.
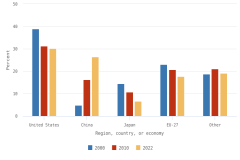
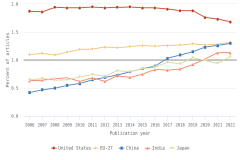
In 2022, 1.7% of peer-reviewed publications with U.S. authors were on the HCA list, showing that authors from the United States generate a disproportionate share of influential articles (Figure DISC-26). The HCA share for the United States had stayed above 1.9% in each year from 2008 through 2017 but has steadily declined since 2014. As of 2022, the U.S. HCA share stands at its lowest level throughout the period from 2006 to 2022. In contrast, China’s HCA share has increased in each year from 2006 to 2022, rising from 0.4% in 2006 to 1.3% in 2022 (Figure DISC-26). The disparity in HCA shares between the United States and China has decreased steadily since 2008. Given that China produced more scientific articles than the United States in 2022, this convergence appears to represent a consistent increase in the scientific impact of publications with Chinese authors that is not outpaced by its overall publication growth (Table SDISC-6). The collective HCA share for the EU-27 has stayed at or above 1.2% since 2011 (Figure DISC-26). The HCA share for Japan, another major contributor to the world’s scientific literature, has tended to lag behind the overall global HCA share. Japan’s HCA share reached its highest level (1.1%) in 2022. India’s HCA now exceeds the global HCA share, reaching 1.1% in 2022.
| Publication year | United States | EU-27 | China | India | Japan |
|---|---|---|---|---|---|
| 2006 | 1.87 | 1.10 | 0.42 | 0.63 | 0.65 |
| 2007 | 1.86 | 1.12 | 0.47 | 0.64 | 0.67 |
| 2008 | 1.94 | 1.09 | 0.50 | 0.67 | 0.64 |
| 2009 | 1.93 | 1.14 | 0.55 | 0.68 | 0.65 |
| 2010 | 1.93 | 1.19 | 0.58 | 0.62 | 0.70 |
| 2011 | 1.95 | 1.20 | 0.65 | 0.68 | 0.74 |
| 2012 | 1.93 | 1.23 | 0.69 | 0.62 | 0.71 |
| 2013 | 1.94 | 1.22 | 0.73 | 0.72 | 0.81 |
| 2014 | 1.95 | 1.24 | 0.79 | 0.69 | 0.79 |
| 2015 | 1.93 | 1.26 | 0.85 | 0.75 | 0.85 |
| 2016 | 1.93 | 1.25 | 0.89 | 0.83 | 0.87 |
| 2017 | 1.91 | 1.26 | 1.03 | 0.82 | 0.96 |
| 2018 | 1.88 | 1.27 | 1.09 | 0.84 | 0.93 |
| 2019 | 1.88 | 1.29 | 1.15 | 0.92 | 1.04 |
| 2020 | 1.76 | 1.27 | 1.23 | 1.02 | 0.99 |
| 2021 | 1.73 | 1.28 | 1.26 | 1.13 | 0.94 |
| 2022 | 1.68 | 1.32 | 1.30 | 1.13 | 1.06 |
EU-27 = European Union.
Articles refer to articles from peer-reviewed journals in S&E fields from Scopus. Articles are classified by their year of publication and are assigned to a region, country, or economy on the basis of the institutional address(es) of the author(s) listed in the article. Citation data are based on all citations made to articles in their publication year and all following years and are normalized by subfield and publication year to allow for comparisons across subfields and over time, resulting in the world level standing at 1.00 for each subfield and year. A minimum 2-year citation window is needed for a highly cited article (HCA) score to be computed. This results in scores regarding HCA not being computed after 2022 because the citation window for more recent years is not yet complete. The share of articles in the top 1% is computed as follows: Sx = HCAx / Ax, where Sx is the share of output from country x in the top 1% most-cited articles; HCAx is the number of articles from country x that are among the top 1% of most-cited articles (using whole counting, with the exception of articles at the limit of the top 1%, which are fractioned so the world average can stand at 1%); and Ax is the total number of articles from country x with a relative citation score, which excludes articles released after 2022 and unclassified publications. The world average is 1.00 for each year. For more details, see Table SDISC-53. See Table SDISC-5 for countries included in the EU; beginning in 2020, the United Kingdom was no longer a member of the EU.
National Center for Science and Engineering Statistics; Science-Metrix; Elsevier, Scopus abstract and citation database, accessed February 2025.
Science and Engineering Indicators
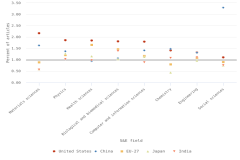
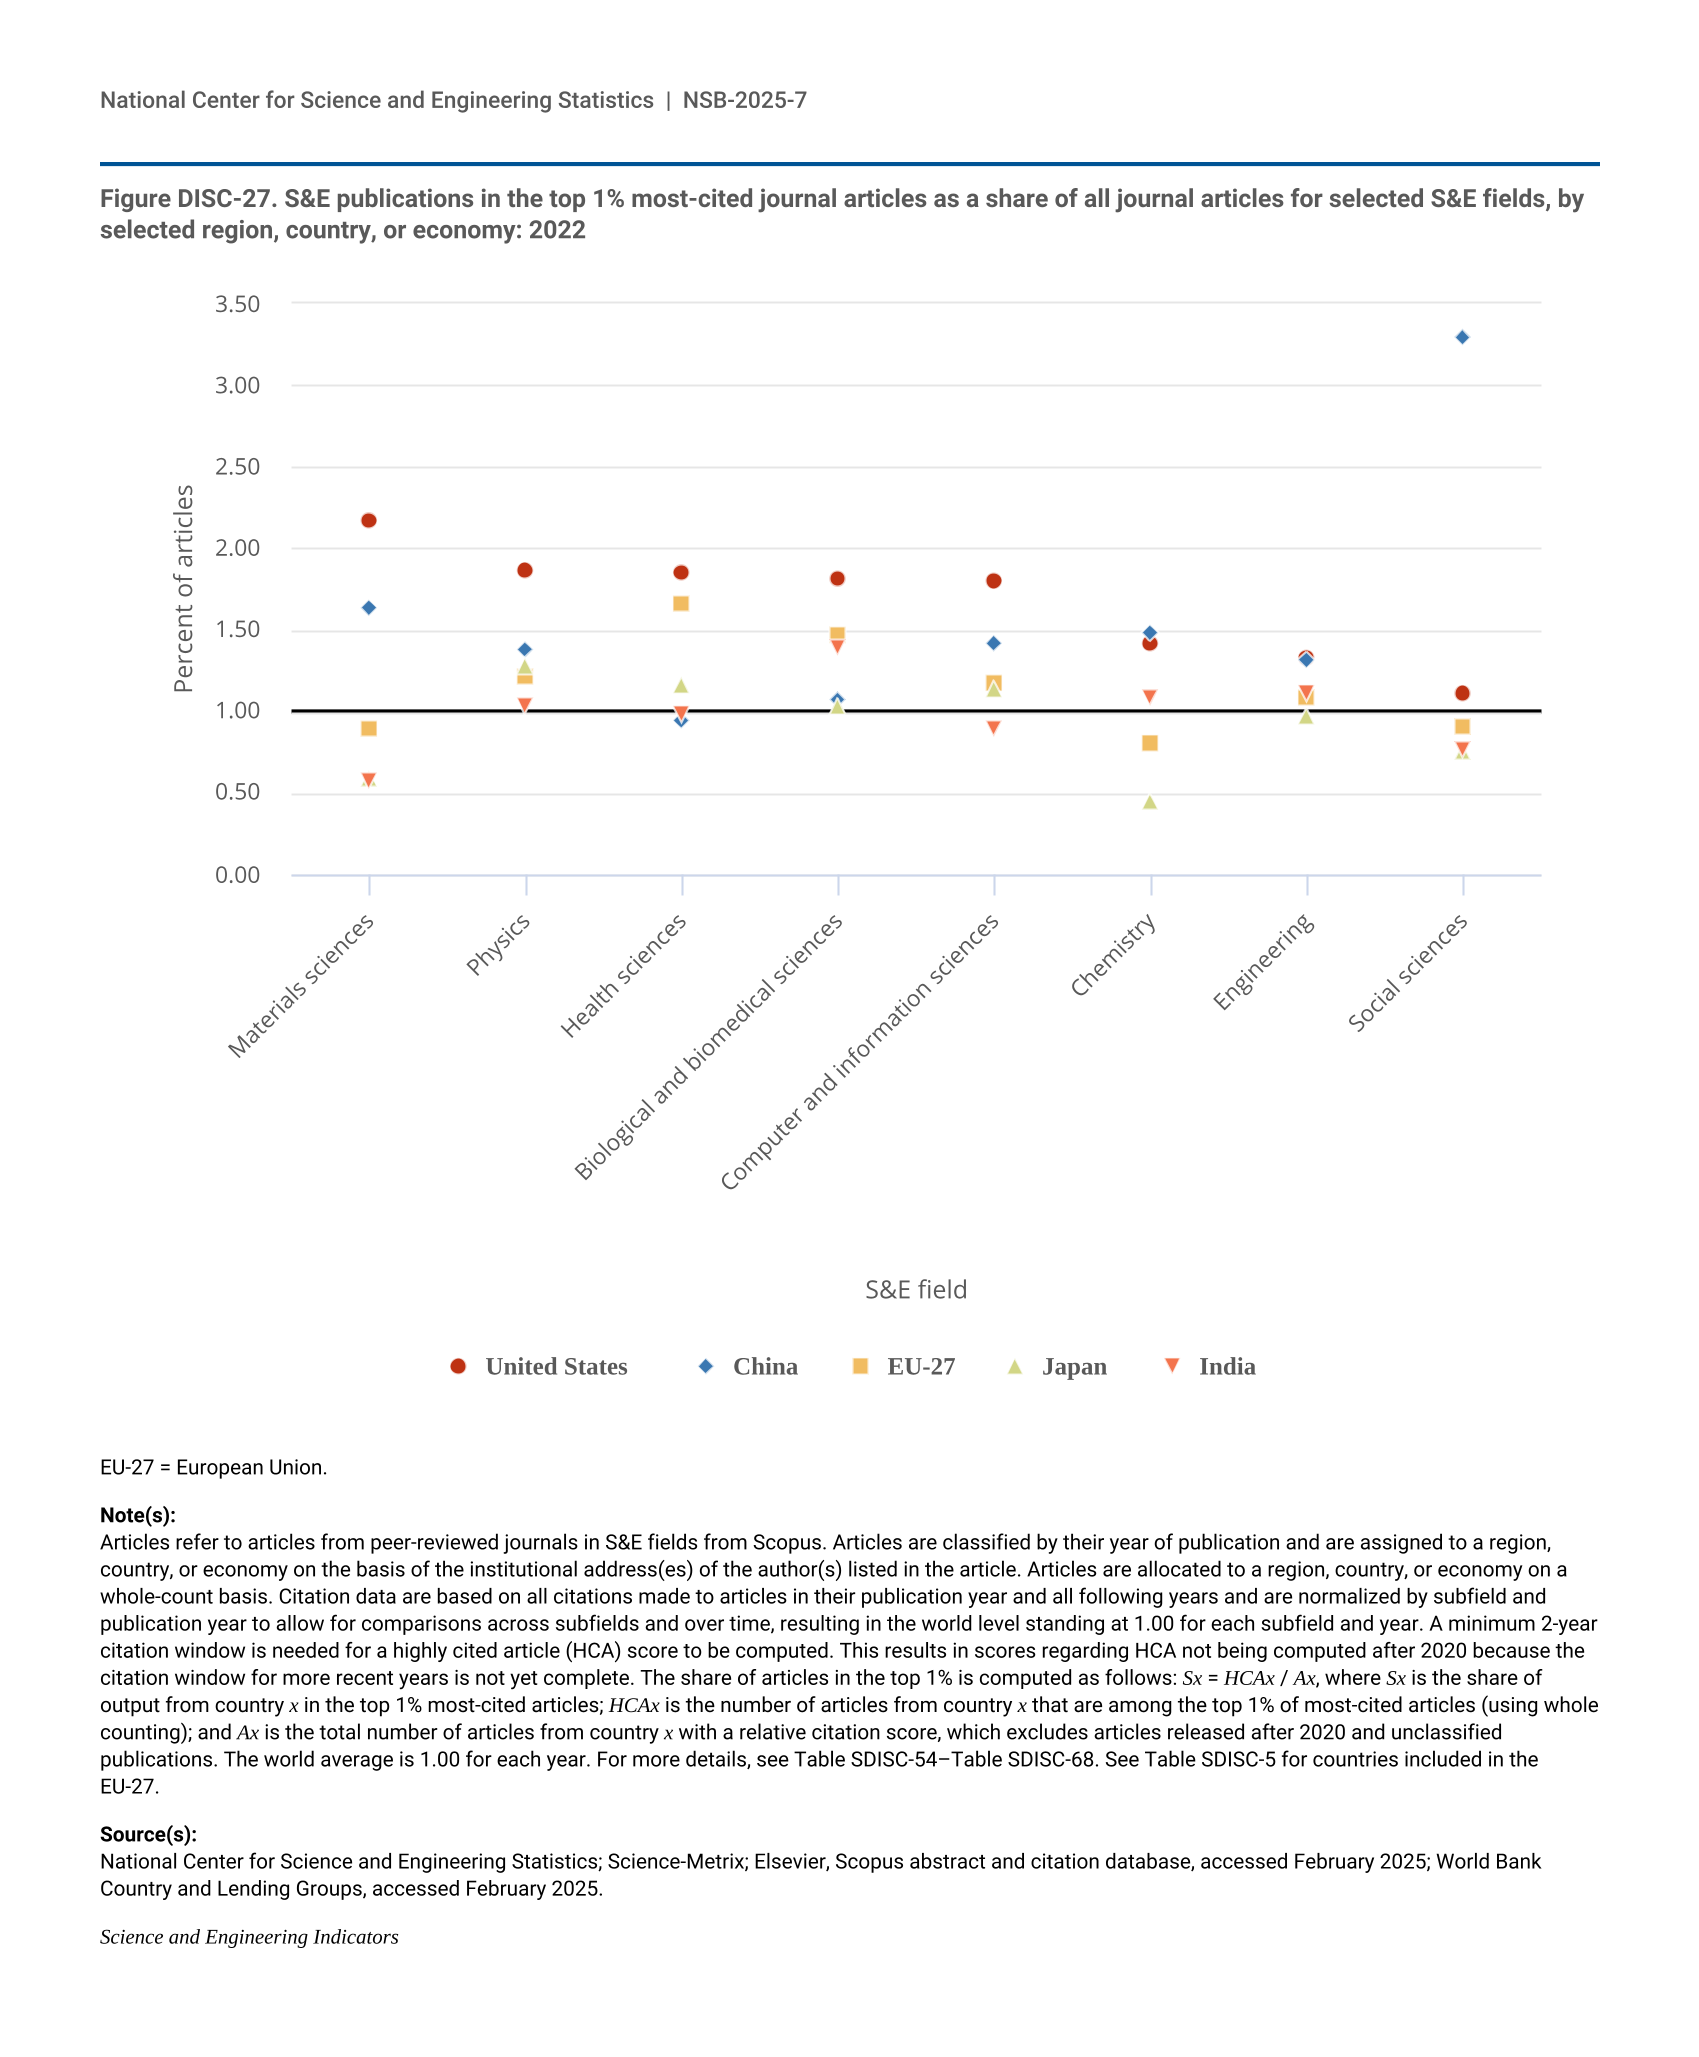
The HCA share of each country also varies between fields, reflecting research specializations or differences in the country’s prominence in particular research fields or topics. In the United States, the HCA shares of 2022 publications in all selected fields also exceeded the baseline 1% HCA share (Figure DISC-27). In particular, 2.2% of materials science, 1.9% of physics, 1.8% of health science, 1.8% of biological and biomedical sciences, and 1.8% of computer and information sciences publications authored in the United States were HCAs in those respective fields. Further, this was a higher HCA share in each of these fields compared to China, the EU-27, Japan, and India. The HCA shares of U.S.-authored publications in each selected field peaked between 2014 and 2019, whereas the HCA shares of publications by Chinese authors reached their highest level in 2020 or later (Table SDISC-53–Table SDISC-68). For HCAs in engineering, in 2022, the United States (1.3%) and China (1.3%) had similar shares of the top articles in that field. The HCA shares of chemistry publications in China (1.5%) and the United States (1.4%) were also close. In 2022, for authors based in China, the top scientific field by impact was the social sciences, in which 3.3% of social sciences publications were HCAs, which was higher than the social sciences HCA share for the United States, EU-27, Japan, and India.
| S&E field | United States | China | EU-27 | Japan | India |
|---|---|---|---|---|---|
| Materials sciences | 2.17 | 1.63 | 0.90 | 0.59 | 0.57 |
| Physics | 1.86 | 1.38 | 1.21 | 1.28 | 1.04 |
| Health sciences | 1.85 | 0.95 | 1.66 | 1.16 | 0.98 |
| Biological and biomedical sciences | 1.81 | 1.07 | 1.47 | 1.03 | 1.39 |
| Computer and information sciences | 1.80 | 1.42 | 1.17 | 1.14 | 0.89 |
| Chemistry | 1.42 | 1.48 | 0.81 | 0.45 | 1.09 |
| Engineering | 1.33 | 1.32 | 1.08 | 0.97 | 1.11 |
| Social sciences | 1.11 | 3.30 | 0.91 | 0.75 | 0.77 |
EU-27 = European Union.
Articles refer to articles from peer-reviewed journals in S&E fields from Scopus. Articles are classified by their year of publication and are assigned to a region, country, or economy on the basis of the institutional address(es) of the author(s) listed in the article. Articles are allocated to a region, country, or economy on a whole-count basis. Citation data are based on all citations made to articles in their publication year and all following years and are normalized by subfield and publication year to allow for comparisons across subfields and over time, resulting in the world level standing at 1.00 for each subfield and year. A minimum 2-year citation window is needed for a highly cited article (HCA) score to be computed. This results in scores regarding HCA not being computed after 2020 because the citation window for more recent years is not yet complete. The share of articles in the top 1% is computed as follows: Sx = HCAx / Ax, where Sx is the share of output from country x in the top 1% most-cited articles; HCAx is the number of articles from country x that are among the top 1% of most-cited articles (using whole counting); and Ax is the total number of articles from country x with a relative citation score, which excludes articles released after 2020 and unclassified publications. The world average is 1.00 for each year. For more details, see Table SDISC-54–Table SDISC-68. See Table SDISC-5 for countries included in the EU-27.
National Center for Science and Engineering Statistics; Science-Metrix; Elsevier, Scopus abstract and citation database, accessed February 2025; World Bank Country and Lending Groups, accessed February 2025.
Science and Engineering Indicators
International Collaboration in Published Research
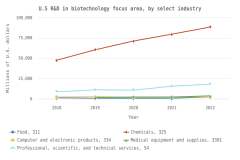
International collaborations can build a robust S&E workforce, increase scientific capabilities and cooperation (Lyons et al. 2016), including in emerging and critical technologies (see sidebar Biotechnology R&D and Publications Output, and see sidebar Semiconductor Research Publication Output and International Collaboration at the end of this section). An article is classified as an international collaboration if at least two authors are located in different countries, as determined by their organizational affiliation on the article. Researchers may collaborate for several reasons, including to develop a scientific relationship with another researcher or to gain access to costly or shared equipment. They may also work together to meet conditions attached to research funding that require international collaboration (Wagner 2018). S&E research has become more global—a trend evidenced cross-nationally (Glänzel and Schubert 2005; Luukkonen et al. 1993; Royal Society 2011; Wagner, Park, and Leydesdorff 2015).
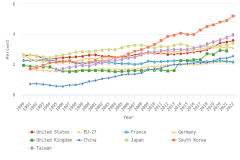
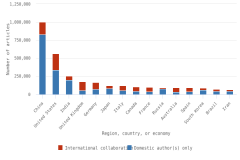
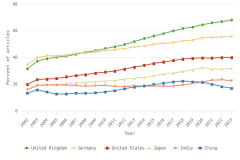
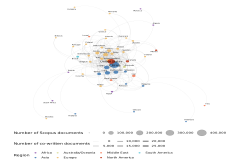
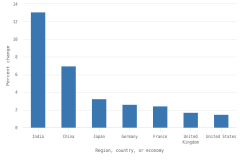
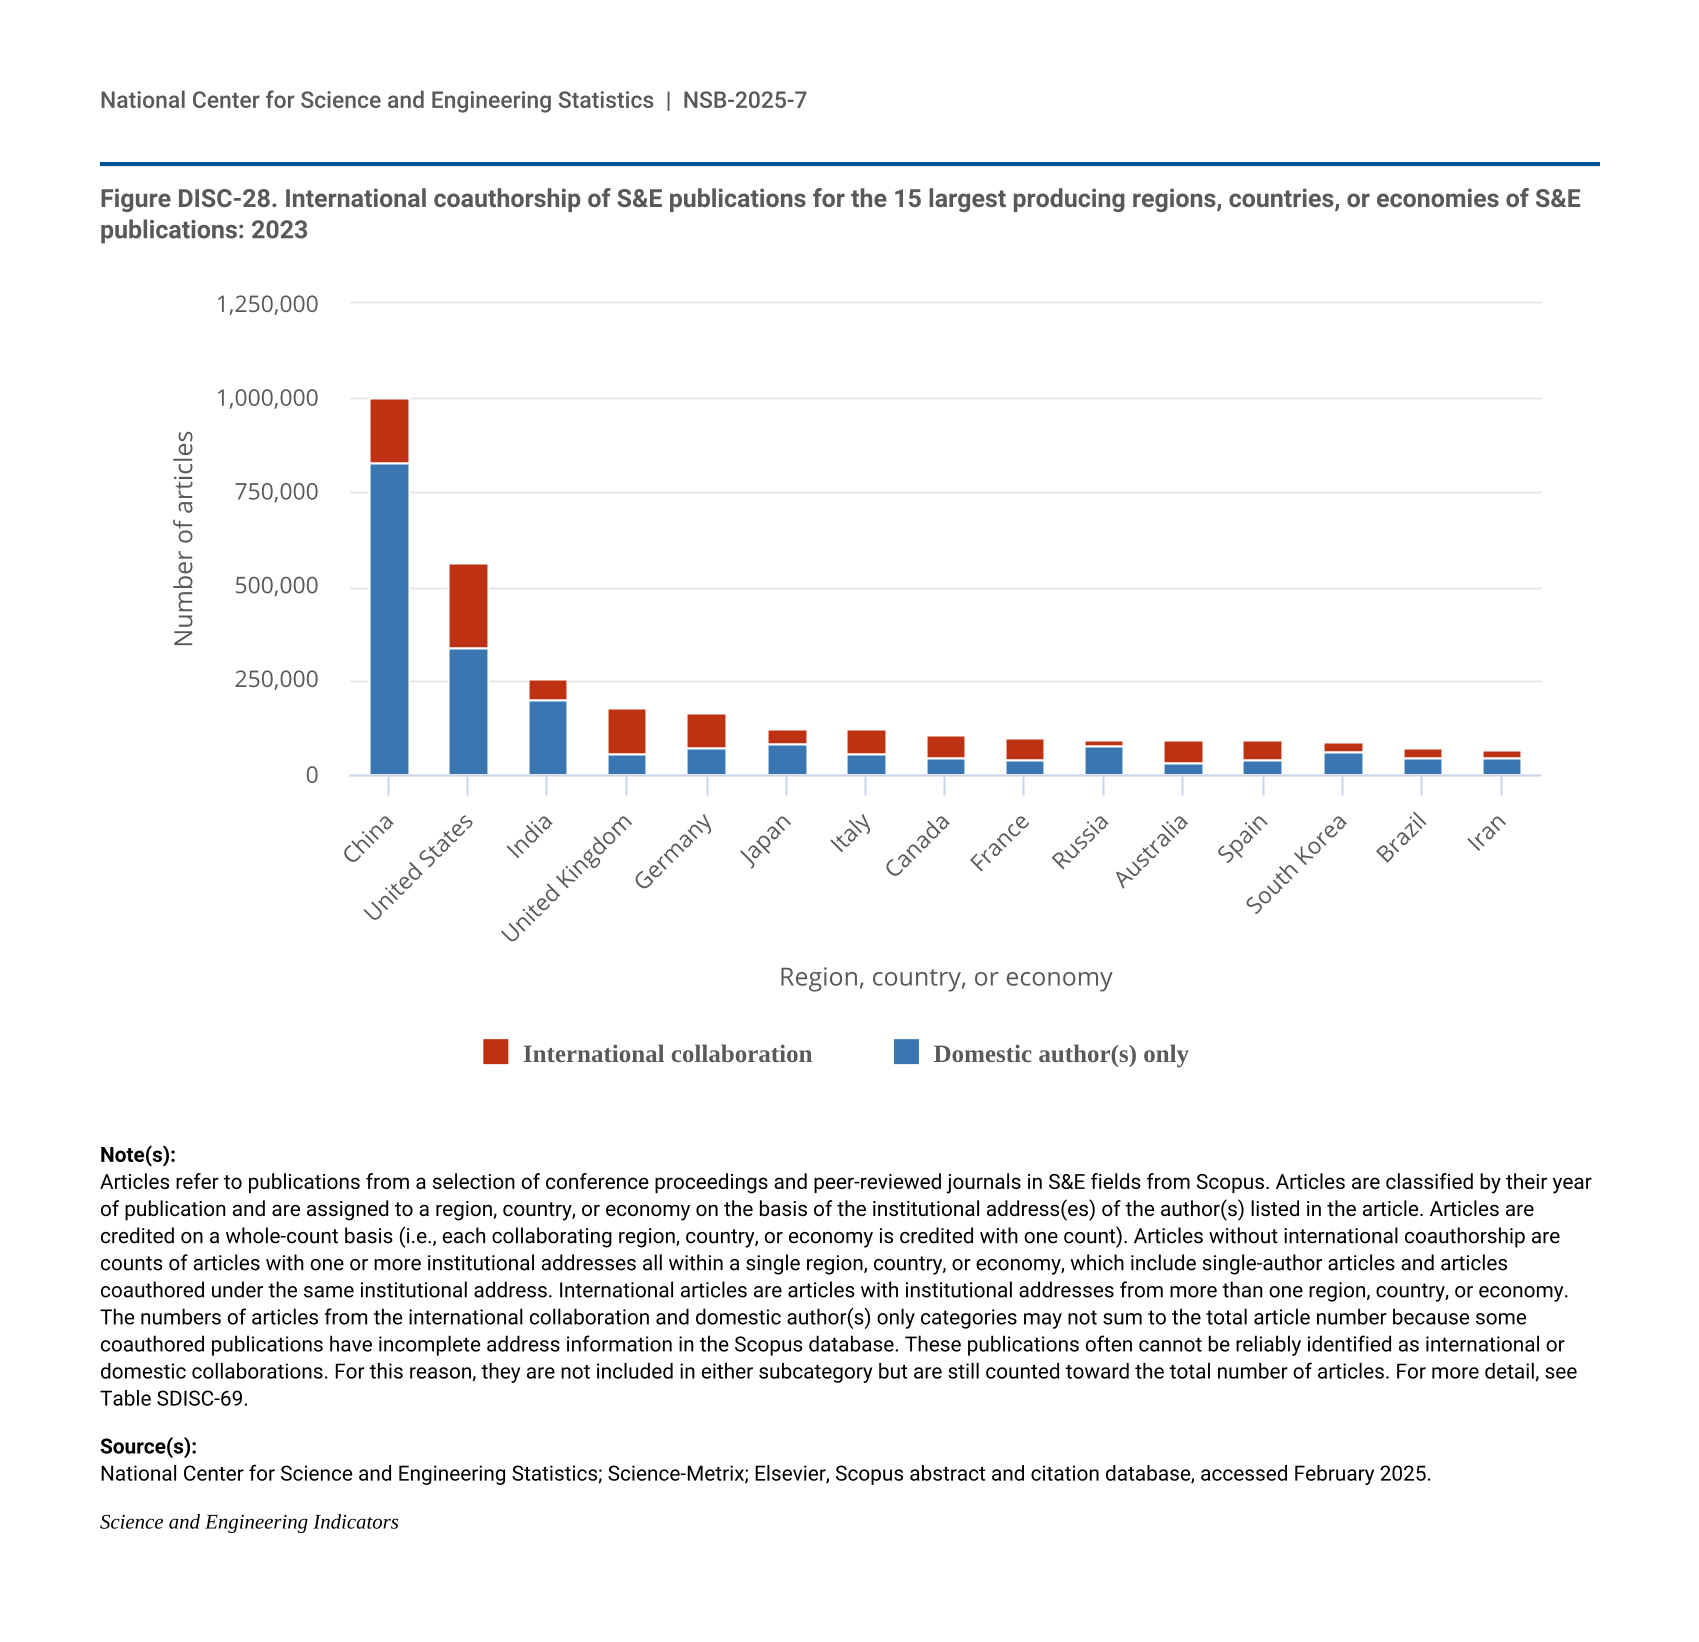
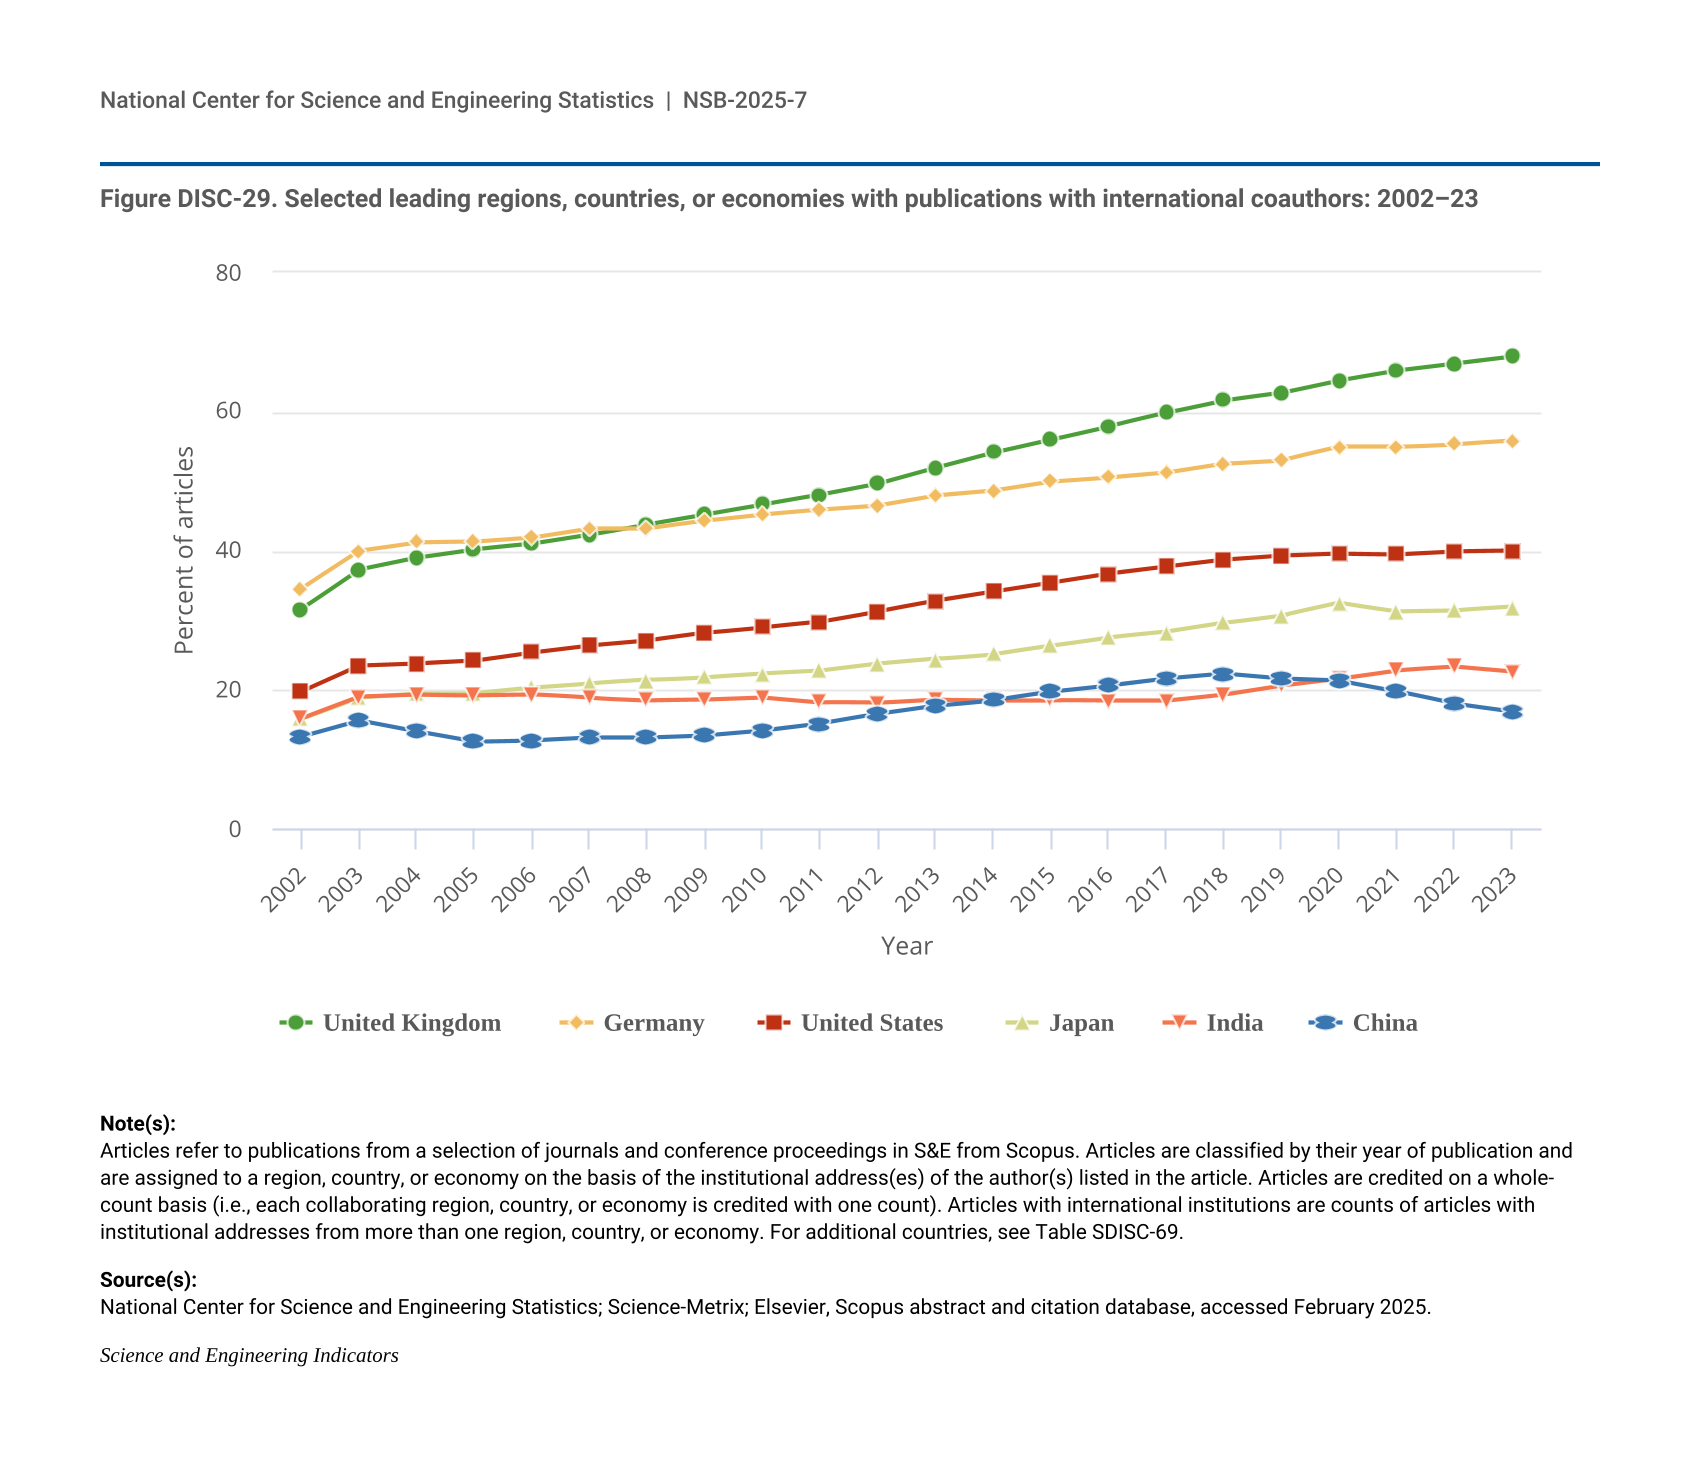
In 2023, researchers in the United States contributed to the largest number of articles involving international coauthorship (225,565 articles, representing 32% of all internationally coauthored articles) (Figure DISC-28; Table SDISC-69). The most frequent partners for the United States were China, the United Kingdom, Canada, and Germany (Table SDISC-71). Elsewhere, the percentage of worldwide S&E articles produced with international collaboration has grown over time, increasing from 19% in 2012 to 22% in 2023 (Table SDISC-69). Each region, country, or economy leading in publications showed increases in international collaboration rates (Figure DISC-29). United Kingdom researchers had international coauthors on 32% of their articles in 2002 and on 68% of their articles in 2023. Similarly, Germany’s international collaboration rate increased from 35% to 56% over the same period. The United States and Japan both saw notable increases in international collaborations between 2003 and 2022 (from 20% to 40% and from 16% to 32%, respectively), whereas there were smaller increases for India (from 16% to 23%) and China (from 13% to 17%). China is the only selected country that shows a decrease in international collaboration since its peak in 2018 (22%).
| Region, country, or economy | Domestic author(s) only | International collaboration |
|---|---|---|
| China | 830,338 | 168,887 |
| United States | 338,645 | 225,565 |
| India | 198,664 | 58,050 |
| United Kingdom | 57,490 | 121,383 |
| Germany | 73,961 | 93,351 |
| Japan | 81,452 | 38,221 |
| Italy | 57,819 | 61,201 |
| Canada | 41,923 | 62,544 |
| France | 39,928 | 62,019 |
| Russia | 77,285 | 18,735 |
| Australia | 34,195 | 59,438 |
| Spain | 41,201 | 51,899 |
| South Korea | 59,140 | 30,321 |
| Brazil | 44,493 | 28,018 |
| Iran | 42,996 | 22,215 |
Articles refer to publications from a selection of conference proceedings and peer-reviewed journals in S&E fields from Scopus. Articles are classified by their year of publication and are assigned to a region, country, or economy on the basis of the institutional address(es) of the author(s) listed in the article. Articles are credited on a whole-count basis (i.e., each collaborating region, country, or economy is credited with one count). Articles without international coauthorship are counts of articles with one or more institutional addresses all within a single region, country, or economy, which include single-author articles and articles coauthored under the same institutional address. International articles are articles with institutional addresses from more than one region, country, or economy. The numbers of articles from the international collaboration and domestic author(s) only categories may not sum to the total article number because some coauthored publications have incomplete address information in the Scopus database. These publications often cannot be reliably identified as international or domestic collaborations. For this reason, they are not included in either subcategory but are still counted toward the total number of articles. For more detail, see Table SDISC-69.
National Center for Science and Engineering Statistics; Science-Metrix; Elsevier, Scopus abstract and citation database, accessed February 2025.
Science and Engineering Indicators
| Year | United Kingdom | Germany | United States | Japan | India | China |
|---|---|---|---|---|---|---|
| 2002 | 31.6 | 34.6 | 19.8 | 15.8 | 15.9 | 13.3 |
| 2003 | 37.3 | 40.0 | 23.5 | 18.9 | 19.0 | 15.6 |
| 2004 | 39.0 | 41.2 | 23.8 | 19.5 | 19.3 | 14.0 |
| 2005 | 40.2 | 41.3 | 24.2 | 19.5 | 19.2 | 12.5 |
| 2006 | 41.0 | 41.9 | 25.4 | 20.3 | 19.3 | 12.7 |
| 2007 | 42.3 | 43.2 | 26.4 | 20.9 | 18.8 | 13.1 |
| 2008 | 43.8 | 43.2 | 27.1 | 21.4 | 18.5 | 13.1 |
| 2009 | 45.2 | 44.3 | 28.2 | 21.8 | 18.6 | 13.4 |
| 2010 | 46.6 | 45.2 | 29.0 | 22.3 | 18.9 | 14.1 |
| 2011 | 48.0 | 45.9 | 29.8 | 22.7 | 18.2 | 15.1 |
| 2012 | 49.6 | 46.5 | 31.3 | 23.7 | 18.1 | 16.5 |
| 2013 | 51.9 | 47.9 | 32.8 | 24.4 | 18.6 | 17.7 |
| 2014 | 54.1 | 48.6 | 34.1 | 25.1 | 18.5 | 18.5 |
| 2015 | 56.0 | 49.9 | 35.4 | 26.3 | 18.5 | 19.7 |
| 2016 | 57.9 | 50.5 | 36.7 | 27.5 | 18.4 | 20.6 |
| 2017 | 59.8 | 51.2 | 37.7 | 28.3 | 18.4 | 21.6 |
| 2018 | 61.6 | 52.5 | 38.7 | 29.6 | 19.3 | 22.3 |
| 2019 | 62.7 | 53.0 | 39.3 | 30.7 | 20.6 | 21.6 |
| 2020 | 64.5 | 54.9 | 39.6 | 32.5 | 21.6 | 21.3 |
| 2021 | 65.9 | 54.9 | 39.5 | 31.3 | 22.8 | 19.8 |
| 2022 | 66.9 | 55.3 | 39.9 | 31.4 | 23.3 | 18.0 |
| 2023 | 67.9 | 55.8 | 40.0 | 31.9 | 22.6 | 16.9 |
Articles refer to publications from a selection of journals and conference proceedings in S&E from Scopus. Articles are classified by their year of publication and are assigned to a region, country, or economy on the basis of the institutional address(es) of the author(s) listed in the article. Articles are credited on a whole-count basis (i.e., each collaborating region, country, or economy is credited with one count). Articles with international institutions are counts of articles with institutional addresses from more than one region, country, or economy. For additional countries, see Table SDISC-69.
National Center for Science and Engineering Statistics; Science-Metrix; Elsevier, Scopus abstract and citation database, accessed February 2025.
Science and Engineering Indicators
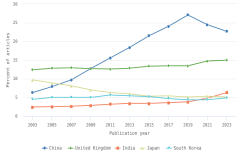
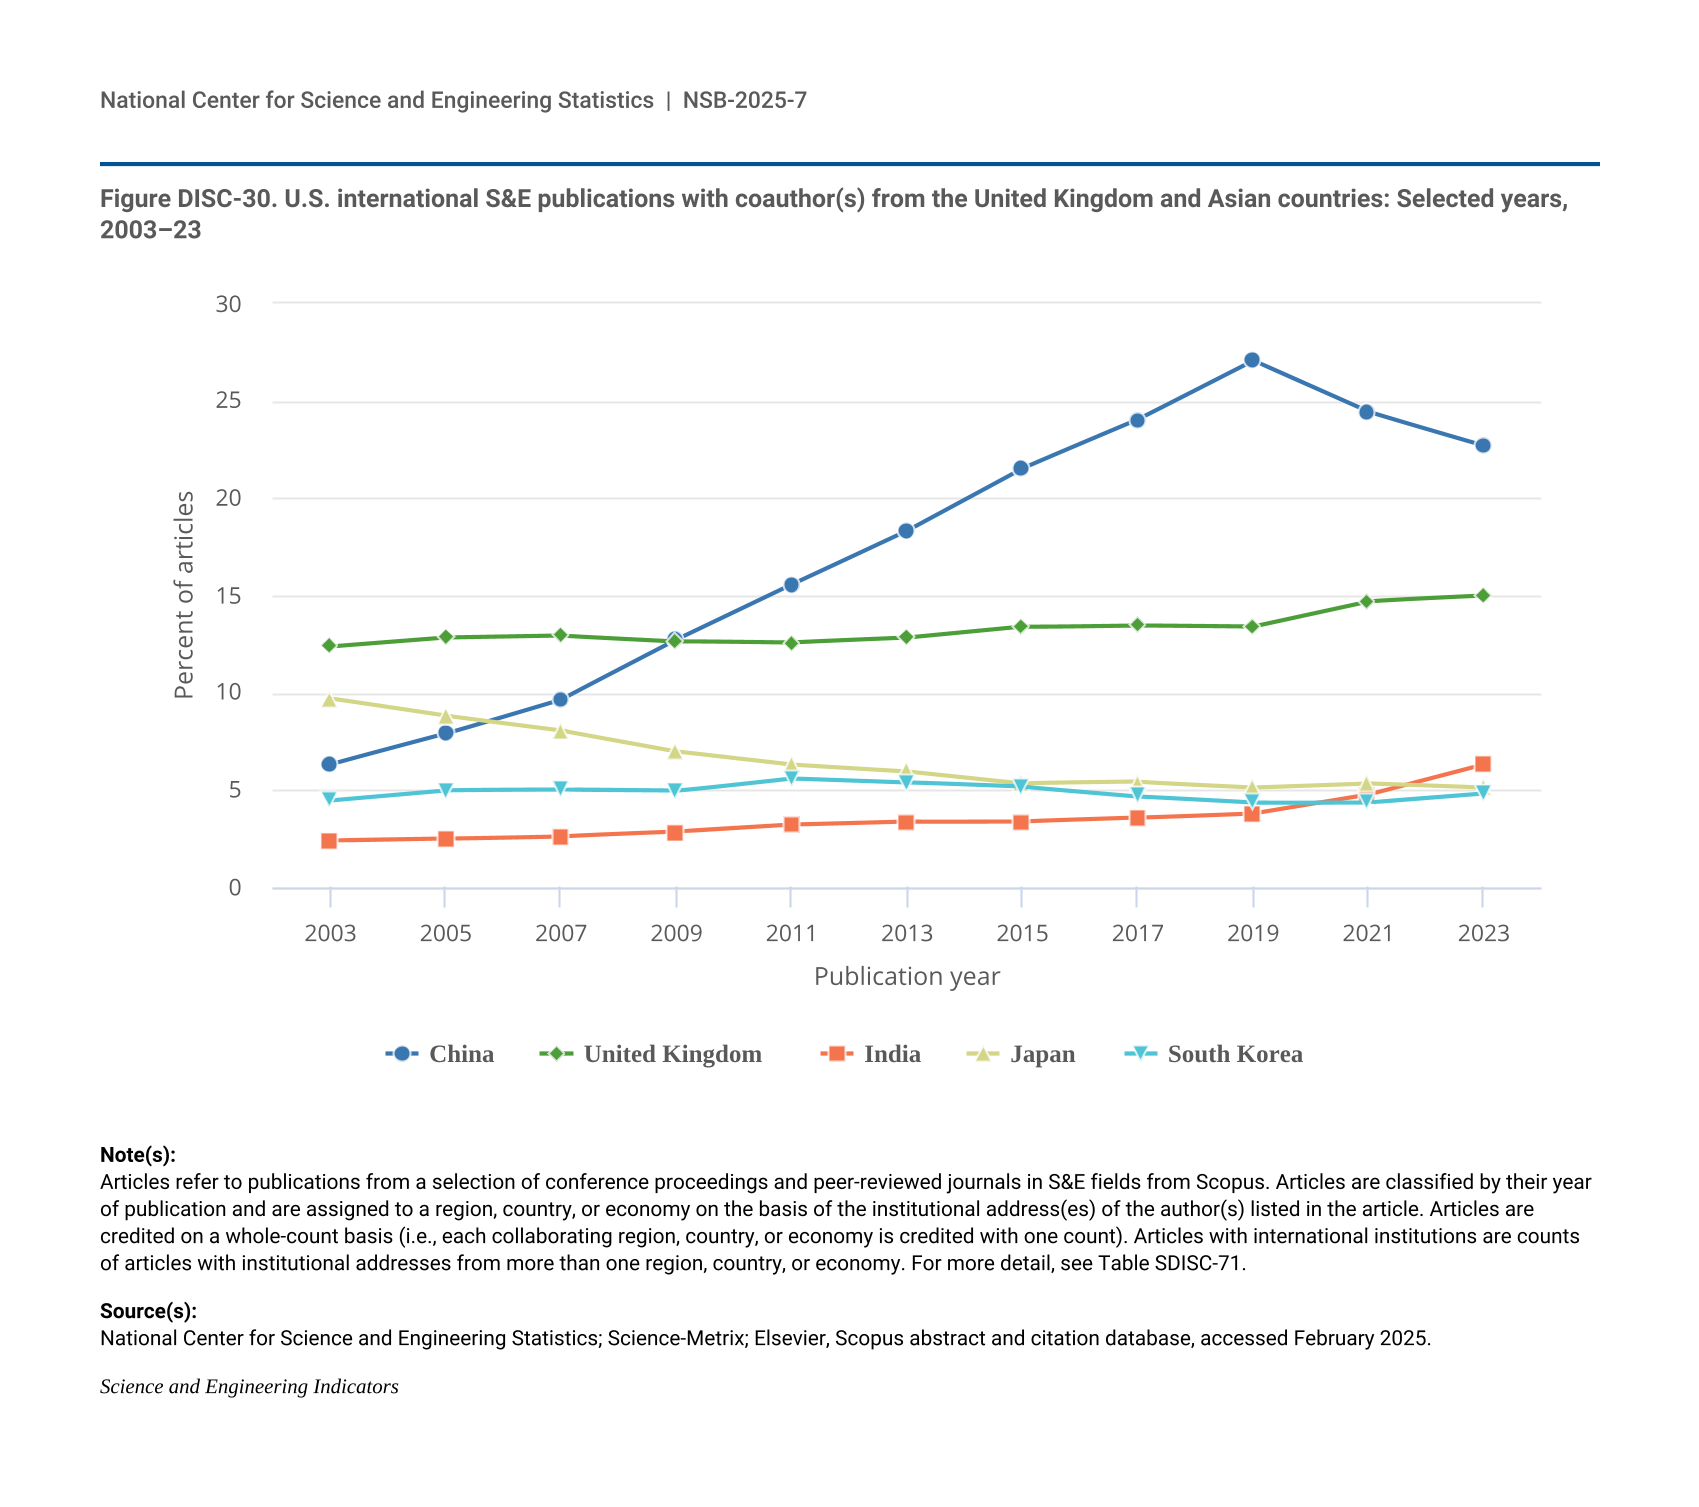
Over time, the top countries with authors collaborating with U.S. researchers have changed. In 2003, partnerships with authors in the United Kingdom accounted for 12% of articles coauthored with U.S. collaborators—the highest percentage of any partner region, country, or economy (Figure DISC-30; Table SDISC-71). By 2009, China had overtaken the United Kingdom as the origin of the greatest percentage of coauthors with U.S. researchers and has remained in first place since that time. The increasing share of global publications from authors in China over the same period may have contributed to this increase in collaboration. In 2023, 23% of internationally coauthored U.S. articles have a Chinese coauthor, although this represents a decline from 27% in 2019. Meanwhile, the percentage of U.S. internationally coauthored articles with the United Kingdom increased slightly over this period to 15% in 2023. Since 2019, authors from India (from 4% to 6%) passed those from Japan (steady at 5%) and South Korea (from 4% to 5%) in collaborations with U.S. partners.
| Publication year | China | United Kingdom | India | Japan | South Korea |
|---|---|---|---|---|---|
| 2003 | 6.31 | 12.38 | 2.38 | 9.69 | 4.46 |
| 2005 | 7.88 | 12.84 | 2.48 | 8.80 | 4.97 |
| 2007 | 9.65 | 12.94 | 2.60 | 8.05 | 4.99 |
| 2009 | 12.72 | 12.65 | 2.83 | 6.98 | 4.94 |
| 2011 | 15.56 | 12.57 | 3.19 | 6.30 | 5.60 |
| 2013 | 18.33 | 12.81 | 3.35 | 5.95 | 5.39 |
| 2015 | 21.53 | 13.38 | 3.37 | 5.33 | 5.16 |
| 2017 | 24.03 | 13.47 | 3.56 | 5.40 | 4.67 |
| 2019 | 27.06 | 13.41 | 3.79 | 5.13 | 4.35 |
| 2021 | 24.43 | 14.70 | 4.76 | 5.34 | 4.37 |
| 2023 | 22.71 | 14.97 | 6.31 | 5.12 | 4.83 |
Articles refer to publications from a selection of conference proceedings and peer-reviewed journals in S&E fields from Scopus. Articles are classified by their year of publication and are assigned to a region, country, or economy on the basis of the institutional address(es) of the author(s) listed in the article. Articles are credited on a whole-count basis (i.e., each collaborating region, country, or economy is credited with one count). Articles with international institutions are counts of articles with institutional addresses from more than one region, country, or economy. For more detail, see Table SDISC-71.
National Center for Science and Engineering Statistics; Science-Metrix; Elsevier, Scopus abstract and citation database, accessed February 2025.
Science and Engineering Indicators