 An official website of the United States government
 Global R&D and International Comparisons
R&D underpins competitiveness and national security and also contributes to addressing global challenges such as public health, energy, the environment, and the development and deployment of critical technologies (CRS 2023a, 2023b, 2024; CSIS 2021; OECD 2023; USCC 2024). The global total for R&D expenditures in 2022 was $3.1 trillion in current U.S. purchasing power parity (PPP) dollars, based on all 38 OECD members plus another 9 regions, countries, or economies available in the OECD R&D database (Argentina, Bulgaria, China, Croatia, Romania, Russia, Singapore, South Africa, and Taiwan) (Table SDISC-3).
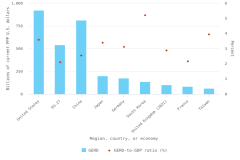
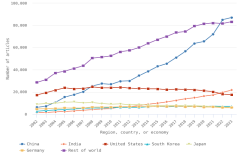
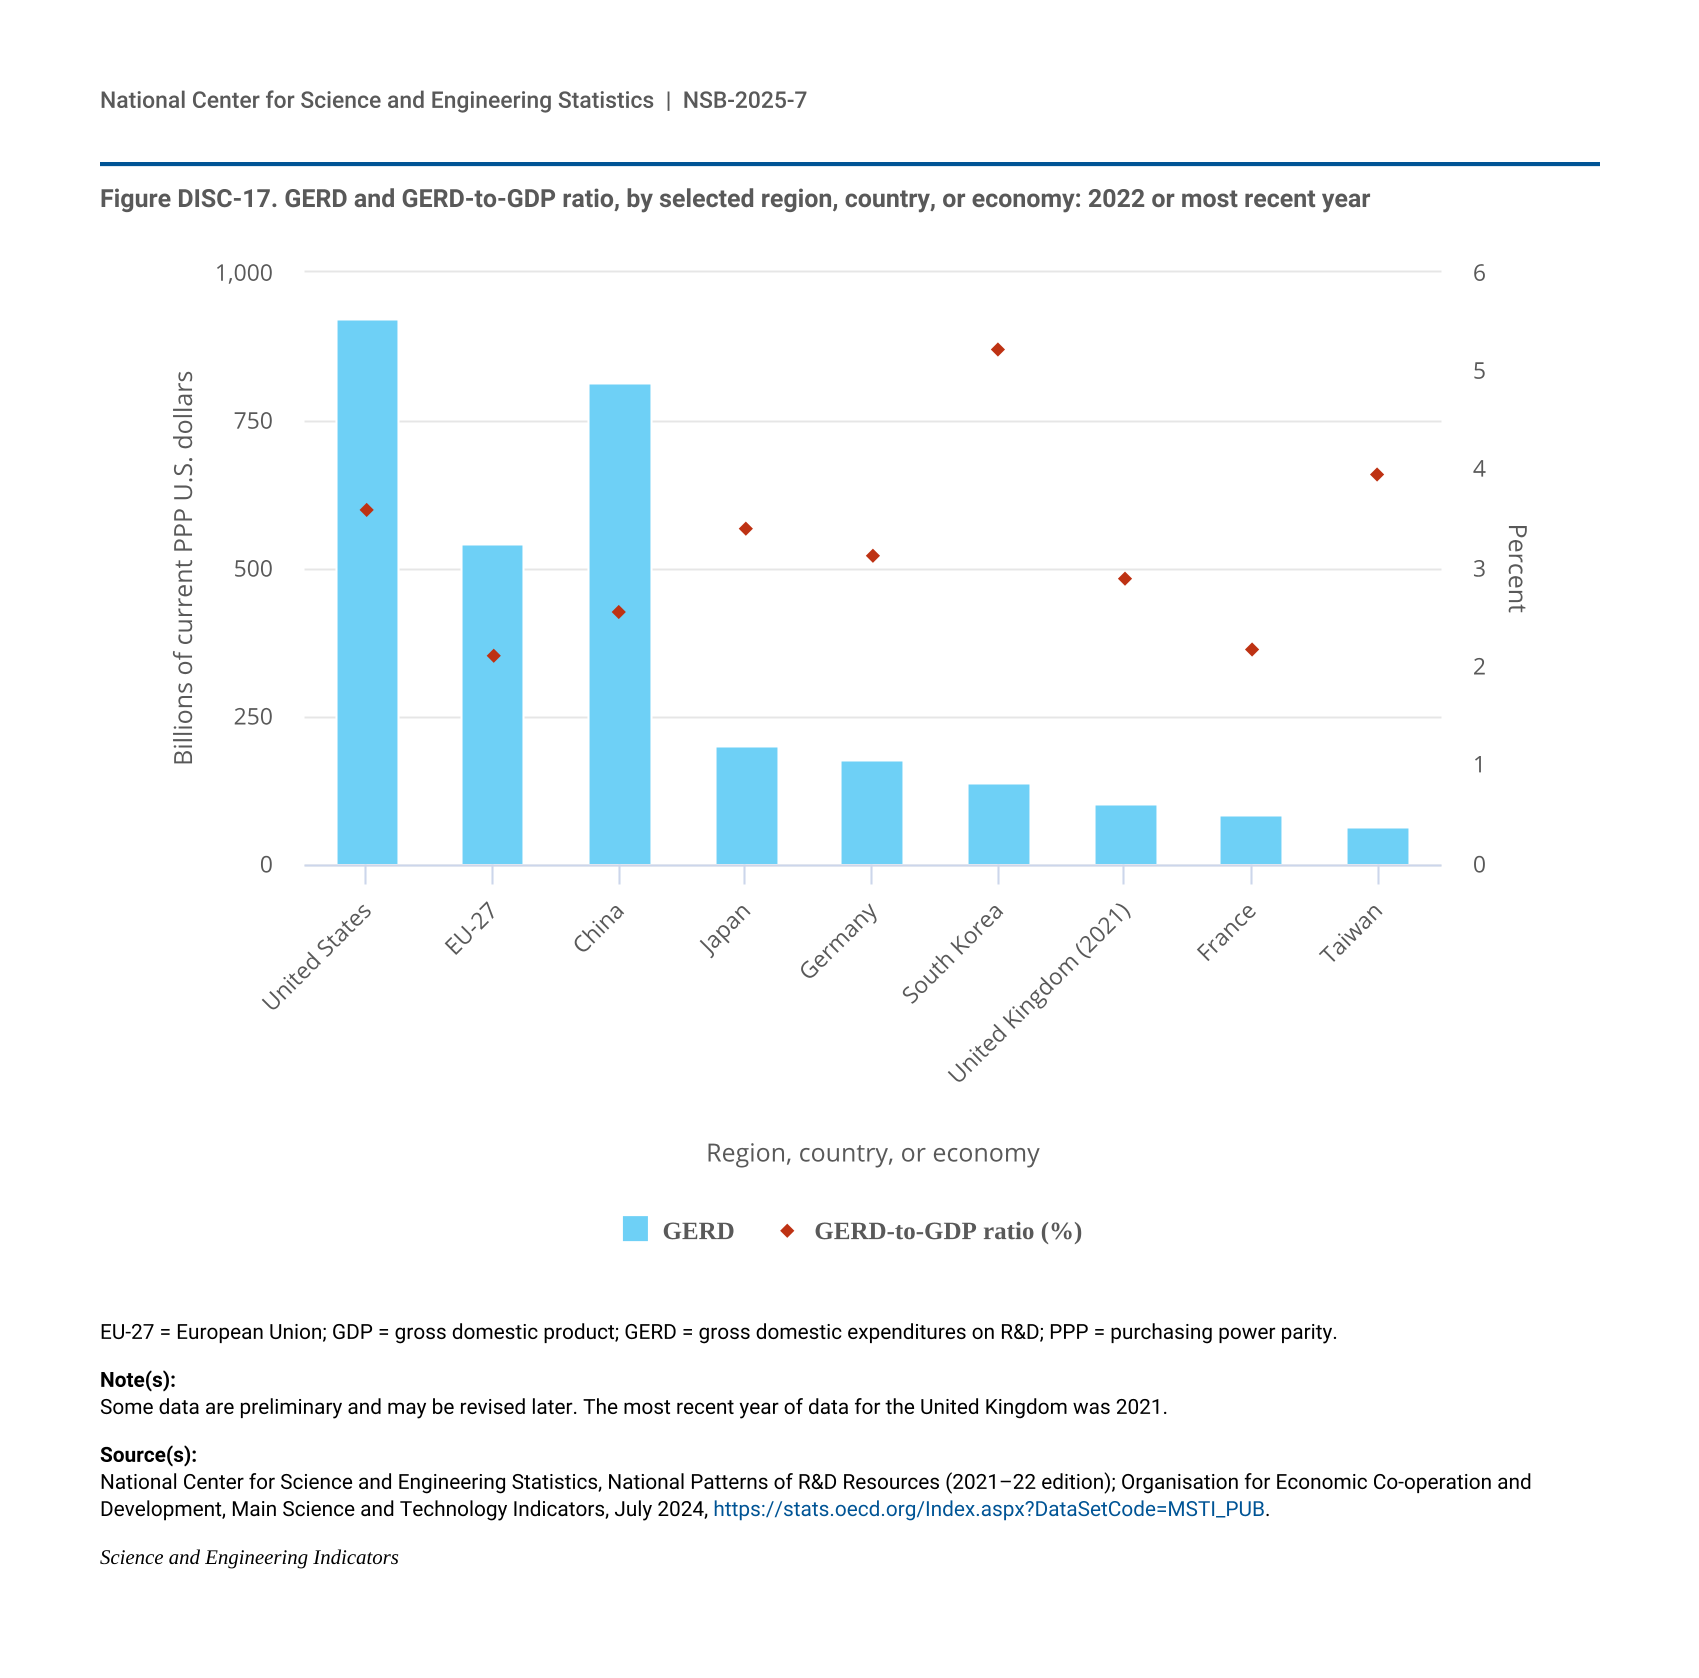
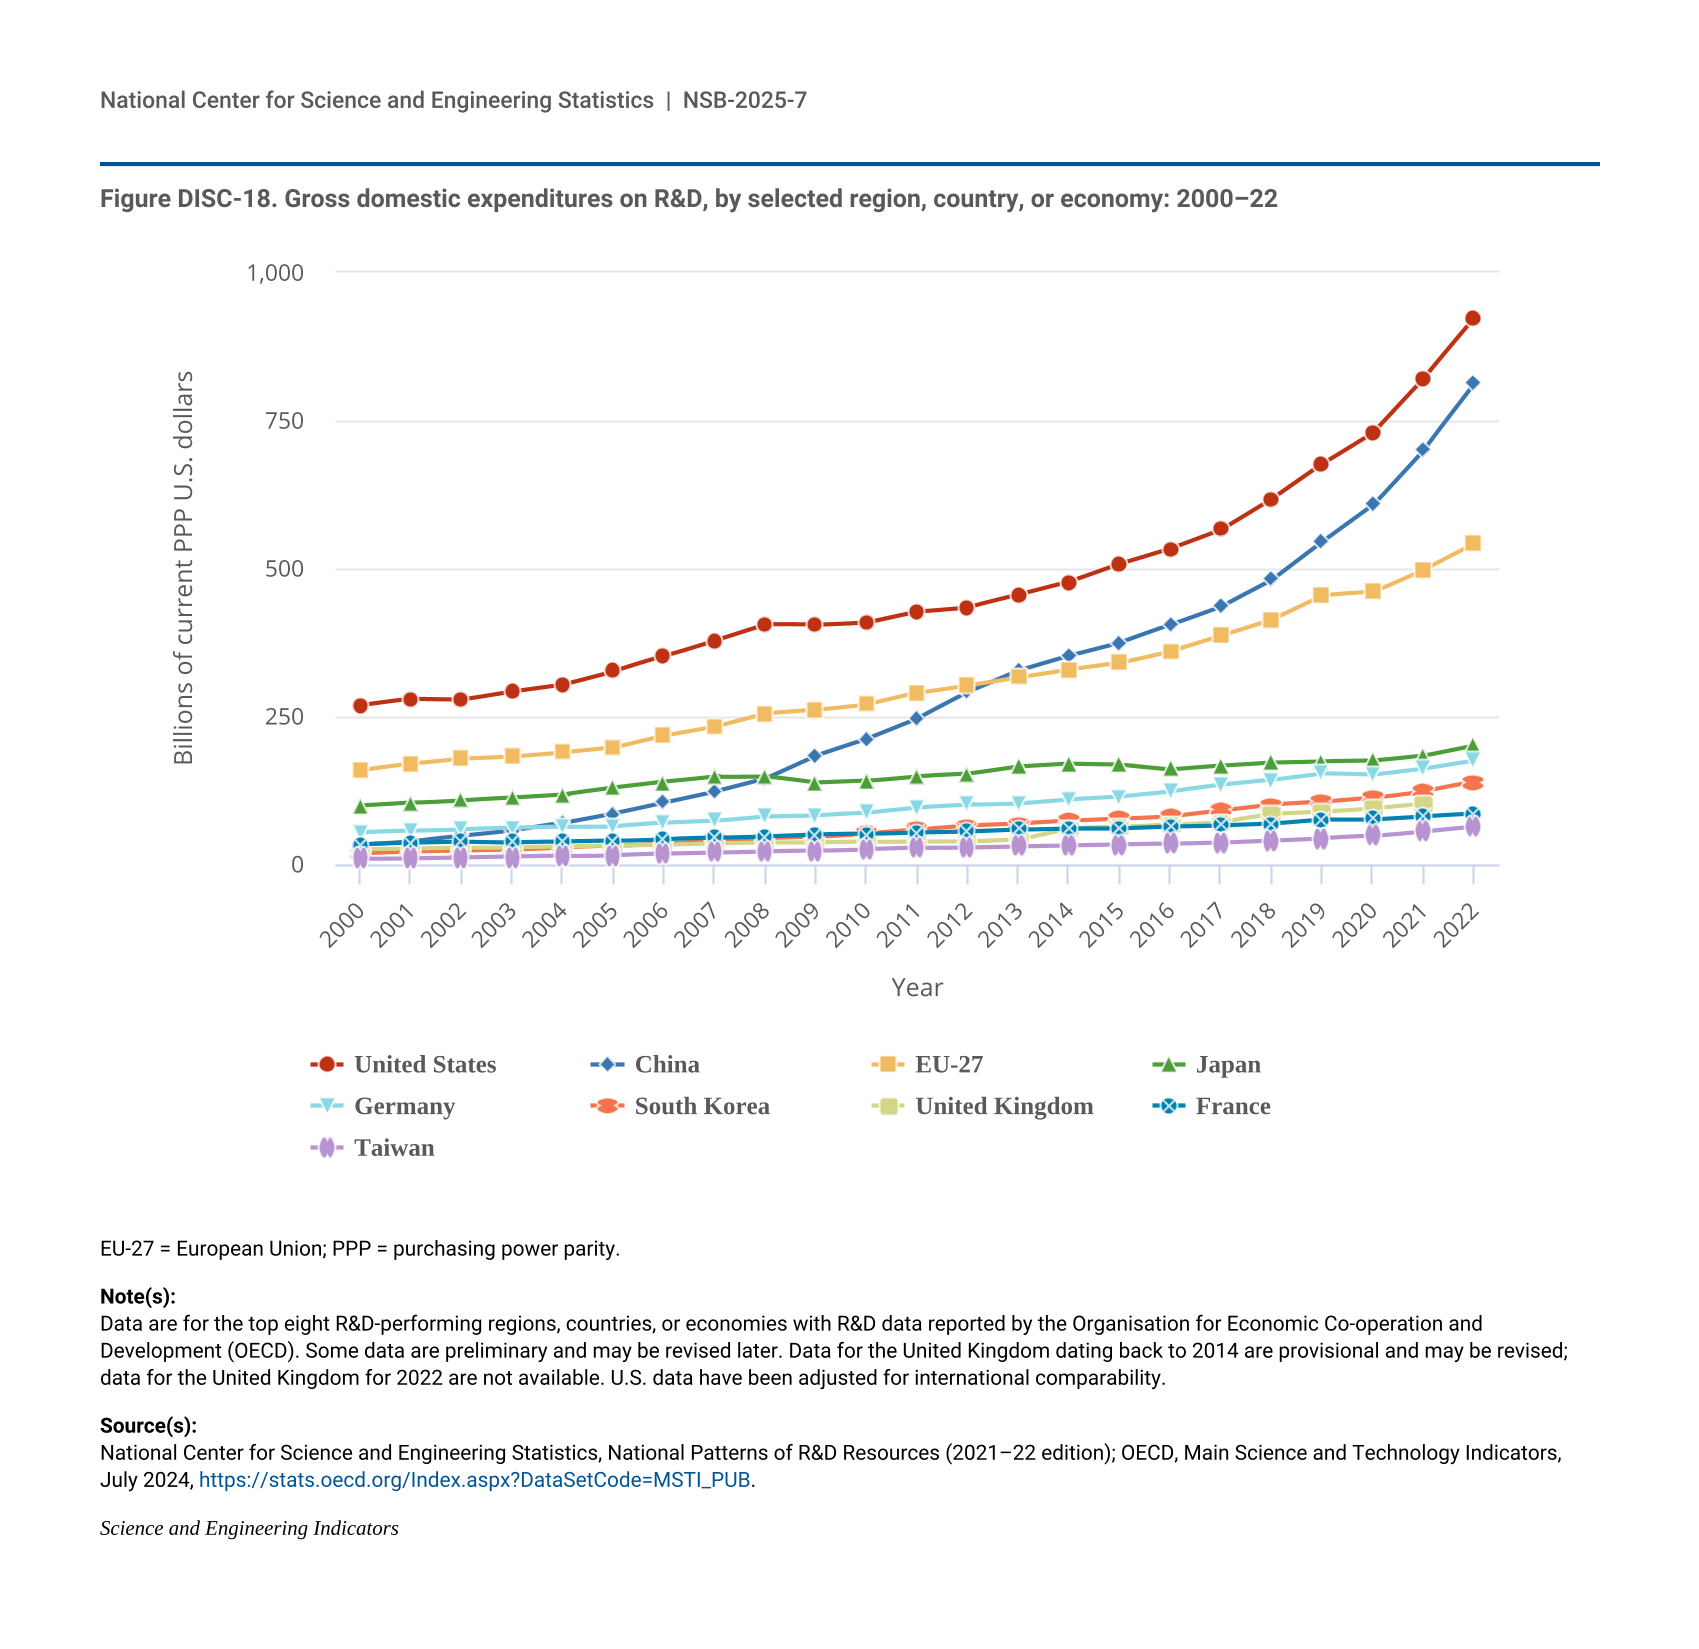
The top 8 individual R&D-performing regions, countries, or economies accounted for 82% of global R&D expenditures in 2022, with the United States (30%) and China (27%) accounting for over half (Figure DISC-17; Table DISC-10; Table SDISC-3). As a region, the European Union (EU-27) accounted for 18% of global R&D expenditures. Adjusted for international comparability, the United States had $923.2 billion in gross domestic expenditures on R&D (GERD) in 2022 ($761.6 billion in constant 2015 U.S. PPP-converted dollars), up 12% from 2021 (5% in constant PPP dollars). China, the second-highest performer of domestic R&D, reached $811.9 billion in 2022 ($686.7 billion in constant PPPs in U.S. dollars), up 16% from 2021 (8% in constant PPPs) (OECD 2024d). Japan ($200.8 billion), Germany ($174.9 billion), South Korea ($139.0 billion), the United Kingdom ($102.6 billion), France ($85.2 billion), and Taiwan ($64.0 billion) round up the top 8 individual R&D-performing regions, countries, or economies in current U.S. PPP dollars, based on OECD statistics (Figure DISC-17, Figure DISC-18; Table SDISC-3).
| Region, country, or economy | GERD | GERD-to-GDP ratio (%) |
|---|---|---|
| United States | 923.24 | 3.59 |
| EU-27 | 542.12 | 2.11 |
| China | 811.86 | 2.56 |
| Japan | 200.77 | 3.41 |
| Germany | 174.86 | 3.13 |
| South Korea | 139.00 | 5.21 |
| United Kingdom (2021) | 102.61 | 2.90 |
| France | 85.17 | 2.18 |
| Taiwan | 63.97 | 3.96 |
EU-27 = European Union; GDP = gross domestic product; GERD = gross domestic expenditures on R&D; PPP = purchasing power parity.
Some data are preliminary and may be revised later. The most recent year of data for the United Kingdom was 2021.
National Center for Science and Engineering Statistics, National Patterns of R&D Resources (2021–22 edition); Organisation for Economic Co-operation and Development, Main Science and Technology Indicators, July 2024, https://stats.oecd.org/Index.aspx?DataSetCode=MSTI_PUB.
Science and Engineering Indicators
NA = not available.
CAGR = compound annual growth rate; GDP = gross domestic product; GERD = gross domestic expenditures on R&D; PPP = purchasing power parity.
The most recent year of GERD data for the United Kingdom was 2021. The most recent year of GERD data for Russia was 2020. Data for U.S. GERD differ slightly from the U.S. total R&D data tabulated elsewhere in this report. For better consistency with international standards, U.S. GERD includes federal capital funding for federal intramural and nonprofit R&D, in addition to what is reported as U.S. total R&D. Some data are preliminary and may be revised later. Foreign currencies are converted by the Organisation for Economic Co-operation and Development (OECD) to U.S. dollars using PPP. U.S. data have been adjusted for international comparability. For more information on GERD and GDP statistics across regions, countries, or economies, see Table SDISC-3.
National Center for Science and Engineering Statistics, National Patterns of R&D Resources (2021–22 edition); OECD, Main Science and Technology Indicators, July 2024, https://stats.oecd.org/Index.aspx?DataSetCode=MSTI_PUB.
Science and Engineering Indicators
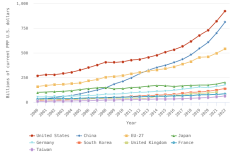
| Year | United States | China | EU-27 | Japan | Germany | South Korea | United Kingdom | France | Taiwan |
|---|---|---|---|---|---|---|---|---|---|
| 2000 | 268.56 | 32.90 | 158.81 | 98.94 | 53.89 | 18.52 | 25.15 | 33.27 | 9.15 |
| 2001 | 279.06 | 38.37 | 169.24 | 103.87 | 56.19 | 21.29 | 26.33 | 36.07 | 9.76 |
| 2002 | 278.41 | 47.84 | 178.11 | 108.17 | 58.64 | 22.51 | 27.87 | 38.33 | 10.90 |
| 2003 | 292.16 | 56.86 | 181.95 | 112.36 | 61.09 | 24.10 | 28.60 | 37.18 | 12.21 |
| 2004 | 303.82 | 69.72 | 188.74 | 117.43 | 62.96 | 27.92 | 29.44 | 38.17 | 13.68 |
| 2005 | 326.23 | 86.23 | 196.27 | 128.69 | 64.03 | 30.62 | 30.64 | 39.53 | 15.29 |
| 2006 | 351.67 | 104.84 | 216.61 | 138.80 | 69.57 | 35.41 | 33.31 | 42.37 | 17.44 |
| 2007 | 378.52 | 123.47 | 231.84 | 147.58 | 73.47 | 40.65 | 35.25 | 44.23 | 19.46 |
| 2008 | 405.41 | 145.25 | 254.24 | 148.72 | 81.17 | 43.91 | 36.54 | 46.57 | 21.52 |
| 2009 | 404.20 | 184.08 | 260.62 | 137.28 | 82.70 | 45.78 | 36.42 | 49.64 | 22.65 |
| 2010 | 408.50 | 212.19 | 270.14 | 140.51 | 86.95 | 52.15 | 37.53 | 50.85 | 25.05 |
| 2011 | 427.13 | 246.48 | 289.68 | 148.39 | 95.81 | 58.38 | 38.78 | 53.62 | 27.41 |
| 2012 | 434.42 | 290.89 | 302.42 | 152.33 | 100.49 | 64.86 | 38.49 | 55.10 | 28.78 |
| 2013 | 455.09 | 327.15 | 315.62 | 164.66 | 102.91 | 68.23 | 41.53 | 58.35 | 30.48 |
| 2014 | 476.97 | 352.37 | 329.08 | 169.55 | 109.56 | 73.10 | 60.40 | 60.59 | 31.77 |
| 2015 | 507.37 | 374.71 | 340.53 | 168.51 | 114.10 | 76.92 | 62.97 | 60.54 | 33.06 |
| 2016 | 533.45 | 404.64 | 360.09 | 160.27 | 122.47 | 80.82 | 67.12 | 63.65 | 34.34 |
| 2017 | 565.53 | 435.79 | 386.61 | 166.62 | 133.67 | 90.29 | 70.75 | 65.59 | 36.52 |
| 2018 | 617.72 | 480.64 | 413.57 | 172.04 | 142.32 | 100.28 | 84.85 | 68.65 | 40.29 |
| 2019 | 677.29 | 545.46 | 454.25 | 173.93 | 153.29 | 105.06 | 89.09 | 75.68 | 44.00 |
| 2020 | 730.24 | 607.60 | 459.87 | 174.93 | 150.79 | 112.22 | 94.64 | 76.07 | 47.62 |
| 2021 | 821.81 | 701.11 | 498.21 | 183.47 | 161.23 | 123.46 | 102.61 | 80.92 | 55.74 |
| 2022 | 923.24 | 811.86 | 542.12 | 200.77 | 174.86 | 139.00 | NA | 85.17 | 63.97 |
EU-27 = European Union; PPP = purchasing power parity.
Data are for the top eight R&D-performing regions, countries, or economies with R&D data reported by the Organisation for Economic Co-operation and Development (OECD). Some data are preliminary and may be revised later. Data for the United Kingdom dating back to 2014 are provisional and may be revised; data for the United Kingdom for 2022 are not available. U.S. data have been adjusted for international comparability.
National Center for Science and Engineering Statistics, National Patterns of R&D Resources (2021–22 edition); OECD, Main Science and Technology Indicators, July 2024, https://stats.oecd.org/Index.aspx?DataSetCode=MSTI_PUB.
Science and Engineering Indicators
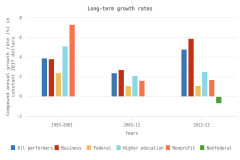
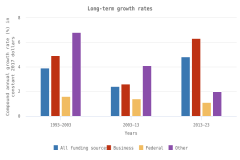
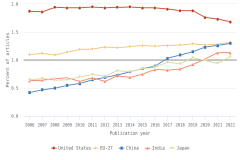
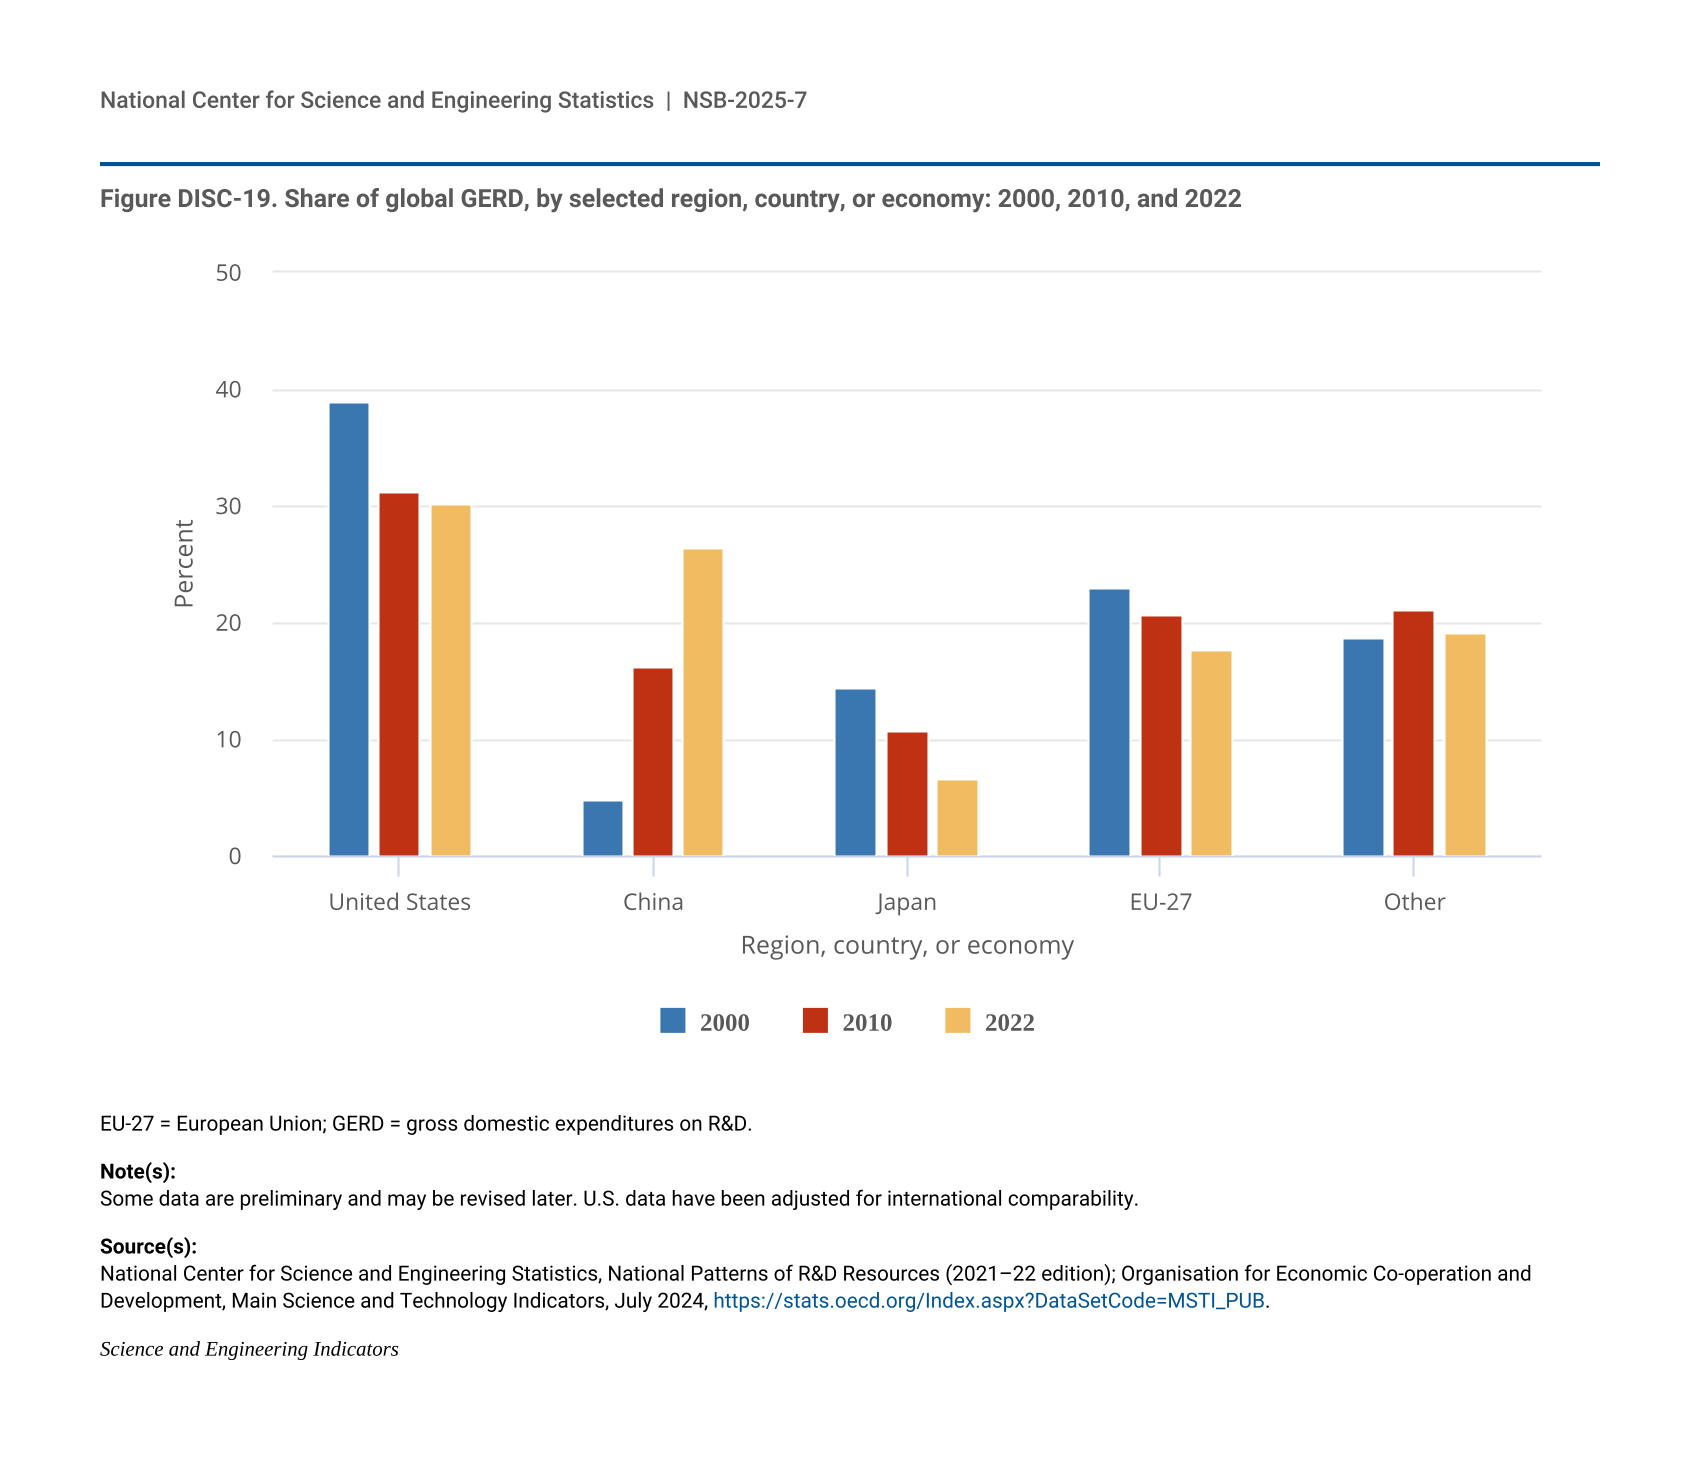
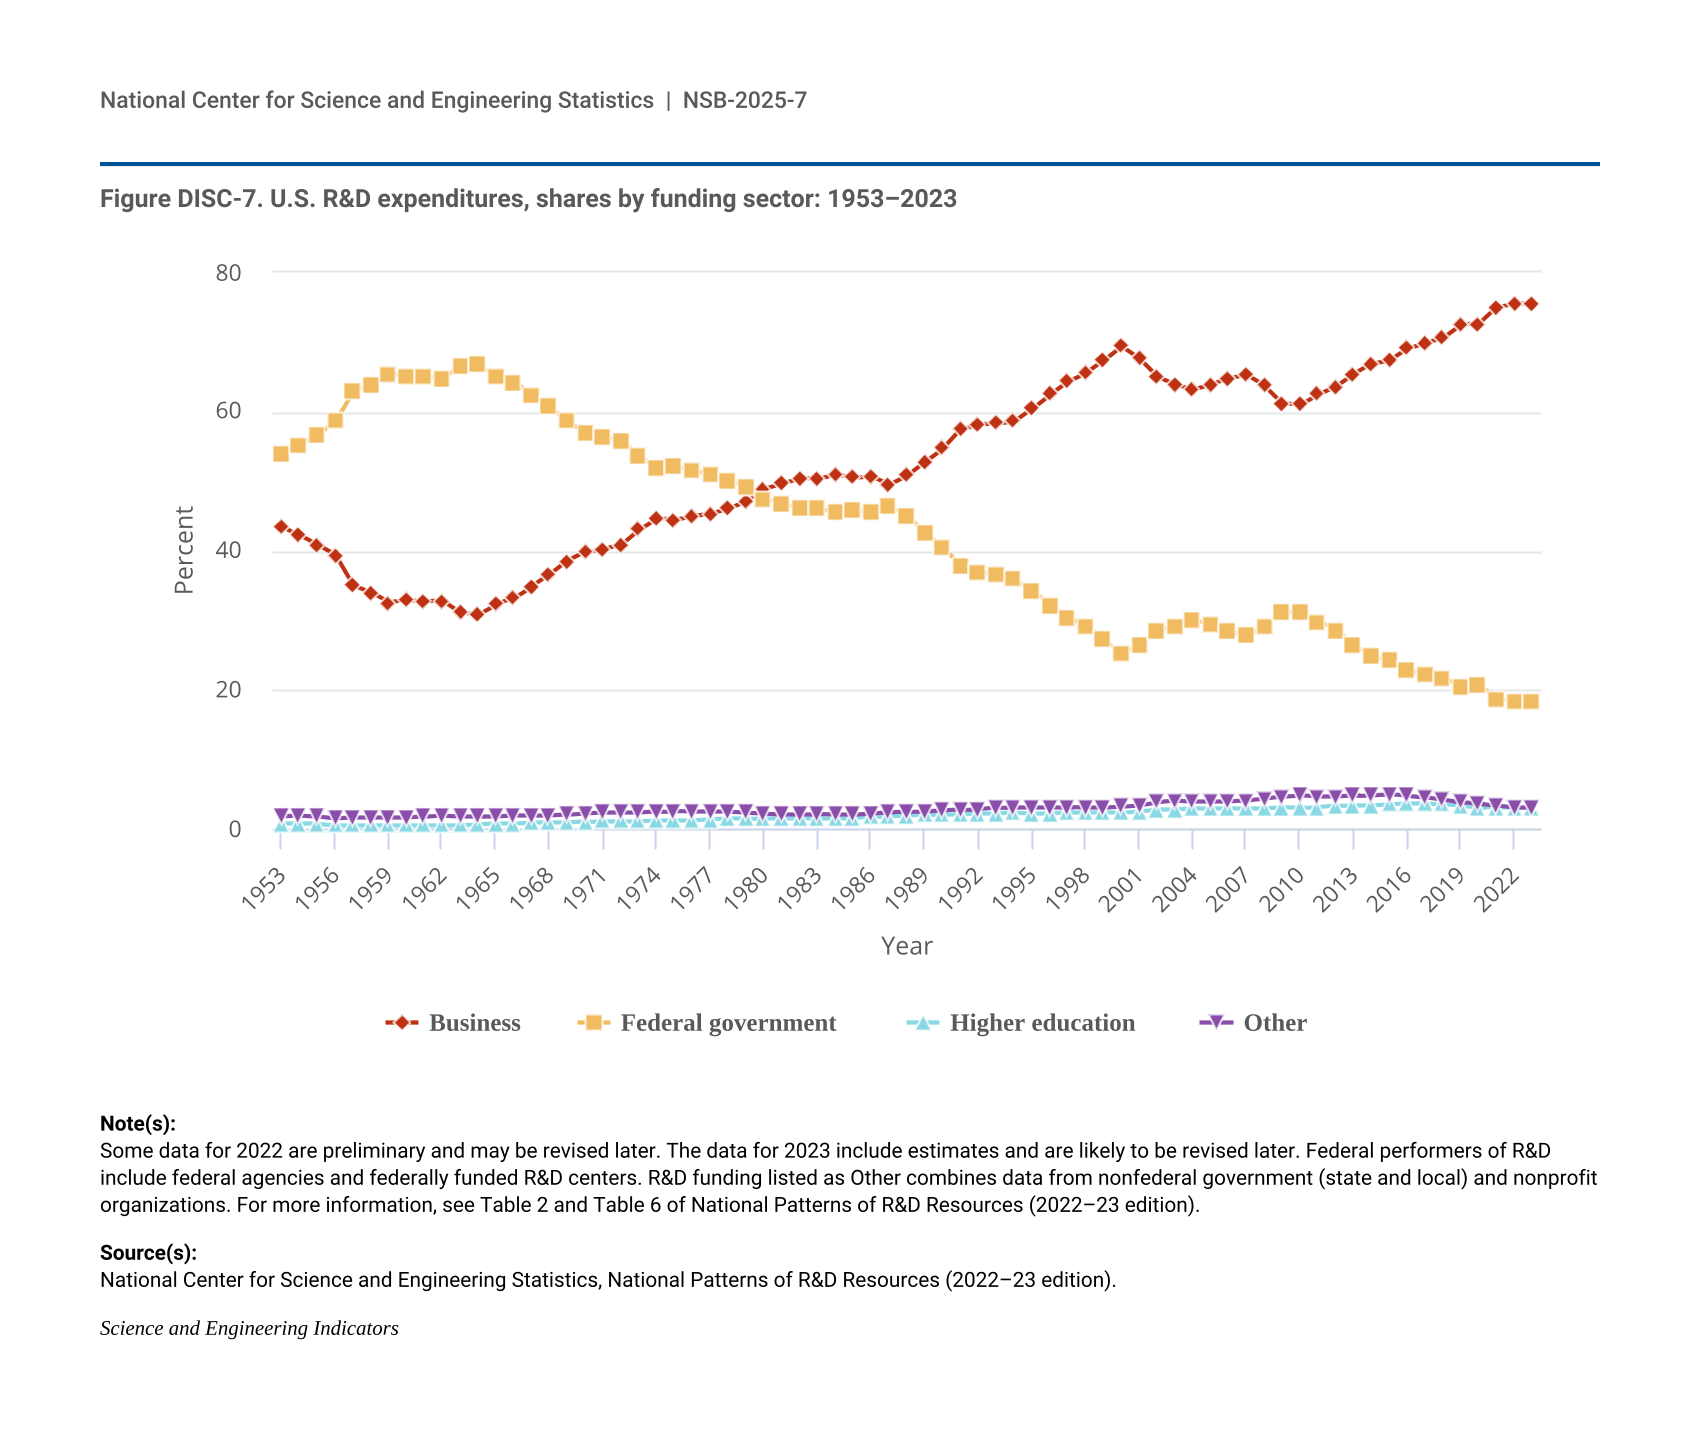
The U.S. share of global R&D declined from 39% in 2000 to 31% in 2010, remaining stable at 30% in 2022. China’s share of global R&D increased steadily since 2000, with corresponding declines in the shares of Japan and the EU-27 (Figure DISC-19). China’s GERD grew annually on average by double digits (CAGR in current dollars) in 2000–10 (20%) and in 2010–22 (12%), exceeding the rate of GDP growth over each of these periods, measured in current U.S. PPP dollars, adjusted for international comparability (Table DISC-10; Table SDISC-3). R&D expenditures’ growth over these decades coincided with several long-term policy plans by the Chinese government to advance scientific and technological capabilities (CRS 2024). For the United States, GERD and GDP grew annually between 2000 and 2010 by 4% (CAGR in current [nominal] dollars). For 2010–22, U.S. GERD grew 7% annually (CAGR in current dollars), faster than the nominal GDP growth rate of 5%.
| Region, country, or economy | 2000 | 2010 | 2022 |
|---|---|---|---|
| United States | 39.0 | 31.3 | 30.1 |
| China | 4.8 | 16.2 | 26.5 |
| Japan | 14.4 | 10.7 | 6.6 |
| EU-27 | 23.1 | 20.7 | 17.7 |
| Other | 18.7 | 21.1 | 19.1 |
EU-27 = European Union; GERD = gross domestic expenditures on R&D.
Some data are preliminary and may be revised later. U.S. data have been adjusted for international comparability.
National Center for Science and Engineering Statistics, National Patterns of R&D Resources (2021–22 edition); Organisation for Economic Co-operation and Development, Main Science and Technology Indicators, July 2024, https://stats.oecd.org/Index.aspx?DataSetCode=MSTI_PUB.
Science and Engineering Indicators
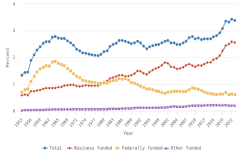
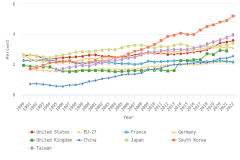
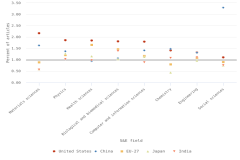
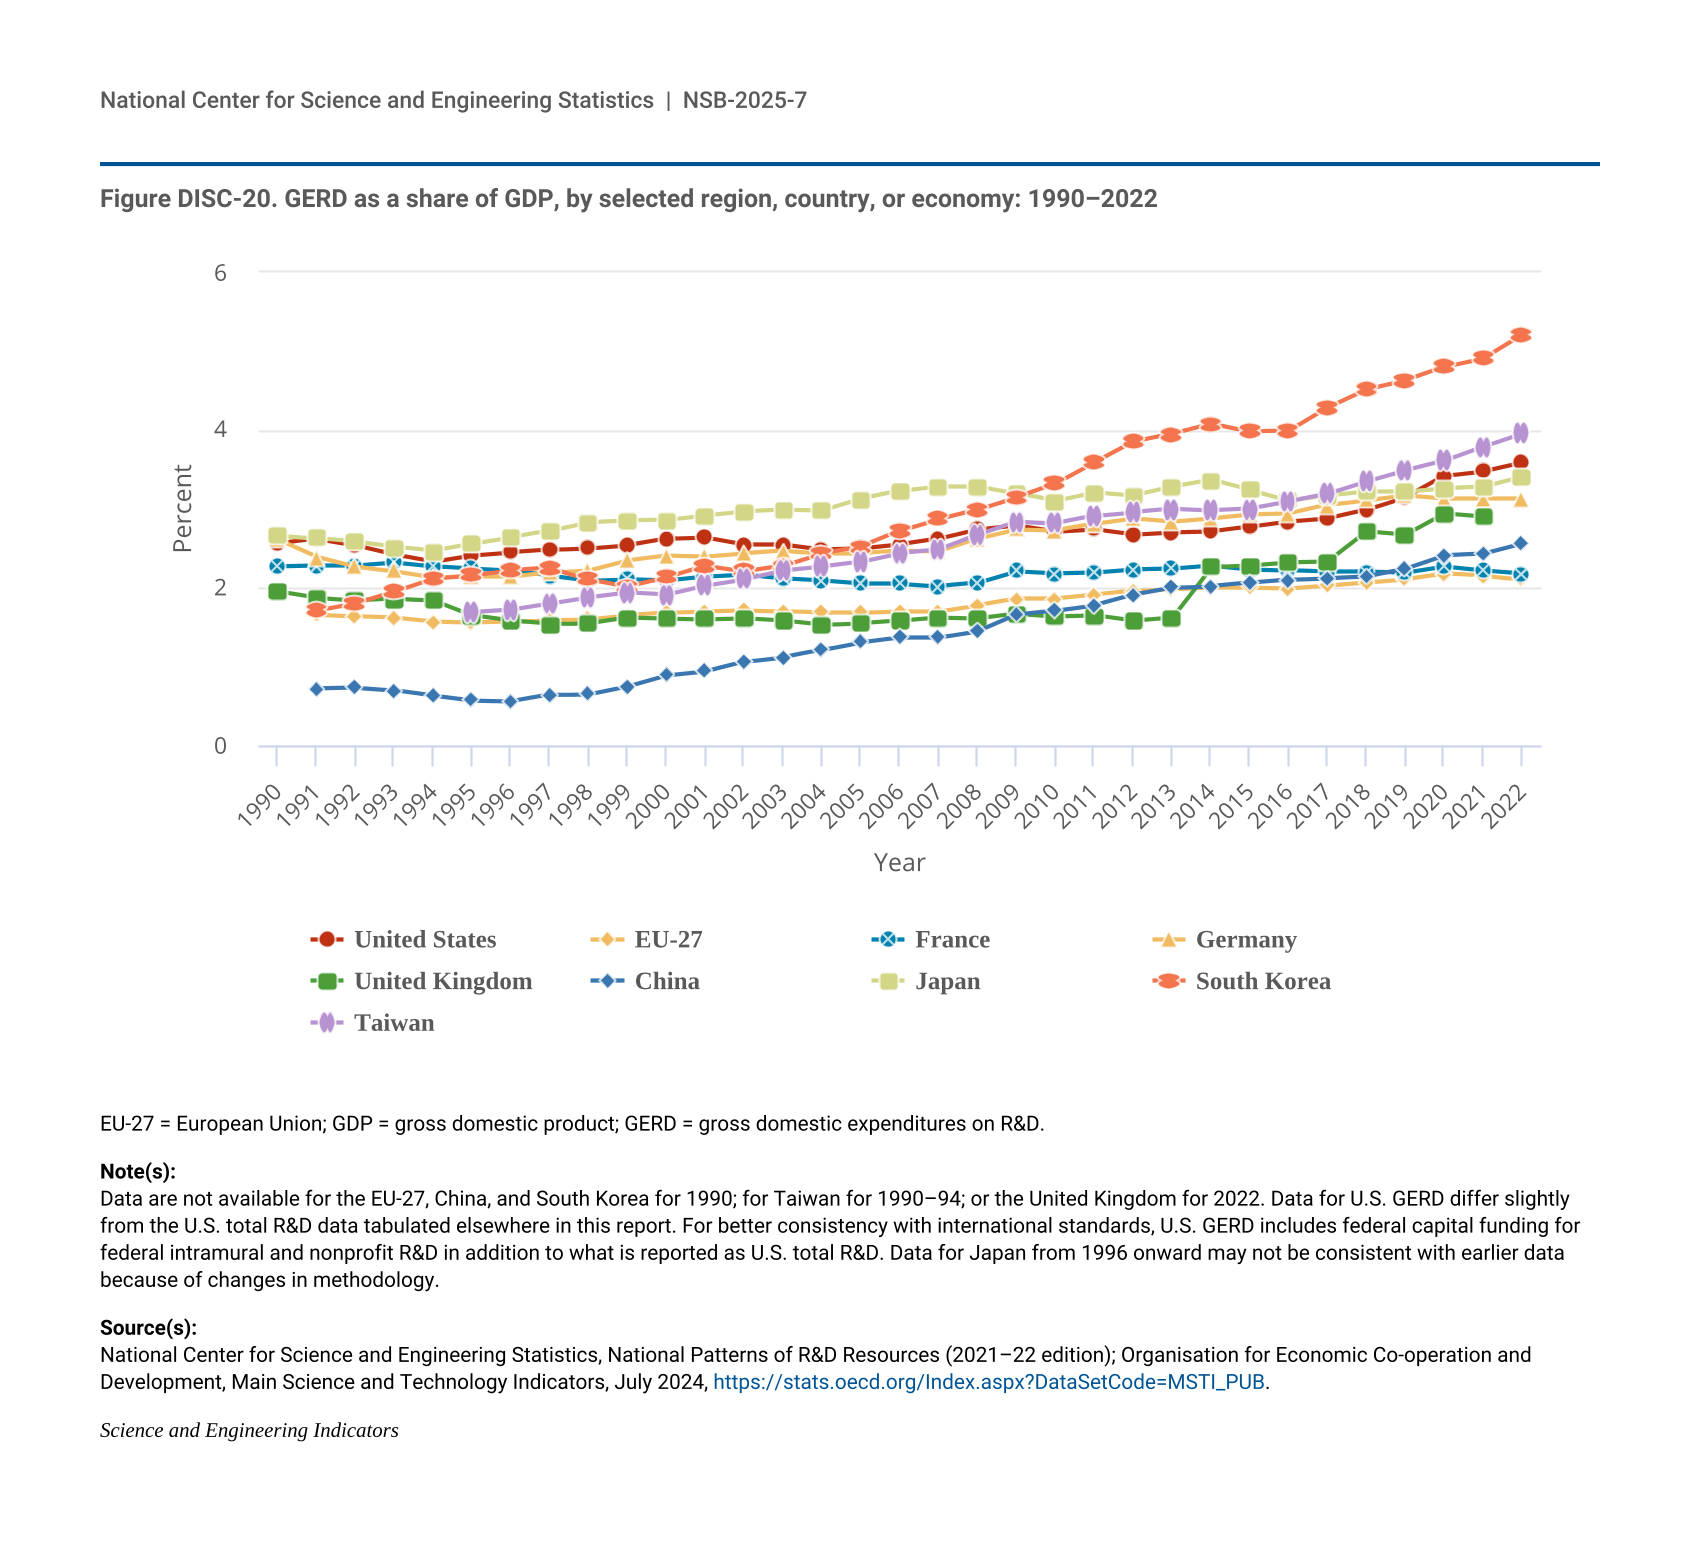
GERD-to-GDP ratios, or national R&D intensities, are a useful summary measure to compare across economies (Table SDISC-3). In 2022, Israel (6.0%) and South Korea (5.2%) topped this indicator, while seven economies had intensities between 3.0% and 4.0%, including Taiwan (4.0%), the United States (3.6%), Japan (3.4%), and Germany (3.1%). China’s GERD-to-GDP ratio was 2.6%, and the EU-27 had a ratio of 2.1% in 2022 (Figure DISC-20).
| Year | United States | EU-27 | France | Germany | United Kingdom | China | Japan | South Korea | Taiwan |
|---|---|---|---|---|---|---|---|---|---|
| 1990 | 2.56 | NA | 2.27 | 2.61 | 1.95 | NA | 2.66 | NA | NA |
| 1991 | 2.62 | 1.66 | 2.28 | 2.39 | 1.87 | 0.72 | 2.63 | 1.71 | NA |
| 1992 | 2.54 | 1.64 | 2.28 | 2.27 | 1.84 | 0.73 | 2.58 | 1.80 | NA |
| 1993 | 2.42 | 1.62 | 2.32 | 2.21 | 1.86 | 0.70 | 2.52 | 1.95 | NA |
| 1994 | 2.33 | 1.57 | 2.27 | 2.13 | 1.84 | 0.63 | 2.47 | 2.12 | NA |
| 1995 | 2.41 | 1.56 | 2.24 | 2.14 | 1.65 | 0.57 | 2.56 | 2.16 | 1.69 |
| 1996 | 2.45 | 1.57 | 2.22 | 2.14 | 1.58 | 0.56 | 2.64 | 2.22 | 1.72 |
| 1997 | 2.48 | 1.59 | 2.15 | 2.19 | 1.54 | 0.64 | 2.72 | 2.25 | 1.80 |
| 1998 | 2.50 | 1.60 | 2.09 | 2.22 | 1.55 | 0.65 | 2.83 | 2.11 | 1.88 |
| 1999 | 2.54 | 1.65 | 2.11 | 2.35 | 1.62 | 0.75 | 2.85 | 2.02 | 1.94 |
| 2000 | 2.62 | 1.68 | 2.09 | 2.41 | 1.61 | 0.89 | 2.86 | 2.13 | 1.91 |
| 2001 | 2.64 | 1.70 | 2.14 | 2.40 | 1.60 | 0.94 | 2.92 | 2.28 | 2.03 |
| 2002 | 2.55 | 1.71 | 2.17 | 2.44 | 1.61 | 1.06 | 2.97 | 2.21 | 2.11 |
| 2003 | 2.55 | 1.70 | 2.12 | 2.47 | 1.58 | 1.12 | 2.99 | 2.28 | 2.22 |
| 2004 | 2.49 | 1.68 | 2.09 | 2.44 | 1.53 | 1.21 | 2.98 | 2.44 | 2.27 |
| 2005 | 2.50 | 1.68 | 2.05 | 2.44 | 1.55 | 1.31 | 3.13 | 2.52 | 2.33 |
| 2006 | 2.55 | 1.70 | 2.05 | 2.47 | 1.58 | 1.37 | 3.23 | 2.72 | 2.44 |
| 2007 | 2.62 | 1.70 | 2.02 | 2.46 | 1.62 | 1.37 | 3.29 | 2.87 | 2.48 |
| 2008 | 2.74 | 1.78 | 2.06 | 2.62 | 1.61 | 1.45 | 3.29 | 2.99 | 2.67 |
| 2009 | 2.79 | 1.86 | 2.21 | 2.74 | 1.67 | 1.66 | 3.20 | 3.15 | 2.84 |
| 2010 | 2.71 | 1.86 | 2.18 | 2.73 | 1.64 | 1.71 | 3.10 | 3.32 | 2.82 |
| 2011 | 2.74 | 1.91 | 2.19 | 2.81 | 1.65 | 1.78 | 3.21 | 3.59 | 2.91 |
| 2012 | 2.67 | 1.96 | 2.23 | 2.88 | 1.58 | 1.91 | 3.17 | 3.85 | 2.96 |
| 2013 | 2.70 | 1.98 | 2.24 | 2.84 | 1.62 | 2.00 | 3.28 | 3.95 | 3.00 |
| 2014 | 2.71 | 2.00 | 2.28 | 2.88 | 2.26 | 2.02 | 3.37 | 4.08 | 2.98 |
| 2015 | 2.77 | 2.00 | 2.23 | 2.93 | 2.28 | 2.06 | 3.24 | 3.98 | 3.00 |
| 2016 | 2.84 | 1.99 | 2.22 | 2.94 | 2.32 | 2.10 | 3.11 | 3.99 | 3.09 |
| 2017 | 2.88 | 2.03 | 2.20 | 3.05 | 2.33 | 2.12 | 3.17 | 4.29 | 3.19 |
| 2018 | 2.99 | 2.07 | 2.20 | 3.11 | 2.71 | 2.14 | 3.22 | 4.52 | 3.35 |
| 2019 | 3.15 | 2.11 | 2.19 | 3.17 | 2.67 | 2.24 | 3.22 | 4.63 | 3.49 |
| 2020 | 3.42 | 2.18 | 2.27 | 3.13 | 2.94 | 2.41 | 3.26 | 4.80 | 3.61 |
| 2021 | 3.48 | 2.15 | 2.22 | 3.13 | 2.90 | 2.43 | 3.28 | 4.91 | 3.79 |
| 2022 | 3.59 | 2.11 | 2.18 | 3.13 | NA | 2.56 | 3.41 | 5.21 | 3.96 |
EU-27 = European Union; GDP = gross domestic product; GERD = gross domestic expenditures on R&D.
Data are not available for the EU-27, China, and South Korea for 1990; for Taiwan for 1990–94; or the United Kingdom for 2022. Data for U.S. GERD differ slightly from the U.S. total R&D data tabulated elsewhere in this report. For better consistency with international standards, U.S. GERD includes federal capital funding for federal intramural and nonprofit R&D in addition to what is reported as U.S. total R&D. Data for Japan from 1996 onward may not be consistent with earlier data because of changes in methodology.
National Center for Science and Engineering Statistics, National Patterns of R&D Resources (2021–22 edition); Organisation for Economic Co-operation and Development, Main Science and Technology Indicators, July 2024, https://stats.oecd.org/Index.aspx?DataSetCode=MSTI_PUB.
Science and Engineering Indicators
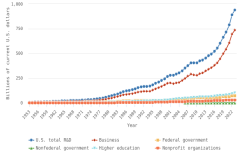
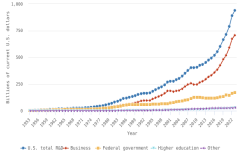
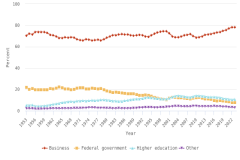
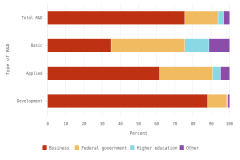
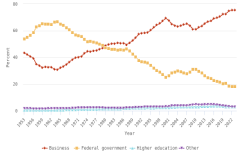
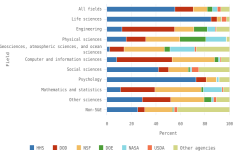
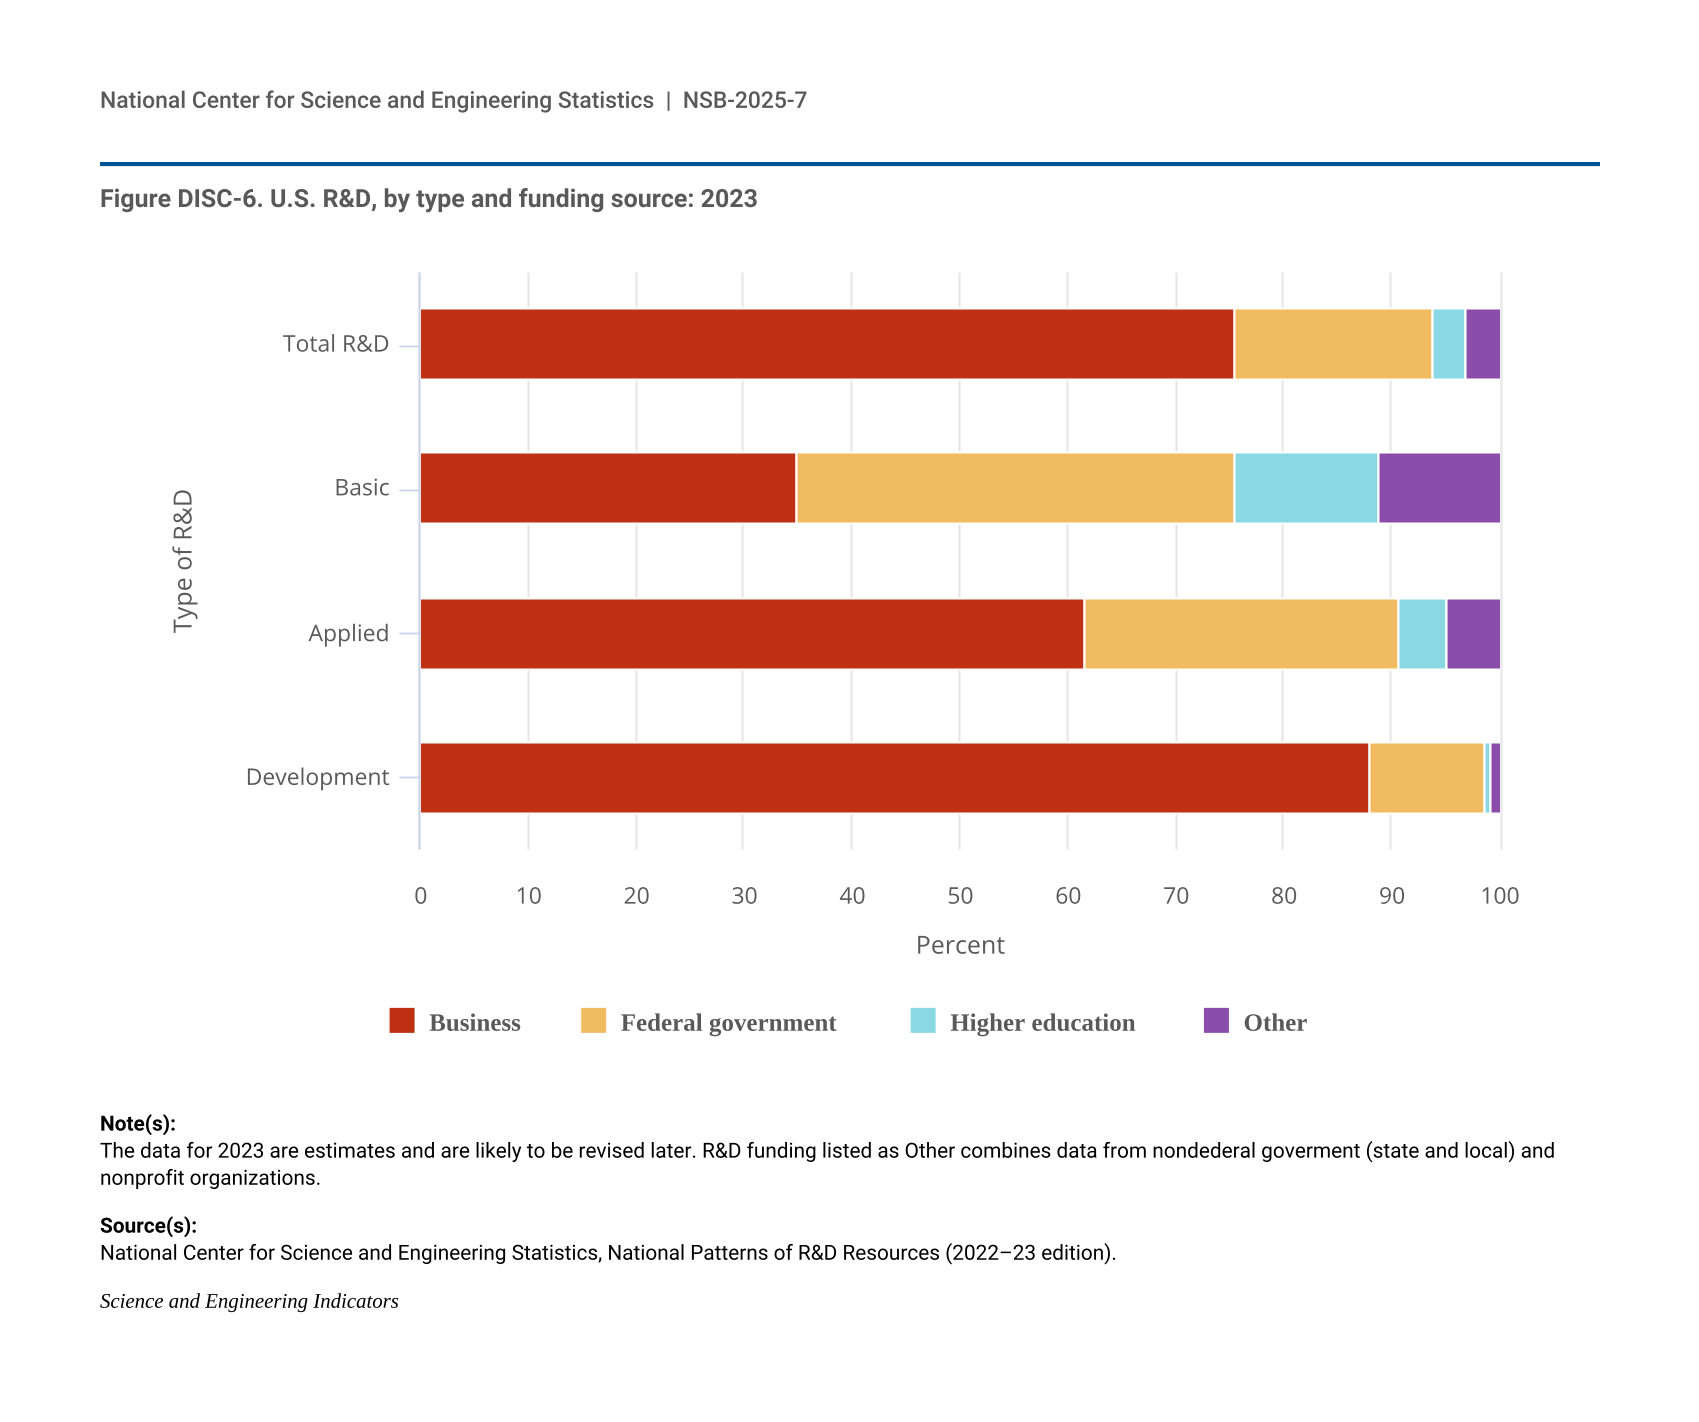
The sectoral composition of R&D activities varies among countries and regions. Across the top 8 individual R&D-performing economies, the business sector is the largest performer and funder of R&D (Table DISC-11). For 5 of the top 8 R&D-performing economies, businesses performed more than three-fourths of R&D. The government sectors in the United Kingdom and France performed about 20% of R&D, compared with 10% for the United States and 8% for China. The higher education sector had double-digit performing shares only in China, Germany, and France among the largest R&D performers, with available detail in the OECD MSTI database (Table DISC-11; Table SDISC-4). The government sector funded between 17% and 23% of GERD in South Korea, the United Kingdom, the United States, and China in 2022.
NA = not available.
EU-27 = European Union; GERD = gross domestic expenditures on R&D; PPP = purchasing power parity.
a The private nonprofit sector comprises all nonprofit institutions serving households except those classified as part of the higher education sector.
b Data for U.S. GERD differ slightly from the U.S. total R&D data tabulated elsewhere in this report. For better consistency with international standards, U.S. GERD includes federal capital funding for federal intramural and nonprofit R&D, in addition to what is reported as U.S. total R&D. The data for U.S. funding from the rest of the world include funding for business R&D and academic R&D.
Some data are preliminary and may be revised later. Percentages may not add to 100% because of rounding. Germany's nonprofit sector expenditures are included in data for other performing sectors. The most recent year of GERD data for the United Kingdom was 2021. Classification of sectors follows Organisation for Economic Co-operation and Development (OECD) surveys. U.S. data have been adjusted for international comparability. Foreign currencies are converted by OECD to U.S. dollars using PPP.
National Center for Science and Engineering Statistics, National Patterns of R&D Resources (2021–22 edition); OECD, Main Science and Technology Indicators, July 2024, https://stats.oecd.org/Index.aspx?DataSetCode=MSTI_PUB.
Science and Engineering Indicators
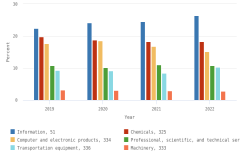
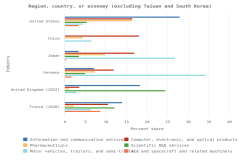
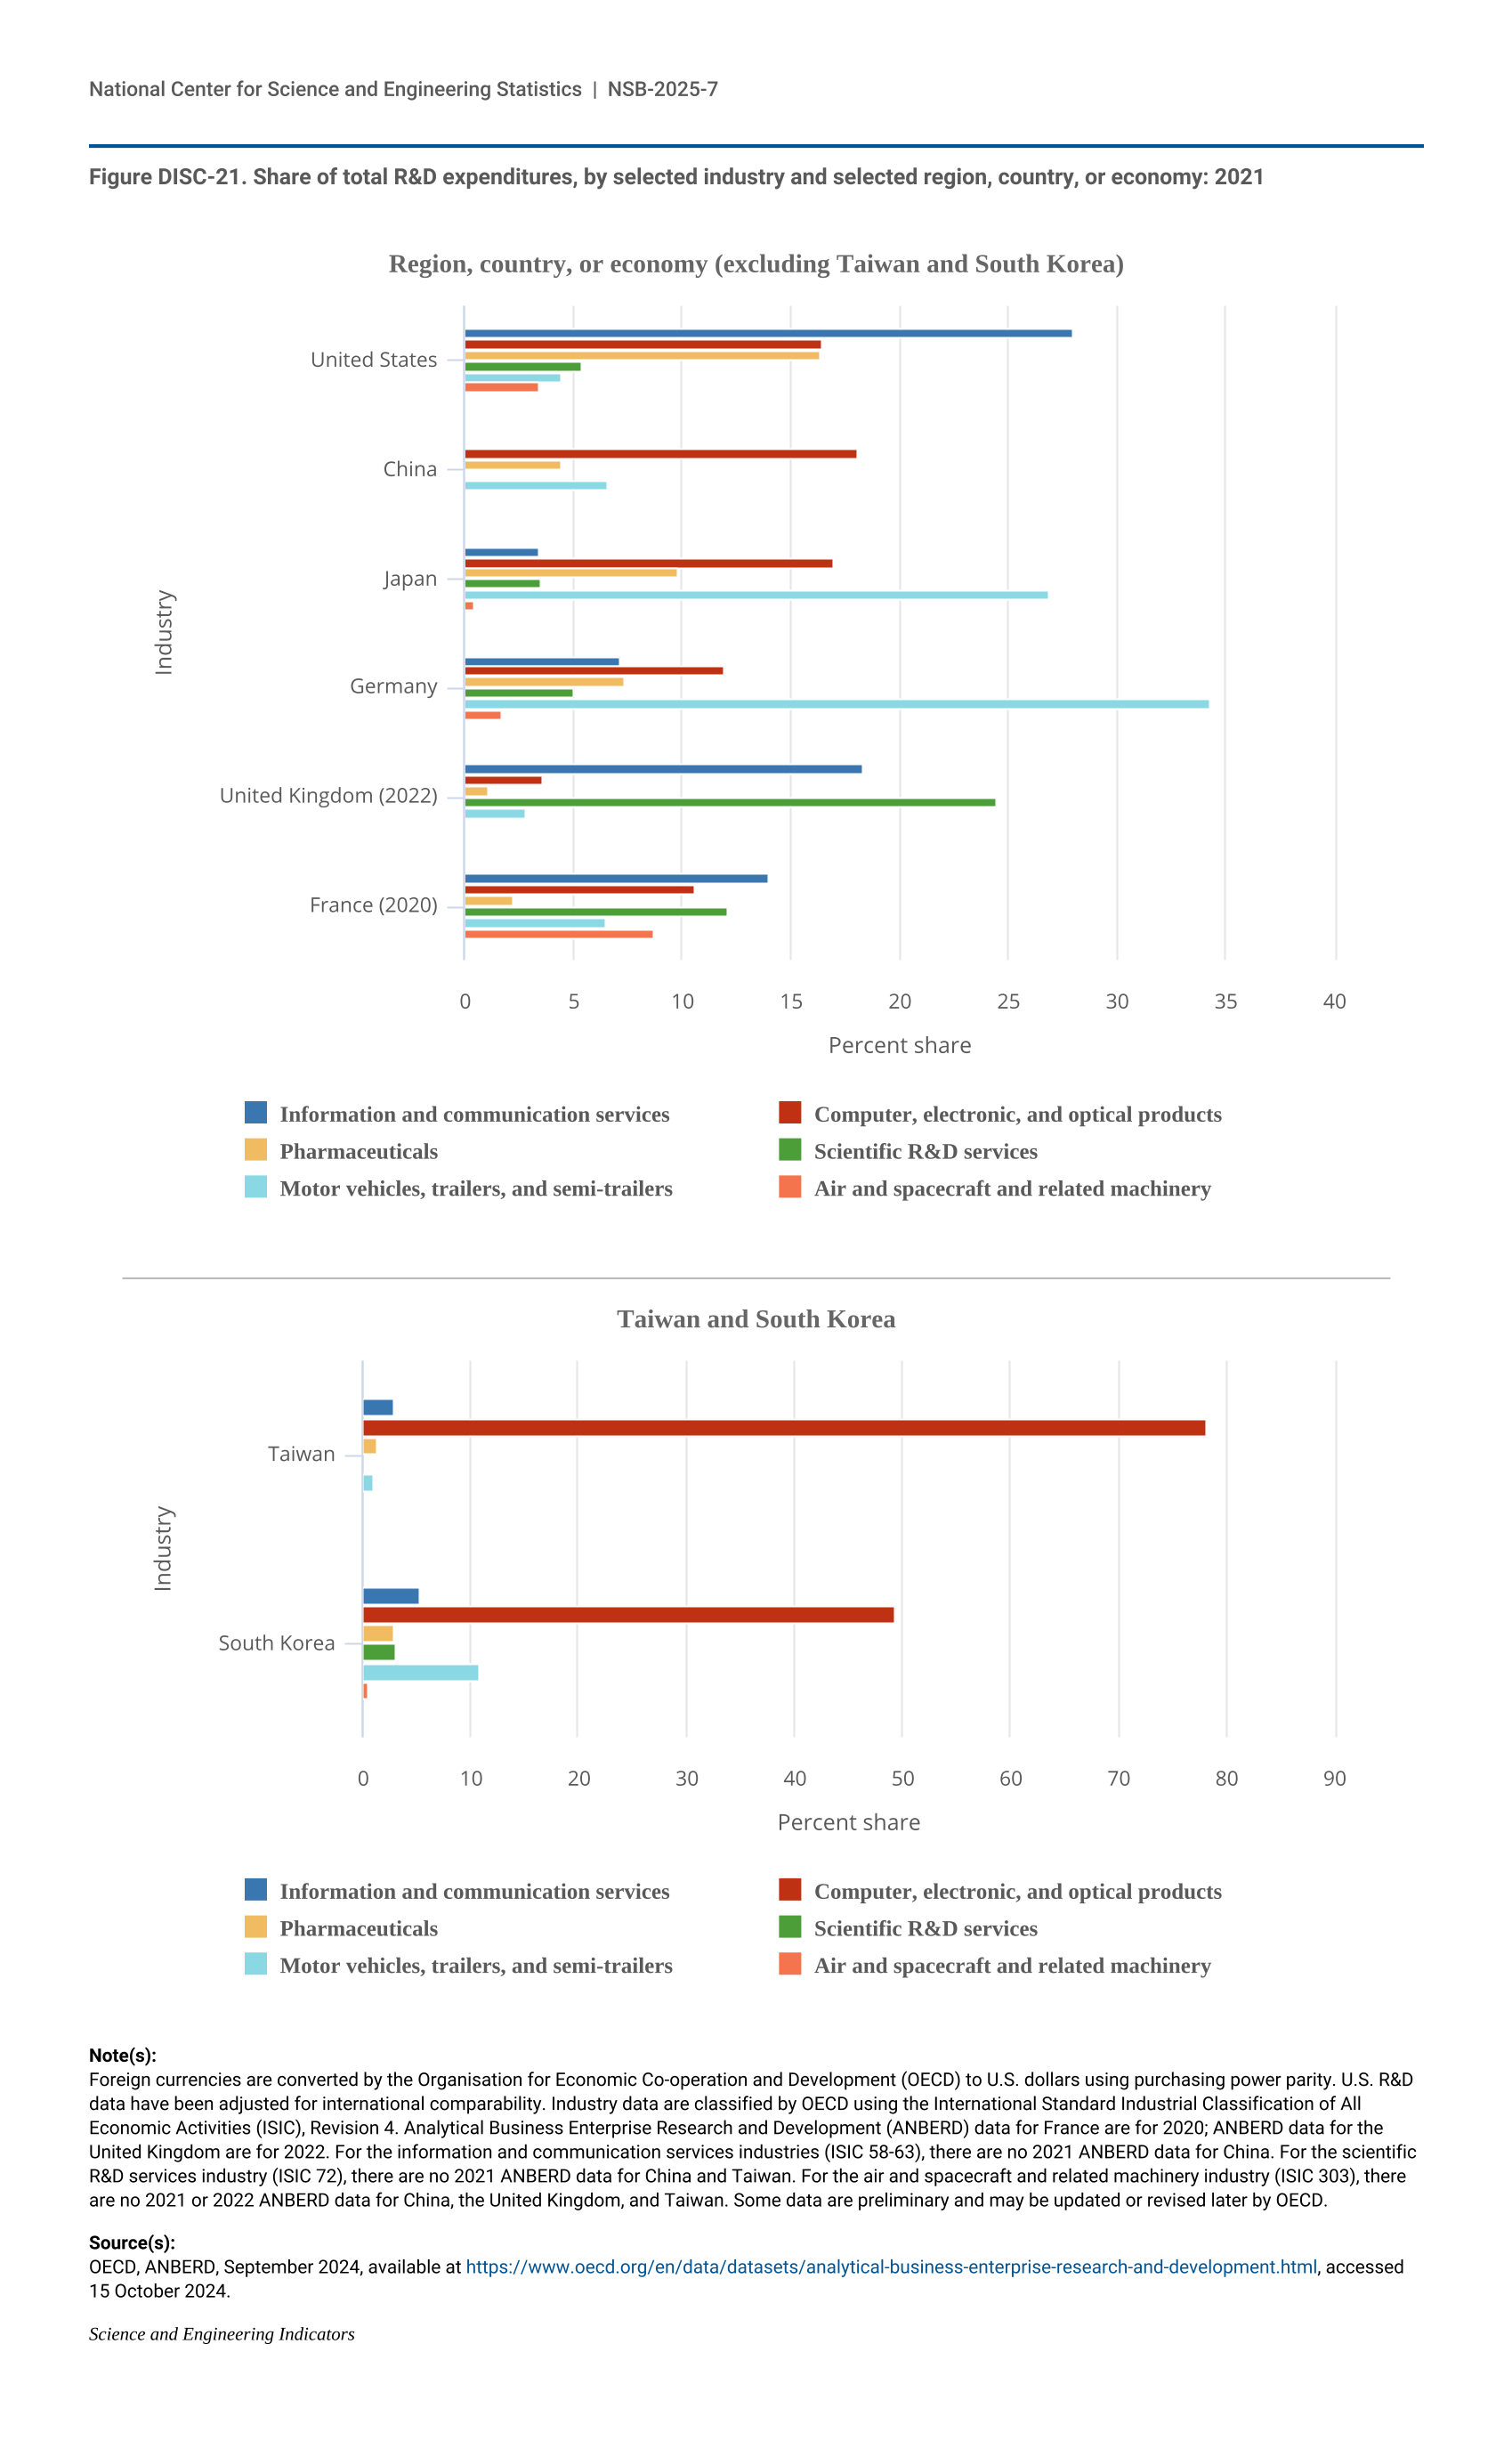
IT-related industries (information and communication services and computer, electronic and optical products manufacturing) receive some of largest shares of business R&D expenditures within top GERD economies, based on internationally comparable statistics from the OECD ANBERD database (OECD 2024a) (Figure DISC-21). In 2021, information and communication industries (International Standard Industrial Classification of All Economic Activities [ISIC] 58-63) received the largest share of business R&D expenditures in the United States as well as France (28% and 14%, respectively), and the second-largest share in the United Kingdom (18%). Computer, electronic and optical products manufacturing (ISIC 26, which includes semiconductors) received the largest share of business R&D expenditures in Taiwan (78%) and in South Korea (49%); in the United States, it was the second-largest industry at 17%. However, in absolute terms, businesses in the United States funded the largest amount of business R&D in computer, electronic and optical products manufacturing among research-intensive economies at $104.9 billion.
| Industry | Information and communication services | Computer, electronic, and optical products | Pharmaceuticals | Scientific R&D services | Motor vehicles, trailers, and semi-trailers | Air and spacecraft and related machinery |
|---|---|---|---|---|---|---|
| United States | 28.0 | 16.5 | 16.4 | 5.4 | 4.4 | 3.4 |
| China | NA | 18.1 | 4.4 | NA | 6.6 | NA |
| Japan | 3.4 | 17.0 | 9.8 | 3.5 | 26.9 | 0.4 |
| Germany | 7.2 | 11.9 | 7.3 | 5.0 | 34.3 | 1.7 |
| United Kingdom (2022) | 18.3 | 3.6 | 1.1 | 24.5 | 2.8 | NA |
| France (2020) | 14.0 | 10.6 | 2.2 | 12.1 | 6.5 | 8.7 |
| Industry | Information and communication services | Computer, electronic, and optical products | Pharmaceuticals | Scientific R&D services | Motor vehicles, trailers, and semi-trailers | Air and spacecraft and related machinery |
|---|---|---|---|---|---|---|
| Taiwan | 2.9 | 78.1 | 1.3 | NA | 1.0 | NA |
| South Korea | 5.3 | 49.3 | 2.9 | 3.1 | 10.9 | 0.5 |
Foreign currencies are converted by the Organisation for Economic Co-operation and Development (OECD) to U.S. dollars using purchasing power parity. U.S. R&D data have been adjusted for international comparability. Industry data are classified by OECD using the International Standard Industrial Classification of All Economic Activities (ISIC), Revision 4. Analytical Business Enterprise Research and Development (ANBERD) data for France are for 2020; ANBERD data for the United Kingdom are for 2022. For the information and communication services industries (ISIC 58-63), there are no 2021 ANBERD data for China. For the scientific R&D services industry (ISIC 72), there are no 2021 ANBERD data for China and Taiwan. For the air and spacecraft and related machinery industry (ISIC 303), there are no 2021 or 2022 ANBERD data for China, the United Kingdom, and Taiwan. Some data are preliminary and may be updated or revised later by OECD.
OECD, ANBERD, September 2024, available at https://www.oecd.org/en/data/datasets/analytical-business-enterprise-research-and-development.html, accessed 15 October 2024.
Science and Engineering Indicators
Other notable focus areas for business R&D expenditures in 2021 included the motor vehicles manufacturing (including electric vehicles), aerospace manufacturing, and pharmaceuticals manufacturing industries and R&D services. A third of business R&D expenditures in Germany and a quarter of business R&D expenditures in Japan were devoted to the motor vehicles manufacturing industry (ISIC 29). Among top GERD economies, the United States had largest share of business R&D expenditures in pharmaceuticals manufacturing (ISIC 21) with 16%, followed by Japan with 10%. Businesses in the United Kingdom (24%) and France (12%) invest the largest shares of R&D expenditures in scientific R&D services (ISIC 72). Lastly, the largest shares of business R&D expenditures in the air and spacecraft and related machinery manufacturing industry (ISIC 303) were in France (9%) and the United States (3%).