 An official website of the United States government
 U.S. Business R&D
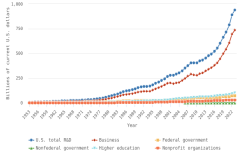
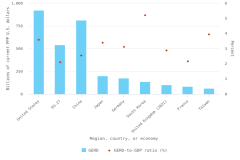
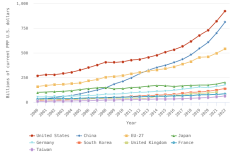
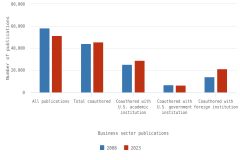
The vast majority of business sector R&D is performed by companies with 10 or more employees. Of the $697.3 billion of R&D performed by the business sector in 2022, $691.5 billion was performed by companies with 10 or more domestic employees (Table DISC-1), and $5.7 billion was performed by businesses with 9 or fewer domestic employees (or microbusinesses) (Hughes 2024; Kindlon 2024). Early outputs from scientific research by the business sector include peer-reviewed publications and patents (Arora, Belenzon, and Sheer 2021; Arora et al. 2023). See the section Output by Geography, S&E Field, and Sector later in this report for information on publications by authors associated with the business sector (patents will be covered in the Indicators 2026 report “Translation to Impact: U.S. and Global Science, Technology, and Innovation Output” [NSB forthcoming]). The rest of this section describes the scope and focus of U.S. industry R&D performance and funding.
Industries That Perform the Most U.S. Business R&D
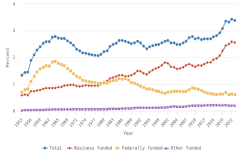
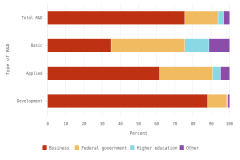
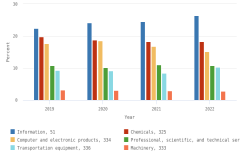
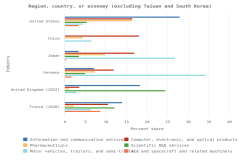
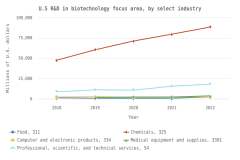
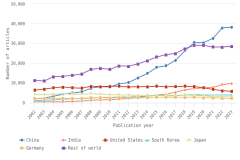
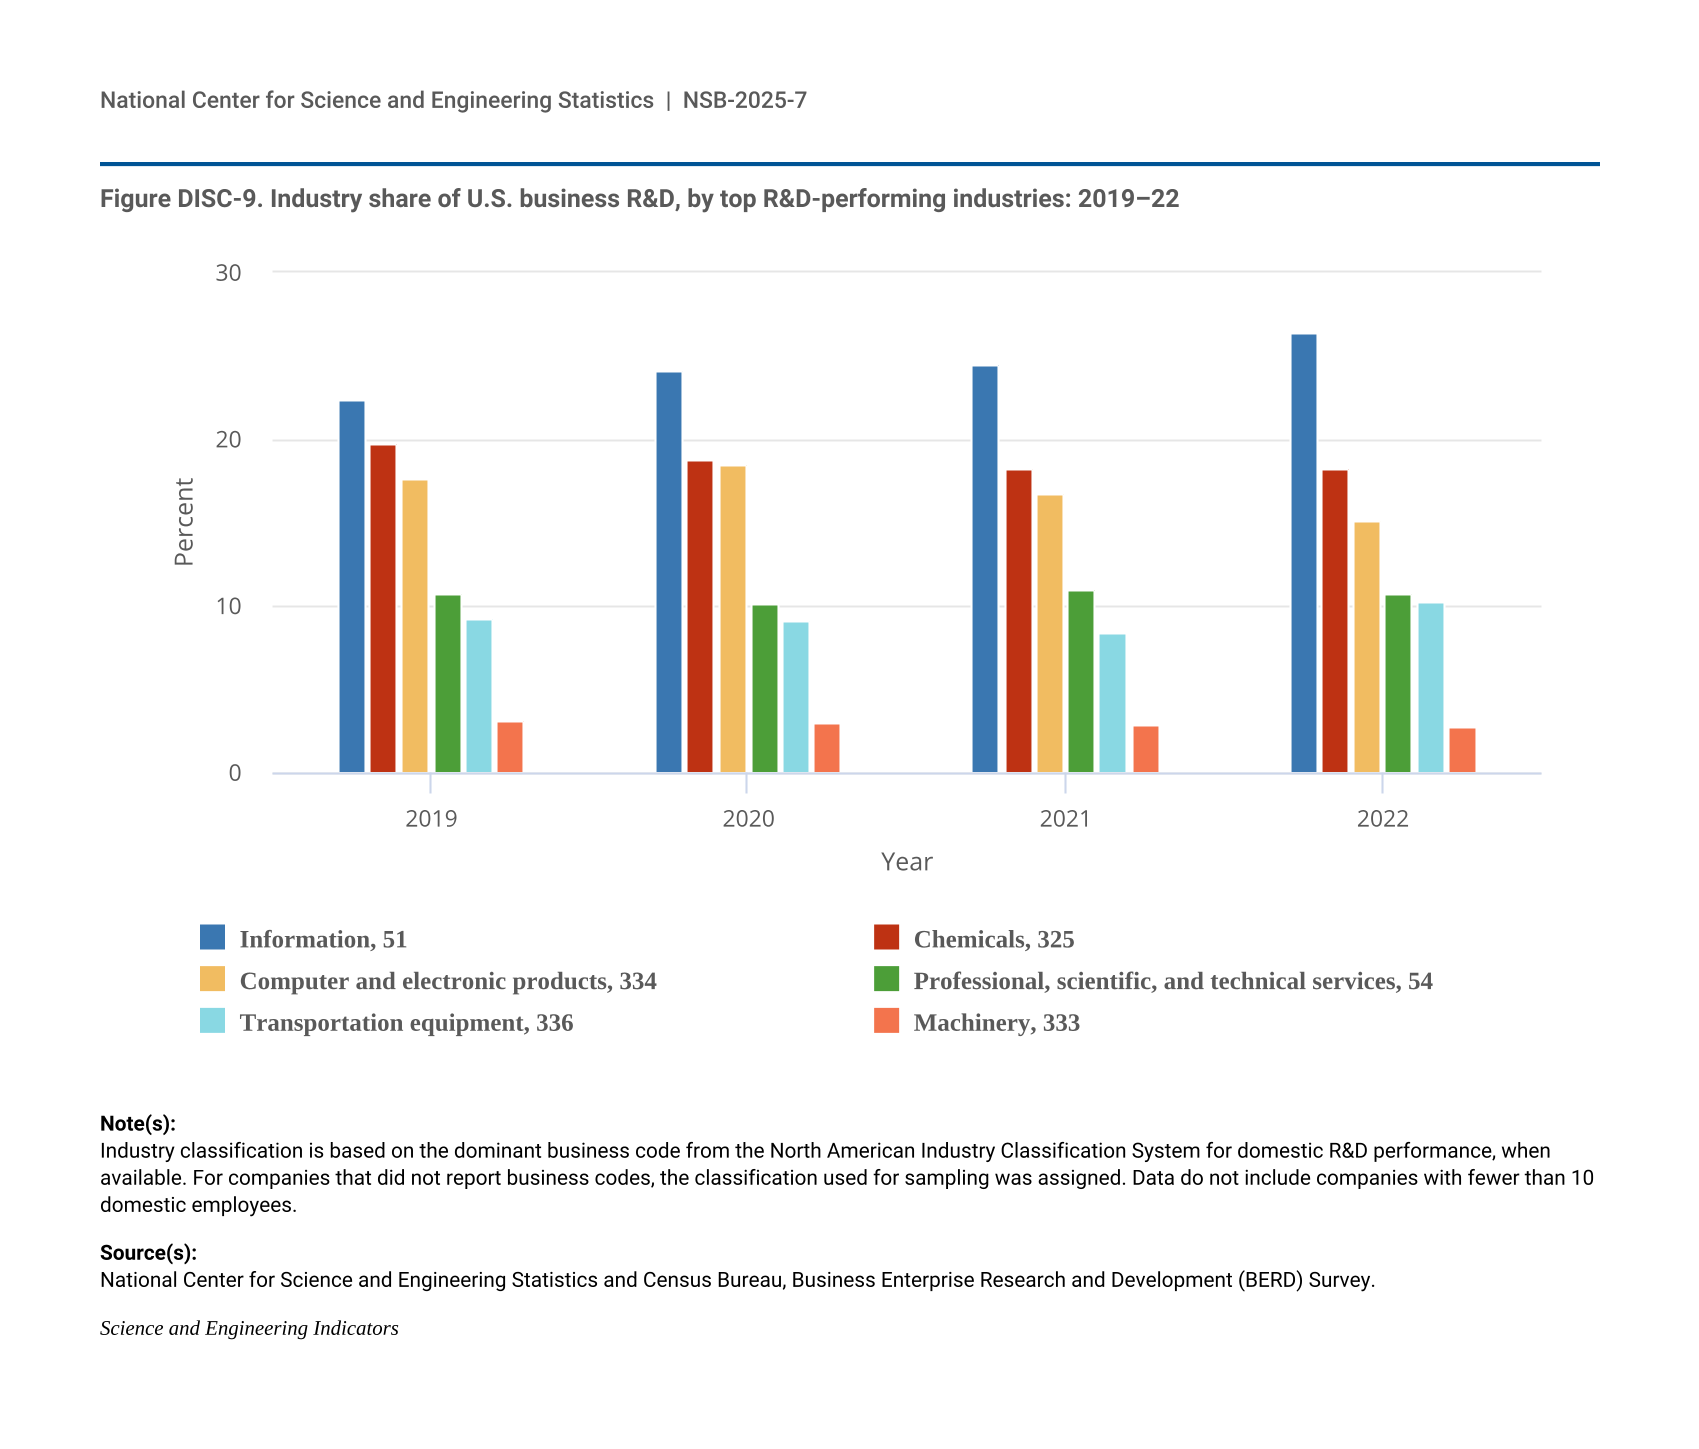
Selected manufacturing and services industries accounted for the largest amount of R&D performance in 2022, most of which was internally funded but with notable differences in the source of external funding across industries. The largest proportion of the $691.5 billion in R&D performed by businesses with 10 or more domestic employees in 2022 was conducted by the manufacturing sector (54%) (Table DISC-3). Four-fifths of the $691.5 billion was performed by five industries: information (including software publishing) at 26%; chemicals manufacturing (including pharmaceuticals and medicines) at 18%; computer and electronic products manufacturing (including semiconductors) at 15%; professional, scientific, and technical services (including R&D services) at 11%; and transportation equipment manufacturing (such as motor vehicles, including electric vehicles and aerospace products and parts) at 10% (Figure DISC-9; Table DISC-3). Machinery manufacturing (which includes semiconductor machinery) performed another 3%. These six industries are R&D-intensive (also called knowledge- and technology-intensive) industries, as measured by domestic R&D-to-sales ratio (Table DISC-3). Notable components of these industries in terms of R&D intensities include scientific R&D services (29%), semiconductor and other electronic components manufacturing (24%), pharmaceuticals and medicines manufacturing (17%), and software publishers (14%).
| Year | Information, 51 | Chemicals, 325 | Computer and electronic products, 334 | Professional, scientific, and technical services, 54 | Transportation equipment, 336 | Machinery, 333 |
|---|---|---|---|---|---|---|
| 2019 | 22.4 | 19.7 | 17.6 | 10.8 | 9.2 | 3.1 |
| 2020 | 24.1 | 18.8 | 18.5 | 10.1 | 9.1 | 3.0 |
| 2021 | 24.5 | 18.2 | 16.8 | 11.0 | 8.4 | 2.9 |
| 2022 | 26.4 | 18.2 | 15.1 | 10.8 | 10.3 | 2.8 |
Industry classification is based on the dominant business code from the North American Industry Classification System for domestic R&D performance, when available. For companies that did not report business codes, the classification used for sampling was assigned. Data do not include companies with fewer than 10 domestic employees.
National Center for Science and Engineering Statistics and Census Bureau, Business Enterprise Research and Development (BERD) Survey.
Science and Engineering Indicators
i = more than 50% of the estimate is a combination of imputation and reweighting to account for nonresponse.
NAICS = 2017 North American Industry Classification System.
a Dollar values are for goods sold or services rendered by R&D-performing or R&D-funding companies located in the United States to customers outside of the company, including the U.S. federal government, foreign customers, and the company's foreign subsidiaries. Included are revenues from a company’s foreign operations and subsidiaries and from discontinued operations. If a respondent company is owned by a foreign parent company, sales to the parent company and to affiliates not owned by the respondent company are included. Excluded are intracompany transfers, returns, allowances, freight charges, and excise, sales, and other revenue-based taxes.
b Domestic R&D is the cost of R&D paid for and performed by the respondent company and paid for by others outside of the company and performed by the respondent company.
Data are for companies with 10 or more domestic employees. Detail may not add to total because of rounding. Industry classification was based on the dominant business code for domestic R&D performance, where available. For companies that did not report business codes, the classification used for sampling was assigned.
National Center for Science and Engineering Statistics and Census Bureau, Business Enterprise Research and Development (BERD) Survey, 2022.
Science and Engineering Indicators
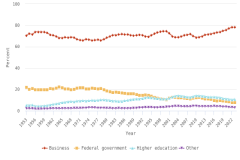
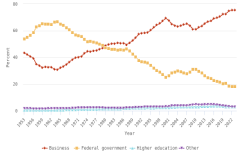
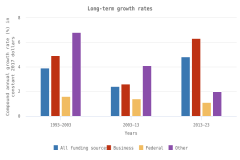
Although about 88% of overall U.S. business R&D is funded internally by the performing company, the relative roles of internal and external funding vary for some of the largest R&D-performing industries. While the internal funding share for the information industry is 99%, it is only 39% for aerospace products and parts manufacturing and 23% for scientific R&D services. The latter two industries have different primary external funding sources—namely, the federal government for the aerospace manufacturing industry and other domestic companies (contract R&D customers) for scientific R&D services (Table DISC-4).
D = suppressed to avoid disclosure of confidential information; i = more than 50% of the estimate or its component(s) is a combination of imputation and reweighting to account for nonresponse; NA = not available; r = relative standard error of this estimate or its component(s) is more than 50%.
NAICS = 2017 North American Industry Classification System.
a All R&D is the cost of R&D paid for and performed by the respondent company and paid for by others outside of the company and performed by the respondent company.
Data are for companies with 10 or more domestic employees. Detail may not add to total because of rounding. Industry classification was based on the dominant business code for domestic R&D performance, where available. For companies that did not report business codes, the classification used for sampling was assigned. Excludes data for federally funded R&D centers.
National Center for Science and Engineering Statistics and Census Bureau, Business Enterprise Research and Development (BERD) Survey, 2022.
Science and Engineering Indicators
Business R&D performed by businesses with 10 or more domestic employees is highly geographically concentrated, with California, Washington, and Massachusetts accounting for about half in 2022 (NCSES BERD 2022: Table 13). In some industries, such as semiconductor manufacturing and industries in their supply chain, business R&D is even more geographically concentrated. In 2021, 51% of company-funded U.S. R&D performed by the semiconductor manufacturing industry was performed in California, whereas the California share for the semiconductor machinery manufacturing industry was 65% (Moris and Rhodes 2024a, 2024b).
U.S. Business R&D by Technology Focus
R&D in critical and emerging technologies and in advanced manufacturing processes contributes to economic competitiveness and national security (DOD/DSB 2022). This section covers U.S. business R&D in four technology focus areas across all industries: software, artificial intelligence (AI), nanotechnology, and biotechnology. For scientific publications and other activities in biotechnology and semiconductors, see sidebar Biotechnology R&D and Publications Output, and see sidebar Semiconductor Research Publication Output and International Collaboration later in this report.
Information technology (IT) has long been recognized for its role in productivity growth (Jorgenson 2001) and for national and economic security (CRS 2016, 2023b). In 2022, domestic software R&D performed in any industry accounted for 42% ($291.7 billion) of U.S. R&D performed by businesses with 10 or more domestic employees (Table DISC-5). Over half of U.S. software R&D was performed by the information services industry. Across industries, 5% ($37.0 billion) of business R&D was in the AI application area. The largest industries performing AI business R&D in 2022 were information services (43%), computer manufacturing (including semiconductors) (22%), and the professional, scientific, and technical services industry (including scientific R&D services) (17%). Nanotechnology R&D accounted for only 5% of total U.S. business R&D but for 58% of the R&D performed by the semiconductor manufacturing industry. This is consistent with the role of nanotechnology tools and materials for energy efficiency and overall speed and performance of chips for AI and other applications (“Nanotech Powers On-Chip Intelligence” 2025).
i = more than 50% of the estimate is a combination of imputation and reweighting to account for nonresponse.
NAICS = 2017 North American Industry Classification System.
Data are for companies with 10 or more domestic employees. Detail may not add to total because of rounding. Industry classification is based on the dominant business code for domestic R&D performance, where available. For companies that did not report business codes, the classification used for sampling was assigned. Companies could report R&D in one, more than one, or no application area.
National Center for Science and Engineering Statistics and Census Bureau, Business Enterprise Research and Development (BERD) Survey, 2022.
Science and Engineering Indicators
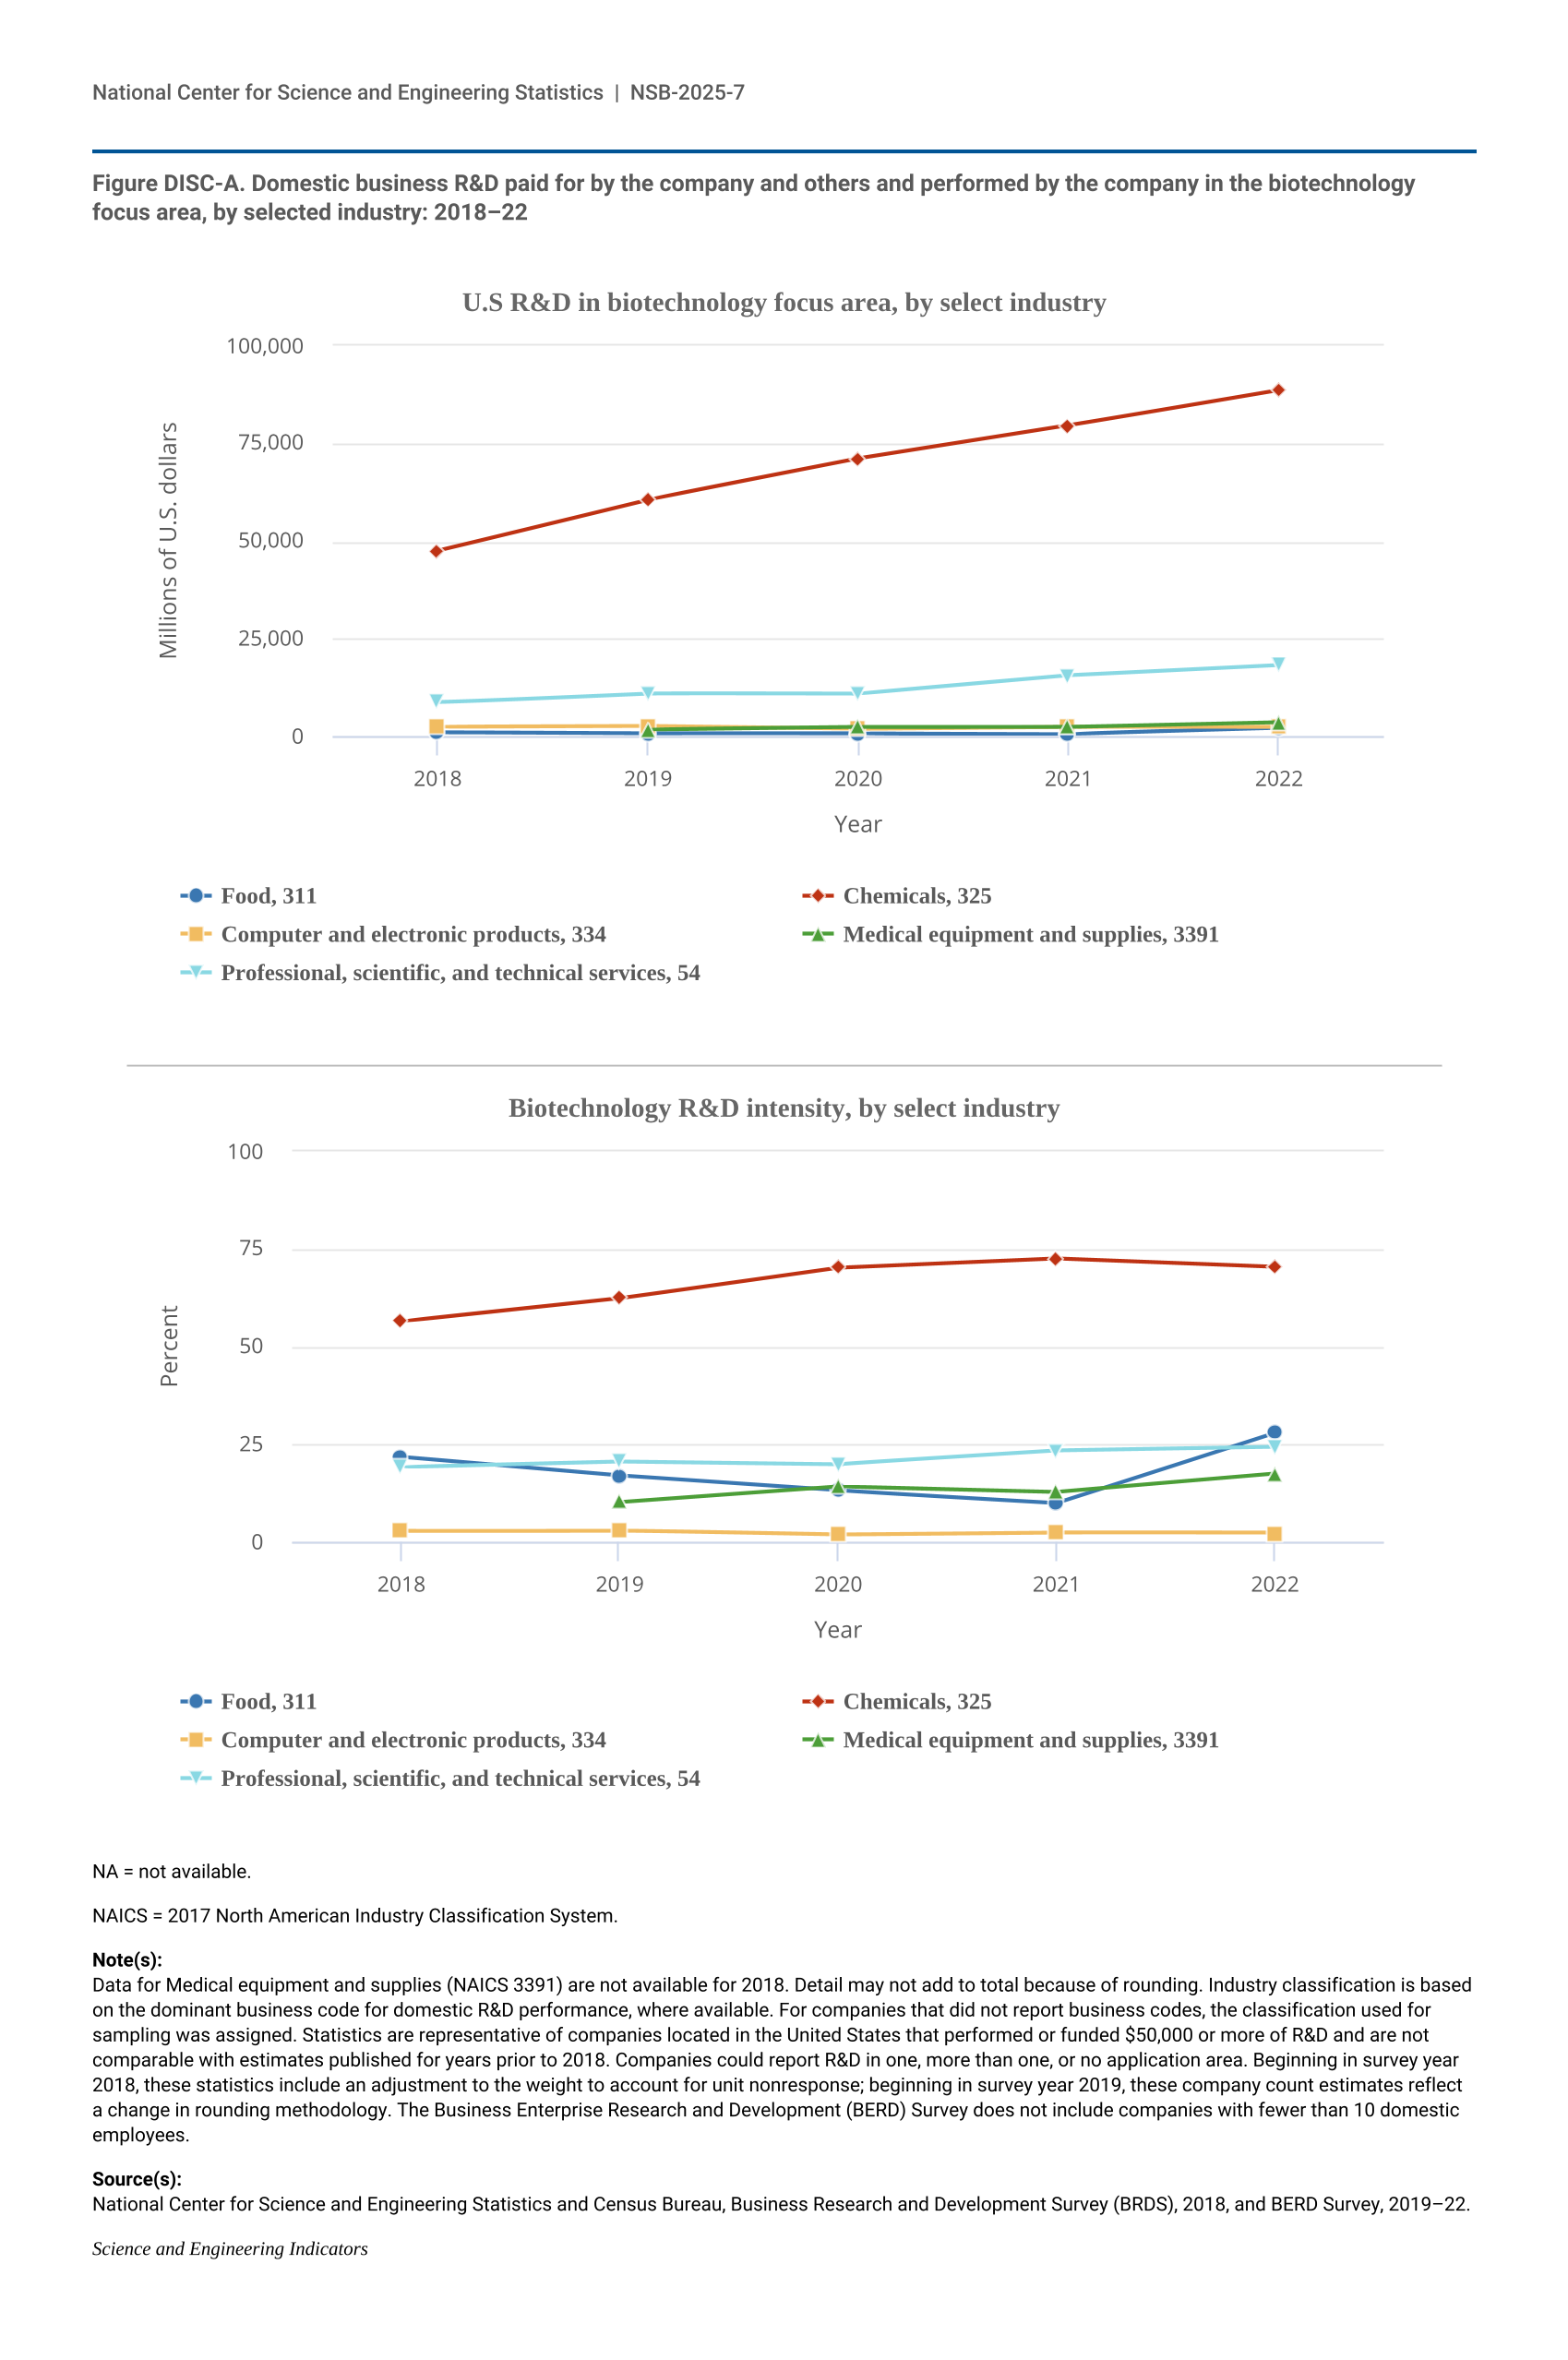
Lastly, biotechnology is a separate technology focus area, prominent in industries related to the life sciences and the bioeconomy (CRS 2022a; White House 2025). Biotechnology business R&D accounted for 17% of total U.S. business R&D in 2022. Three-fourths (75%) of biotechnology-focused R&D was performed within pharmaceuticals and medicine manufacturing (North American Industry Classification System [NAICS] 3254).