 An official website of the United States government
 Academic R&D
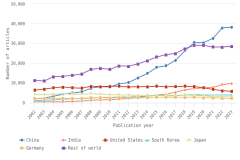
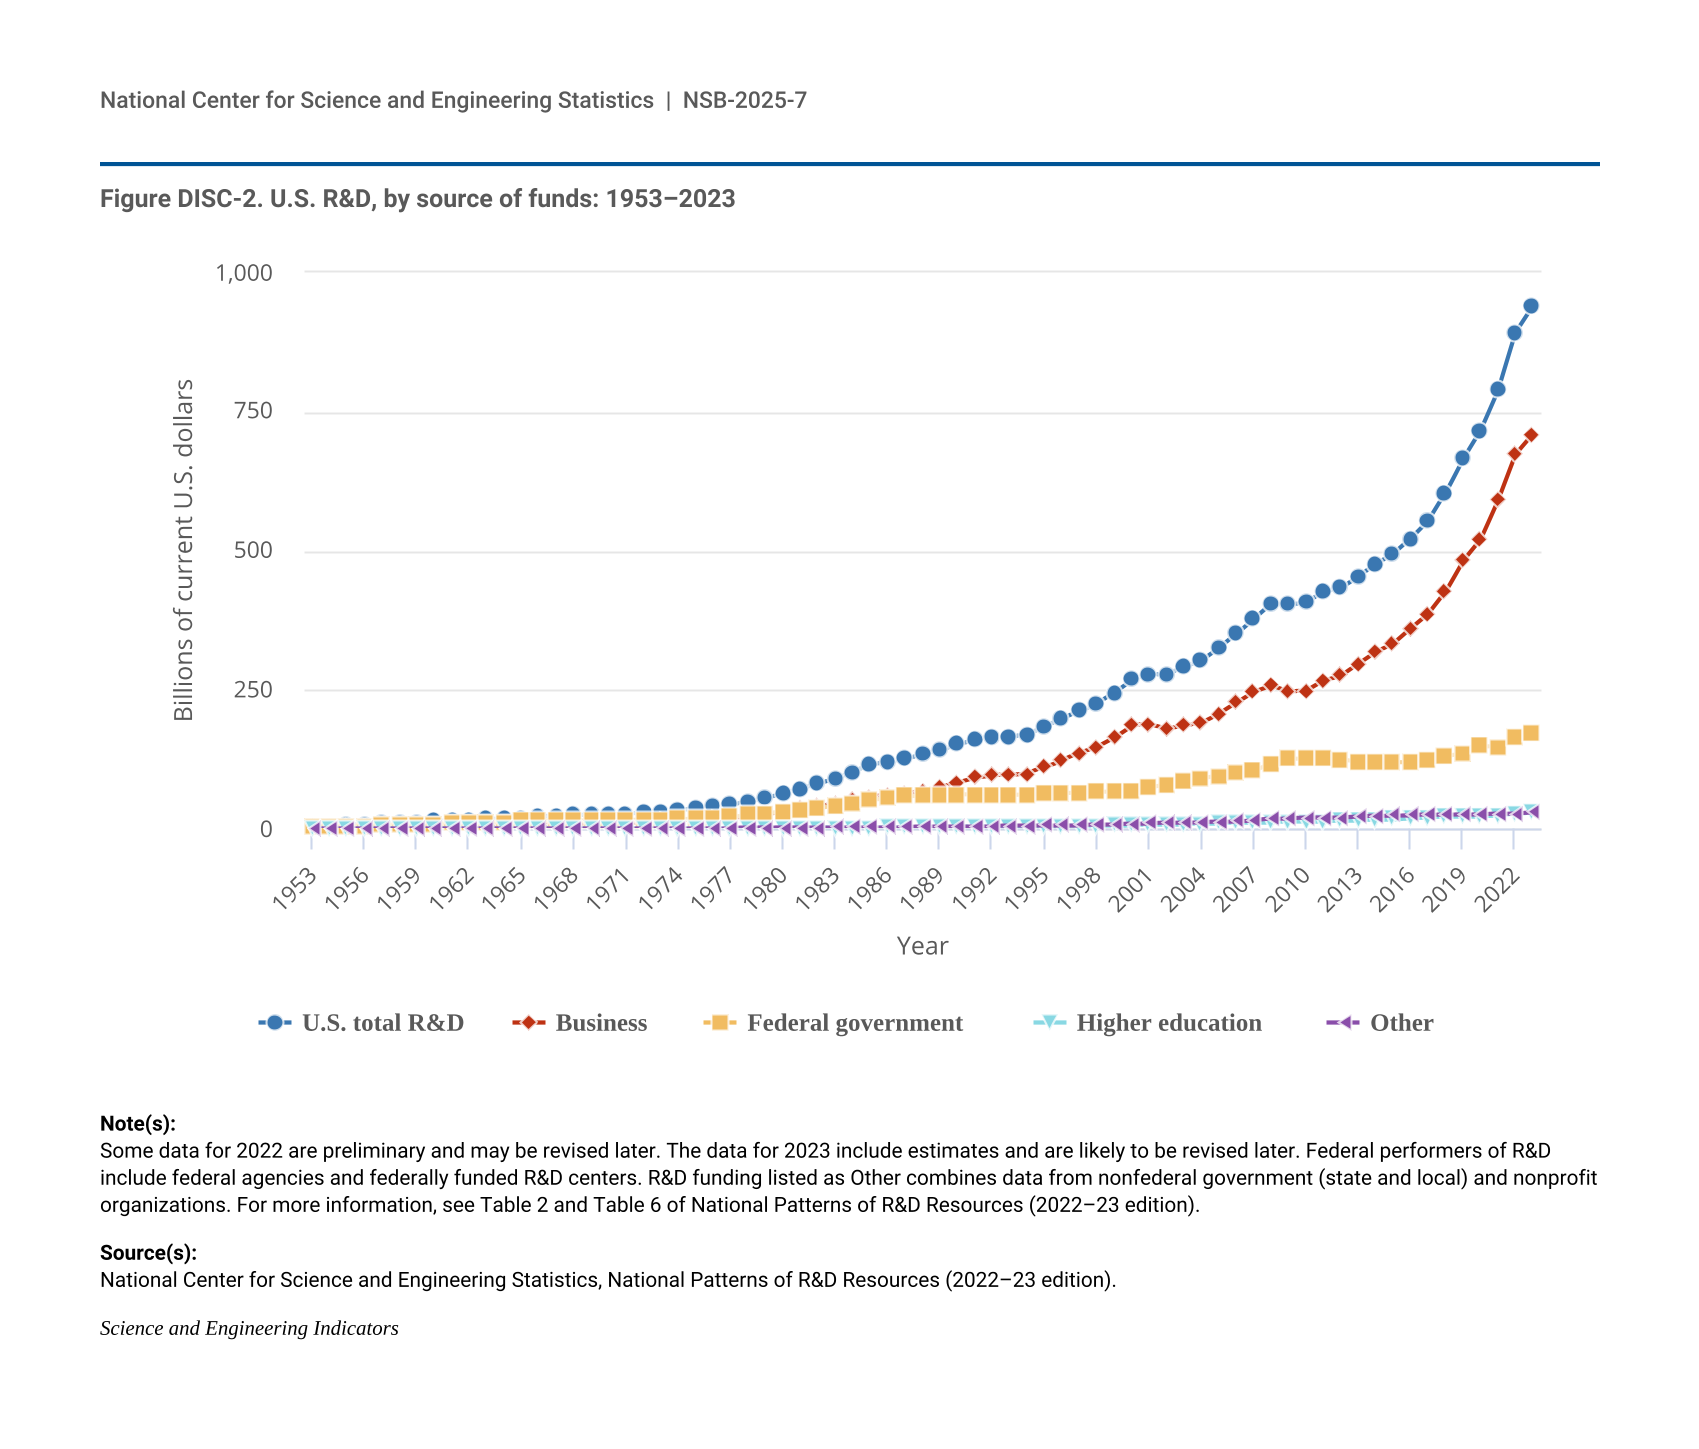
Many academic institutions balance both an educational mandate and a capacity for original research, performing a large share of R&D, funded either internally, using the institution’s own funds, or externally. Academic R&D pursues research topics that contribute to public knowledge through peer-reviewed articles (see the section Publication Output by Geography and Scientific Field) and other research outputs, to education and workforce development (see the Indicators 2026 report “STEM Talent: Education, Training, and Workforce” [NSB forthcoming]), and to downstream innovation activities such as patents, technology licensing, and the formation of new companies (see the Indicators 2026 report “Translation to Impact: U.S. and Global Science, Technology, and Innovation Output” [NSB forthcoming]).
Higher education institutions expend R&D funding either on performance within the higher education sector or in other sectors. Academic R&D expenditures increased by $11.0 billion in FY 2023 to $108.8 billion (Gibbons 2024a; NCSES HERD 2023: Table 1). Physical infrastructure, in terms of research space at U.S. academic institutions, grew by 4 million square feet from FY 2021 to FY 2023, reaching 240.2 million square feet (Gibbons 2024b).
Funding Sources of Academic R&D
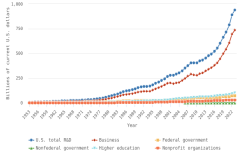
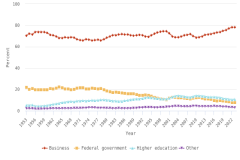
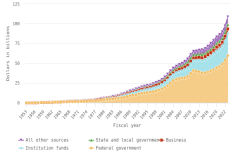
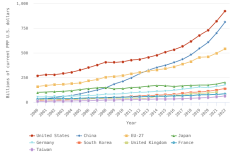
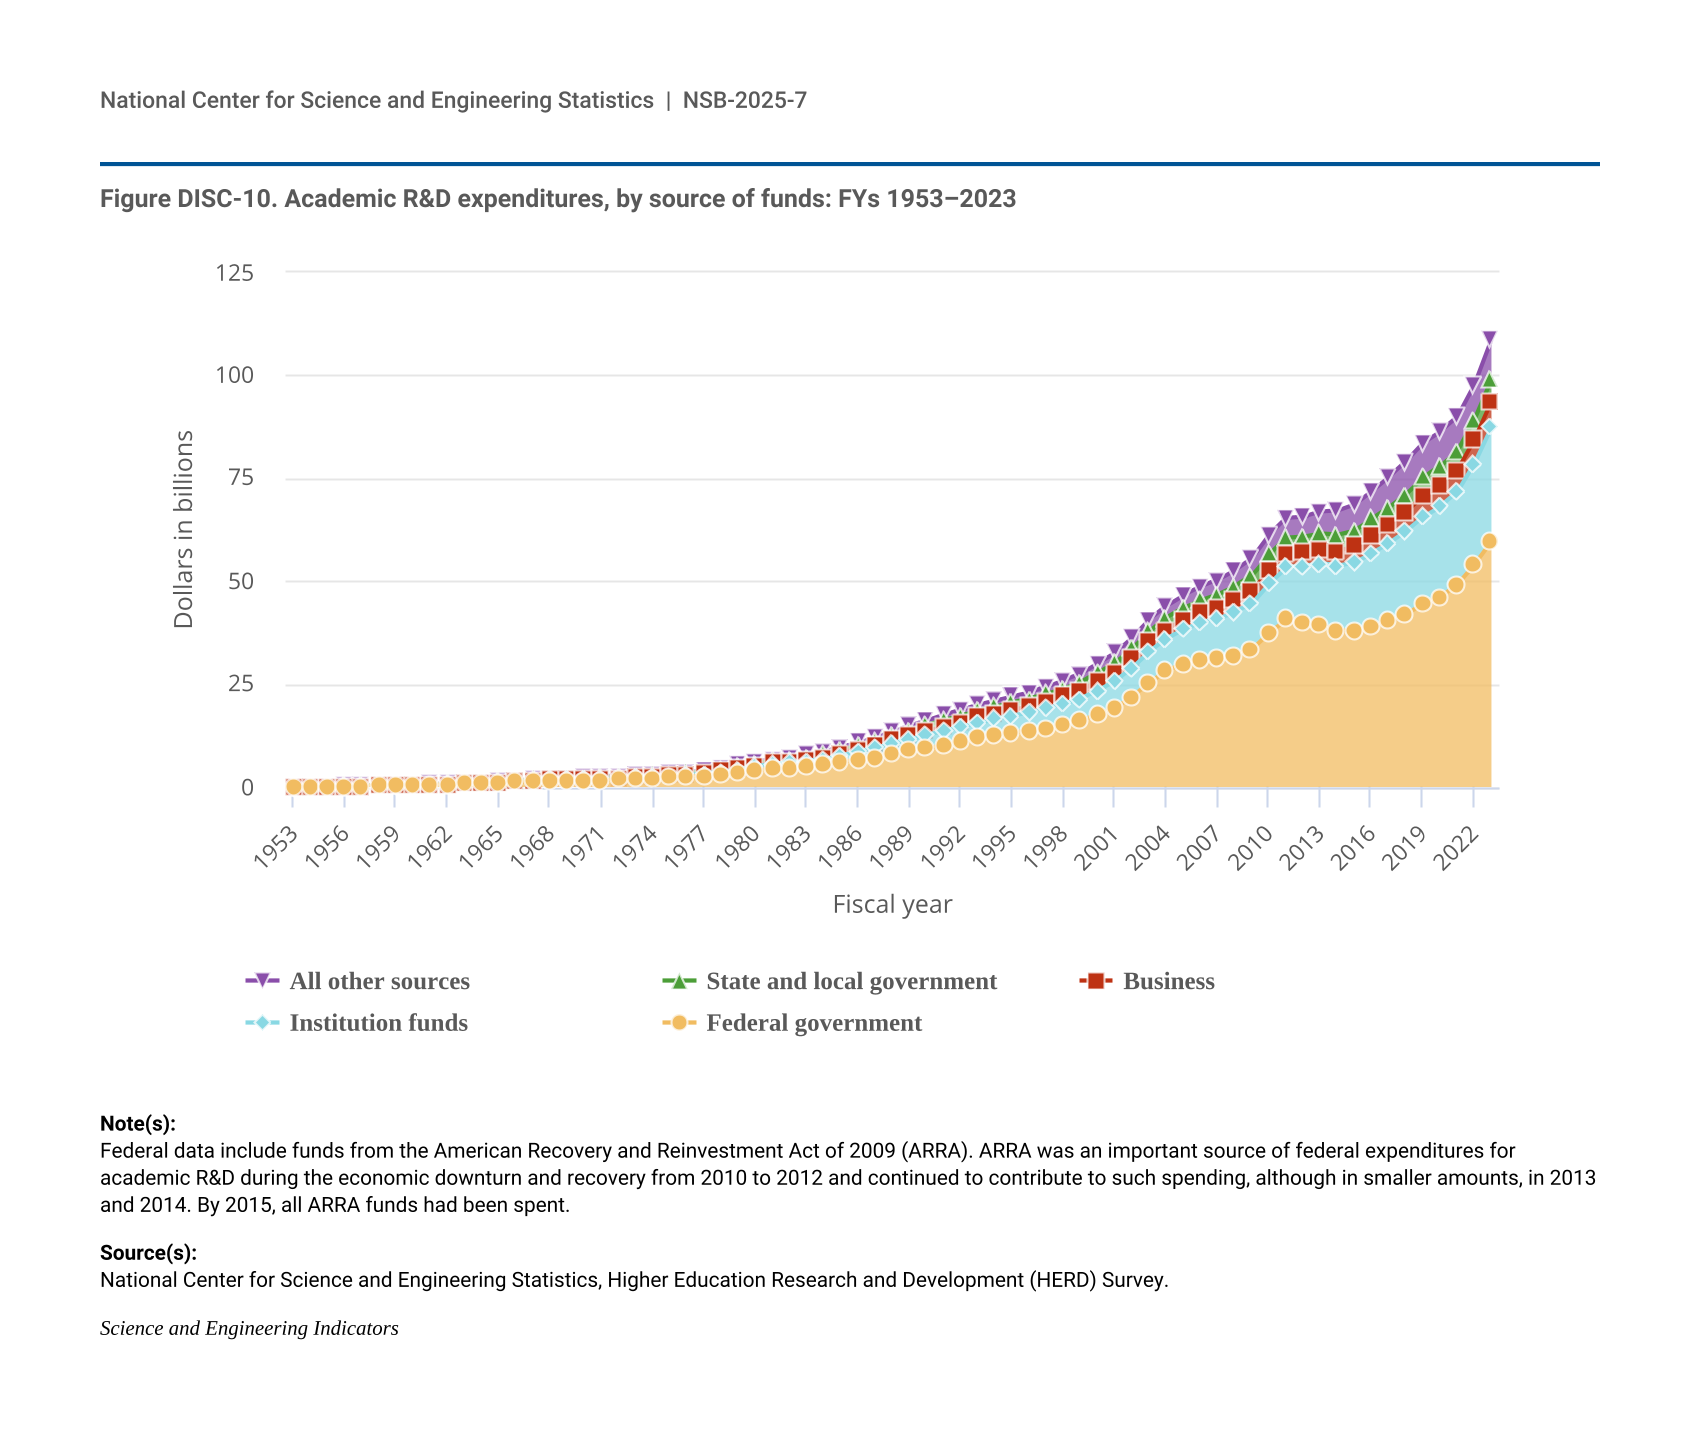
The federal government remains the main driver of academic R&D, funding 55% ($59.7 billion of the total $108.8 billion) of expenditures in 2023. Academic institutions’ own funds were the second-largest source of academic R&D at $27.7 billion (25% of total) (Figure DISC-10). Six agencies provided 93% of federal funds supporting academic R&D in FY 2023 (Table DISC-6). The U.S. Department of Health and Human Services (HHS), which includes the National Institutes of Health, was the largest source, providing 56% of federal agency support for academic R&D in FY 2023. The Department of Defense (DOD) and NSF combined accounted for over a quarter of federal support for academic R&D (at 15% and 11%, respectively).
| Fiscal year | Federal government | Institution funds | Business | State and local government | All other sources |
|---|---|---|---|---|---|
| 1953 | 0.1 | 0.0 | 0.0 | 0.0 | 0.0 |
| 1954 | 0.2 | 0.0 | 0.0 | 0.0 | 0.0 |
| 1955 | 0.2 | 0.0 | 0.0 | 0.0 | 0.0 |
| 1956 | 0.2 | 0.0 | 0.0 | 0.1 | 0.0 |
| 1957 | 0.2 | 0.0 | 0.0 | 0.1 | 0.0 |
| 1958 | 0.3 | 0.1 | 0.0 | 0.1 | 0.0 |
| 1959 | 0.3 | 0.1 | 0.0 | 0.1 | 0.0 |
| 1960 | 0.4 | 0.1 | 0.0 | 0.1 | 0.1 |
| 1961 | 0.5 | 0.1 | 0.0 | 0.1 | 0.1 |
| 1962 | 0.6 | 0.1 | 0.0 | 0.1 | 0.1 |
| 1963 | 0.8 | 0.1 | 0.0 | 0.1 | 0.1 |
| 1964 | 0.9 | 0.1 | 0.0 | 0.1 | 0.1 |
| 1965 | 1.1 | 0.1 | 0.0 | 0.1 | 0.1 |
| 1966 | 1.3 | 0.1 | 0.0 | 0.2 | 0.1 |
| 1967 | 1.4 | 0.2 | 0.0 | 0.2 | 0.1 |
| 1968 | 1.6 | 0.2 | 0.1 | 0.2 | 0.1 |
| 1969 | 1.6 | 0.2 | 0.1 | 0.2 | 0.1 |
| 1970 | 1.6 | 0.2 | 0.1 | 0.2 | 0.2 |
| 1971 | 1.7 | 0.3 | 0.1 | 0.3 | 0.2 |
| 1972 | 1.8 | 0.3 | 0.1 | 0.3 | 0.2 |
| 1973 | 2.0 | 0.3 | 0.1 | 0.3 | 0.2 |
| 1974 | 2.0 | 0.4 | 0.1 | 0.3 | 0.2 |
| 1975 | 2.3 | 0.4 | 0.1 | 0.3 | 0.3 |
| 1976 | 2.5 | 0.4 | 0.1 | 0.4 | 0.3 |
| 1977 | 2.7 | 0.5 | 0.1 | 0.4 | 0.3 |
| 1978 | 3.1 | 0.6 | 0.2 | 0.4 | 0.4 |
| 1979 | 3.6 | 0.7 | 0.2 | 0.5 | 0.4 |
| 1980 | 4.1 | 0.8 | 0.2 | 0.5 | 0.4 |
| 1981 | 4.6 | 1.0 | 0.3 | 0.5 | 0.4 |
| 1982 | 4.8 | 1.1 | 0.3 | 0.6 | 0.5 |
| 1983 | 5.0 | 1.3 | 0.4 | 0.6 | 0.6 |
| 1984 | 5.4 | 1.4 | 0.5 | 0.7 | 0.6 |
| 1985 | 6.1 | 1.6 | 0.6 | 0.8 | 0.7 |
| 1986 | 6.7 | 1.9 | 0.7 | 0.9 | 0.7 |
| 1987 | 7.3 | 2.2 | 0.8 | 1.0 | 0.8 |
| 1988 | 8.2 | 2.4 | 0.9 | 1.1 | 0.9 |
| 1989 | 9.0 | 2.7 | 1.0 | 1.2 | 1.1 |
| 1990 | 9.6 | 3.0 | 1.1 | 1.3 | 1.2 |
| 1991 | 10.2 | 3.4 | 1.2 | 1.5 | 1.3 |
| 1992 | 11.1 | 3.5 | 1.3 | 1.5 | 1.4 |
| 1993 | 12.0 | 3.6 | 1.4 | 1.6 | 1.5 |
| 1994 | 12.7 | 3.8 | 1.4 | 1.6 | 1.6 |
| 1995 | 13.3 | 4.0 | 1.5 | 1.7 | 1.6 |
| 1996 | 13.8 | 4.2 | 1.6 | 1.8 | 1.6 |
| 1997 | 14.3 | 4.7 | 1.7 | 1.9 | 1.7 |
| 1998 | 15.2 | 5.0 | 1.9 | 1.9 | 1.9 |
| 1999 | 16.1 | 5.4 | 2.0 | 2.0 | 2.0 |
| 2000 | 17.5 | 5.9 | 2.2 | 2.2 | 2.3 |
| 2001 | 19.2 | 6.6 | 2.2 | 2.3 | 2.4 |
| 2002 | 21.9 | 7.1 | 2.2 | 2.5 | 2.7 |
| 2003 | 25.3 | 7.7 | 2.2 | 2.6 | 2.9 |
| 2004 | 28.3 | 7.8 | 2.1 | 2.9 | 2.9 |
| 2005 | 30.0 | 8.3 | 2.3 | 2.9 | 3.1 |
| 2006 | 30.9 | 9.1 | 2.4 | 3.0 | 3.2 |
| 2007 | 31.2 | 9.7 | 2.7 | 3.2 | 3.5 |
| 2008 | 32.1 | 10.4 | 2.9 | 3.4 | 3.9 |
| 2009 | 33.4 | 11.1 | 3.2 | 3.6 | 4.3 |
| 2010 | 37.5 | 11.9 | 3.2 | 3.9 | 4.8 |
| 2011 | 40.8 | 12.6 | 3.2 | 3.9 | 4.9 |
| 2012 | 40.2 | 13.6 | 3.3 | 3.7 | 5.0 |
| 2013 | 39.5 | 14.9 | 3.5 | 3.7 | 5.4 |
| 2014 | 38.0 | 15.7 | 3.7 | 3.9 | 5.9 |
| 2015 | 37.9 | 16.6 | 4.0 | 3.9 | 6.3 |
| 2016 | 38.9 | 17.9 | 4.2 | 4.1 | 6.8 |
| 2017 | 40.3 | 18.9 | 4.4 | 4.2 | 7.5 |
| 2018 | 41.9 | 20.2 | 4.7 | 4.3 | 8.0 |
| 2019 | 44.5 | 21.1 | 5.1 | 4.5 | 8.4 |
| 2020 | 46.2 | 22.0 | 5.2 | 4.6 | 8.4 |
| 2021 | 49.2 | 22.5 | 5.1 | 4.8 | 8.3 |
| 2022 | 54.1 | 24.5 | 5.7 | 4.9 | 8.6 |
| 2023 | 59.7 | 27.7 | 6.2 | 5.4 | 9.8 |
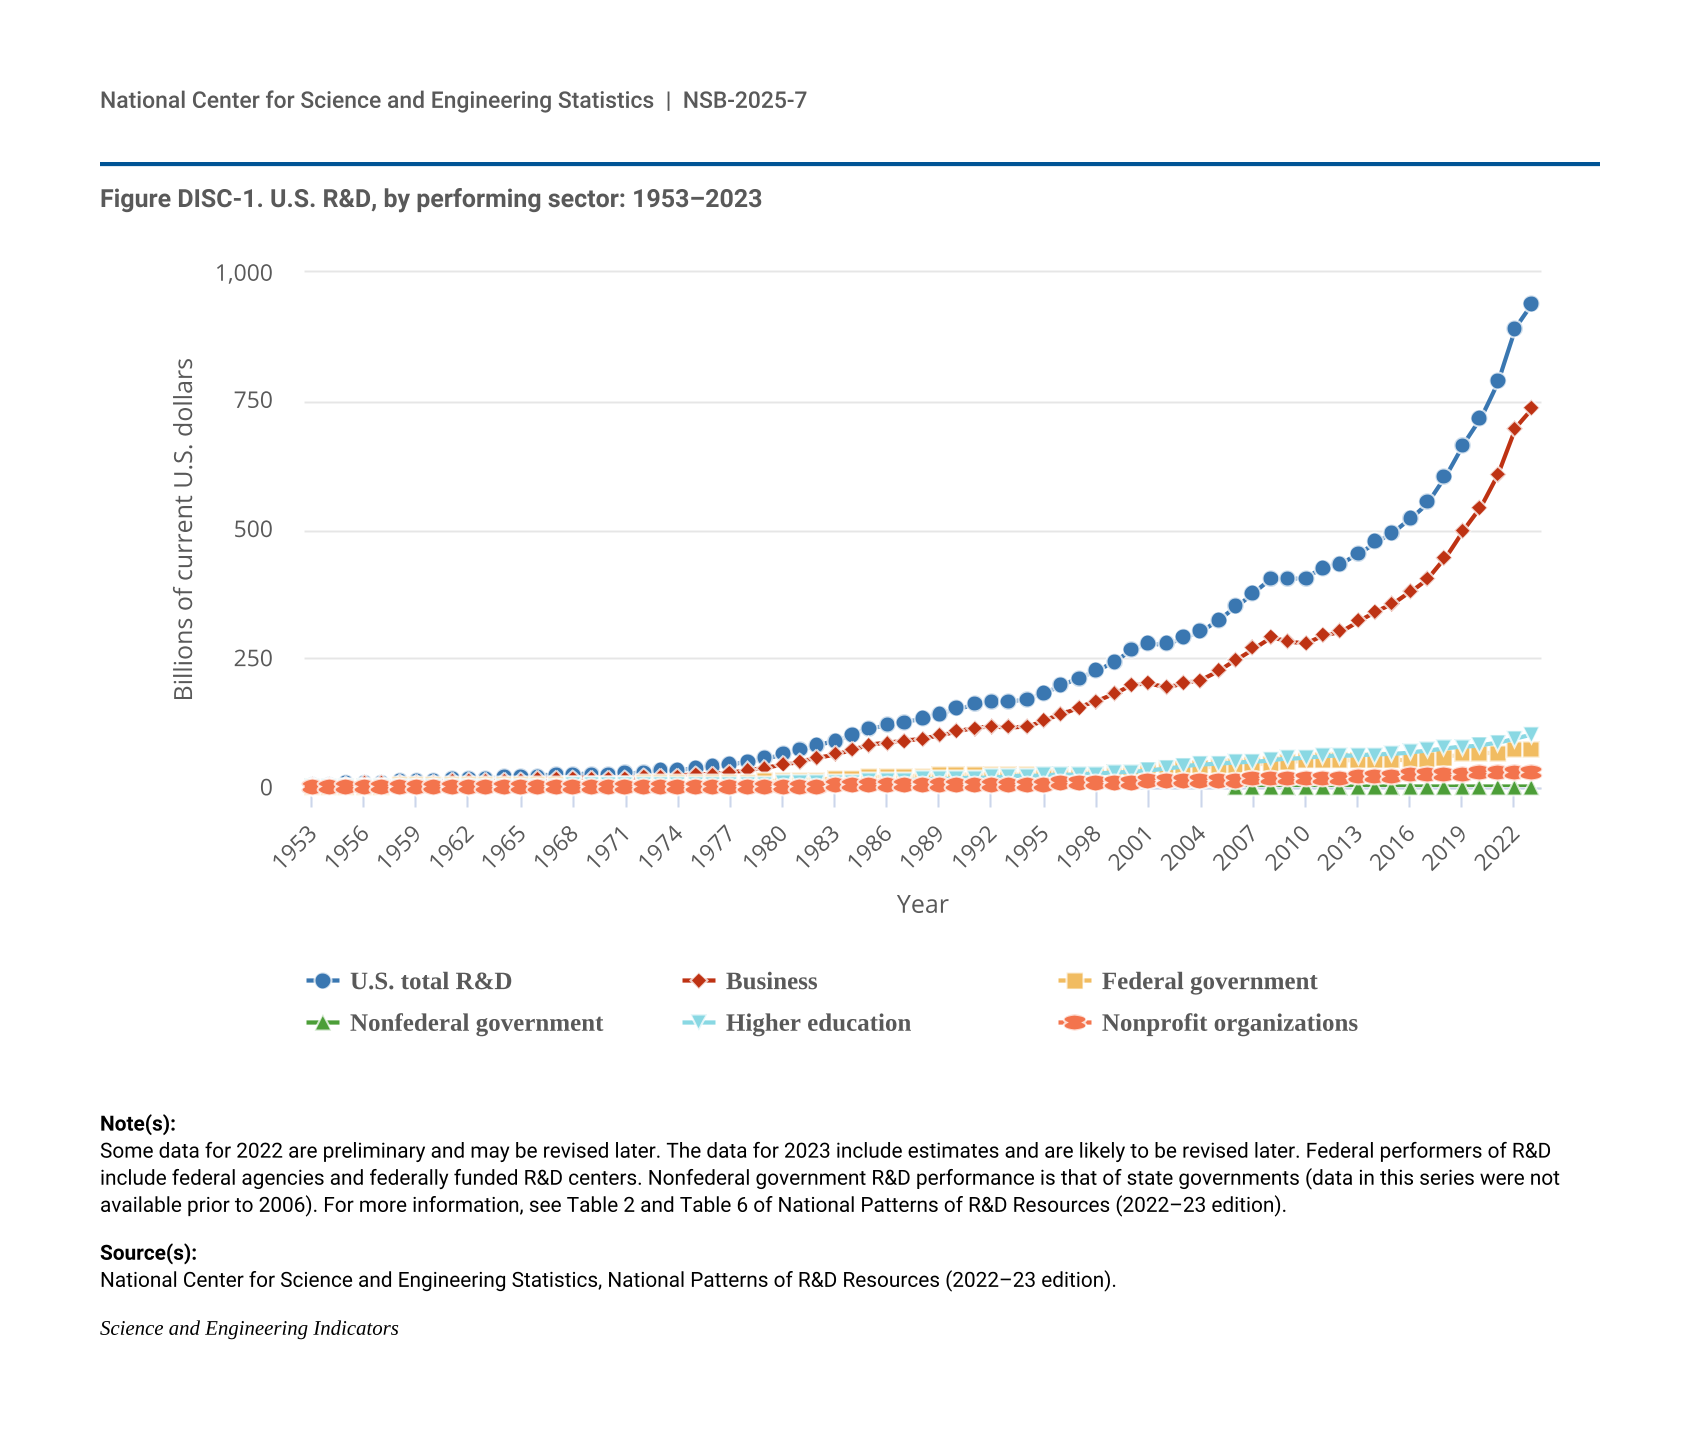
Federal data include funds from the American Recovery and Reinvestment Act of 2009 (ARRA). ARRA was an important source of federal expenditures for academic R&D during the economic downturn and recovery from 2010 to 2012 and continued to contribute to such spending, although in smaller amounts, in 2013 and 2014. By 2015, all ARRA funds had been spent.
National Center for Science and Engineering Statistics, Higher Education Research and Development (HERD) Survey.
Science and Engineering Indicators
DOD = Department of Defense; DOE = Department of Energy; HHS = Department of Health and Human Services; NASA = National Aeronautics and Space Administration; NSF = National Science Foundation; USDA = Department of Agriculture.
Gross domestic product deflators come from the Bureau of Economic Analysis and are available at https://www.bea.gov/data/gdp/gross-domestic-product (accessed October 2024). This table includes only institutions reporting $1 million or more in total R&D expenditures in 2022. Institutions reporting less than $1 million in total R&D expenditures in 2022 completed a shorter version of the survey form in FY 2023, and that form did not collect federally financed R&D expenditures by source.
National Center for Science and Engineering Statistics, Higher Education Research and Development (HERD) Survey.
Science and Engineering Indicators
Between 2013 and 2023, the share of academic R&D expenditures funded by the federal government dropped from 59% to 55%, while the share funded by academic institutions themselves increased from 22% to 25% (Figure DISC-10). This is partly due to the federal American Reinvestment and Recovery Act (ARRA) funds, which boosted federal funding of academic R&D to a peak in 2011; by 2015, all ARRA funds had been expended. Between 2013 and 2023, businesses and state and local governments each accounted for between 5% and 6% of expenditures, while all other sources combined—including nonprofit organizations, foreign governments, and other universities or gifts from individual donors directed to research funding—funded around 8%–10% of U.S. academic R&D.
Academic R&D by Type of R&D
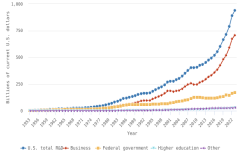
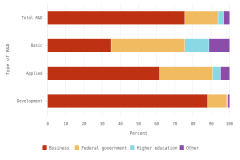
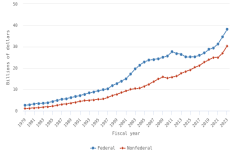
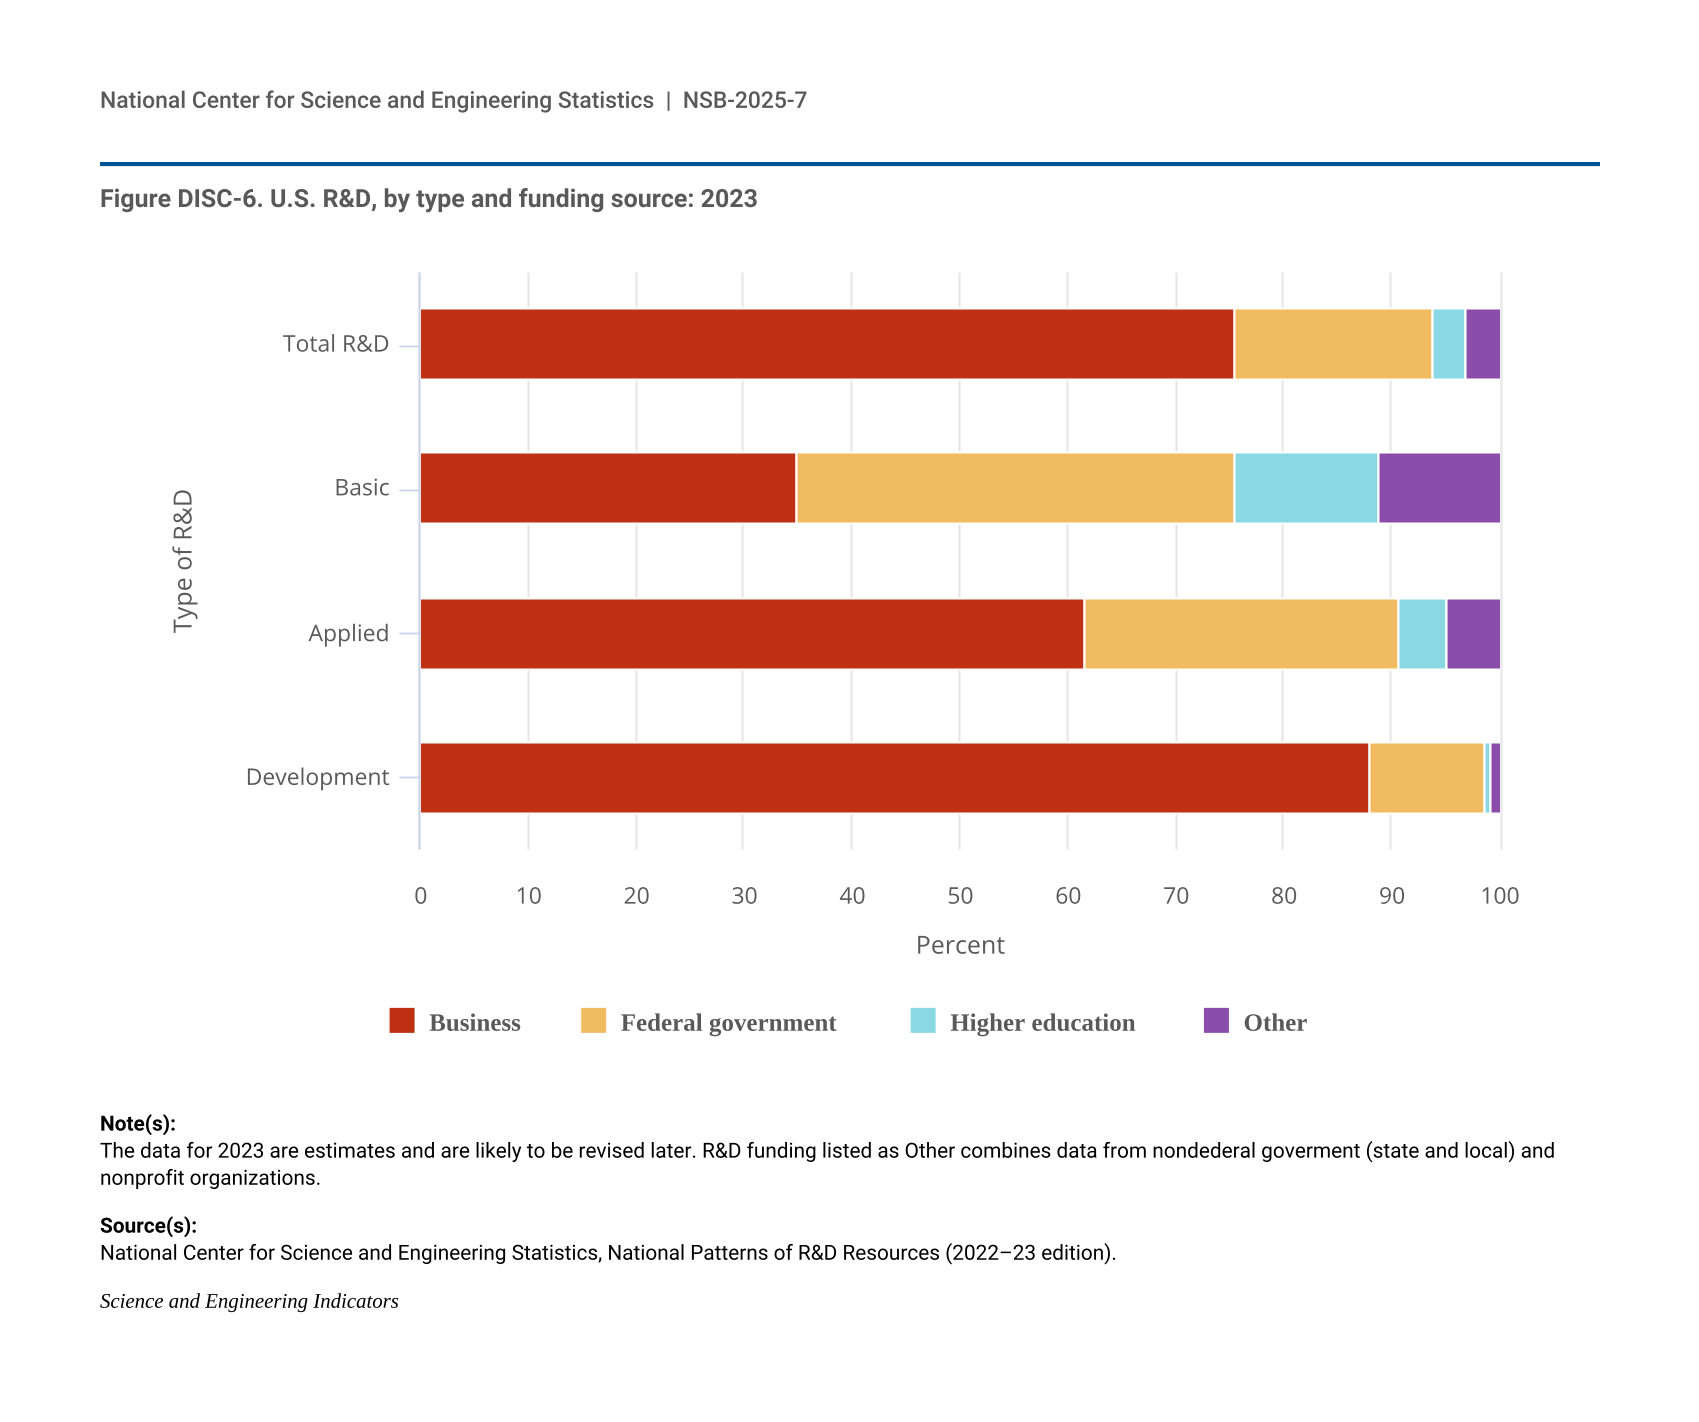
The mission of academic institutions is typically different from other sectors, and this is reflected in the distribution of R&D performed. In contrast to the business sector, the majority of academic R&D expenditures in 2023 were devoted to basic research ($68.5 billion, or 63% of total R&D), followed by applied research ($29.6 billion, or 27%) and by experimental development ($10.6 billion, or 10%). This distribution has been largely stable since at least 2013, when the shares were 66%, 25%, and 9%, respectively (NCSES HERD 2023: Table 9).
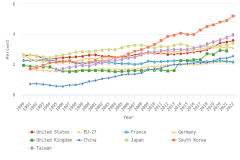
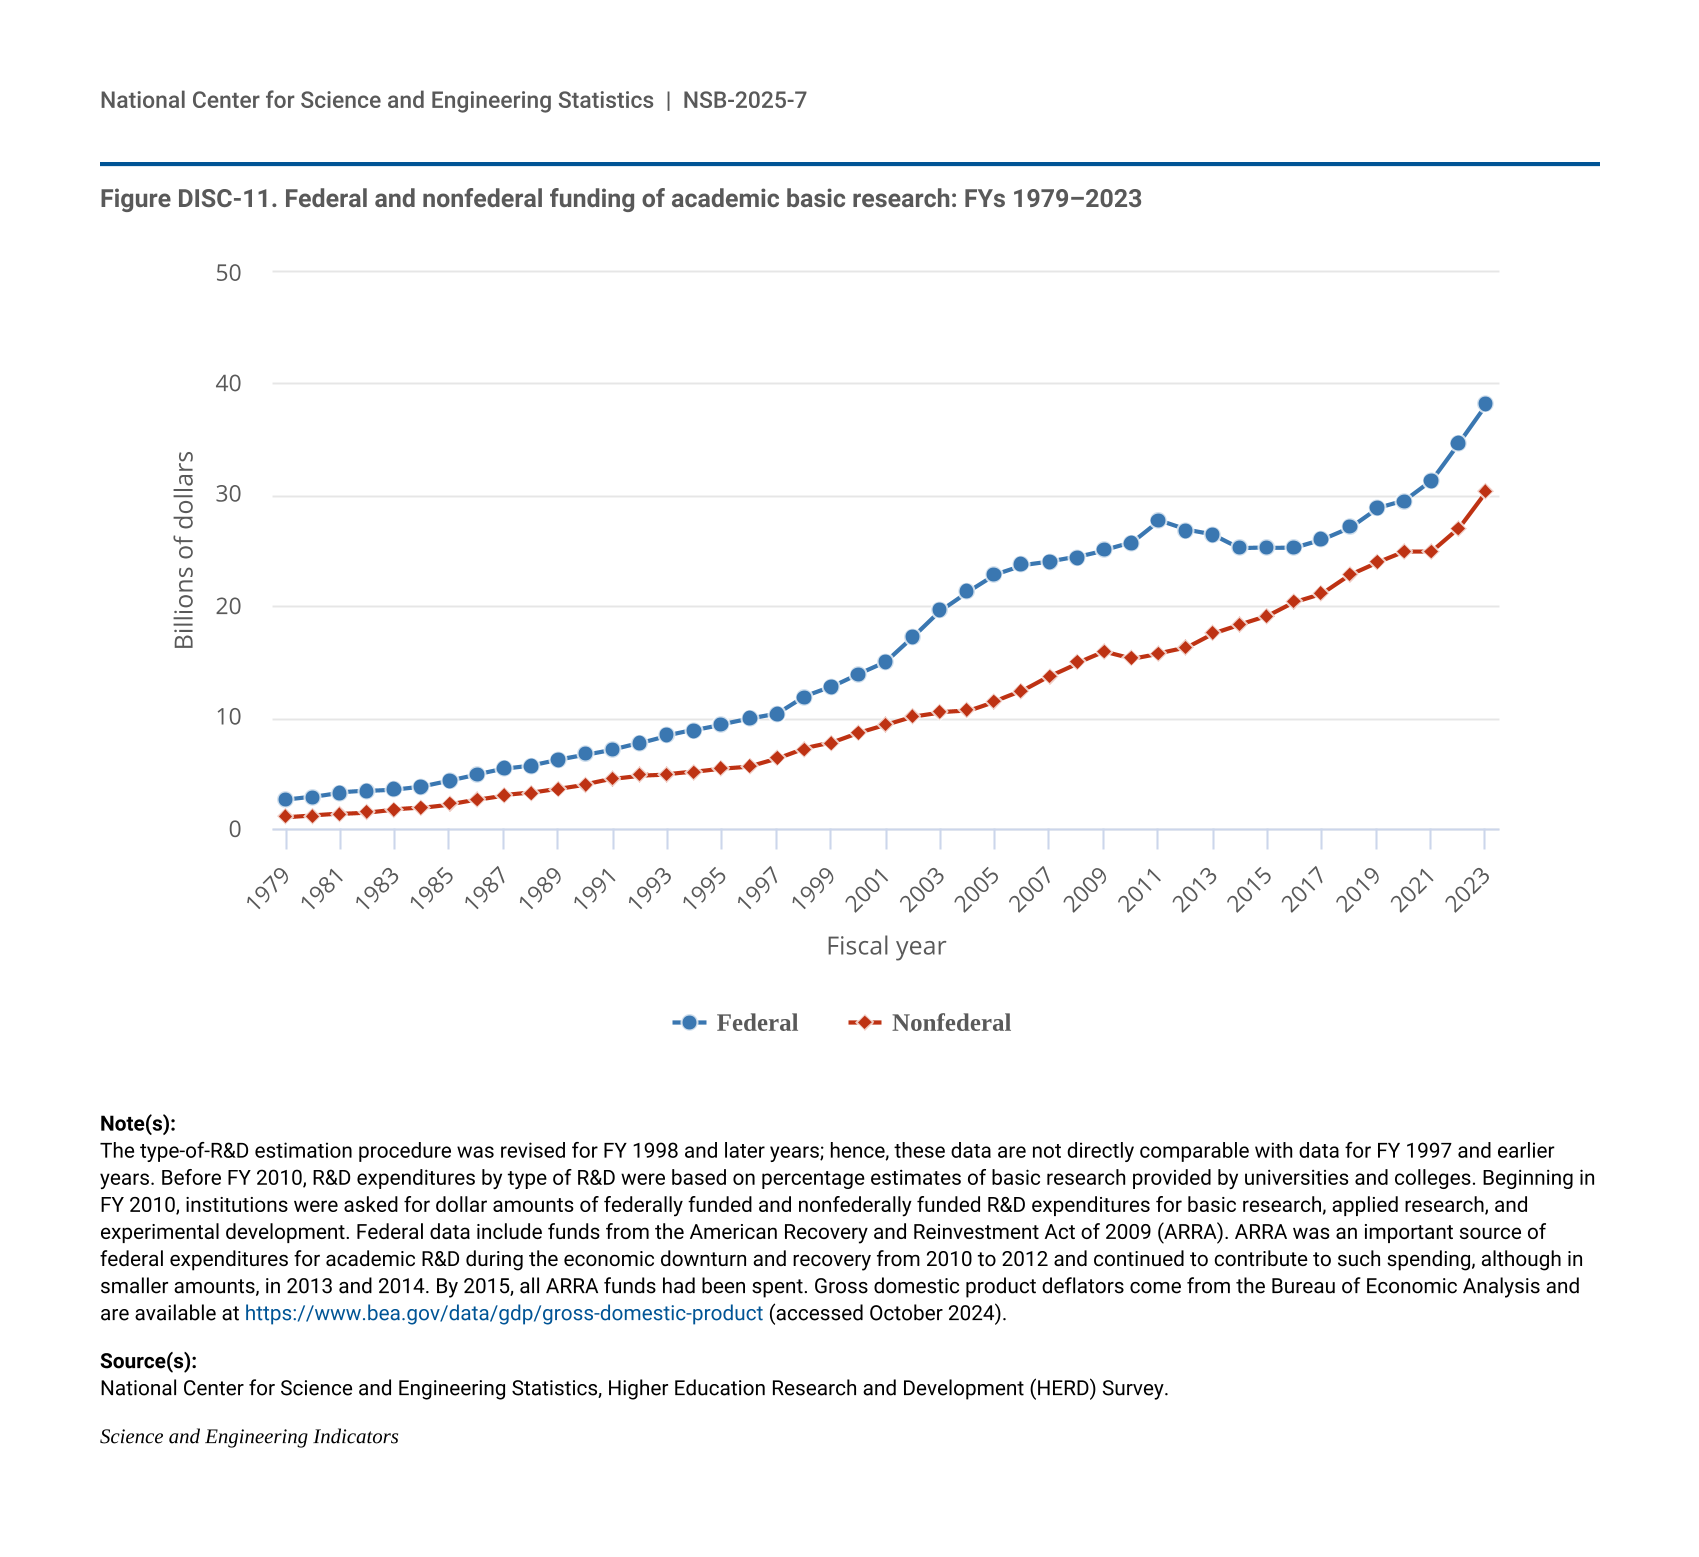
Academic basic research is funded by all sectors. The federal government funded $38.1 billion ($31.2 billion in constant dollars) in academic basic research in 2023, a 10% increase from 2022 (6% increase in constant dollars) (Figure DISC-11; Table SDISC-1). Further, between 2018 and 2023, the CAGR for academic basic research funded by the federal government was 3% in constant dollars. Academic basic research funded by nonfederal sources increased from $27.1 billion in 2022 to $30.3 billion in 2023 (from $22.9 billion to $24.8 billion in constant dollars), a 12% increase (8% increase in constant dollars). From 2018 to 2023, the CAGR of academic basic research funded by nonfederal sources was 2% in constant dollars.
| Fiscal year | Federal | Nonfederal |
|---|---|---|
| 1979 | 2.58 | 1.04 |
| 1980 | 2.86 | 1.18 |
| 1981 | 3.26 | 1.33 |
| 1982 | 3.40 | 1.48 |
| 1983 | 3.55 | 1.76 |
| 1984 | 3.83 | 1.90 |
| 1985 | 4.34 | 2.21 |
| 1986 | 4.87 | 2.62 |
| 1987 | 5.38 | 3.02 |
| 1988 | 5.68 | 3.22 |
| 1989 | 6.20 | 3.60 |
| 1990 | 6.65 | 4.00 |
| 1991 | 7.13 | 4.48 |
| 1992 | 7.72 | 4.80 |
| 1993 | 8.40 | 4.91 |
| 1994 | 8.88 | 5.11 |
| 1995 | 9.40 | 5.41 |
| 1996 | 9.87 | 5.61 |
| 1997 | 10.32 | 6.29 |
| 1998 | 11.86 | 7.20 |
| 1999 | 12.75 | 7.70 |
| 2000 | 13.94 | 8.61 |
| 2001 | 15.04 | 9.35 |
| 2002 | 17.26 | 10.10 |
| 2003 | 19.63 | 10.48 |
| 2004 | 21.35 | 10.60 |
| 2005 | 22.89 | 11.47 |
| 2006 | 23.70 | 12.39 |
| 2007 | 24.00 | 13.73 |
| 2008 | 24.43 | 14.89 |
| 2009 | 25.03 | 15.89 |
| 2010 | 25.68 | 15.27 |
| 2011 | 27.68 | 15.78 |
| 2012 | 26.85 | 16.27 |
| 2013 | 26.41 | 17.57 |
| 2014 | 25.21 | 18.38 |
| 2015 | 25.24 | 19.14 |
| 2016 | 25.30 | 20.40 |
| 2017 | 26.02 | 21.18 |
| 2018 | 27.07 | 22.82 |
| 2019 | 28.80 | 23.93 |
| 2020 | 29.46 | 24.92 |
| 2021 | 31.30 | 24.93 |
| 2022 | 34.69 | 27.05 |
| 2023 | 38.13 | 30.34 |
The type-of-R&D estimation procedure was revised for FY 1998 and later years; hence, these data are not directly comparable with data for FY 1997 and earlier years. Before FY 2010, R&D expenditures by type of R&D were based on percentage estimates of basic research provided by universities and colleges. Beginning in FY 2010, institutions were asked for dollar amounts of federally funded and nonfederally funded R&D expenditures for basic research, applied research, and experimental development. Federal data include funds from the American Recovery and Reinvestment Act of 2009 (ARRA). ARRA was an important source of federal expenditures for academic R&D during the economic downturn and recovery from 2010 to 2012 and continued to contribute to such spending, although in smaller amounts, in 2013 and 2014. By 2015, all ARRA funds had been spent. Gross domestic product deflators come from the Bureau of Economic Analysis and are available at https://www.bea.gov/data/gdp/gross-domestic-product (accessed October 2024).
National Center for Science and Engineering Statistics, Higher Education Research and Development (HERD) Survey.
Science and Engineering Indicators
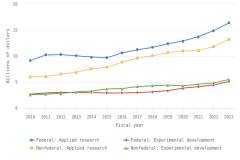
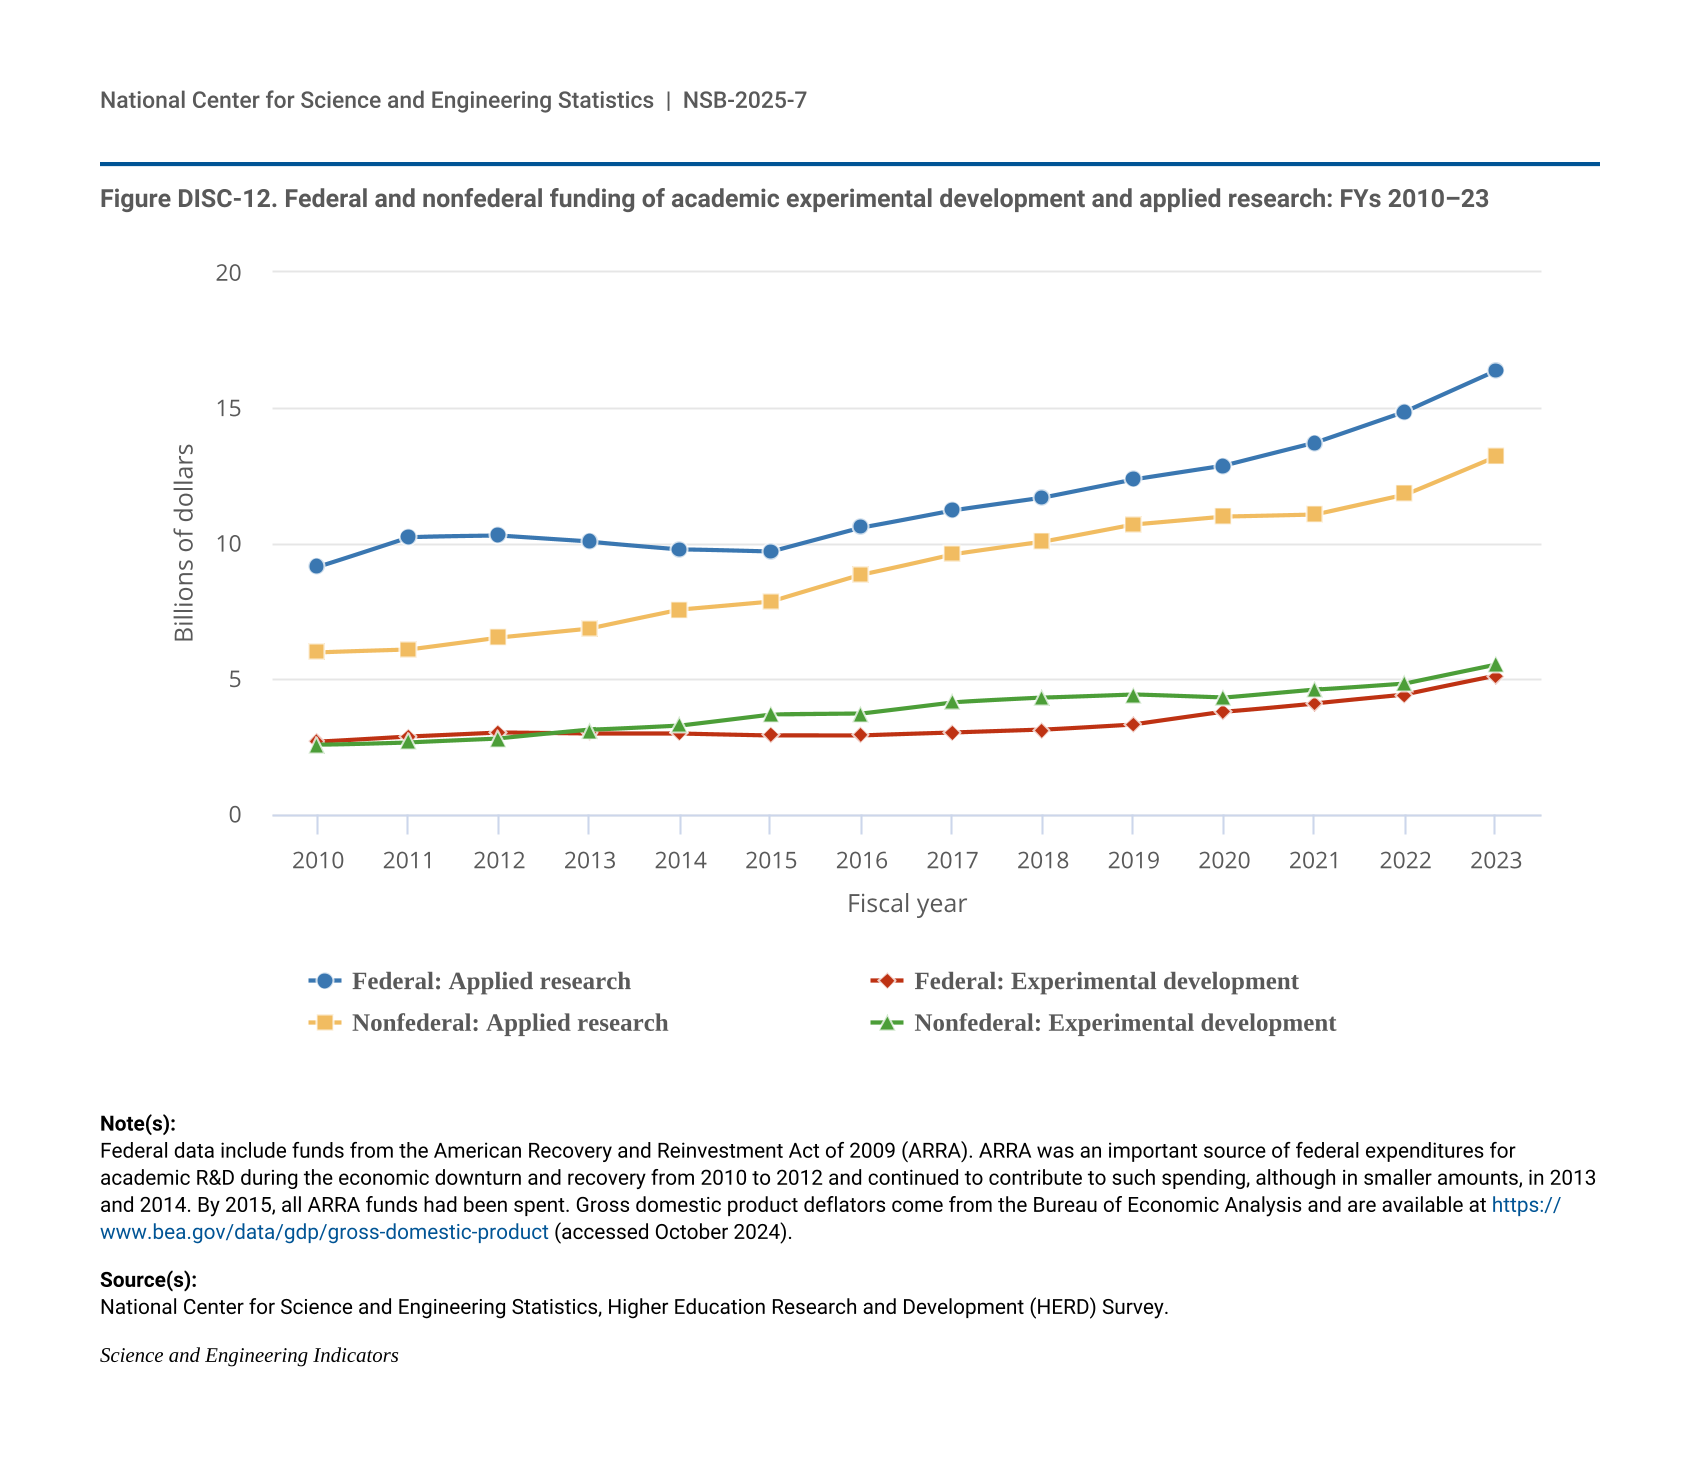
In 2023, federal funding for academic applied research reached $16.4 billion, and nonfederal funding for academic applied research reached $13.2 billion (Figure DISC-12; Table SDISC-1). Since 2018, federally funded applied research and experimental development at academic institutions grew at a CAGR of 3% and 7% in constant dollars, respectively. Nonfederal funding for academic applied research and experimental development grew at a CAGR of 2% and 1% in constant dollars, respectively, over the same period.
| Fiscal year | Federal: Applied research | Federal: Experimental development | Nonfederal: Applied research | Nonfederal: Experimental development |
|---|---|---|---|---|
| 2010 | 9.13 | 2.67 | 5.97 | 2.56 |
| 2011 | 10.23 | 2.87 | 6.07 | 2.66 |
| 2012 | 10.27 | 3.02 | 6.52 | 2.80 |
| 2013 | 10.05 | 2.98 | 6.85 | 3.11 |
| 2014 | 9.78 | 2.98 | 7.54 | 3.28 |
| 2015 | 9.69 | 2.91 | 7.84 | 3.69 |
| 2016 | 10.58 | 2.90 | 8.83 | 3.72 |
| 2017 | 11.22 | 3.00 | 9.59 | 4.13 |
| 2018 | 11.69 | 3.11 | 10.05 | 4.29 |
| 2019 | 12.36 | 3.31 | 10.69 | 4.41 |
| 2020 | 12.87 | 3.78 | 10.99 | 4.29 |
| 2021 | 13.71 | 4.10 | 11.07 | 4.59 |
| 2022 | 14.87 | 4.42 | 11.81 | 4.83 |
| 2023 | 16.37 | 5.10 | 13.22 | 5.52 |
Federal data include funds from the American Recovery and Reinvestment Act of 2009 (ARRA). ARRA was an important source of federal expenditures for academic R&D during the economic downturn and recovery from 2010 to 2012 and continued to contribute to such spending, although in smaller amounts, in 2013 and 2014. By 2015, all ARRA funds had been spent. Gross domestic product deflators come from the Bureau of Economic Analysis and are available at https://www.bea.gov/data/gdp/gross-domestic-product (accessed October 2024).
National Center for Science and Engineering Statistics, Higher Education Research and Development (HERD) Survey.
Science and Engineering Indicators
Academic R&D by S&E Field
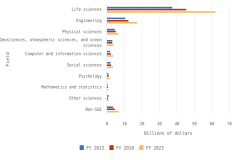
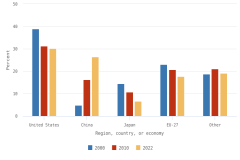
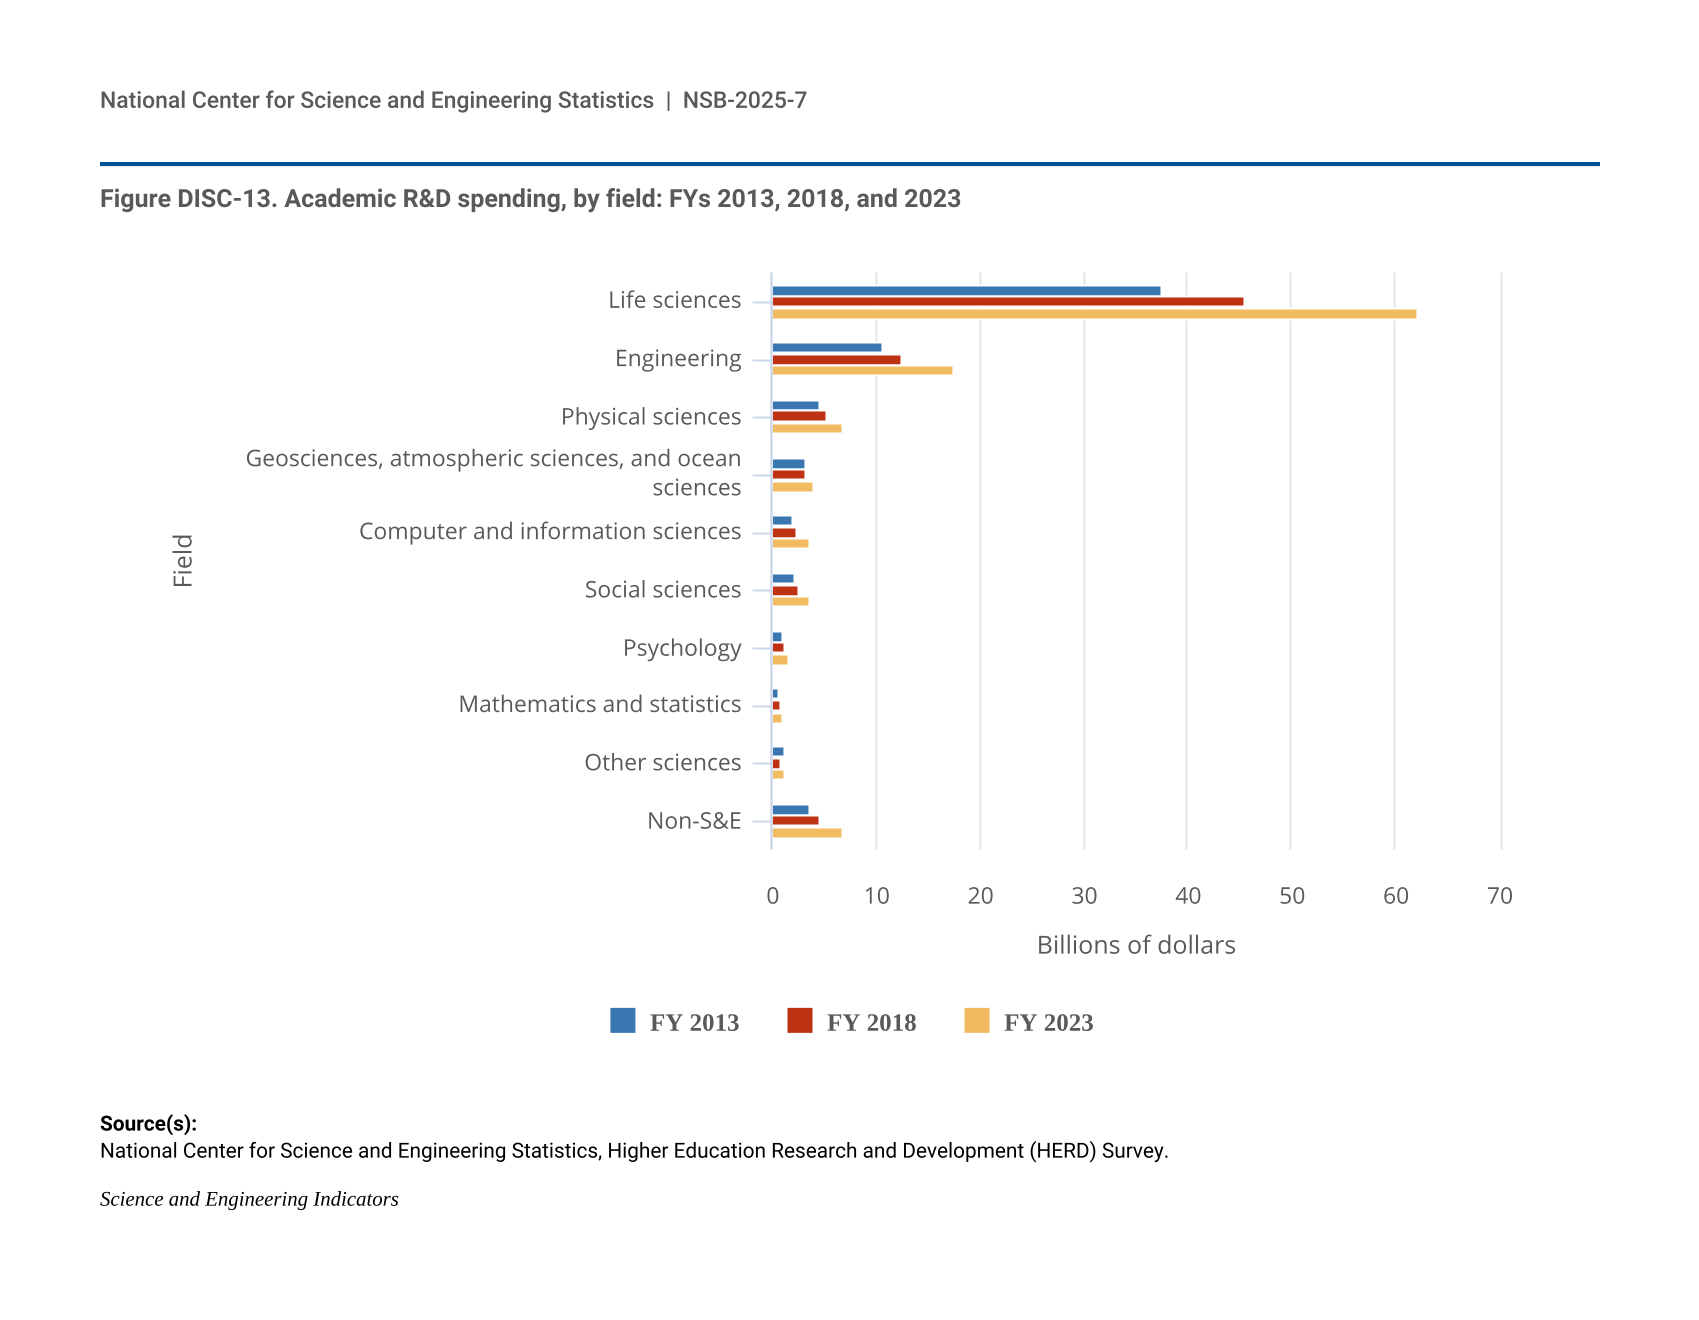
Academic R&D expenditures are classified into three major categories: science (78% in FY 2023), engineering (16%), and non-S&E fields (6%) (the latter include business management and administration, communication and communications technologies, education, humanities, social work, law, and visual and performing arts) (Table SDISC-2). The distribution of academic R&D expenditures across research fields has changed little since 2013 (Figure DISC-13). The life sciences continue to account for a majority of total spending, $62.2 billion (57%) in 2023 (56%–58% share since 2013). The concentration of life sciences R&D in the higher education sector is consistent with the large share of health sciences in U.S. publications output discussed later in this report and with the large share of research space devoted to biological and biomedical sciences.
| Field | FY 2013 | FY 2018 | FY 2023 |
|---|---|---|---|
| Life sciences | 37.6 | 45.6 | 62.2 |
| Engineering | 10.7 | 12.4 | 17.5 |
| Physical sciences | 4.6 | 5.2 | 6.9 |
| Geosciences, atmospheric sciences, and ocean sciences | 3.2 | 3.2 | 4.0 |
| Computer and information sciences | 2.1 | 2.4 | 3.6 |
| Social sciences | 2.2 | 2.7 | 3.6 |
| Psychology | 1.1 | 1.3 | 1.6 |
| Mathematics and statistics | 0.7 | 0.8 | 1.1 |
| Other sciences | 1.2 | 0.9 | 1.2 |
| Non-S&E | 3.6 | 4.6 | 6.9 |
National Center for Science and Engineering Statistics, Higher Education Research and Development (HERD) Survey.
Science and Engineering Indicators
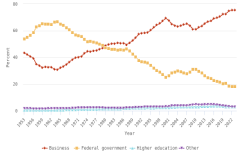
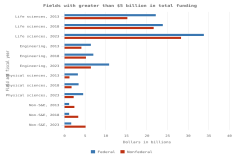
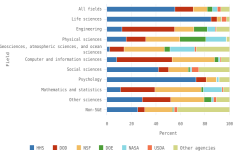
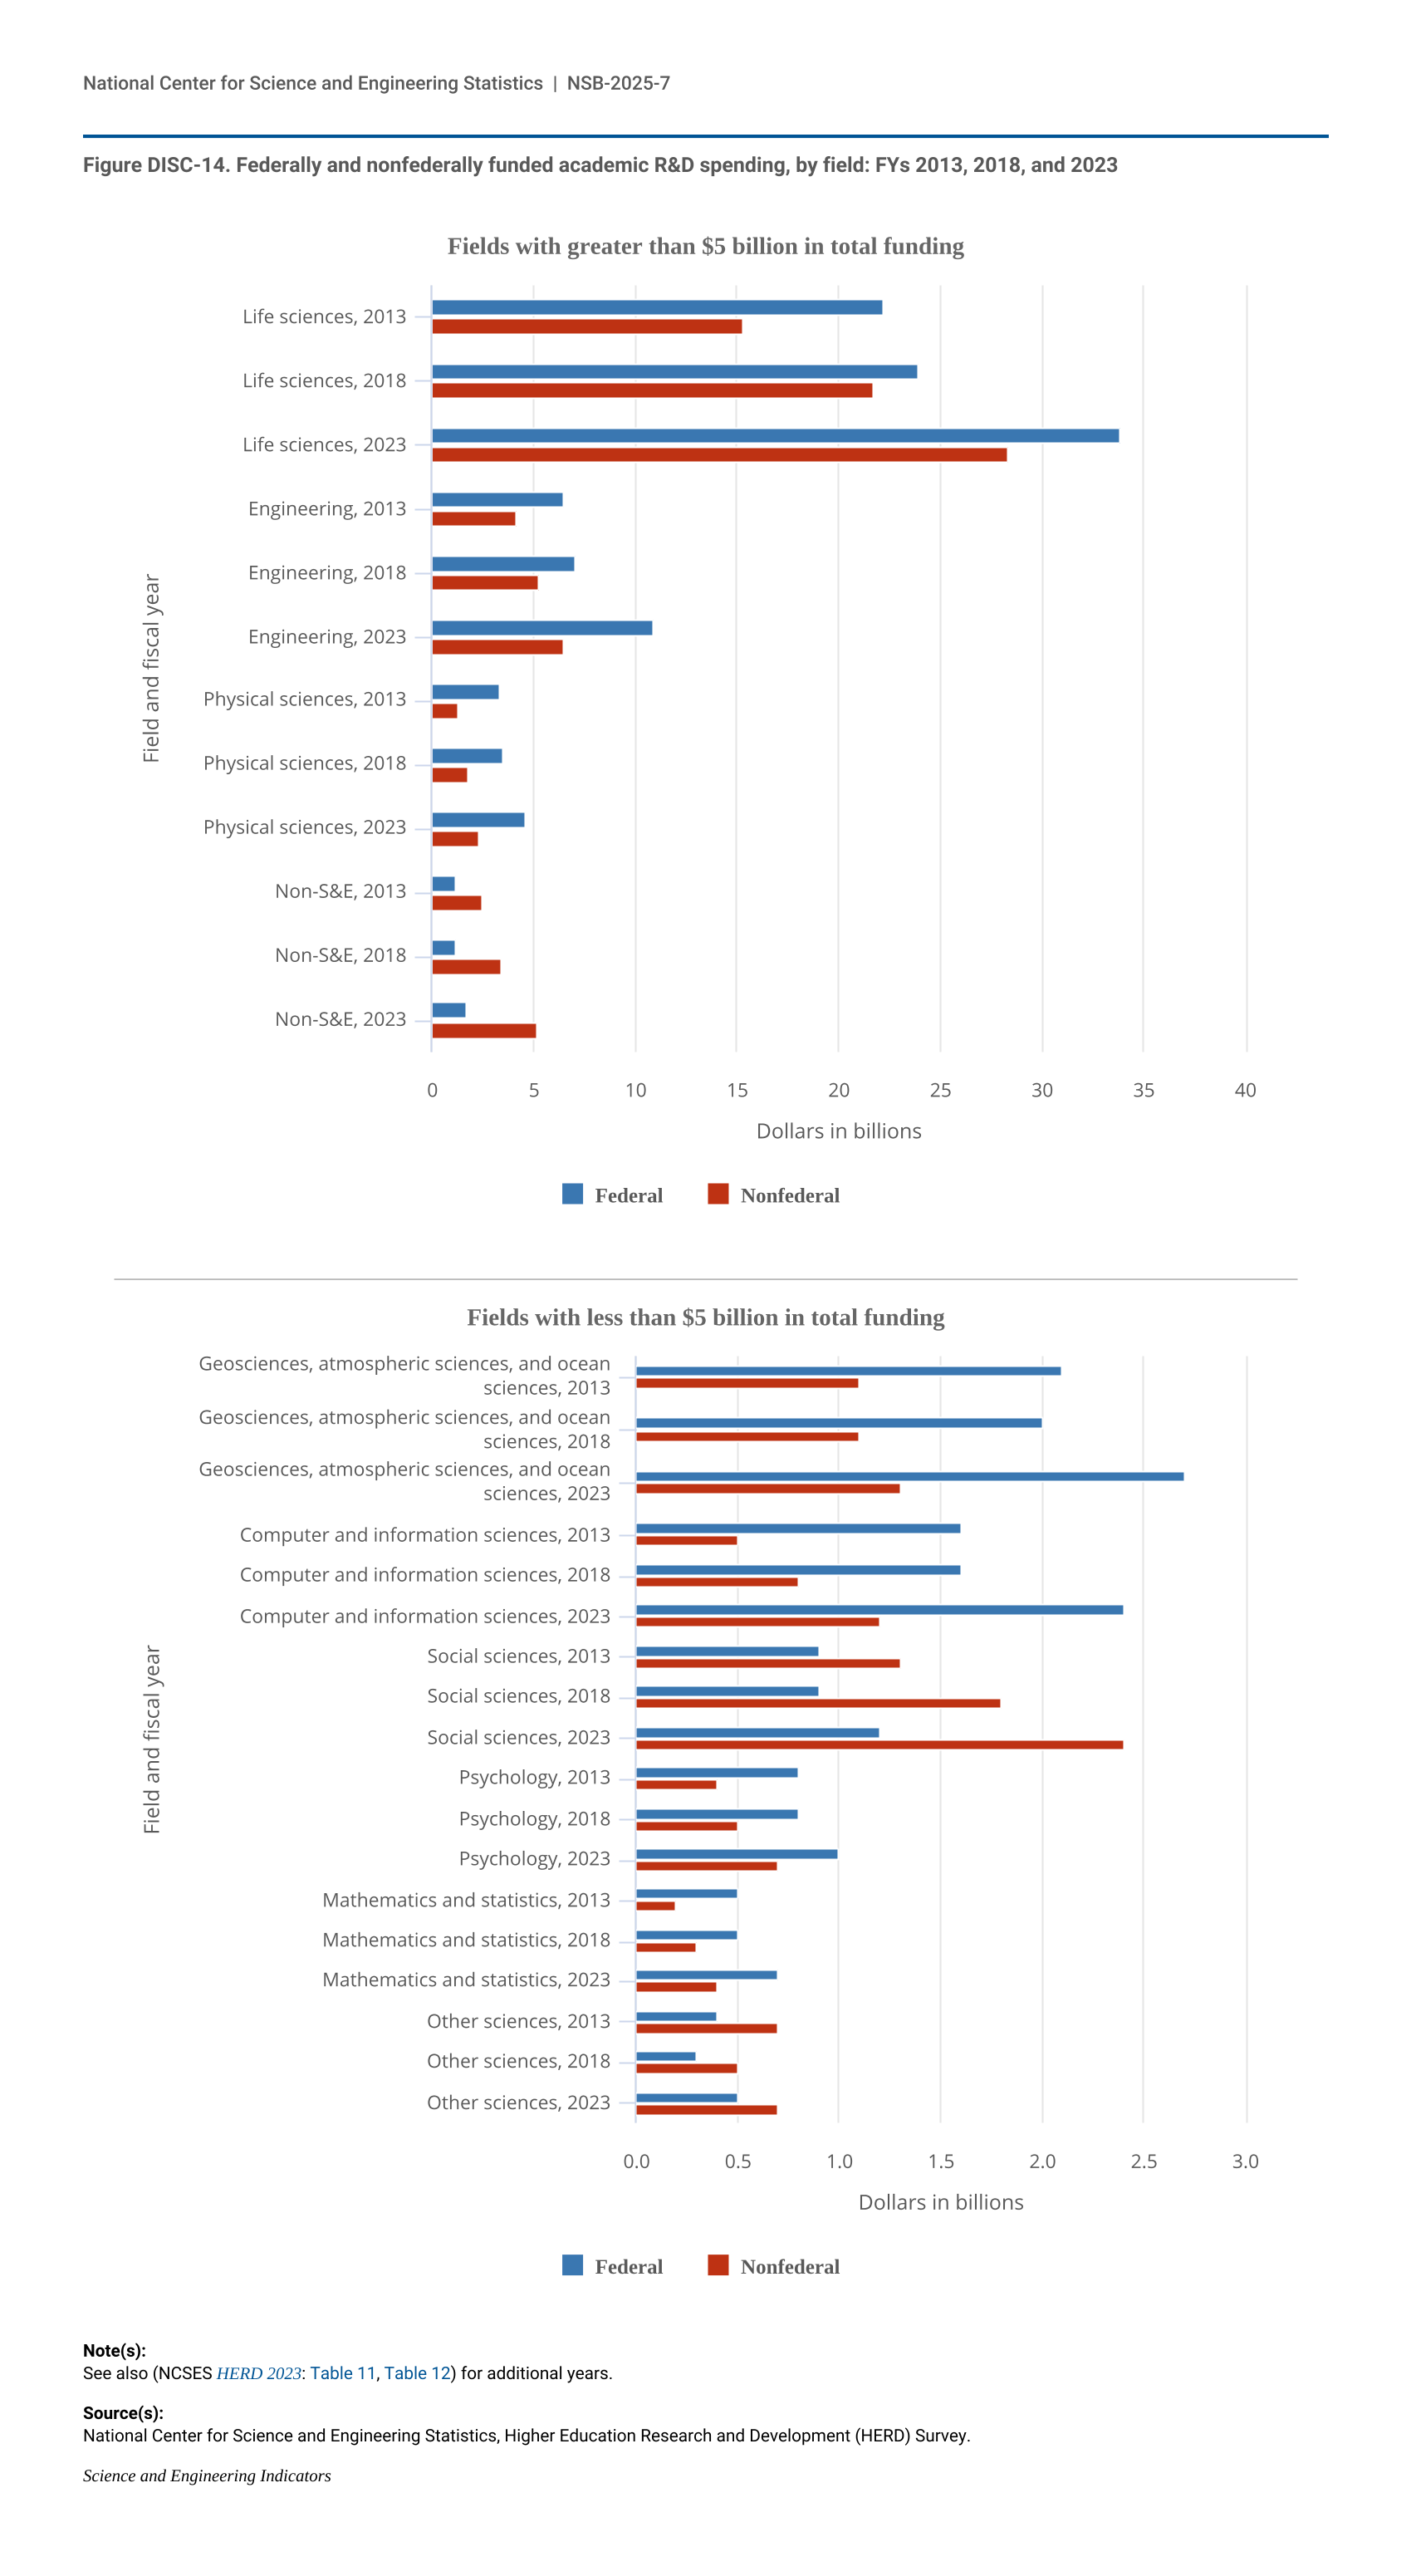
The proportion of funding for academic R&D by federal and nonfederal sources differs by scientific field (Figure DISC-14). The social sciences receive a relatively high proportion of funding from nonfederal sources (67% nonfederal in 2023). By comparison, geosciences, atmospheric sciences, and ocean sciences (67% federal), computer and information sciences (67% federal), and physical sciences (67% federal) were among the highest federally funded fields as a proportion of total funding in 2023.
| Field and fiscal year | Federal | Nonfederal |
|---|---|---|
| Life sciences, 2013 | 22.2 | 15.3 |
| Life sciences, 2018 | 23.9 | 21.7 |
| Life sciences, 2023 | 33.9 | 28.3 |
| Engineering, 2013 | 6.5 | 4.2 |
| Engineering, 2018 | 7.1 | 5.3 |
| Engineering, 2023 | 10.9 | 6.5 |
| Physical sciences, 2013 | 3.3 | 1.3 |
| Physical sciences, 2018 | 3.5 | 1.8 |
| Physical sciences, 2023 | 4.6 | 2.3 |
| Non-S&E, 2013 | 1.2 | 2.5 |
| Non-S&E, 2018 | 1.2 | 3.4 |
| Non-S&E, 2023 | 1.7 | 5.2 |
| Field and fiscal year | Federal | Nonfederal |
|---|---|---|
| Geosciences, atmospheric sciences, and ocean sciences, 2013 | 2.1 | 1.1 |
| Geosciences, atmospheric sciences, and ocean sciences, 2018 | 2.0 | 1.1 |
| Geosciences, atmospheric sciences, and ocean sciences, 2023 | 2.7 | 1.3 |
| Computer and information sciences, 2013 | 1.6 | 0.5 |
| Computer and information sciences, 2018 | 1.6 | 0.8 |
| Computer and information sciences, 2023 | 2.4 | 1.2 |
| Social sciences, 2013 | 0.9 | 1.3 |
| Social sciences, 2018 | 0.9 | 1.8 |
| Social sciences, 2023 | 1.2 | 2.4 |
| Psychology, 2013 | 0.8 | 0.4 |
| Psychology, 2018 | 0.8 | 0.5 |
| Psychology, 2023 | 1.0 | 0.7 |
| Mathematics and statistics, 2013 | 0.5 | 0.2 |
| Mathematics and statistics, 2018 | 0.5 | 0.3 |
| Mathematics and statistics, 2023 | 0.7 | 0.4 |
| Other sciences, 2013 | 0.4 | 0.7 |
| Other sciences, 2018 | 0.3 | 0.5 |
| Other sciences, 2023 | 0.5 | 0.7 |
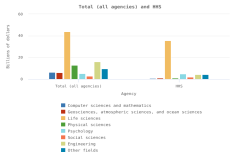
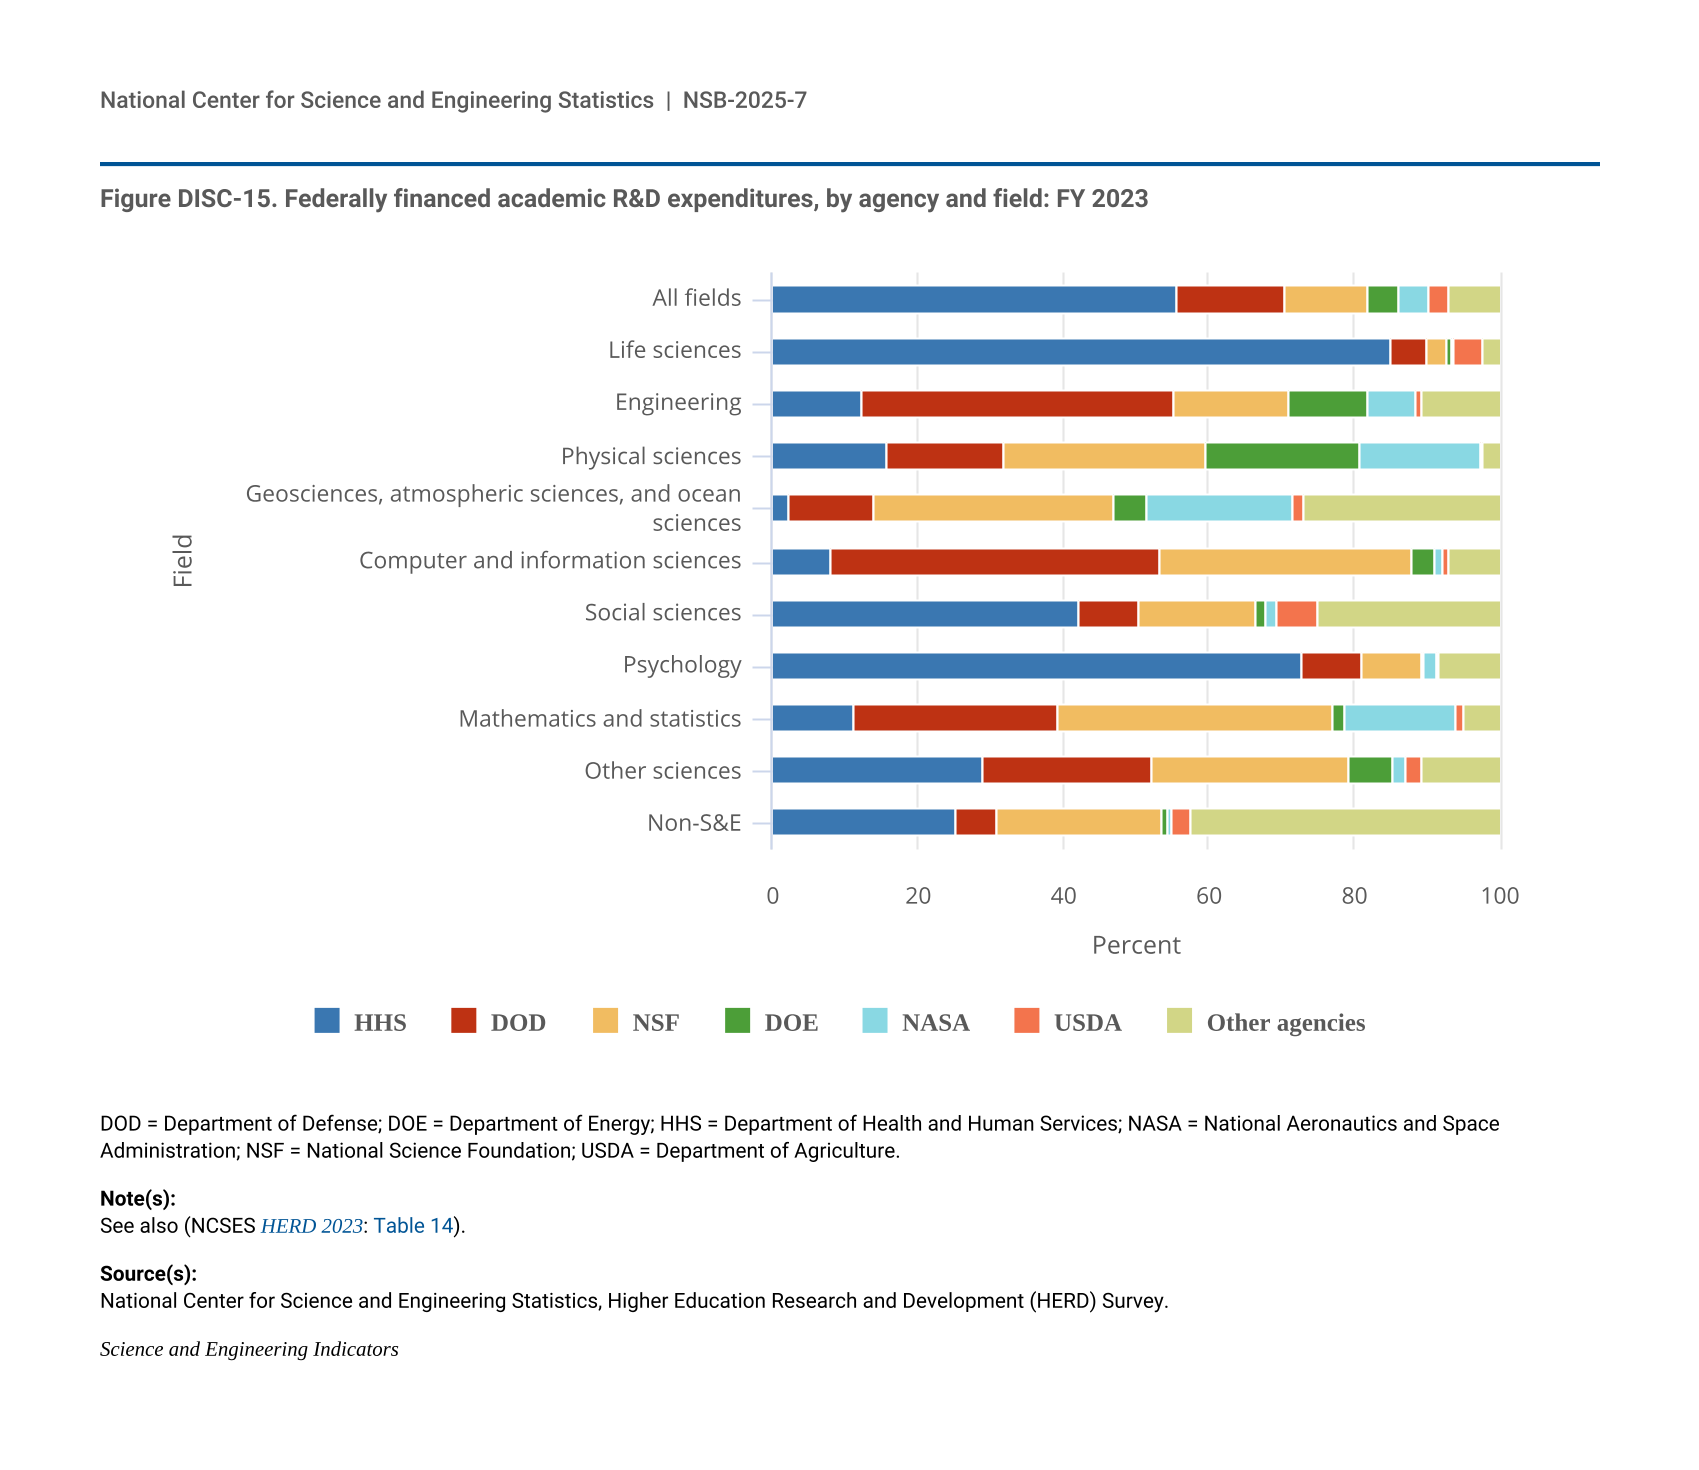
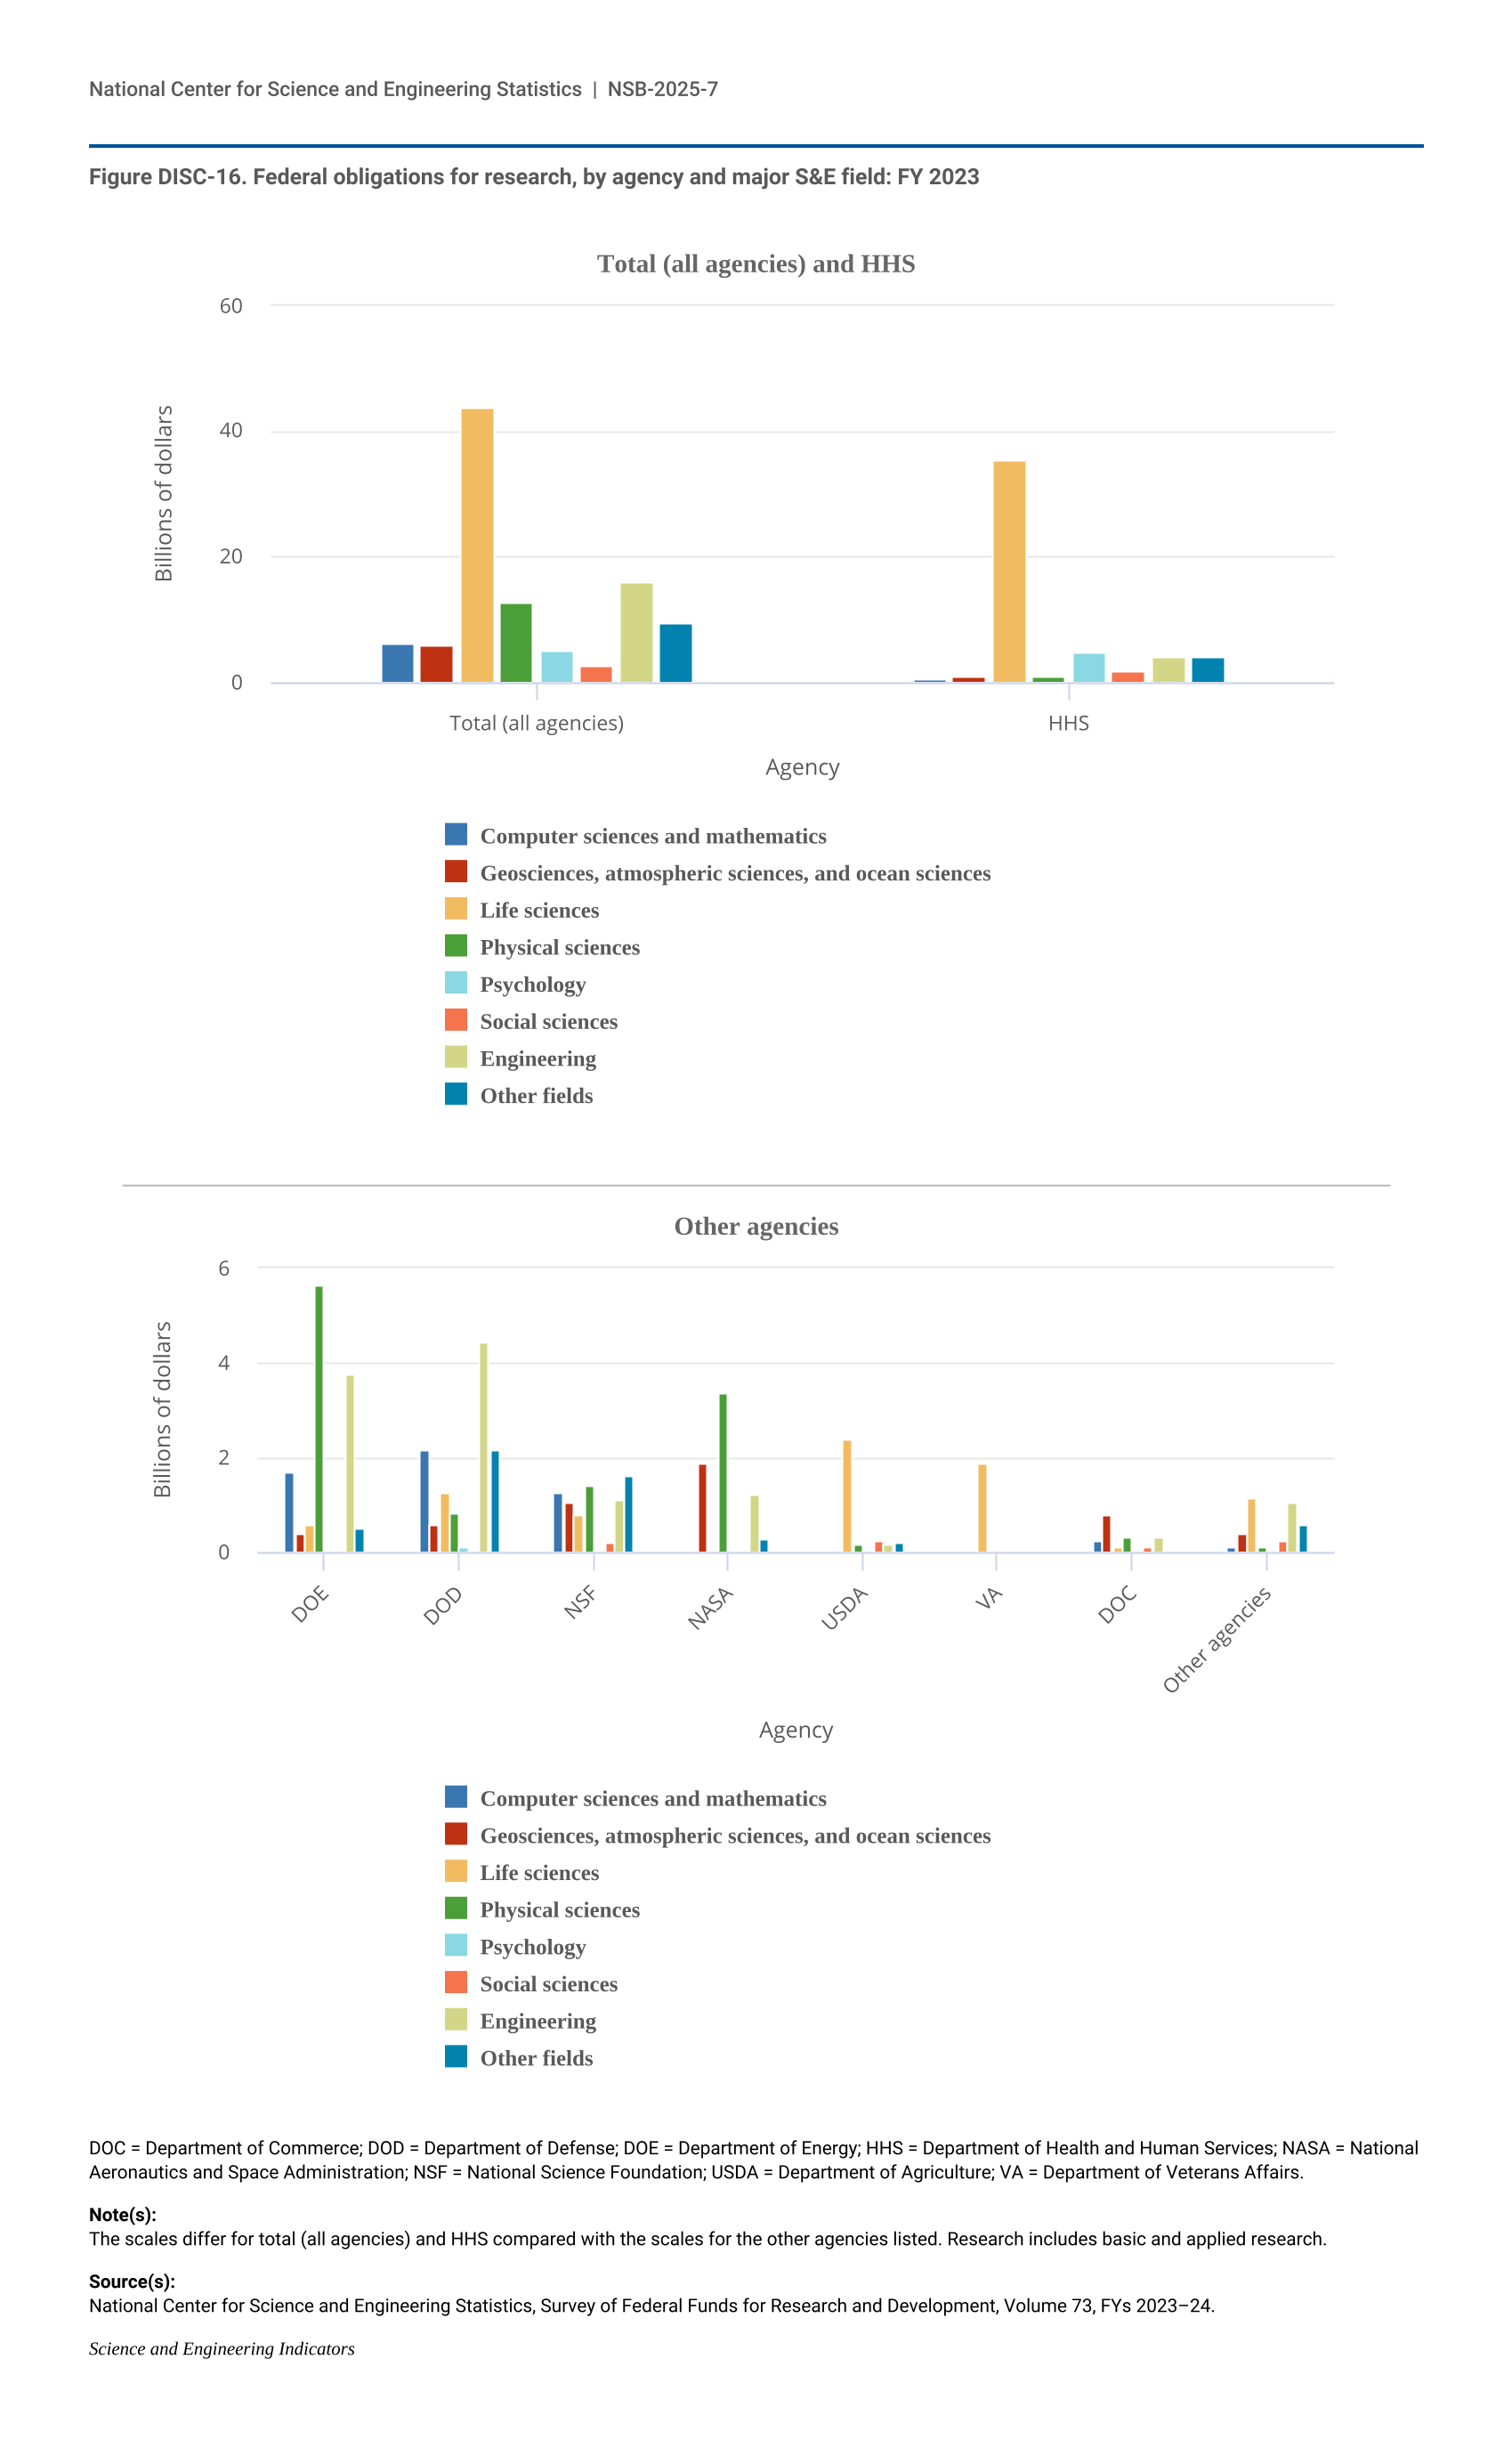
The funding portfolios for federal agencies reflects the variety of S&E fields that support their diverse missions (Figure DISC-15). For example, among federal agencies, HHS funds most academic R&D in life sciences, psychology, and social sciences, whereas DOD was one of the top two agencies funding computer and information sciences, engineering, and mathematics and statistics R&D. NSF was the leading funder among all federal agencies for academic R&D in mathematics and statistics; geosciences, atmospheric sciences, and ocean sciences; and physical sciences.
| Field | HHS | DOD | NSF | DOE | NASA | USDA | Other agencies |
|---|---|---|---|---|---|---|---|
| All fields | 55.5 | 15.2 | 11.2 | 4.5 | 3.9 | 2.9 | 6.9 |
| Life sciences | 85.3 | 4.8 | 2.7 | 0.7 | 0.3 | 4.1 | 2.2 |
| Engineering | 12.3 | 42.9 | 15.8 | 10.9 | 6.5 | 1.0 | 10.6 |
| Physical sciences | 15.8 | 16.0 | 27.8 | 21.1 | 16.6 | 0.3 | 2.3 |
| Geosciences, atmospheric sciences, and ocean sciences | 2.2 | 11.9 | 32.9 | 4.6 | 20.0 | 1.5 | 26.8 |
| Computer and information sciences | 8.1 | 45.0 | 34.9 | 2.9 | 1.3 | 0.8 | 6.9 |
| Social sciences | 42.0 | 8.5 | 16.0 | 1.5 | 1.3 | 5.8 | 24.9 |
| Psychology | 72.9 | 8.2 | 8.5 | 0.1 | 1.7 | 0.4 | 8.3 |
| Mathematics and statistics | 11.2 | 28.0 | 38.0 | 1.6 | 15.3 | 1.1 | 4.8 |
| Other sciences | 29.0 | 23.2 | 27.1 | 6.0 | 1.6 | 2.3 | 10.7 |
| Non-S&E | 25.2 | 5.8 | 22.6 | 0.8 | 0.7 | 2.4 | 42.5 |
DOD = Department of Defense; DOE = Department of Energy; HHS = Department of Health and Human Services; NASA = National Aeronautics and Space Administration; NSF = National Science Foundation; USDA = Department of Agriculture.
National Center for Science and Engineering Statistics, Higher Education Research and Development (HERD) Survey.
Science and Engineering Indicators