 An official website of the United States government
 Data
Tables
Number
Title
Download
View
NumberDISC-1
DISC-1
U.S. R&D expenditures, by performing sector and source of funds: 2010–23
TitleU.S. R&D expenditures, by performing sector and source of funds: 2010–23
NumberDISC-2
DISC-2
U.S. R&D expenditures, by type of R&D: Selected years, 2000–23
TitleU.S. R&D expenditures, by type of R&D: Selected years, 2000–23
NumberDISC-3
DISC-3
Domestic net sales, R&D, and R&D-to-sales ratio for companies that performed or funded U.S. business R&D, by selected industry: 2022
TitleDomestic net sales, R&D, and R&D-to-sales ratio for companies that performed or funded U.S. business R&D, by selected industry: 2022
NumberDISC-4
DISC-4
U.S. business R&D performance, by source of funds: 2022
TitleU.S. business R&D performance, by source of funds: 2022
NumberDISC-5
DISC-5
U.S. business R&D performed, by industry and select technology focus: 2022
TitleU.S. business R&D performed, by industry and select technology focus: 2022
NumberDISC-6
DISC-6
Federal agency support of academic R&D spending: FYs 2013, 2018, 2022, and 2023
TitleFederal agency support of academic R&D spending: FYs 2013, 2018, 2022, and 2023
NumberDISC-7
DISC-7
Federal obligations for R&D and R&D plant, by agency: FYs 2008–24
TitleFederal obligations for R&D and R&D plant, by agency: FYs 2008–24
NumberDISC-8
DISC-8
Federal obligations for R&D and R&D plant, by agency and performer: FY 2023
TitleFederal obligations for R&D and R&D plant, by agency and performer: FY 2023
NumberDISC-9
DISC-9
Federal obligations for R&D, by agency and type of R&D: FY 2023
TitleFederal obligations for R&D, by agency and type of R&D: FY 2023
NumberDISC-10
DISC-10
GERD, GDP, GERD-to-GDP ratio, and growth rates, by selected region, country, or economy: Selected years, 1990–2022
TitleGERD, GDP, GERD-to-GDP ratio, and growth rates, by selected region, country, or economy: Selected years, 1990–2022
NumberDISC-11
DISC-11
GERD for selected region, country, or economy, by performing sector and source of funds: 2022 or most recent year
TitleGERD for selected region, country, or economy, by performing sector and source of funds: 2022 or most recent year
NumberDISC-12
DISC-12
S&E publications in all fields for the 15 largest producing regions, countries, or economies: 2013 and 2023
TitleS&E publications in all fields for the 15 largest producing regions, countries, or economies: 2013 and 2023
NumberSDISC-1
SDISC-1
Federal and nonfederal funding of academic basic research: FYs 1979–2023
TitleFederal and nonfederal funding of academic basic research: FYs 1979–2023
NumberSDISC-2
SDISC-2
Higher education R&D expenditures, by R&D field: FYs 2010–23
TitleHigher education R&D expenditures, by R&D field: FYs 2010–23
NumberSDISC-3
SDISC-3
GERD, GDP, GERD-to-GDP ratio, and growth rates, by selected region, country, or economy: Selected years, 1990–2022
TitleGERD, GDP, GERD-to-GDP ratio, and growth rates, by selected region, country, or economy: Selected years, 1990–2022
NumberSDISC-4
SDISC-4
GERD for selected region, country, or economy, by performing sector and source of funds: 2022 or most recent year
TitleGERD for selected region, country, or economy, by performing sector and source of funds: 2022 or most recent year
NumberSDISC-5
SDISC-5
Regions, countries, and economies in S&E publications data
TitleRegions, countries, and economies in S&E publications data
NumberSDISC-6
SDISC-6
S&E articles in all S&E fields, fractional count, by region, country, or economy: 2002–23
TitleS&E articles in all S&E fields, fractional count, by region, country, or economy: 2002–23
NumberSDISC-7
SDISC-7
S&E articles in agricultural sciences, fractional count, by region, country, or economy: 2002–23
TitleS&E articles in agricultural sciences, fractional count, by region, country, or economy: 2002–23
NumberSDISC-8
SDISC-8
S&E articles in astronomy and astrophysics, fractional count, by region, country, or economy: 2002–23
TitleS&E articles in astronomy and astrophysics, fractional count, by region, country, or economy: 2002–23
NumberSDISC-9
SDISC-9
S&E articles in biological and biomedical sciences, fractional count, by region, country, or economy: 2002–23
TitleS&E articles in biological and biomedical sciences, fractional count, by region, country, or economy: 2002–23
NumberSDISC-10
SDISC-10
S&E articles in chemistry, fractional count, by region, country, or economy: 2002–23
TitleS&E articles in chemistry, fractional count, by region, country, or economy: 2002–23
NumberSDISC-11
SDISC-11
S&E articles in computer and information sciences, fractional count, by region, country, or economy: 2002–23
TitleS&E articles in computer and information sciences, fractional count, by region, country, or economy: 2002–23
NumberSDISC-12
SDISC-12
S&E articles in engineering, fractional count, by region, country, or economy: 2002–23
TitleS&E articles in engineering, fractional count, by region, country, or economy: 2002–23
NumberSDISC-13
SDISC-13
S&E articles in geosciences, atmospheric sciences, and ocean sciences, fractional count, by region, country, or economy: 2002–23
TitleS&E articles in geosciences, atmospheric sciences, and ocean sciences, fractional count, by region, country, or economy: 2002–23
NumberSDISC-14
SDISC-14
S&E articles in health sciences, fractional count, by region, country, or economy: 2002–23
TitleS&E articles in health sciences, fractional count, by region, country, or economy: 2002–23
NumberSDISC-15
SDISC-15
S&E articles in materials science, fractional count, by region, country, or economy: 2002–23
TitleS&E articles in materials science, fractional count, by region, country, or economy: 2002–23
NumberSDISC-16
SDISC-16
S&E articles in mathematics and statistics, fractional count, by region, country, or economy: 2002–23
TitleS&E articles in mathematics and statistics, fractional count, by region, country, or economy: 2002–23
NumberSDISC-17
SDISC-17
S&E articles in natural resources and conservation, fractional count, by region, country, or economy: 2002–23
TitleS&E articles in natural resources and conservation, fractional count, by region, country, or economy: 2002–23
NumberSDISC-18
SDISC-18
S&E articles in physics, fractional count, by region, country, or economy: 2002–23
TitleS&E articles in physics, fractional count, by region, country, or economy: 2002–23
NumberSDISC-19
SDISC-19
S&E articles in psychology, fractional count, by region, country, or economy: 2002–23
TitleS&E articles in psychology, fractional count, by region, country, or economy: 2002–23
NumberSDISC-20
SDISC-20
S&E articles in social sciences, fractional count, by region, country, or economy: 2002–23
TitleS&E articles in social sciences, fractional count, by region, country, or economy: 2002–23
NumberSDISC-21
SDISC-21
S&E articles in all S&E fields, whole count, by region, country, or economy: 2002–23
TitleS&E articles in all S&E fields, whole count, by region, country, or economy: 2002–23
NumberSDISC-22
SDISC-22
S&E articles in agricultural sciences, whole count, by region, country, or economy: 2002–23
TitleS&E articles in agricultural sciences, whole count, by region, country, or economy: 2002–23
NumberSDISC-23
SDISC-23
S&E articles in astronomy and astrophysics, whole count, by region, country, or economy: 2002–23
TitleS&E articles in astronomy and astrophysics, whole count, by region, country, or economy: 2002–23
NumberSDISC-24
SDISC-24
S&E articles in biological and biomedical sciences, whole count, by region, country, or economy: 2002–23
TitleS&E articles in biological and biomedical sciences, whole count, by region, country, or economy: 2002–23
NumberSDISC-25
SDISC-25
S&E articles in chemistry, whole count, by region, country, or economy: 2002–23
TitleS&E articles in chemistry, whole count, by region, country, or economy: 2002–23
NumberSDISC-26
SDISC-26
S&E articles in computer and information sciences, whole count, by region, country, or economy: 2002–23
TitleS&E articles in computer and information sciences, whole count, by region, country, or economy: 2002–23
NumberSDISC-27
SDISC-27
S&E articles in engineering, whole count, by region, country, or economy: 2002–23
TitleS&E articles in engineering, whole count, by region, country, or economy: 2002–23
NumberSDISC-28
SDISC-28
S&E articles in geosciences, atmospheric sciences, and ocean sciences, whole count, by region, country, or economy: 2002–23
TitleS&E articles in geosciences, atmospheric sciences, and ocean sciences, whole count, by region, country, or economy: 2002–23
NumberSDISC-29
SDISC-29
S&E articles in health sciences, whole count, by region, country, or economy: 2002–23
TitleS&E articles in health sciences, whole count, by region, country, or economy: 2002–23
NumberSDISC-30
SDISC-30
S&E articles in materials science, whole count, by region, country, or economy: 2002–23
TitleS&E articles in materials science, whole count, by region, country, or economy: 2002–23
NumberSDISC-31
SDISC-31
S&E articles in mathematics and statistics, whole count, by region, country, or economy: 2002–23
TitleS&E articles in mathematics and statistics, whole count, by region, country, or economy: 2002–23
NumberSDISC-32
SDISC-32
S&E articles in natural resources and conservation, whole count, by region, country, or economy: 2002–23
TitleS&E articles in natural resources and conservation, whole count, by region, country, or economy: 2002–23
NumberSDISC-33
SDISC-33
S&E articles in physics, whole count, by region, country, or economy: 2002–23
TitleS&E articles in physics, whole count, by region, country, or economy: 2002–23
NumberSDISC-34
SDISC-34
S&E articles in psychology, whole count, by region, country, or economy: 2002–23
TitleS&E articles in psychology, whole count, by region, country, or economy: 2002–23
NumberSDISC-35
SDISC-35
S&E articles in social sciences, whole count, by region, country, or economy: 2002–23
TitleS&E articles in social sciences, whole count, by region, country, or economy: 2002–23
NumberSDISC-36
SDISC-36
S&E research portfolios of selected region, country, or economy, by field: 2023
TitleS&E research portfolios of selected region, country, or economy, by field: 2023
NumberSDISC-37
SDISC-37
Share of S&E publications in the top 1% most-cited journal articles in the Scopus database, fractional count, by region, country, or economy: 2002–22
TitleShare of S&E publications in the top 1% most-cited journal articles in the Scopus database, fractional count, by region, country, or economy: 2002–22
NumberSDISC-38
SDISC-38
Share of S&E publications in the top 1% most-cited journal articles in agricultural sciences, fractional count, by region, country, or economy: 2002–22
TitleShare of S&E publications in the top 1% most-cited journal articles in agricultural sciences, fractional count, by region, country, or economy: 2002–22
NumberSDISC-39
SDISC-39
Share of S&E publications in the top 1% most-cited journal articles in astronomy and astrophysics, fractional count, by region, country, or economy: 2002–22
TitleShare of S&E publications in the top 1% most-cited journal articles in astronomy and astrophysics, fractional count, by region, country, or economy: 2002–22
NumberSDISC-40
SDISC-40
Share of S&E publications in the top 1% most-cited journal articles in biological and biomedical sciences, fractional count, by region, country, or economy: 2002–22
TitleShare of S&E publications in the top 1% most-cited journal articles in biological and biomedical sciences, fractional count, by region, country, or economy: 2002–22
NumberSDISC-41
SDISC-41
Share of S&E publications in the top 1% most-cited journal articles in chemistry, fractional count, by region, country, or economy: 2002–22
TitleShare of S&E publications in the top 1% most-cited journal articles in chemistry, fractional count, by region, country, or economy: 2002–22
NumberSDISC-42
SDISC-42
Share of S&E publications in the top 1% most-cited journal articles in computer and information sciences, fractional count, by region, country, or economy: 2002–22
TitleShare of S&E publications in the top 1% most-cited journal articles in computer and information sciences, fractional count, by region, country, or economy: 2002–22
NumberSDISC-43
SDISC-43
Share of S&E publications in the top 1% most-cited journal articles in engineering, fractional count, by region, country, or economy: 2002–22
TitleShare of S&E publications in the top 1% most-cited journal articles in engineering, fractional count, by region, country, or economy: 2002–22
NumberSDISC-44
SDISC-44
Share of S&E publications in the top 1% most-cited journal articles in geosciences, atmospheric sciences, and ocean sciences, fractional count, by region, country, or economy: 2002–22
TitleShare of S&E publications in the top 1% most-cited journal articles in geosciences, atmospheric sciences, and ocean sciences, fractional count, by region, country, or economy: 2002–22
NumberSDISC-45
SDISC-45
Share of S&E publications in the top 1% most-cited journal articles in health sciences, fractional count, by region, country, or economy: 2002–22
TitleShare of S&E publications in the top 1% most-cited journal articles in health sciences, fractional count, by region, country, or economy: 2002–22
NumberSDISC-46
SDISC-46
Share of S&E publications in the top 1% most-cited journal articles in materials science, fractional count, by region, country, or economy: 2002–22
TitleShare of S&E publications in the top 1% most-cited journal articles in materials science, fractional count, by region, country, or economy: 2002–22
NumberSDISC-47
SDISC-47
Share of S&E publications in the top 1% most-cited journal articles in mathematics and statistics, fractional count, by region, country, or economy: 2002–22
TitleShare of S&E publications in the top 1% most-cited journal articles in mathematics and statistics, fractional count, by region, country, or economy: 2002–22
NumberSDISC-48
SDISC-48
Share of S&E publications in the top 1% most-cited journal articles in natural resources and conservation, fractional count, by region, country, or economy: 2002–22
TitleShare of S&E publications in the top 1% most-cited journal articles in natural resources and conservation, fractional count, by region, country, or economy: 2002–22
NumberSDISC-49
SDISC-49
Share of S&E publications in the top 1% most-cited journal articles in physics, fractional count, by region, country, or economy: 2002–22
TitleShare of S&E publications in the top 1% most-cited journal articles in physics, fractional count, by region, country, or economy: 2002–22
NumberSDISC-50
SDISC-50
Share of S&E publications in the top 1% most-cited journal articles in psychology, fractional count, by region, country, or economy: 2002–22
TitleShare of S&E publications in the top 1% most-cited journal articles in psychology, fractional count, by region, country, or economy: 2002–22
NumberSDISC-51
SDISC-51
Share of S&E publications in the top 1% most-cited journal articles in social sciences, fractional count, by region, country, or economy: 2002–22
TitleShare of S&E publications in the top 1% most-cited journal articles in social sciences, fractional count, by region, country, or economy: 2002–22
NumberSDISC-52
SDISC-52
Share of S&E publications in the top 1% most-cited journal articles and conference proceedings in computer and information sciences, fractional count, by region, country, or economy: 2002–22
TitleShare of S&E publications in the top 1% most-cited journal articles and conference proceedings in computer and information sciences, fractional count, by region, country, or economy: 2002–22
NumberSDISC-53
SDISC-53
Share of S&E publications in the top 1% most-cited journal articles in the Scopus database, whole count, by region, country, or economy: 2002–22
TitleShare of S&E publications in the top 1% most-cited journal articles in the Scopus database, whole count, by region, country, or economy: 2002–22
NumberSDISC-54
SDISC-54
Share of S&E publications in the top 1% most-cited journal articles in agricultural sciences, whole count, by region, country, or economy: 2002–22
TitleShare of S&E publications in the top 1% most-cited journal articles in agricultural sciences, whole count, by region, country, or economy: 2002–22
NumberSDISC-55
SDISC-55
Share of S&E publications in the top 1% most-cited journal articles in astronomy and astrophysics, whole count, by region, country, or economy: 2002–22
TitleShare of S&E publications in the top 1% most-cited journal articles in astronomy and astrophysics, whole count, by region, country, or economy: 2002–22
NumberSDISC-56
SDISC-56
Share of S&E publications in the top 1% most-cited journal articles in biological and biomedical sciences, whole count, by region, country, or economy: 2002–22
TitleShare of S&E publications in the top 1% most-cited journal articles in biological and biomedical sciences, whole count, by region, country, or economy: 2002–22
NumberSDISC-57
SDISC-57
Share of S&E publications in the top 1% most-cited journal articles in chemistry, whole count, by region, country, or economy: 2002–22
TitleShare of S&E publications in the top 1% most-cited journal articles in chemistry, whole count, by region, country, or economy: 2002–22
NumberSDISC-58
SDISC-58
Share of S&E publications in the top 1% most-cited journal articles in computer and information sciences, whole count, by region, country, or economy: 2002–22
TitleShare of S&E publications in the top 1% most-cited journal articles in computer and information sciences, whole count, by region, country, or economy: 2002–22
NumberSDISC-59
SDISC-59
Share of S&E publications in the top 1% most-cited journal articles in engineering, whole count, by region, country, or economy: 2002–22
TitleShare of S&E publications in the top 1% most-cited journal articles in engineering, whole count, by region, country, or economy: 2002–22
NumberSDISC-60
SDISC-60
Share of S&E publications in the top 1% most-cited journal articles in geosciences, atmospheric sciences, and ocean sciences, whole count, by region, country, or economy: 2002–22
TitleShare of S&E publications in the top 1% most-cited journal articles in geosciences, atmospheric sciences, and ocean sciences, whole count, by region, country, or economy: 2002–22
NumberSDISC-61
SDISC-61
Share of S&E publications in the top 1% most-cited journal articles in health sciences, whole count, by region, country, or economy: 2002–22
TitleShare of S&E publications in the top 1% most-cited journal articles in health sciences, whole count, by region, country, or economy: 2002–22
NumberSDISC-62
SDISC-62
Share of S&E publications in the top 1% most-cited journal articles in materials science, whole count, by region, country, or economy: 2002–22
TitleShare of S&E publications in the top 1% most-cited journal articles in materials science, whole count, by region, country, or economy: 2002–22
NumberSDISC-63
SDISC-63
Share of S&E publications in the top 1% most-cited journal articles in mathematics and statistics, whole count, by region, country, or economy: 2002–22
TitleShare of S&E publications in the top 1% most-cited journal articles in mathematics and statistics, whole count, by region, country, or economy: 2002–22
NumberSDISC-64
SDISC-64
Share of S&E publications in the top 1% most-cited journal articles in natural resources and conservation, whole count, by region, country, or economy: 2002–22
TitleShare of S&E publications in the top 1% most-cited journal articles in natural resources and conservation, whole count, by region, country, or economy: 2002–22
NumberSDISC-65
SDISC-65
Share of S&E publications in the top 1% most-cited journal articles in physics, whole count, by region, country, or economy: 2002–22
TitleShare of S&E publications in the top 1% most-cited journal articles in physics, whole count, by region, country, or economy: 2002–22
NumberSDISC-66
SDISC-66
Share of S&E publications in the top 1% most-cited journal articles in psychology, whole count, by region, country, or economy: 2002–22
TitleShare of S&E publications in the top 1% most-cited journal articles in psychology, whole count, by region, country, or economy: 2002–22
NumberSDISC-67
SDISC-67
Share of S&E publications in the top 1% most-cited journal articles in social sciences, whole count, by region, country, or economy: 2002–22
TitleShare of S&E publications in the top 1% most-cited journal articles in social sciences, whole count, by region, country, or economy: 2002–22
NumberSDISC-68
SDISC-68
Share of S&E publications in the top 1% most-cited journal articles and conference proceedings in computer and information sciences, whole count, by region, country, or economy: 2002–22
TitleShare of S&E publications in the top 1% most-cited journal articles and conference proceedings in computer and information sciences, whole count, by region, country, or economy: 2002–22
NumberSDISC-69
SDISC-69
S&E articles in all fields combined, by coauthorship attribute and selected region, country, or economy: 2002–23
TitleS&E articles in all fields combined, by coauthorship attribute and selected region, country, or economy: 2002–23
NumberSDISC-70
SDISC-70
Internationally coauthored S&E publications, by selected region, country, or economy pairs: 2003, 2013 and 2023
TitleInternationally coauthored S&E publications, by selected region, country, or economy pairs: 2003, 2013 and 2023
NumberSDISC-71
SDISC-71
U.S. international articles with coauthor from selected countries: Selected years, 2002–23
TitleU.S. international articles with coauthor from selected countries: Selected years, 2002–23
NumberSDISC-72
SDISC-72
International articles from 15 largest producing regions, countries, or economies with U.S. coauthor: 2002–23
TitleInternational articles from 15 largest producing regions, countries, or economies with U.S. coauthor: 2002–23
NumberSDISC-73
SDISC-73
Semiconductor-related S&E articles by coauthorship attribute, whole and fractional counting, by region, country, or economy: 2002–23
TitleSemiconductor-related S&E articles by coauthorship attribute, whole and fractional counting, by region, country, or economy: 2002–23
NumberSDISC-74
SDISC-74
Internationally coauthored semiconductor articles, by selected region, country, or economy: 2002–23
TitleInternationally coauthored semiconductor articles, by selected region, country, or economy: 2002–23
NumberSDISC-75
SDISC-75
International collaboration network analysis for semiconductor research papers, by selected region, country, or economy: 2002–23
TitleInternational collaboration network analysis for semiconductor research papers, by selected region, country, or economy: 2002–23
NumberSDISC-76
SDISC-76
Semiconductor-related S&E articles, by region, country, or economy: 2002–23
TitleSemiconductor-related S&E articles, by region, country, or economy: 2002–23
NumberSDISC-77
SDISC-77
Semiconductor-related articles, by coauthorship attribute and selected region, country, or economy: 2002–23
TitleSemiconductor-related articles, by coauthorship attribute and selected region, country, or economy: 2002–23
NumberSDISC-78
SDISC-78
Biotechnology-related articles, by selected region, country, or economy: 2002–23
TitleBiotechnology-related articles, by selected region, country, or economy: 2002–23
Figures
Thumbnail
Number & Title
Download
View
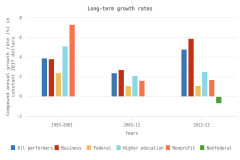
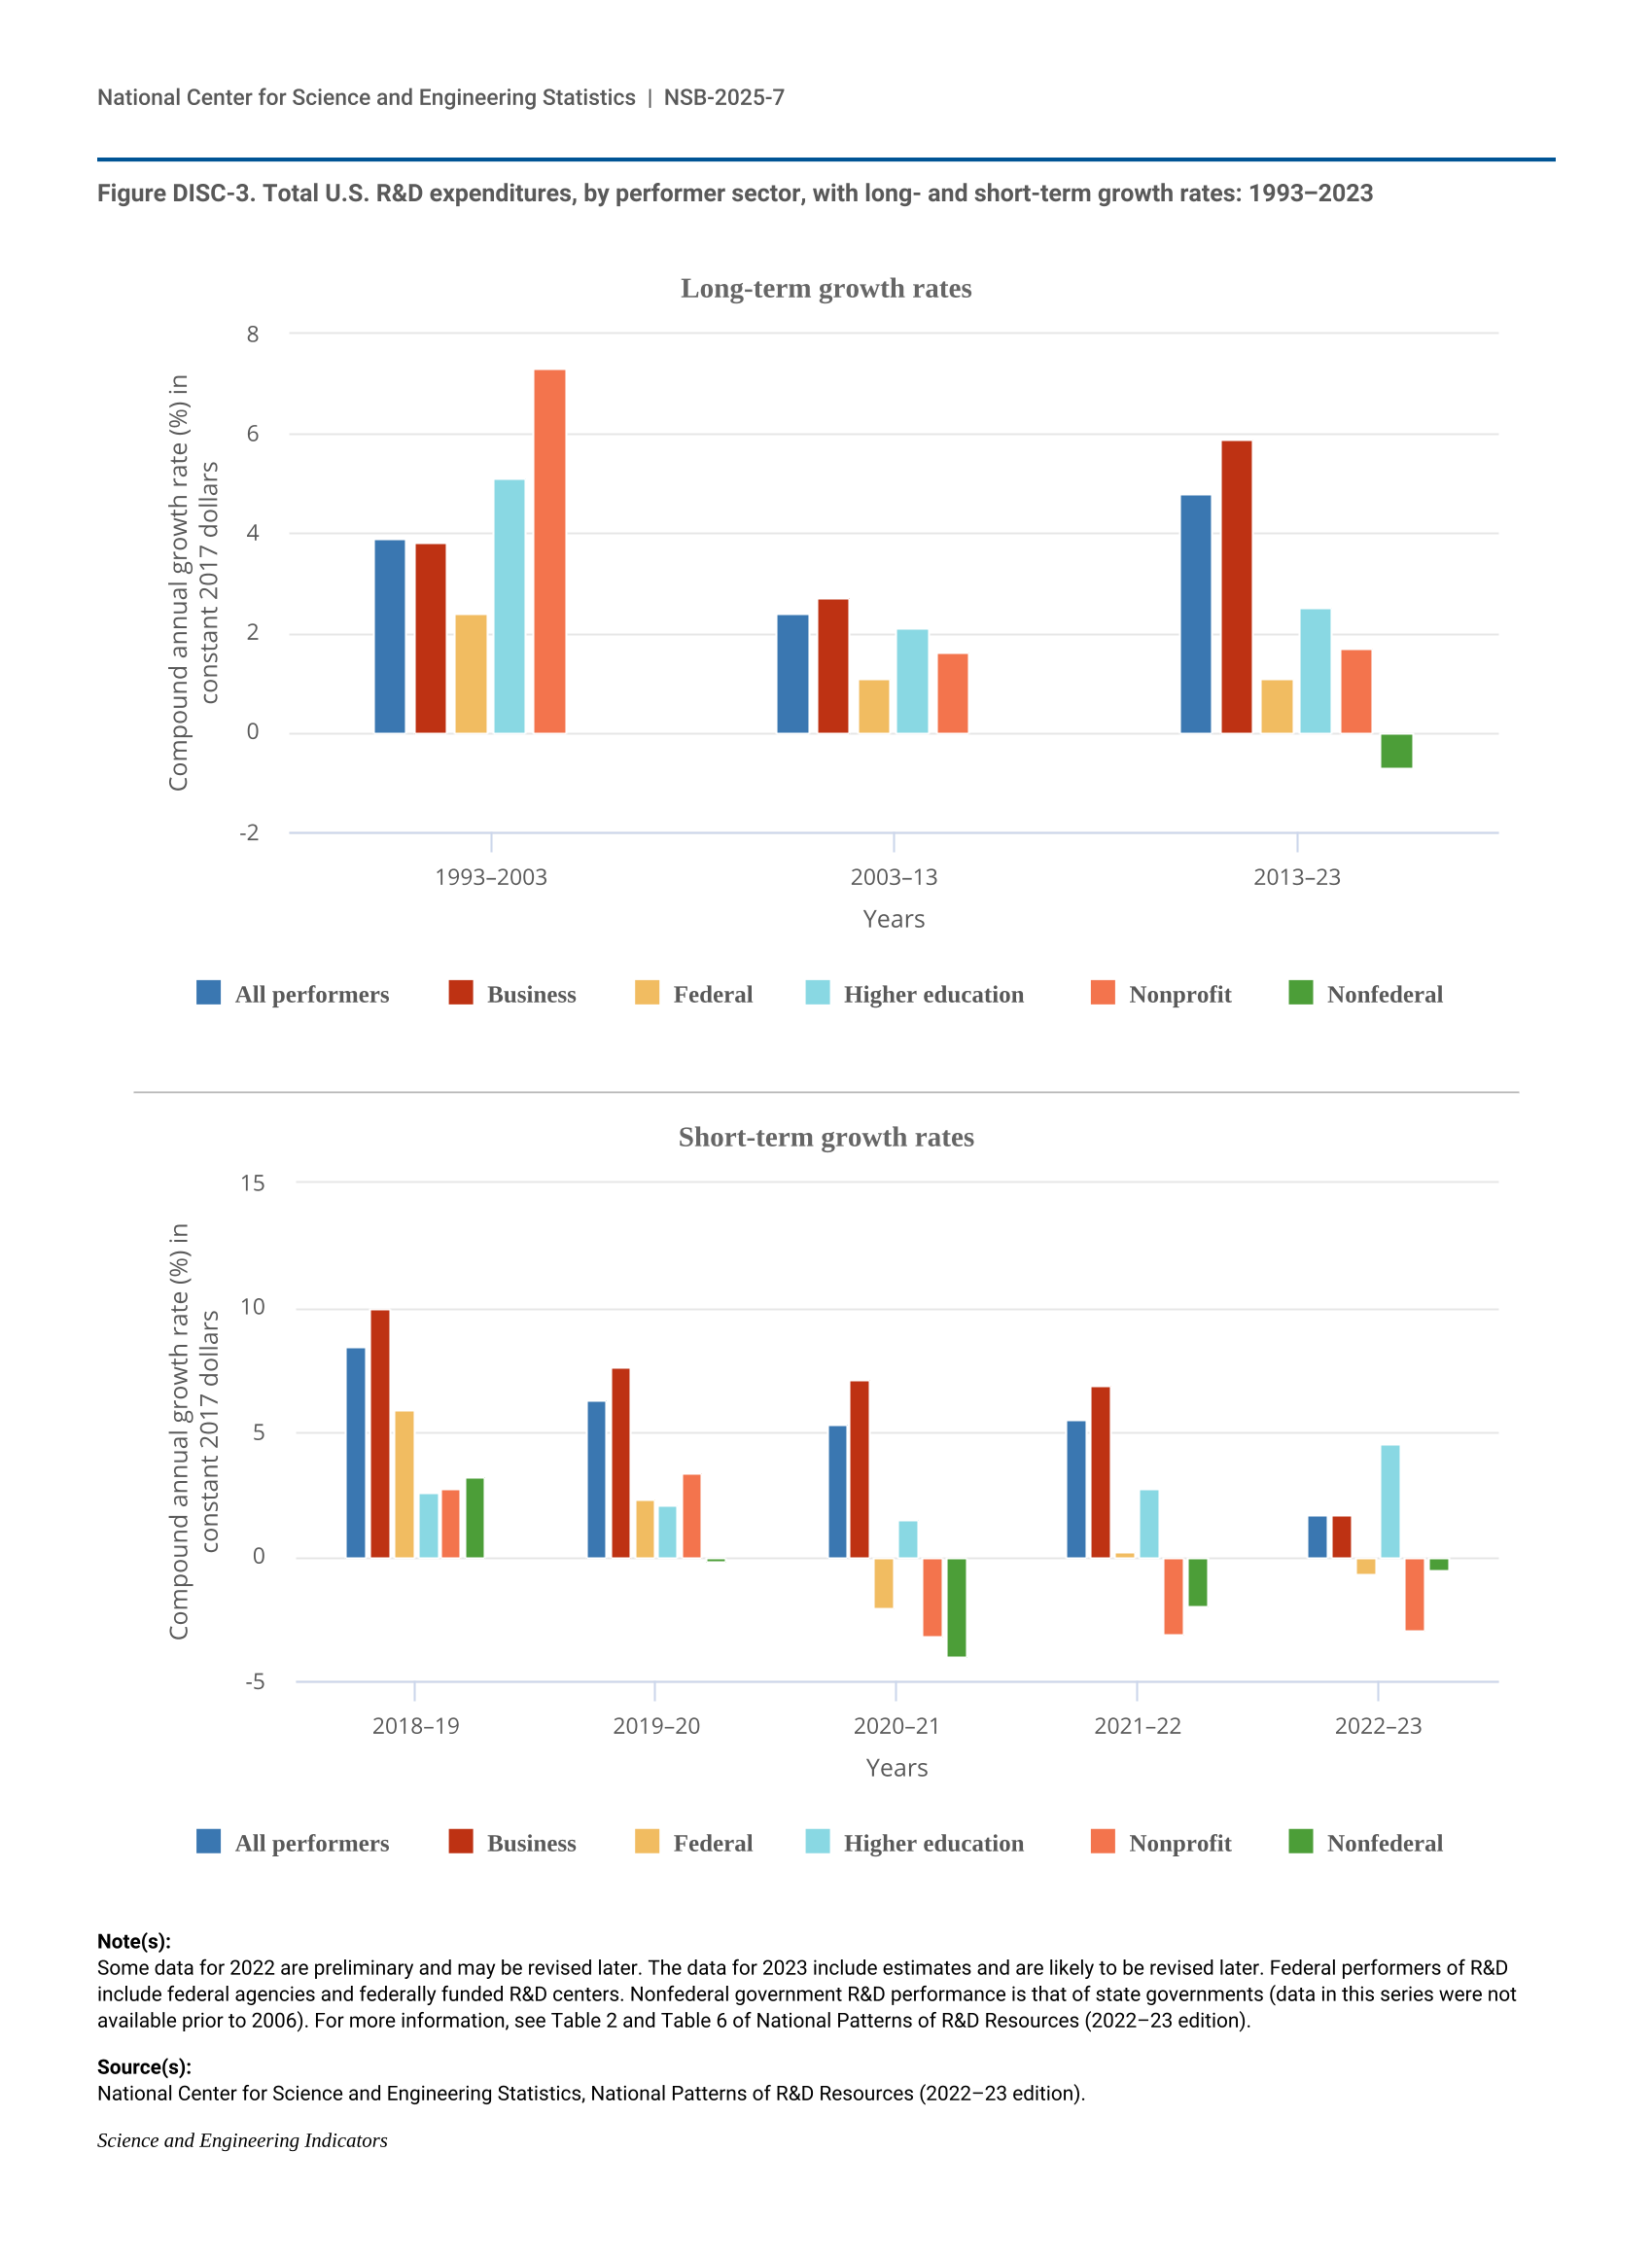
Figure DISC-3.
Total U.S. R&D expenditures, by performer sector, with long- and short-term growth rates: 1993‒2023
Total U.S. R&D expenditures, by performer sector, with long- and short-term growth rates: 1993‒2023
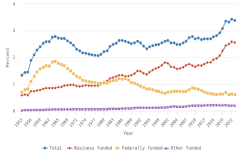
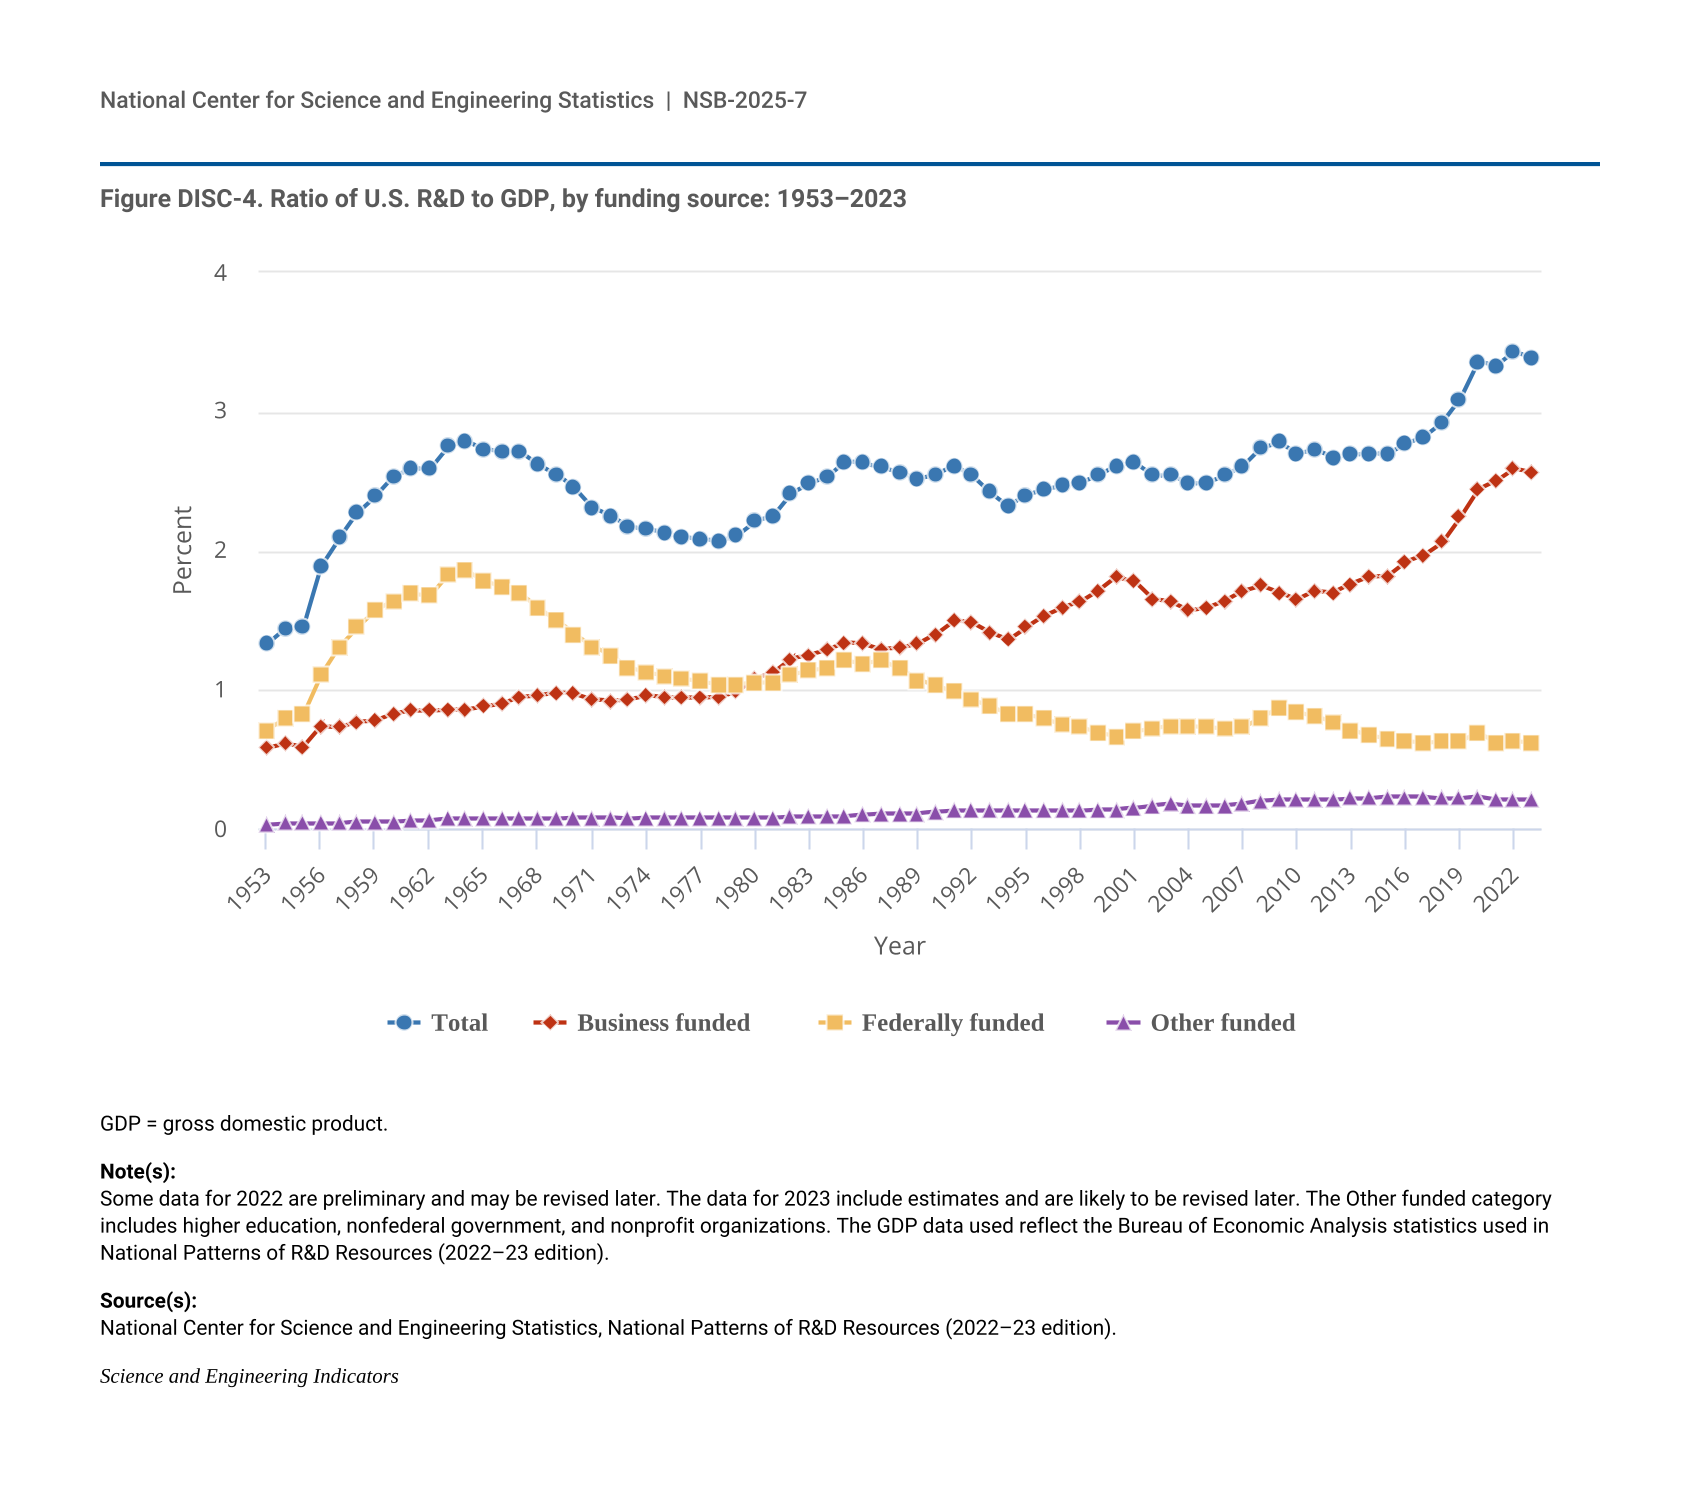
Figure DISC-4.
Ratio of U.S. R&D to GDP, by funding source: 1953–2023
Ratio of U.S. R&D to GDP, by funding source: 1953–2023
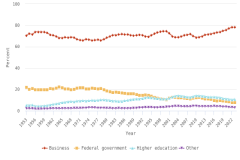
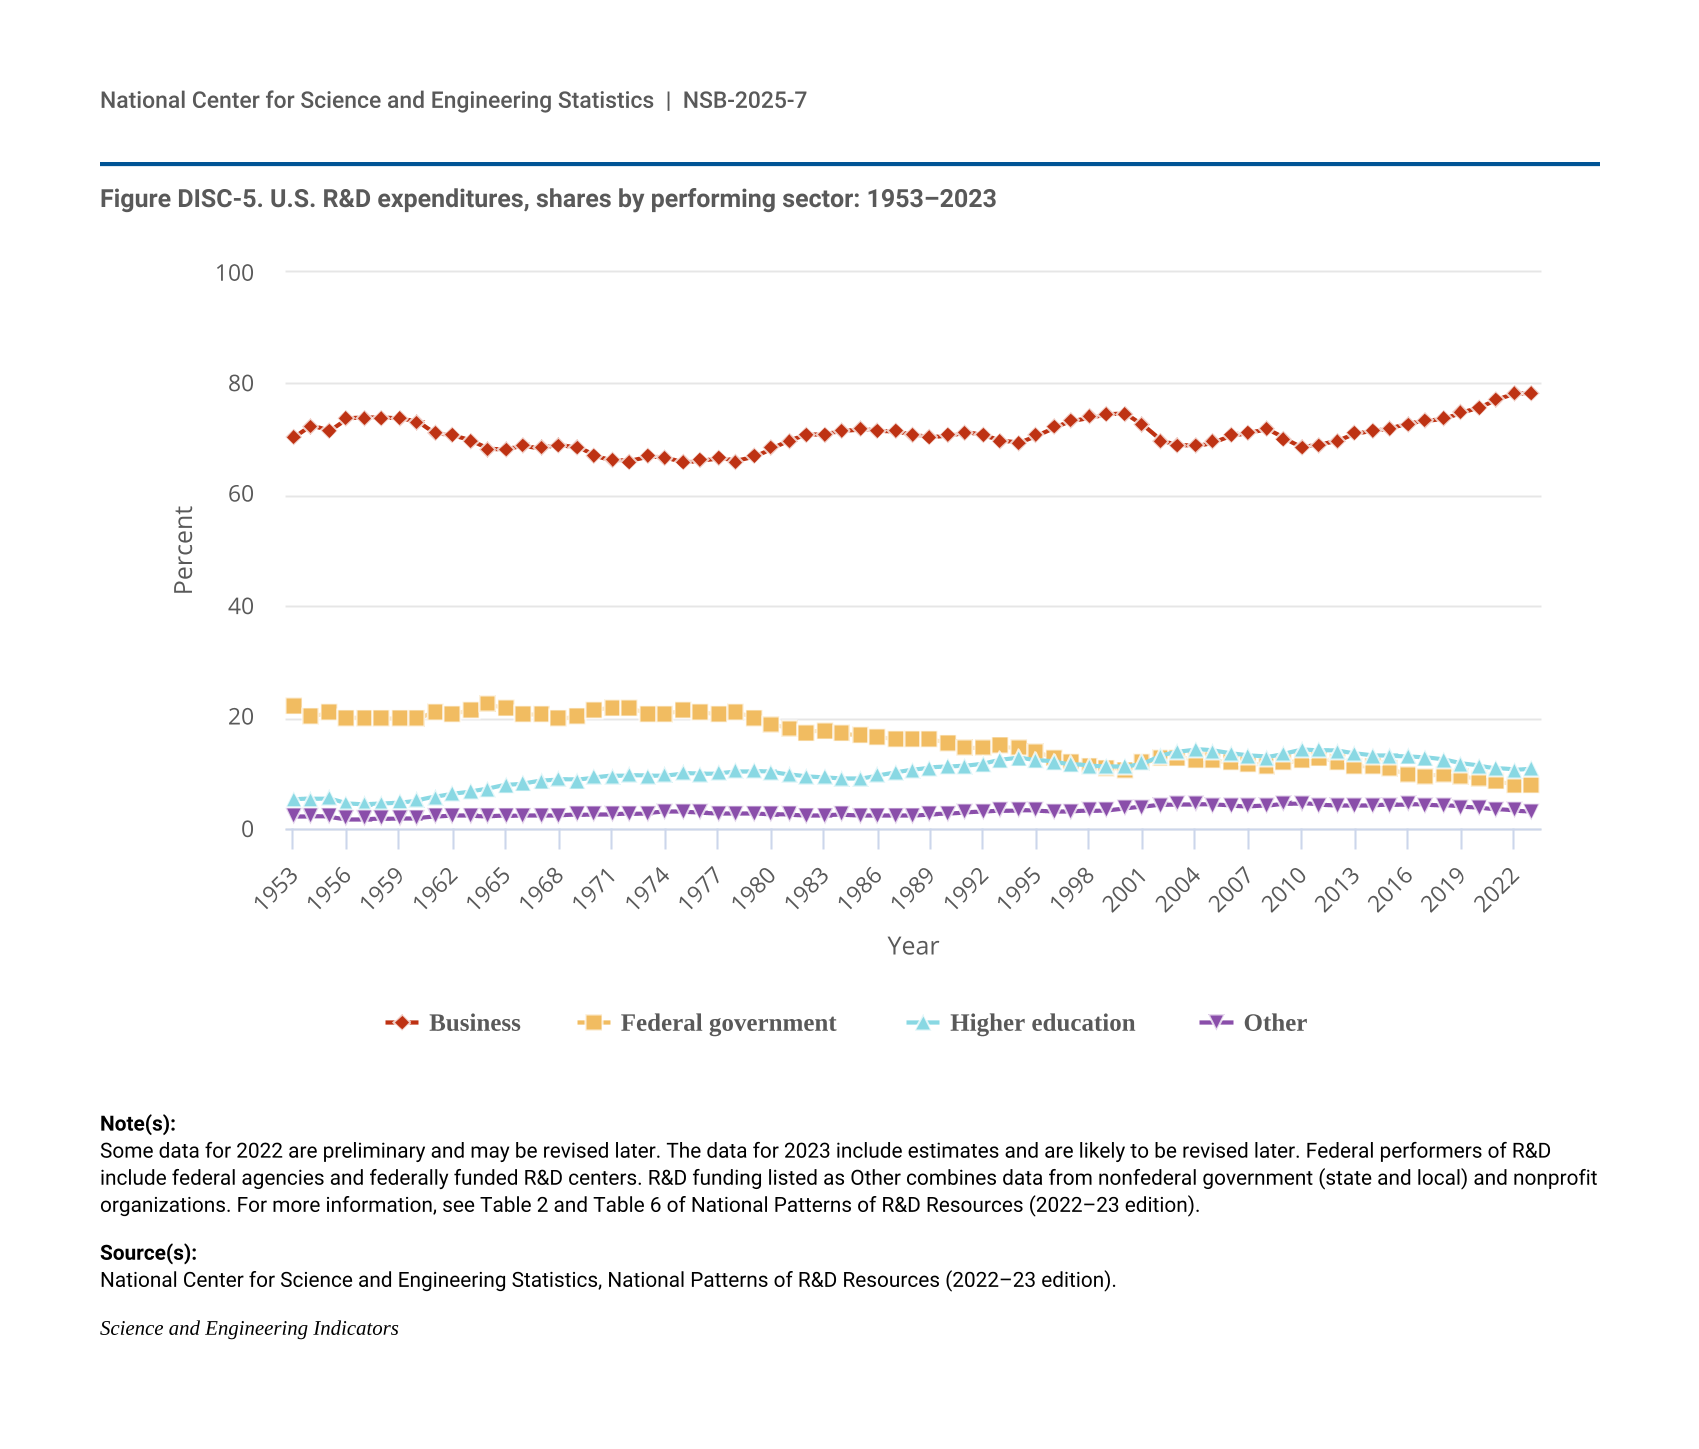
Figure DISC-5.
U.S. R&D expenditures, shares by performing sector: 1953–2023
U.S. R&D expenditures, shares by performing sector: 1953–2023
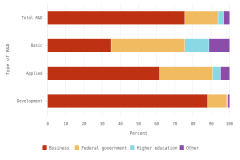
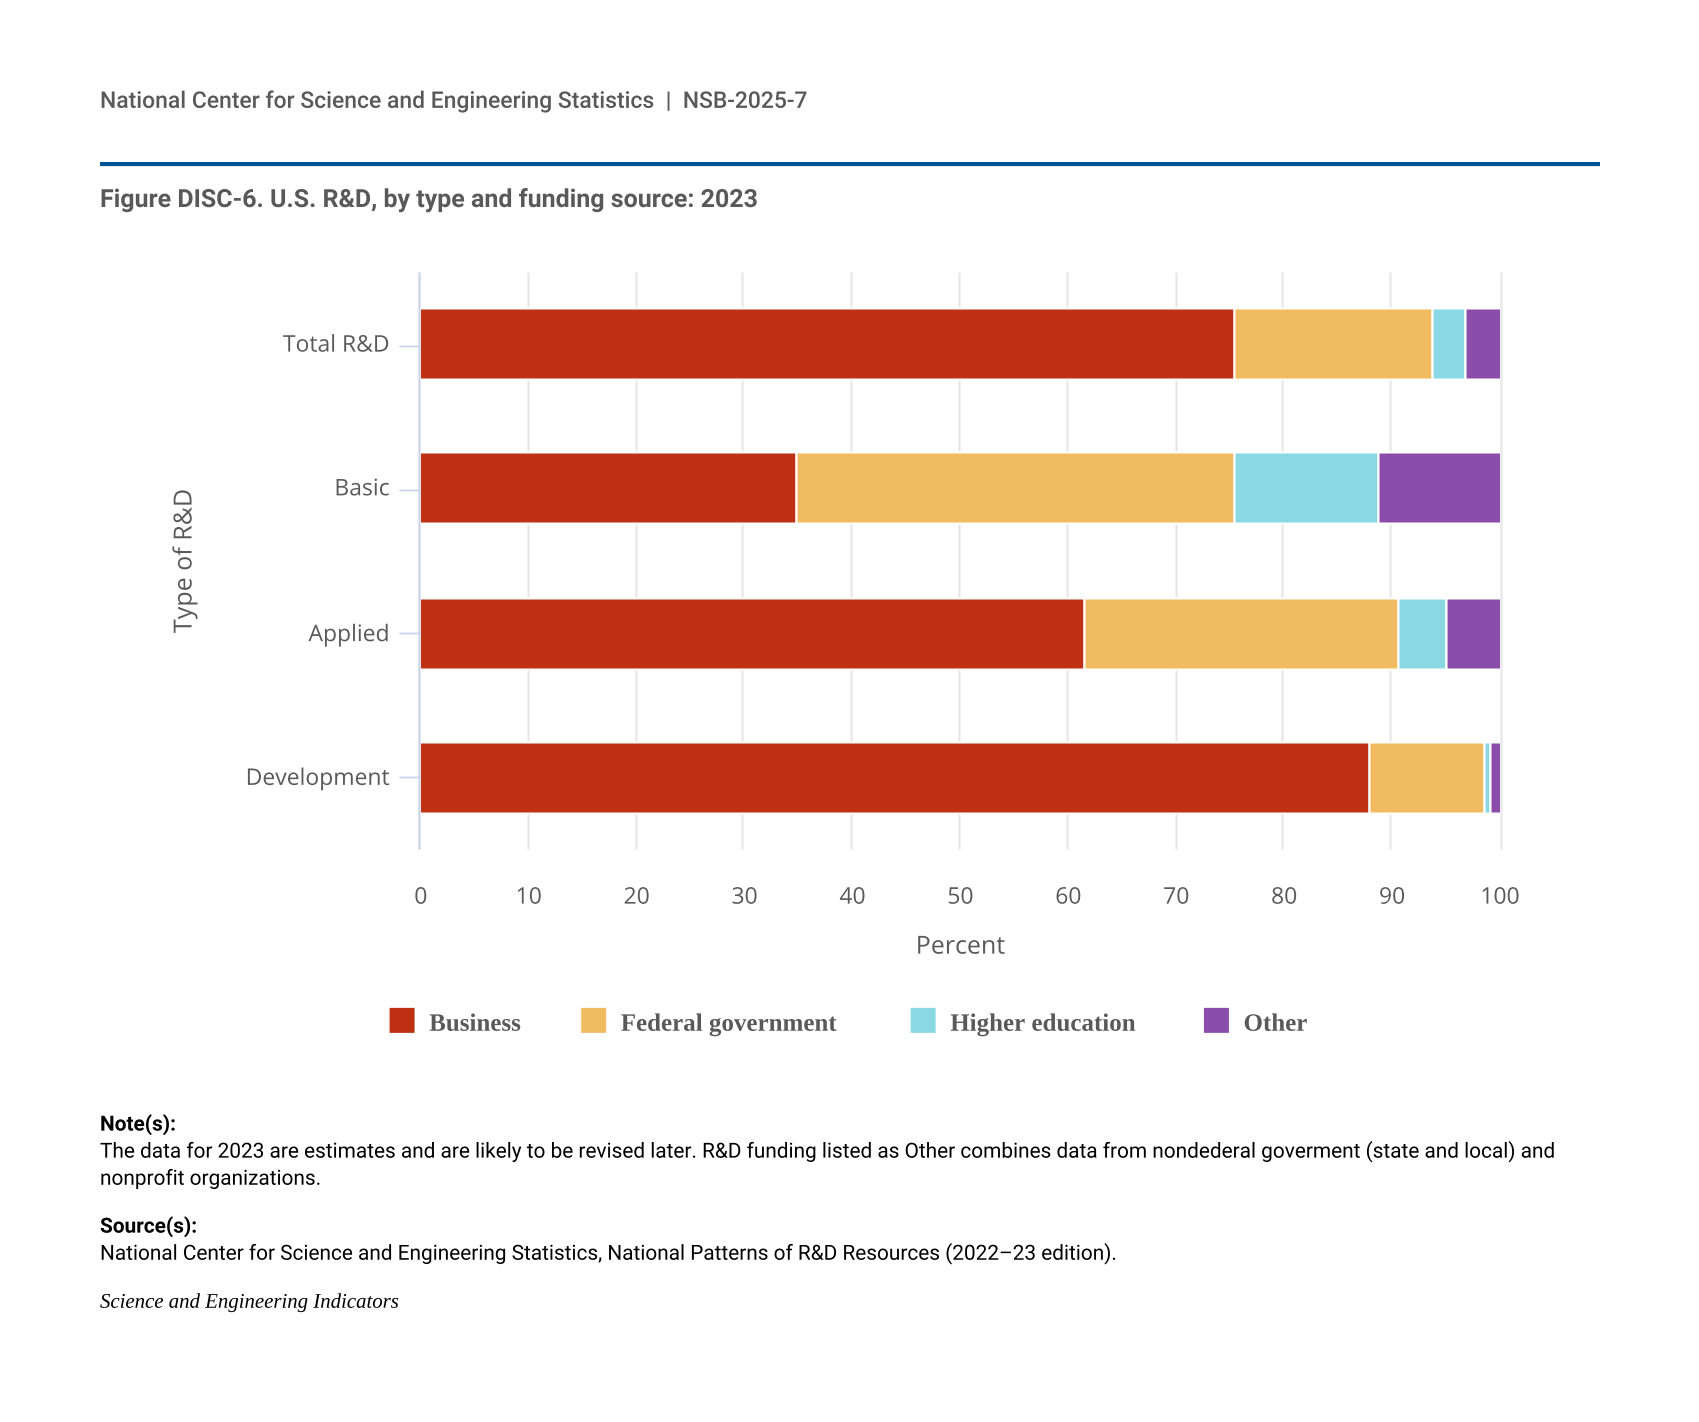
Figure DISC-6.
U.S. R&D, by type and funding source: 2023
U.S. R&D, by type and funding source: 2023
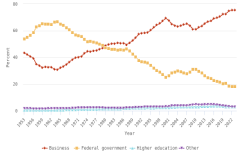
Figure DISC-7.
U.S. R&D expenditures, shares by funding sector: 1953–2023
U.S. R&D expenditures, shares by funding sector: 1953–2023
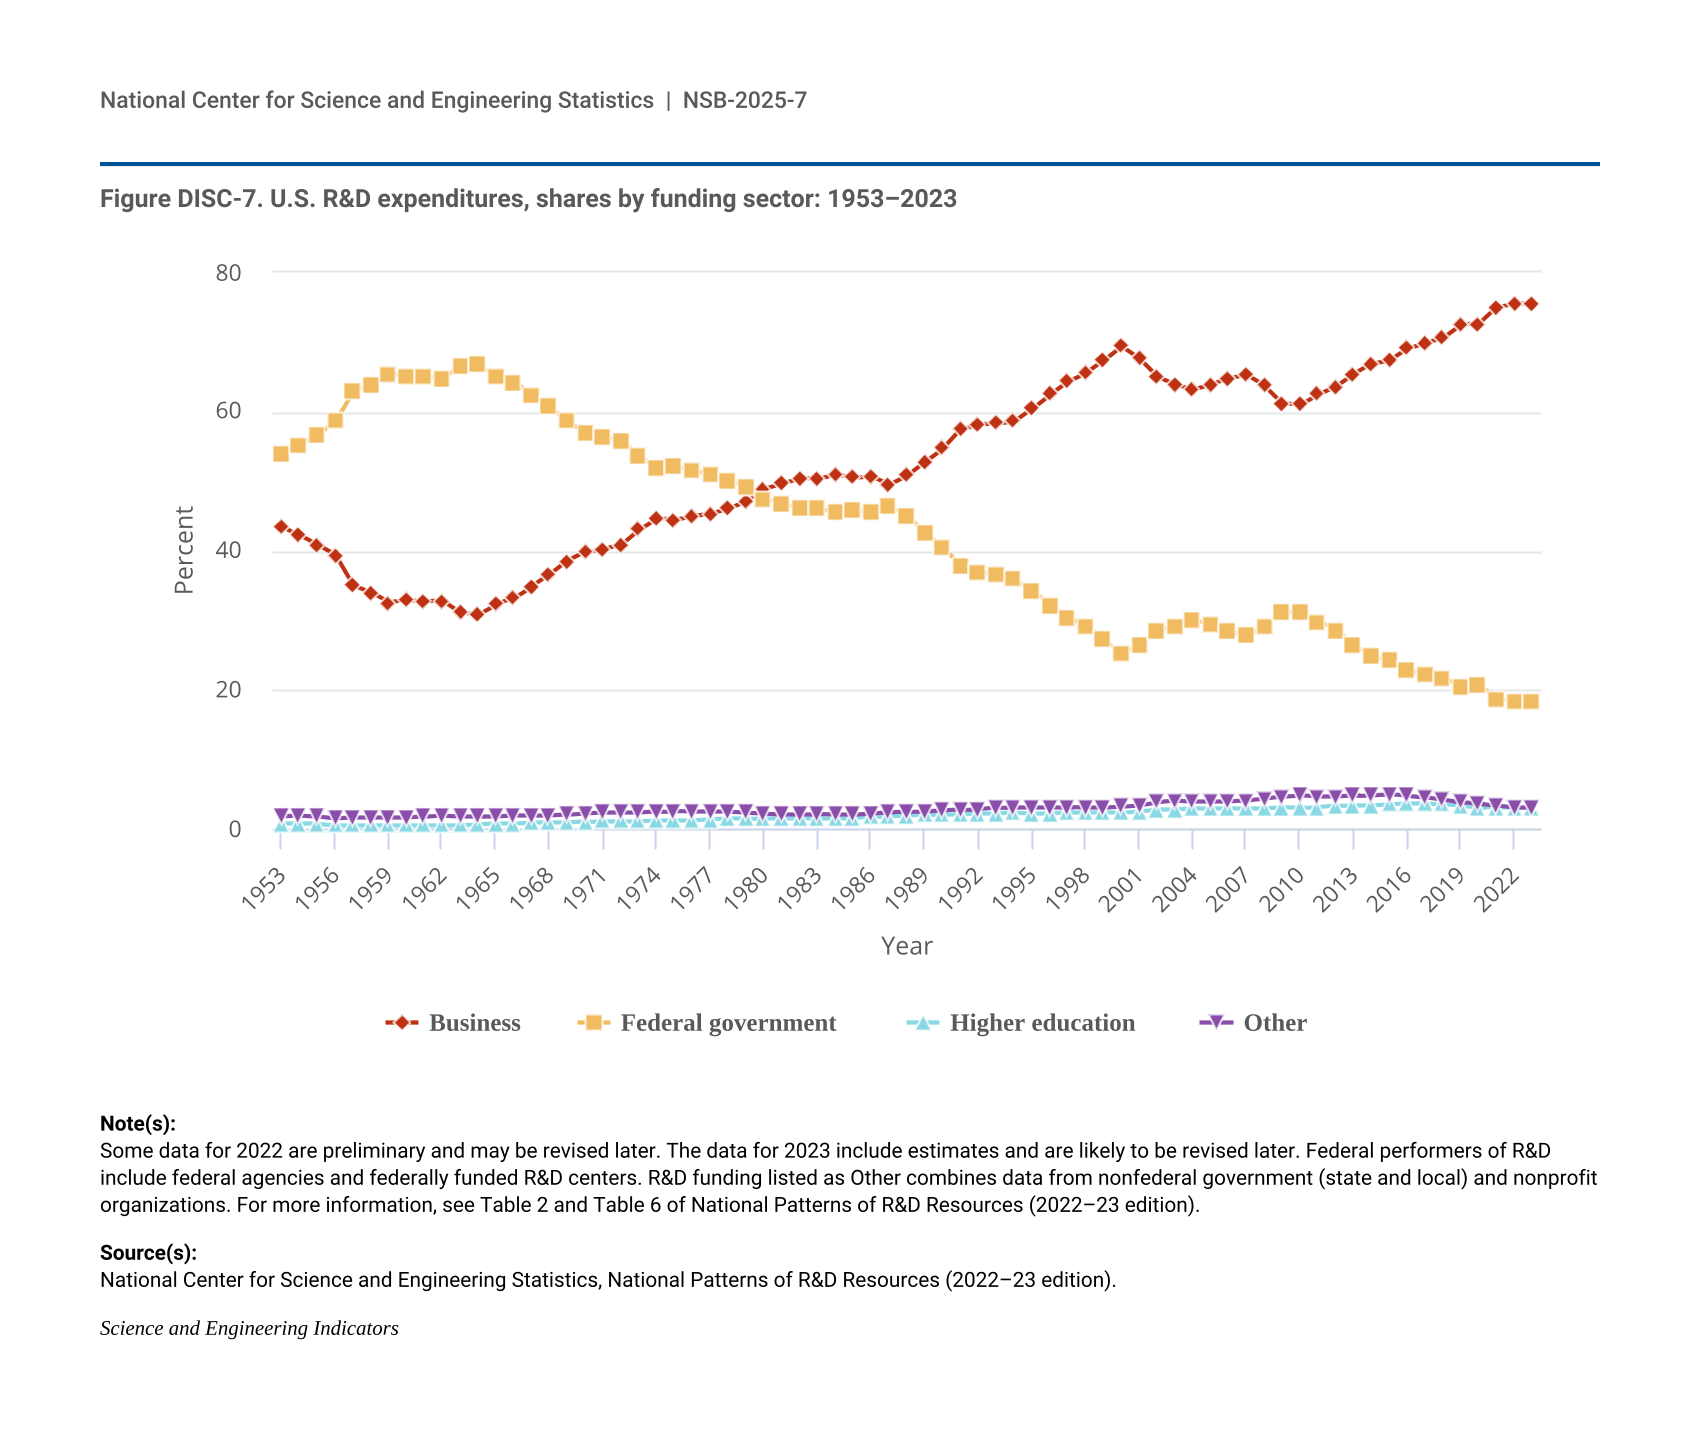
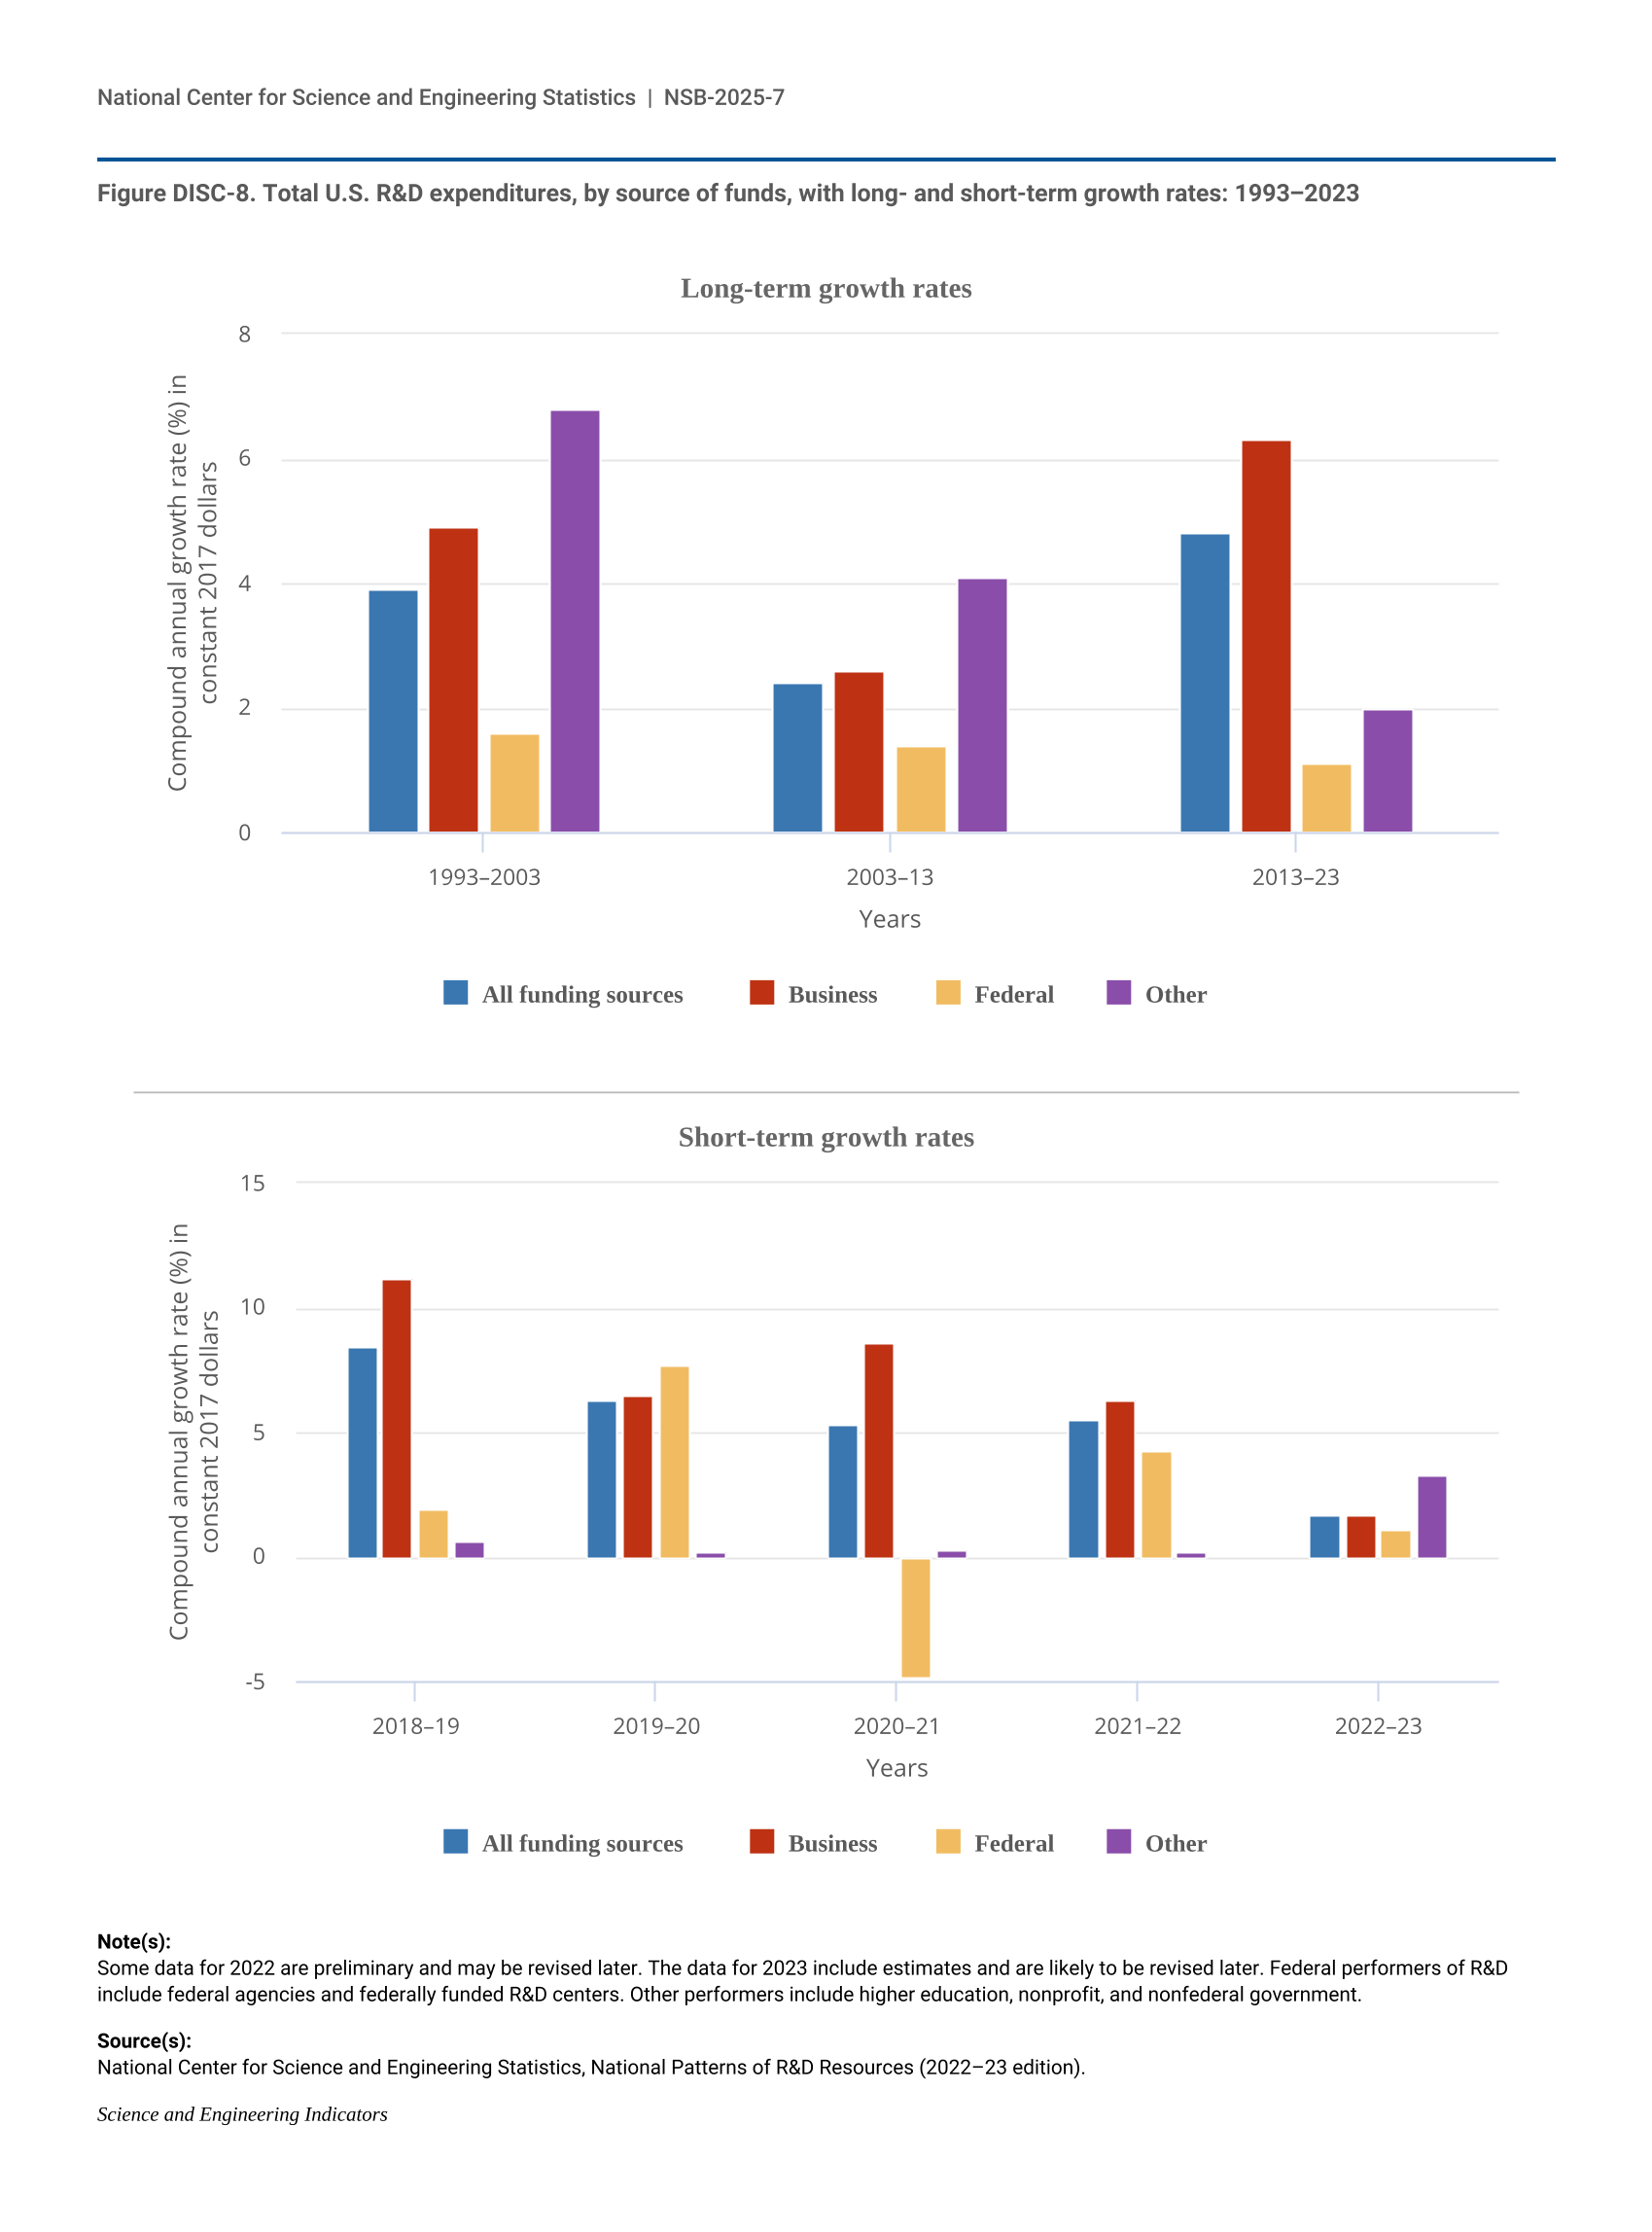
Figure DISC-8.
Total U.S. R&D expenditures, by source of funds, with long- and short-term growth rates: 1993‒2023
Total U.S. R&D expenditures, by source of funds, with long- and short-term growth rates: 1993‒2023
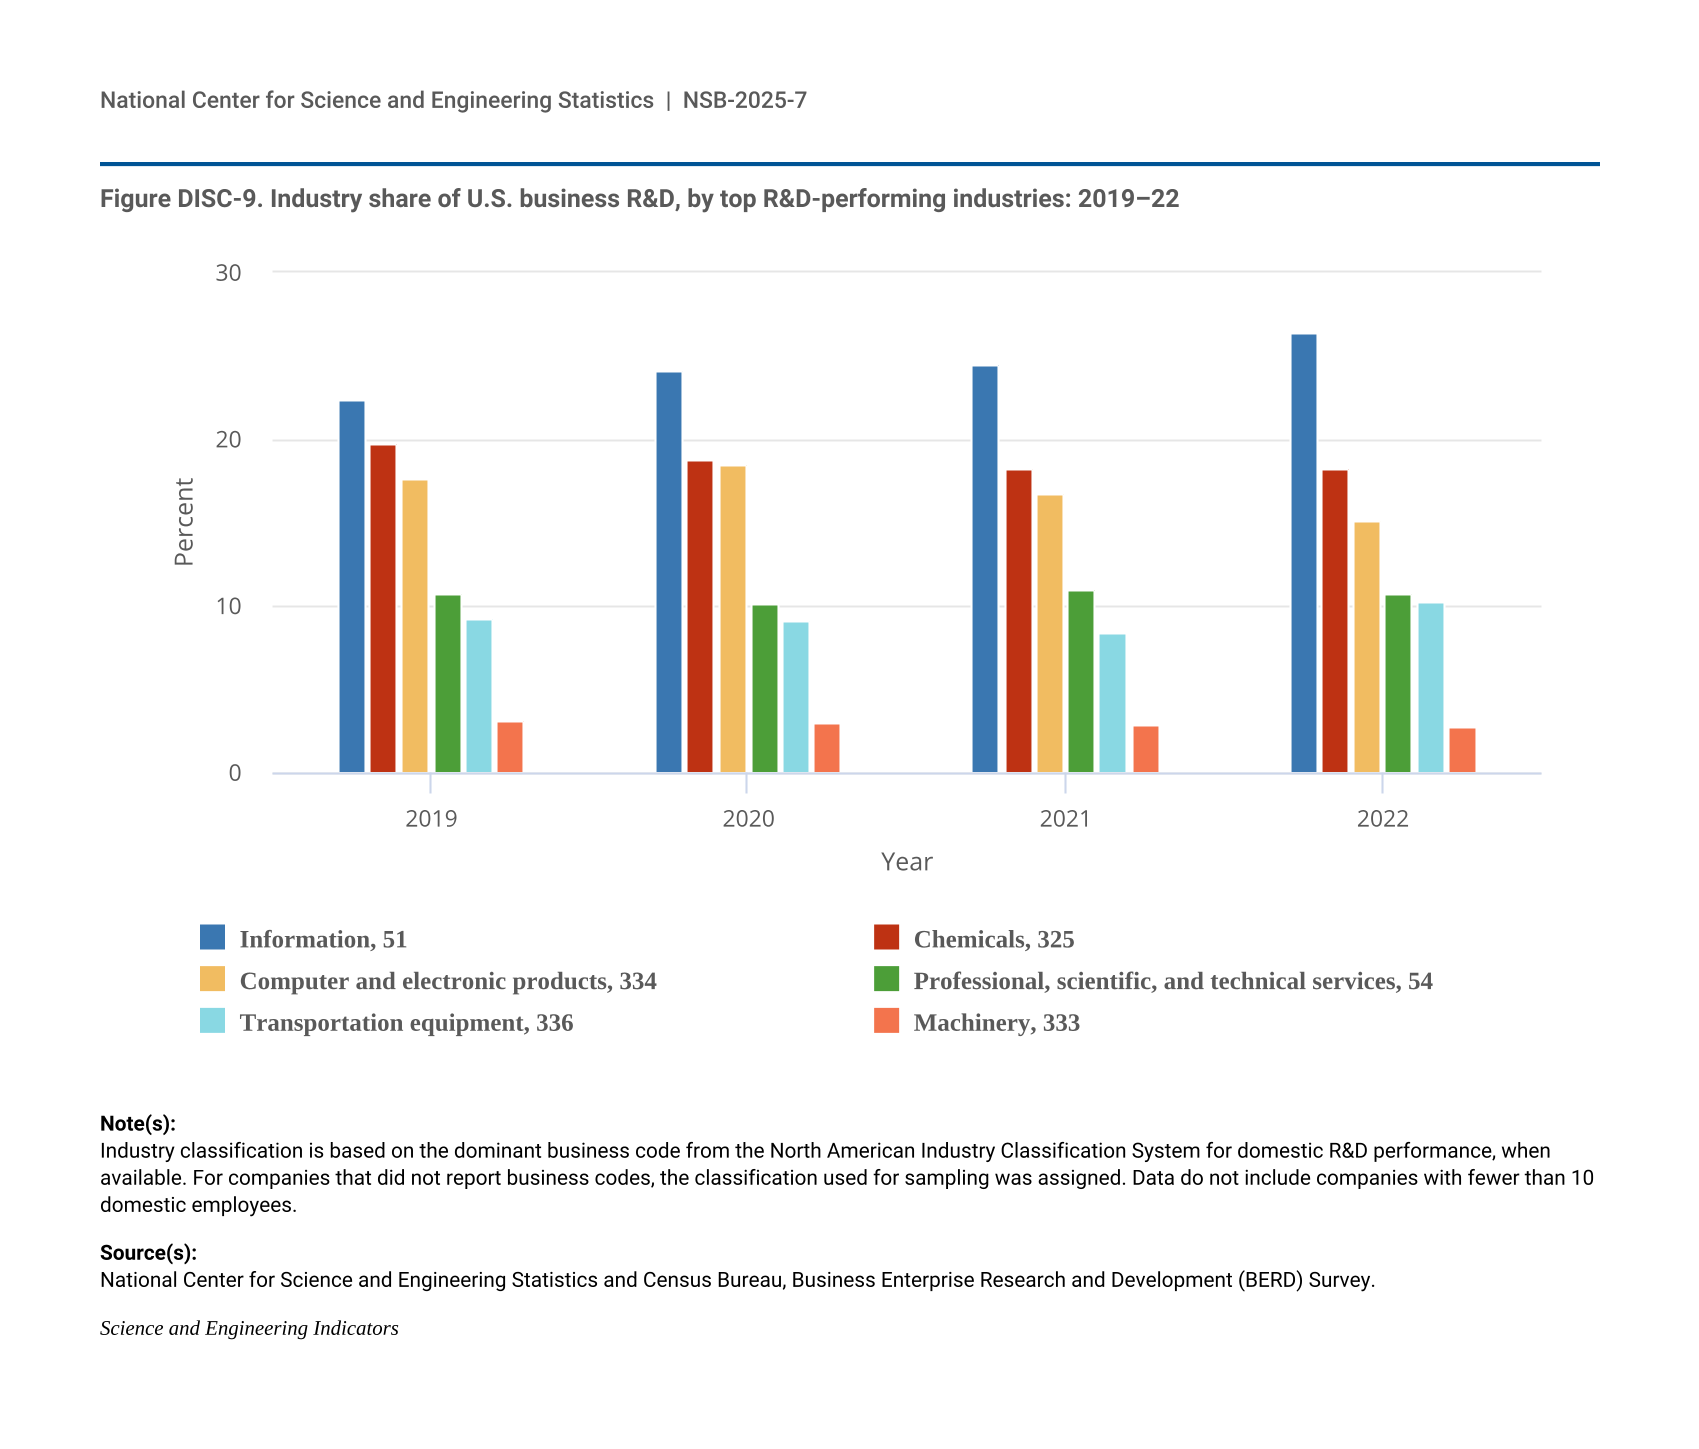
Figure DISC-9.
Industry share of U.S. business R&D, by top R&D-performing industries: 2019–22
Industry share of U.S. business R&D, by top R&D-performing industries: 2019–22
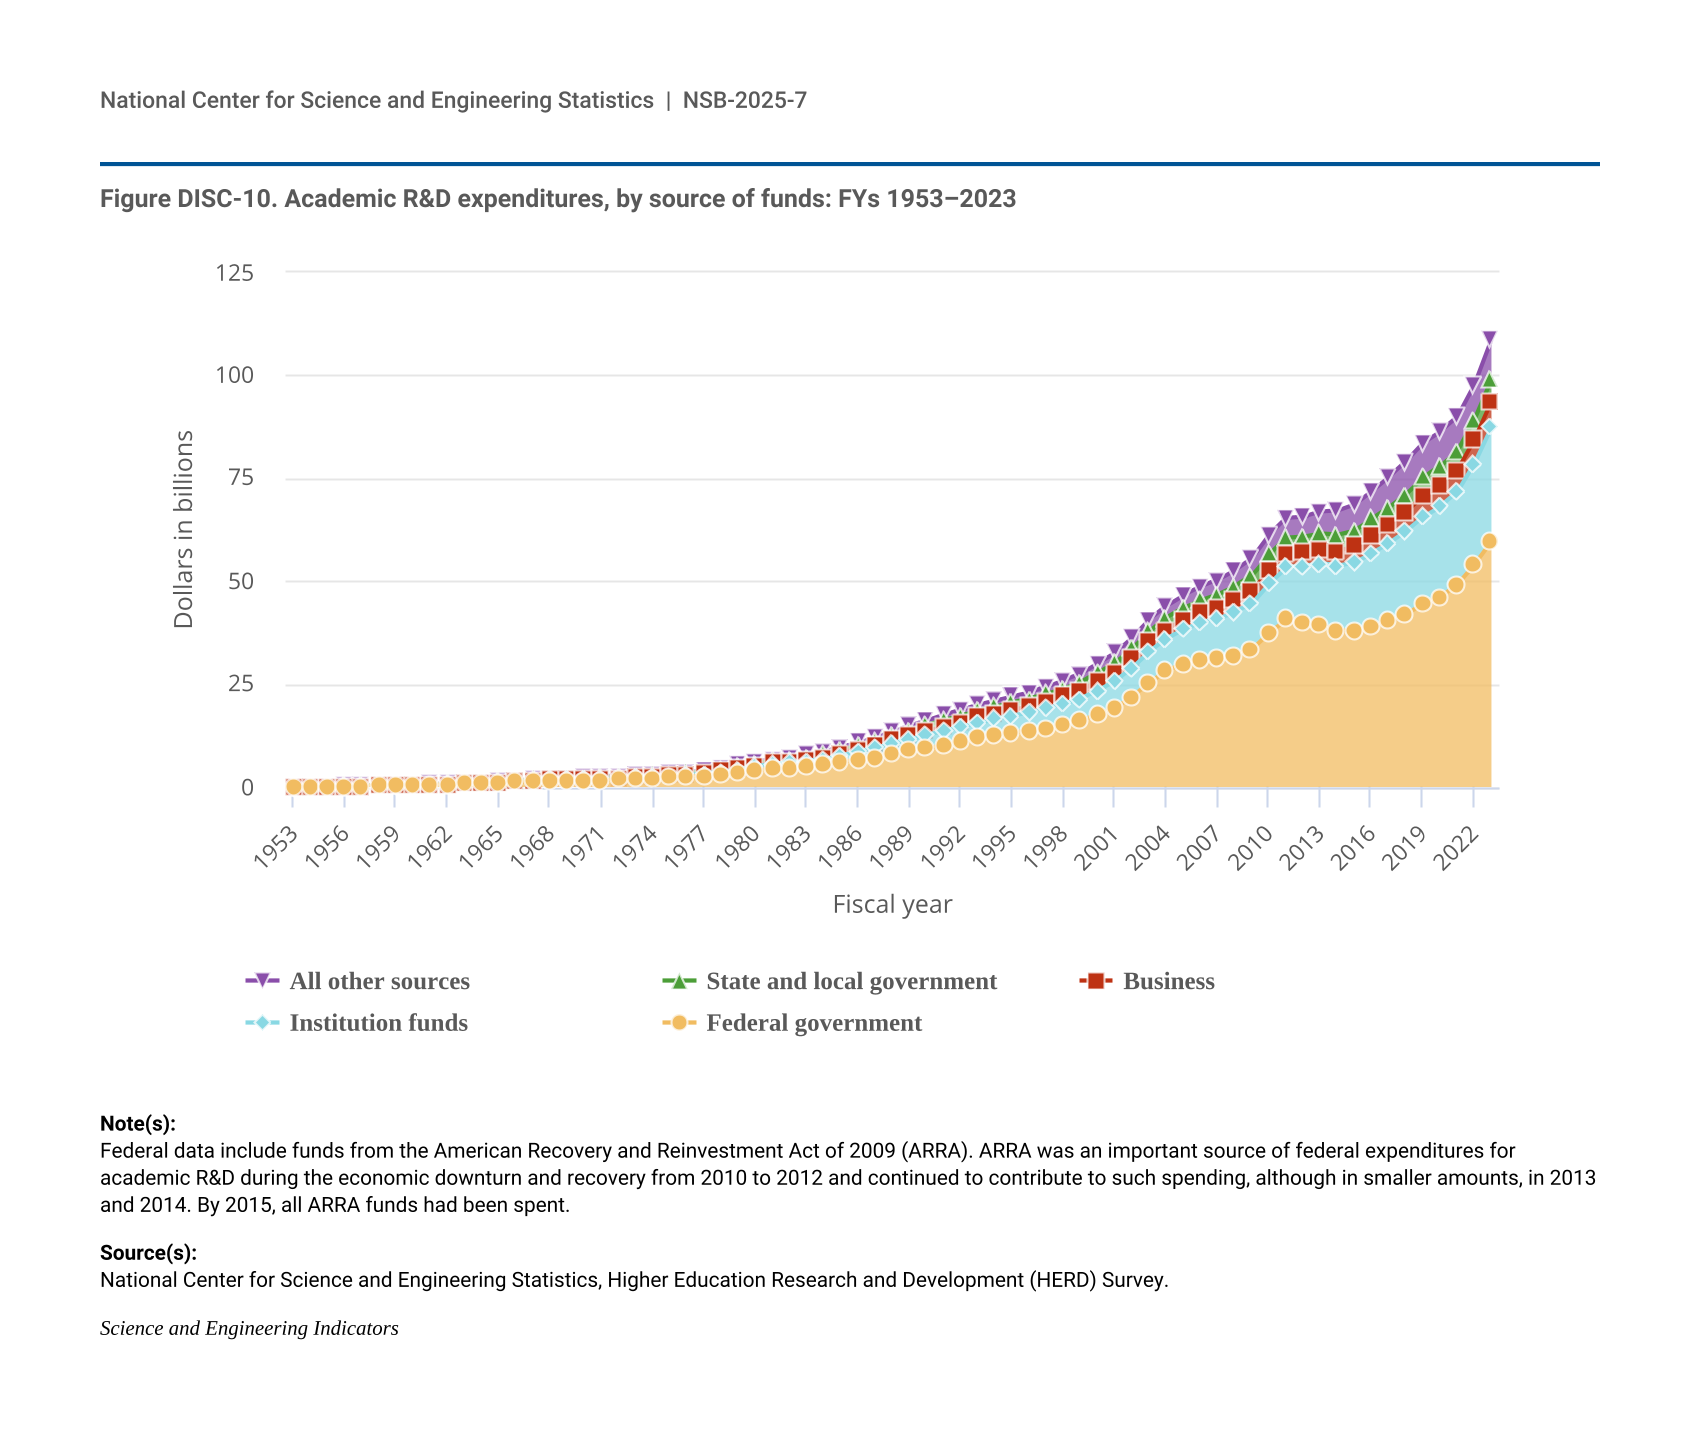
Figure DISC-10.
Academic R&D expenditures, by source of funds: FYs 1953–2023
Academic R&D expenditures, by source of funds: FYs 1953–2023
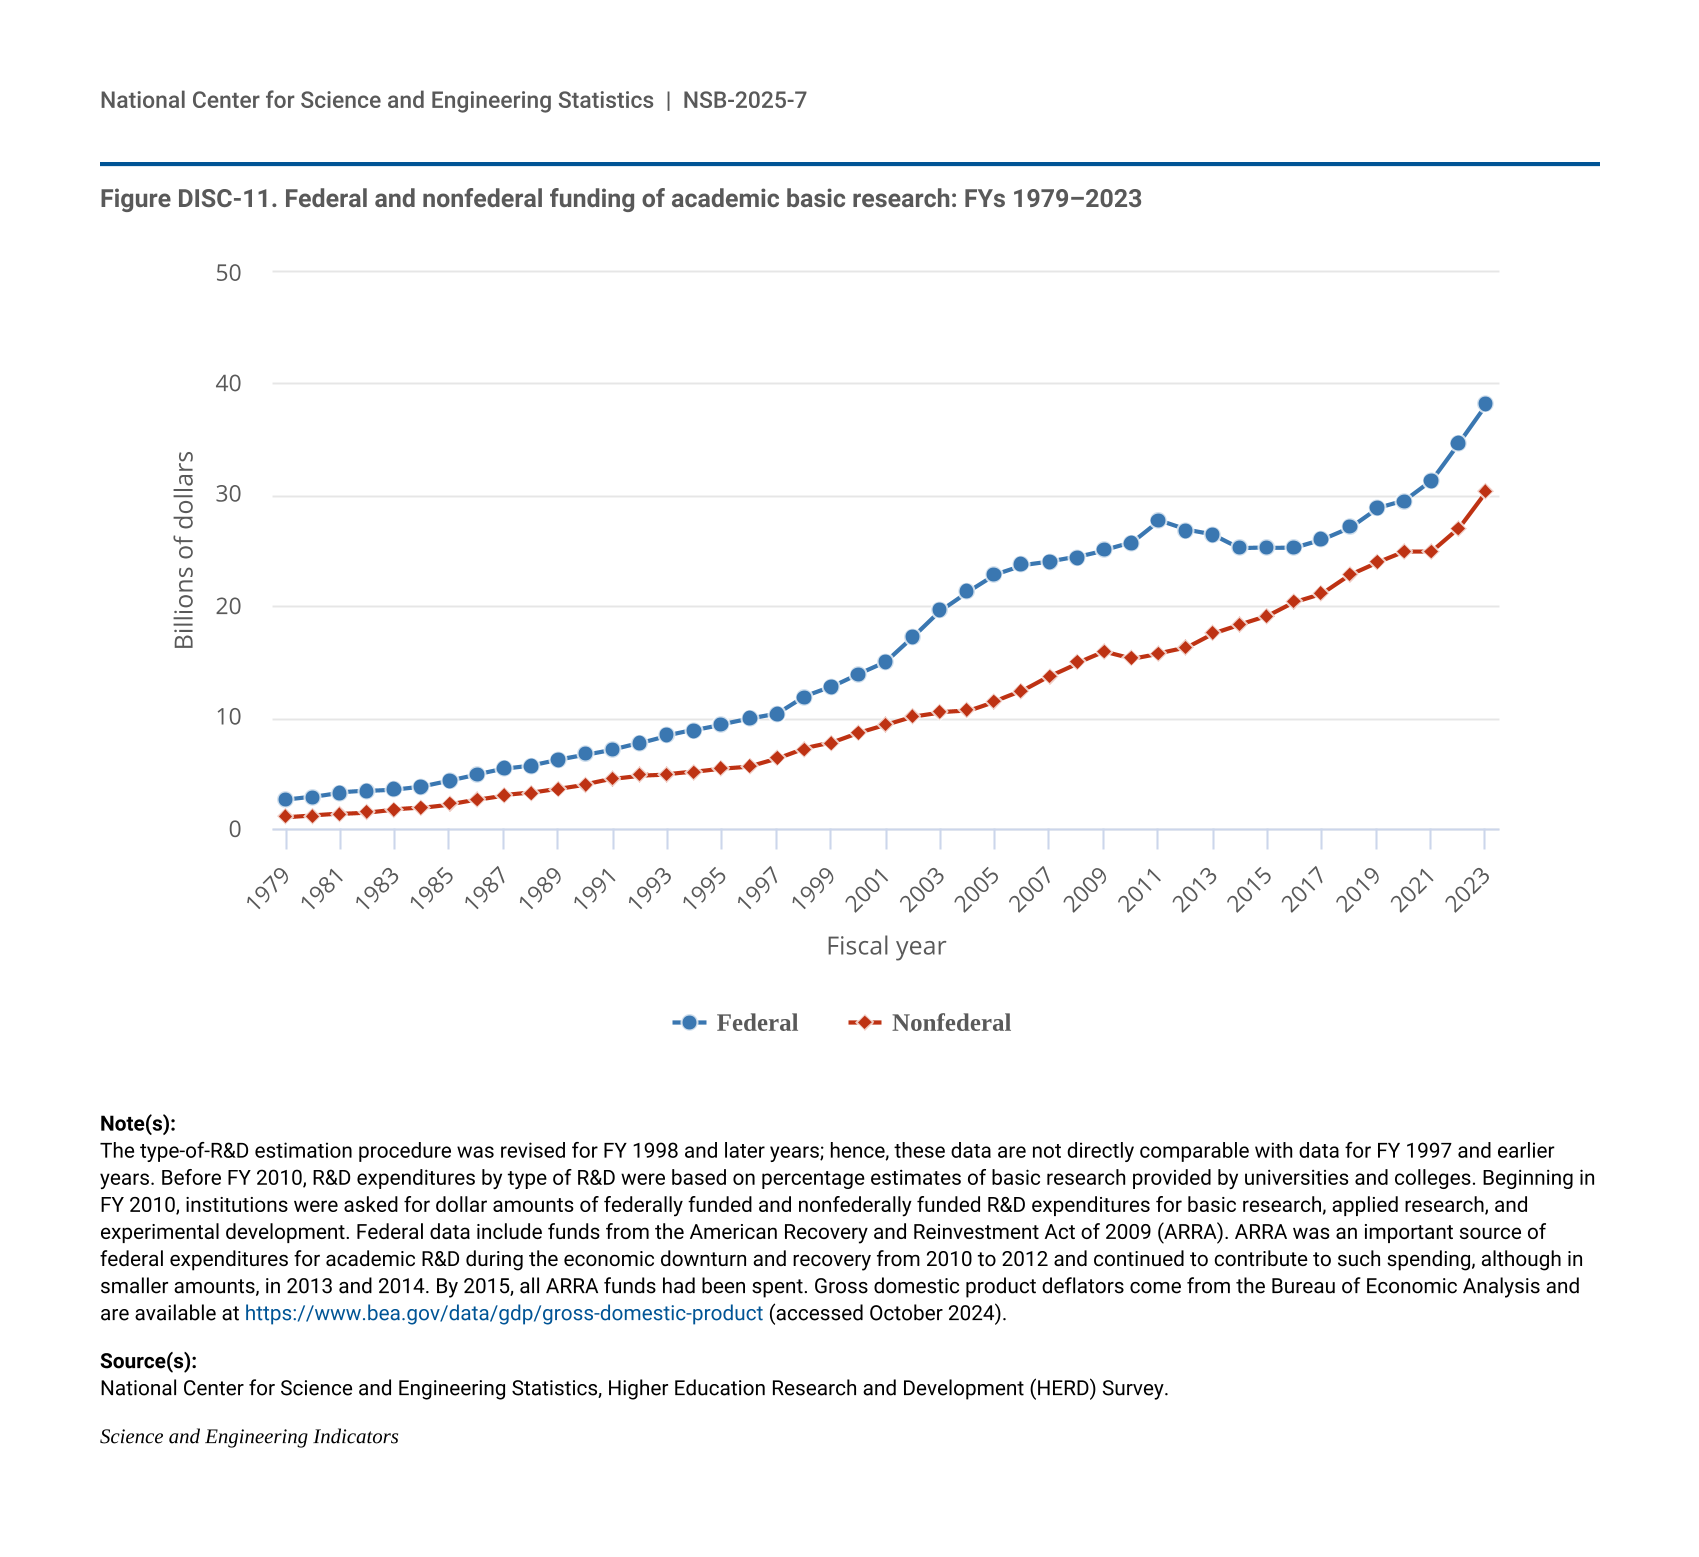
Figure DISC-11.
Federal and nonfederal funding of academic basic research: FYs 1979–2023
Federal and nonfederal funding of academic basic research: FYs 1979–2023
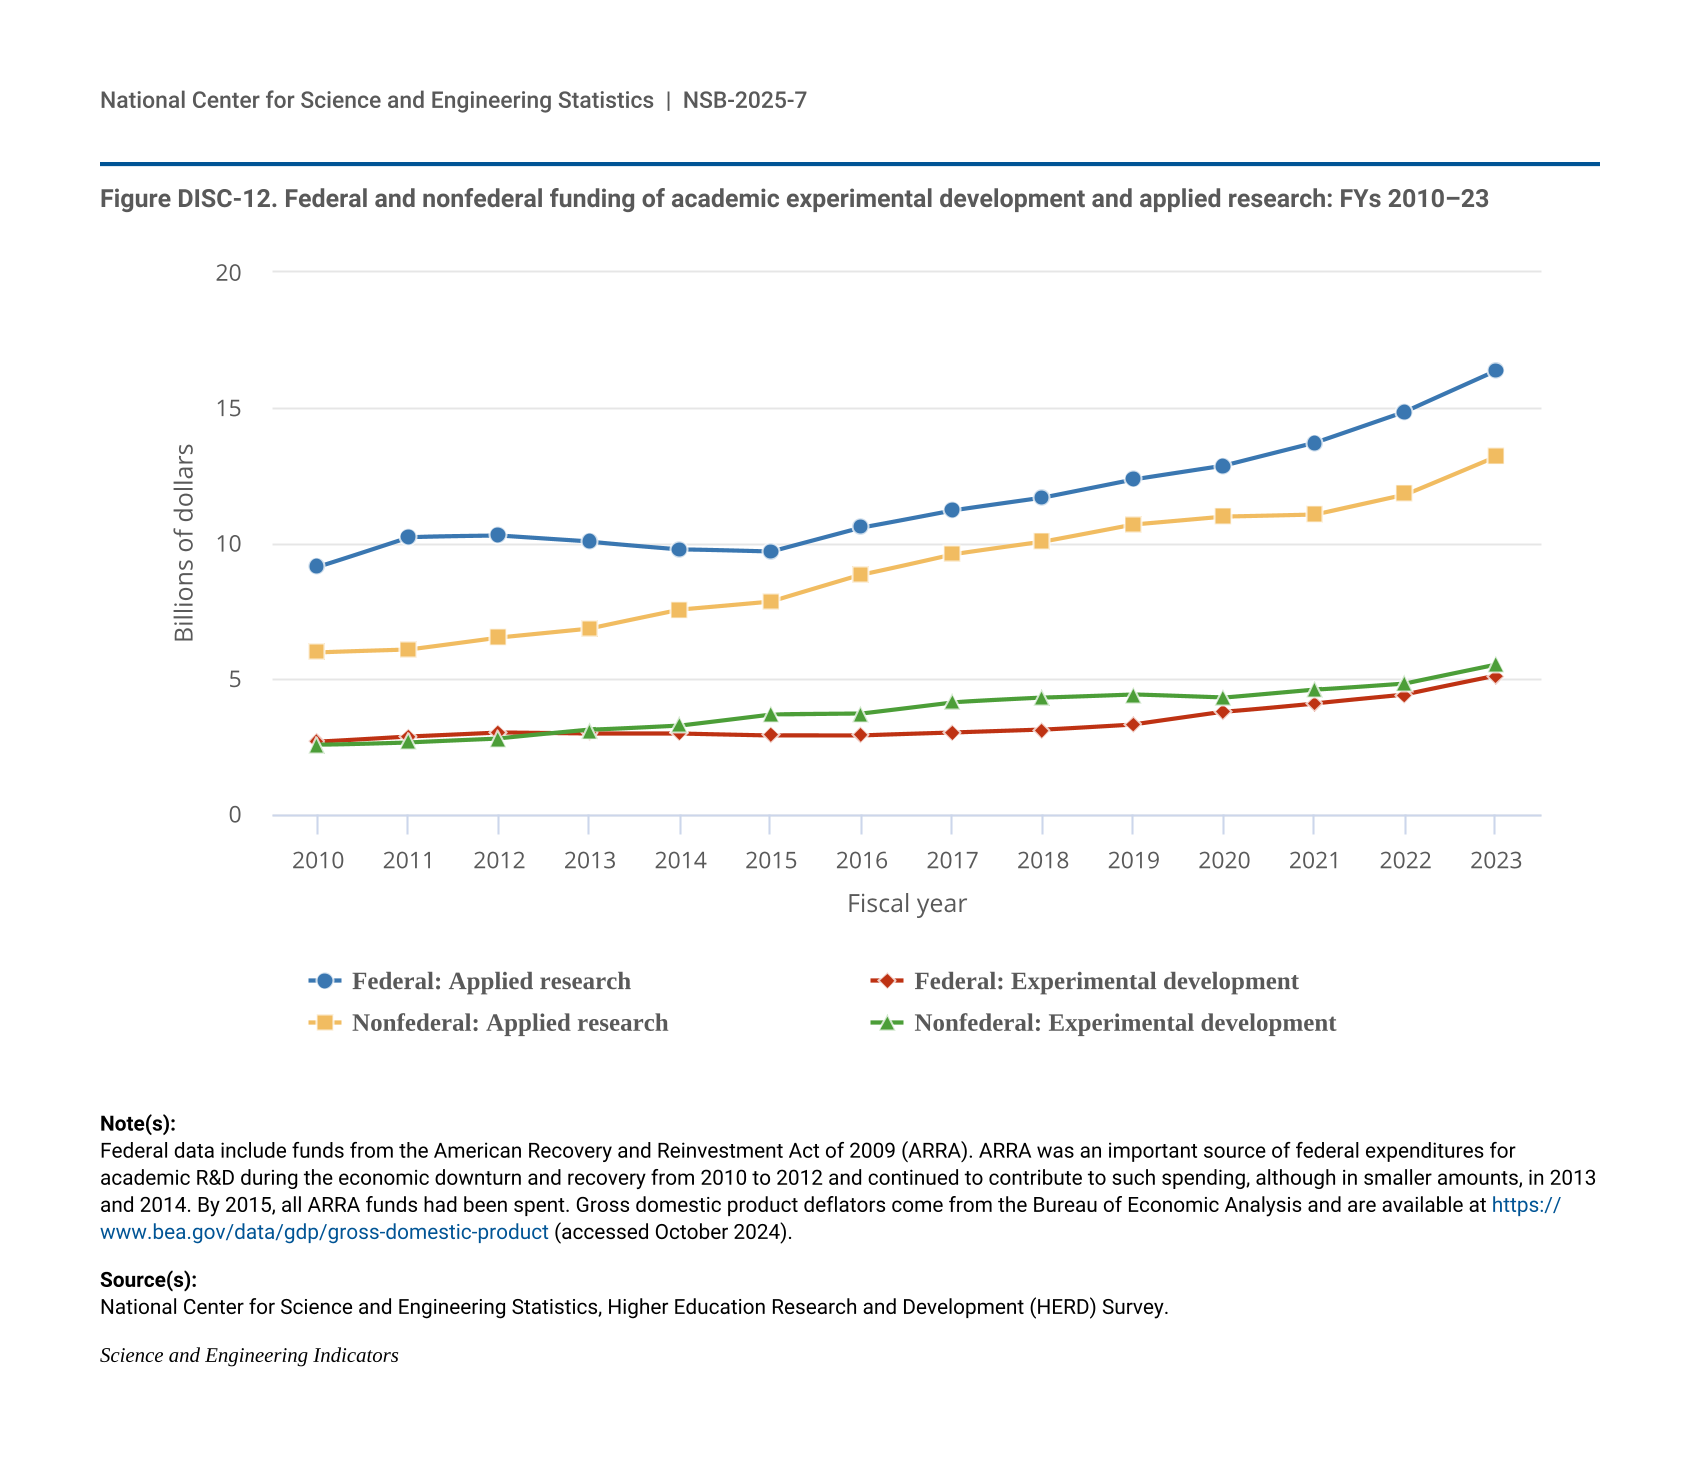
Figure DISC-12.
Federal and nonfederal funding of academic experimental development and applied research: FYs 2010–23
Federal and nonfederal funding of academic experimental development and applied research: FYs 2010–23
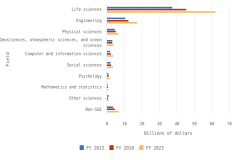
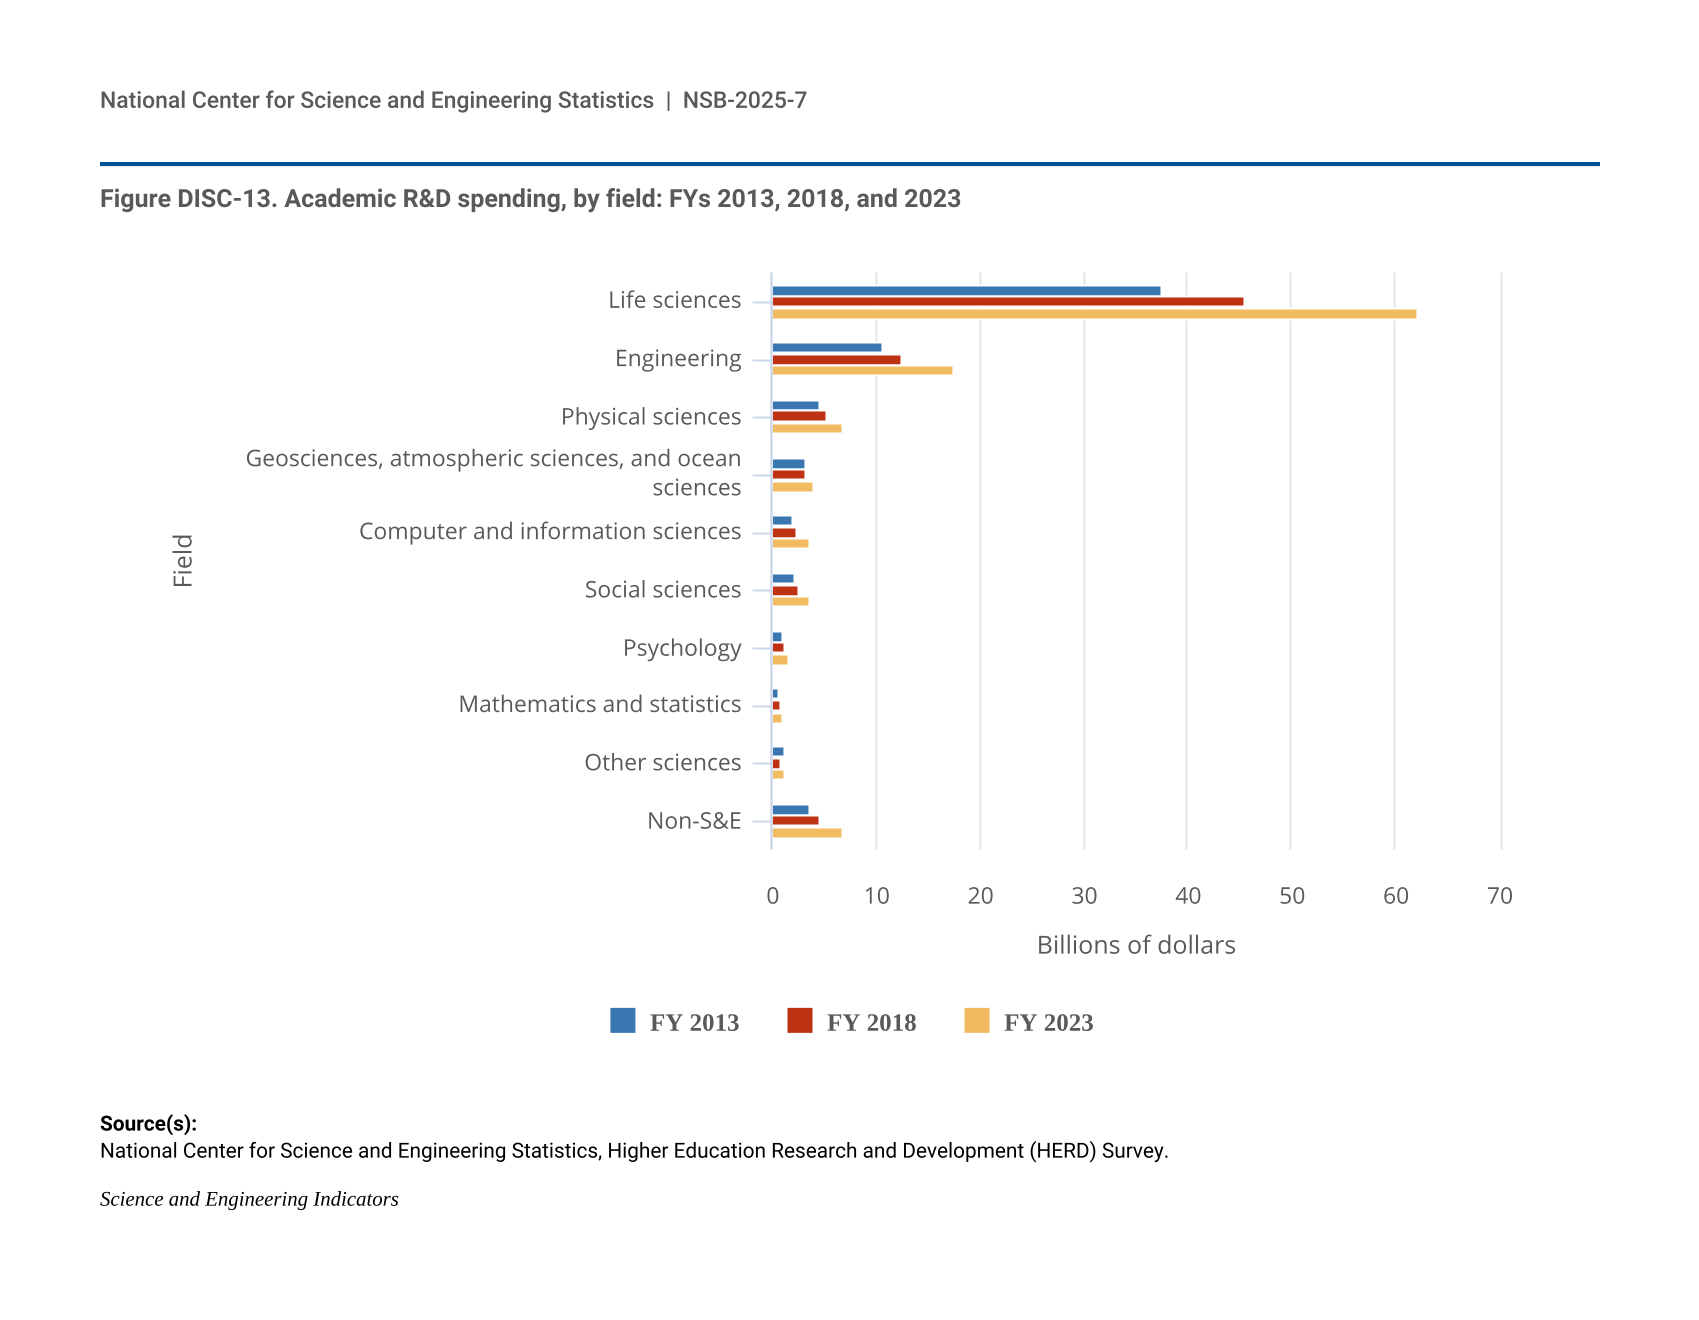
Figure DISC-13.
Academic R&D spending, by field: FYs 2013, 2018, and 2023
Academic R&D spending, by field: FYs 2013, 2018, and 2023
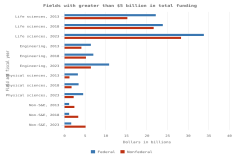
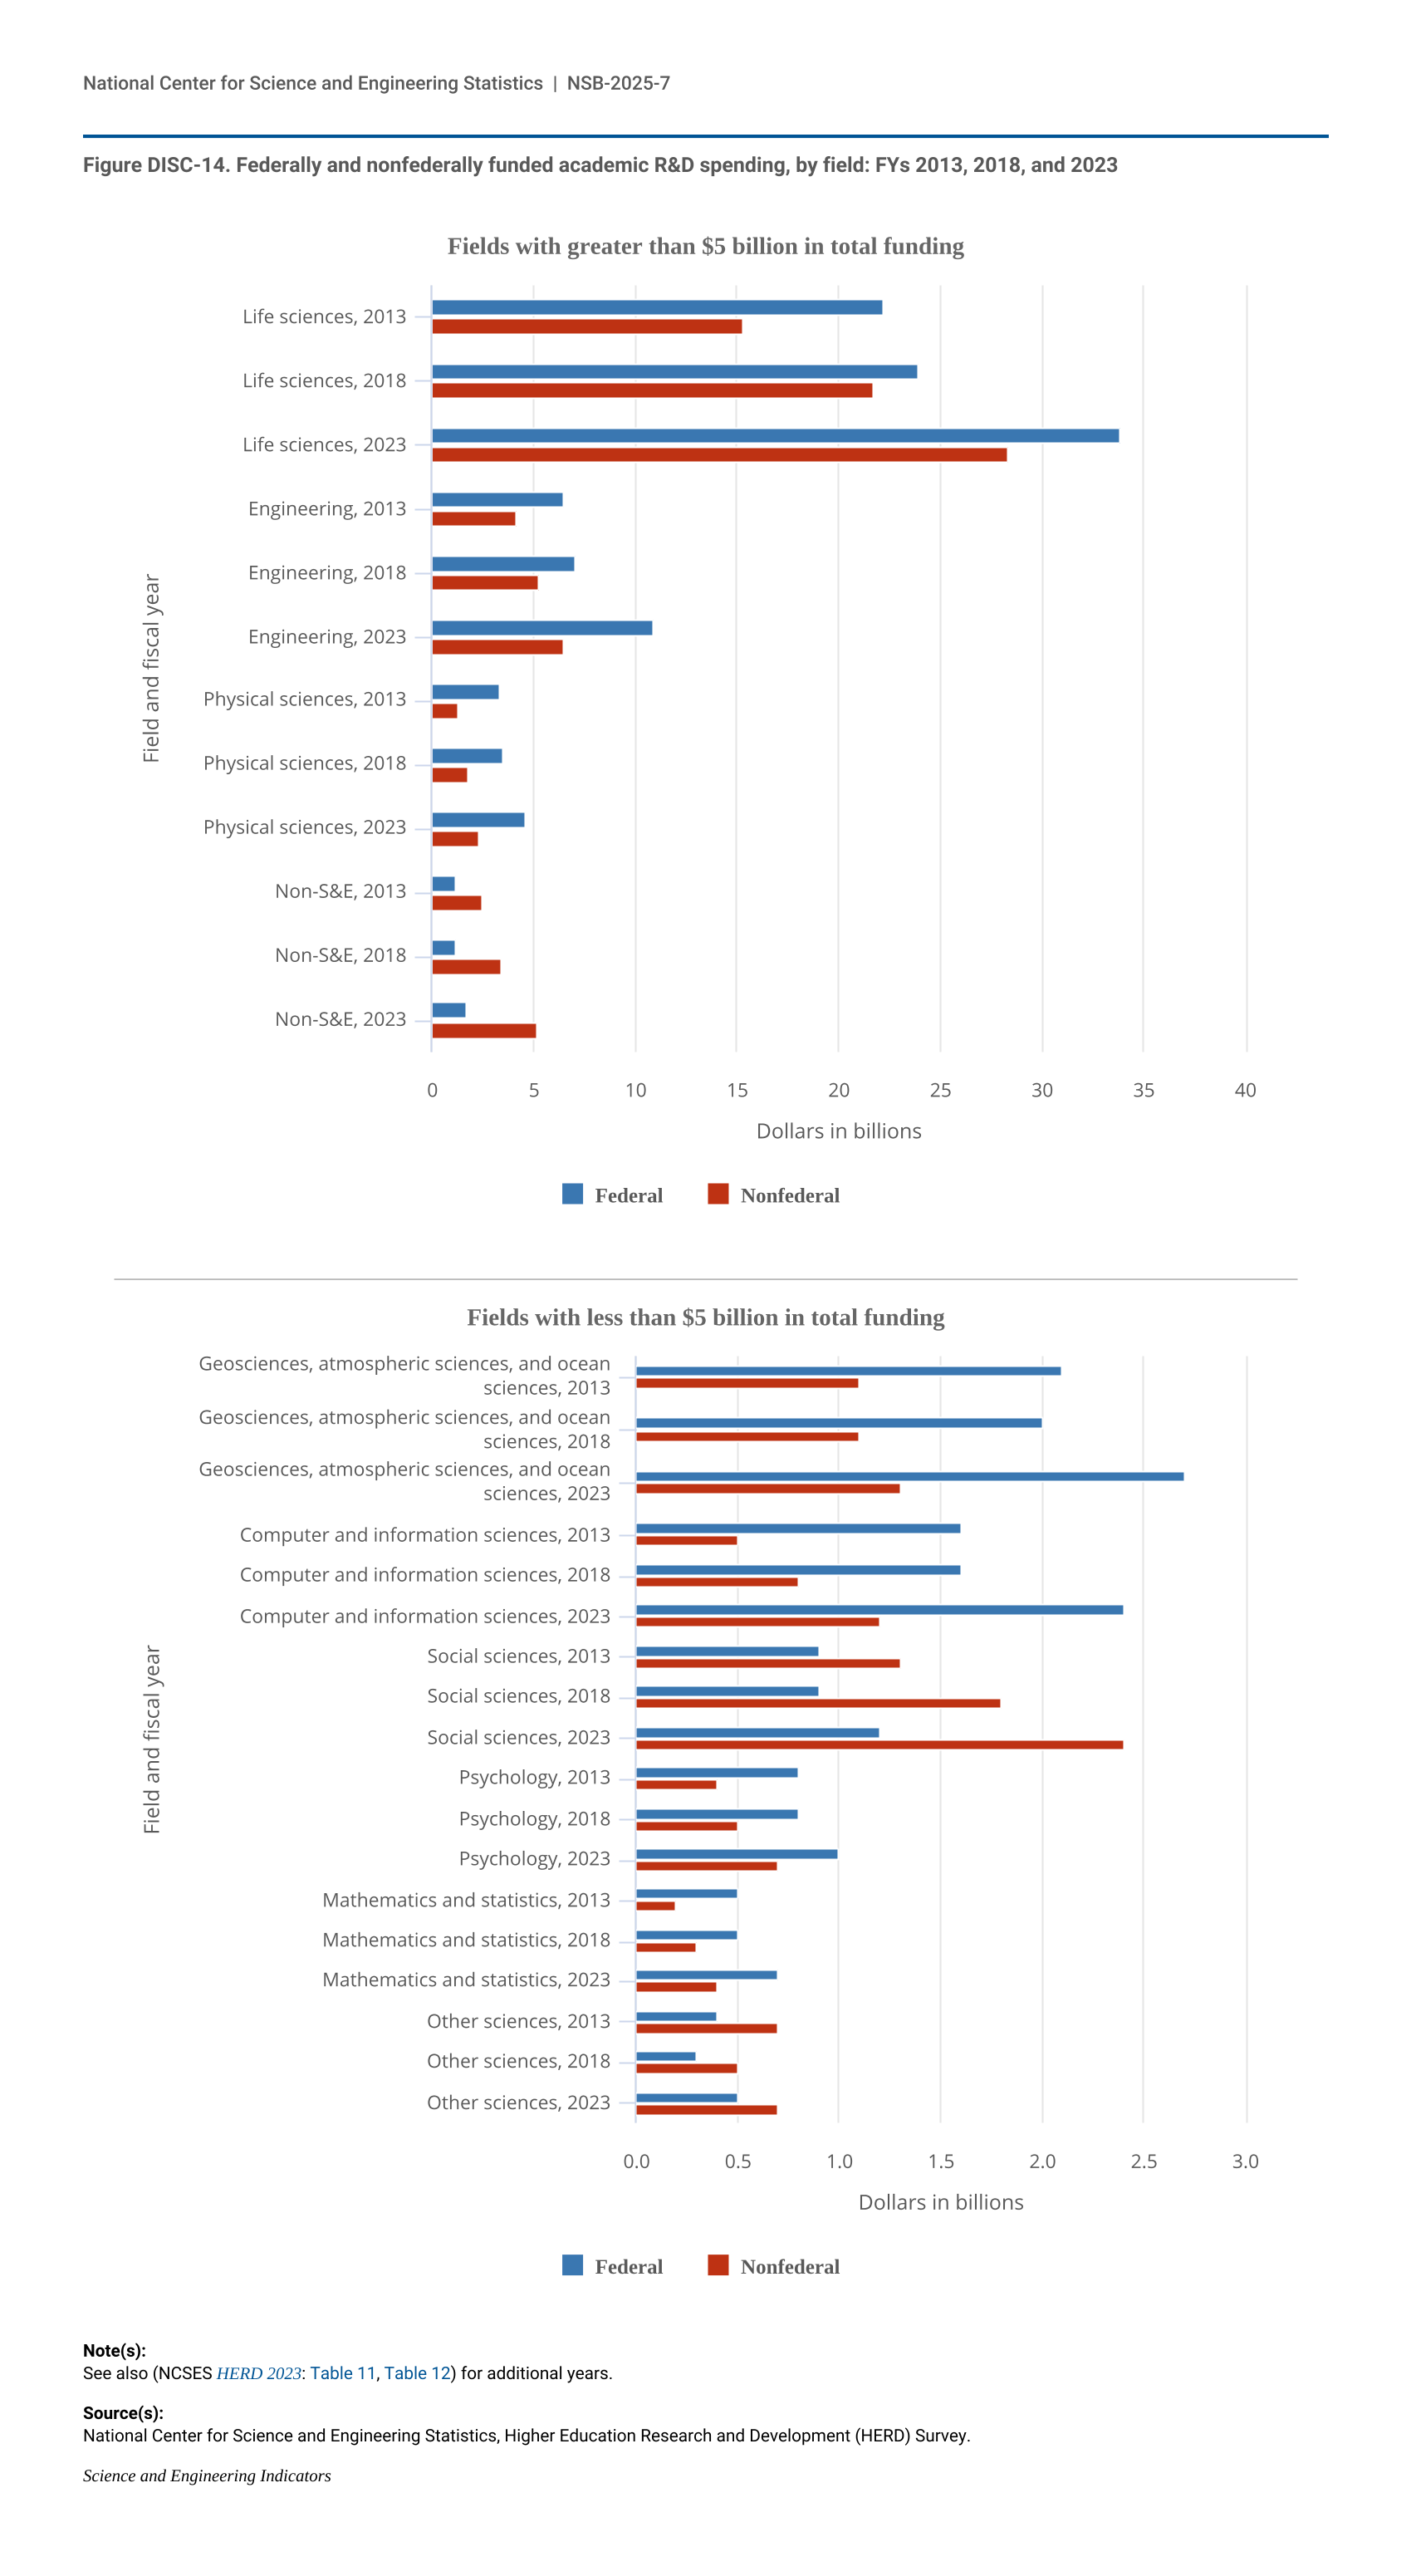
Figure DISC-14.
Federally and nonfederally funded academic R&D spending, by field: FYs 2013, 2018, and 2023
Federally and nonfederally funded academic R&D spending, by field: FYs 2013, 2018, and 2023
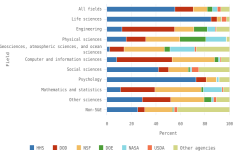
Figure DISC-15.
Federally financed academic R&D expenditures, by agency and field: FY 2023
Federally financed academic R&D expenditures, by agency and field: FY 2023
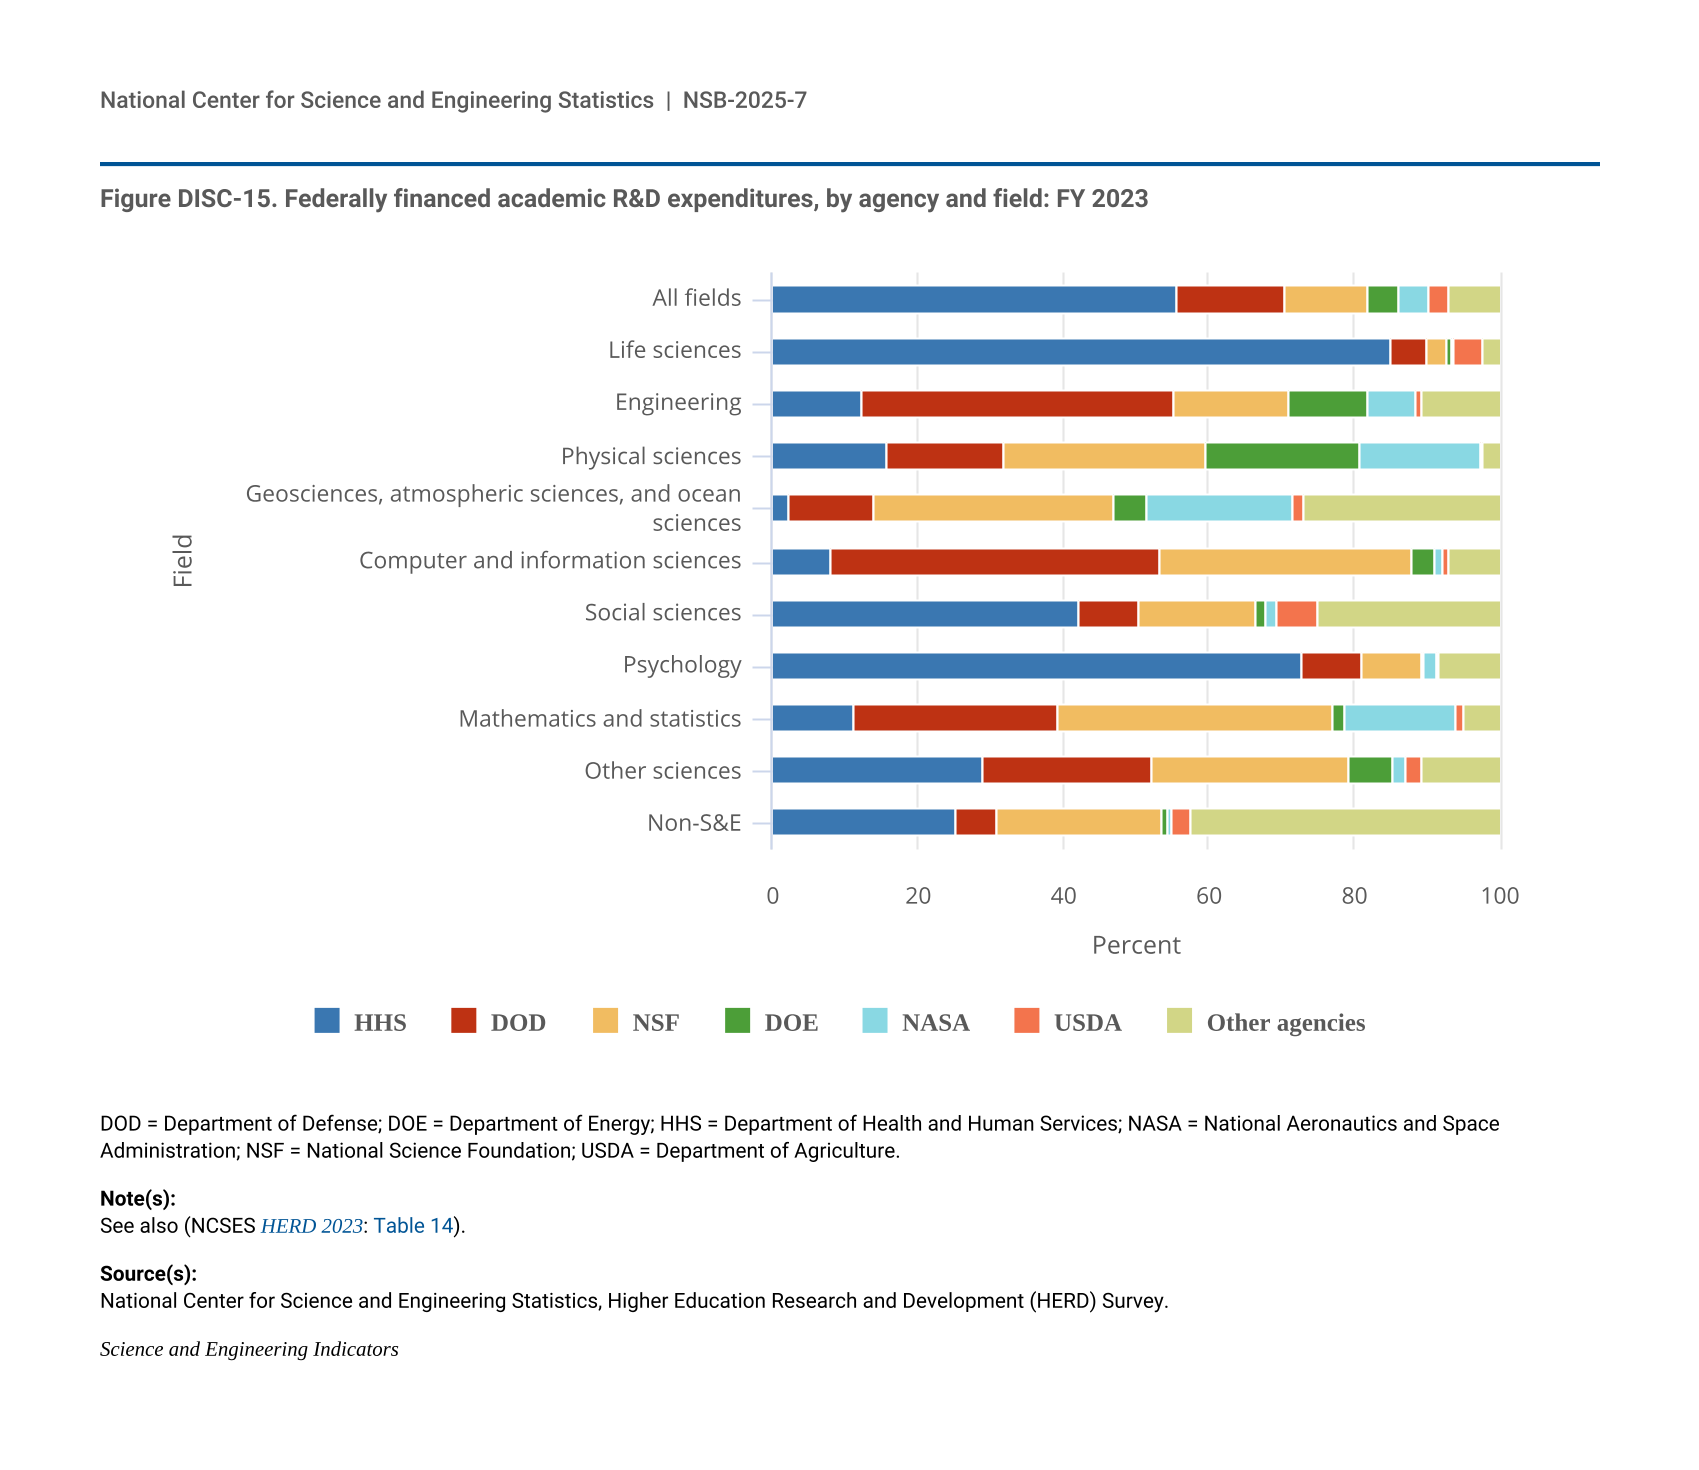
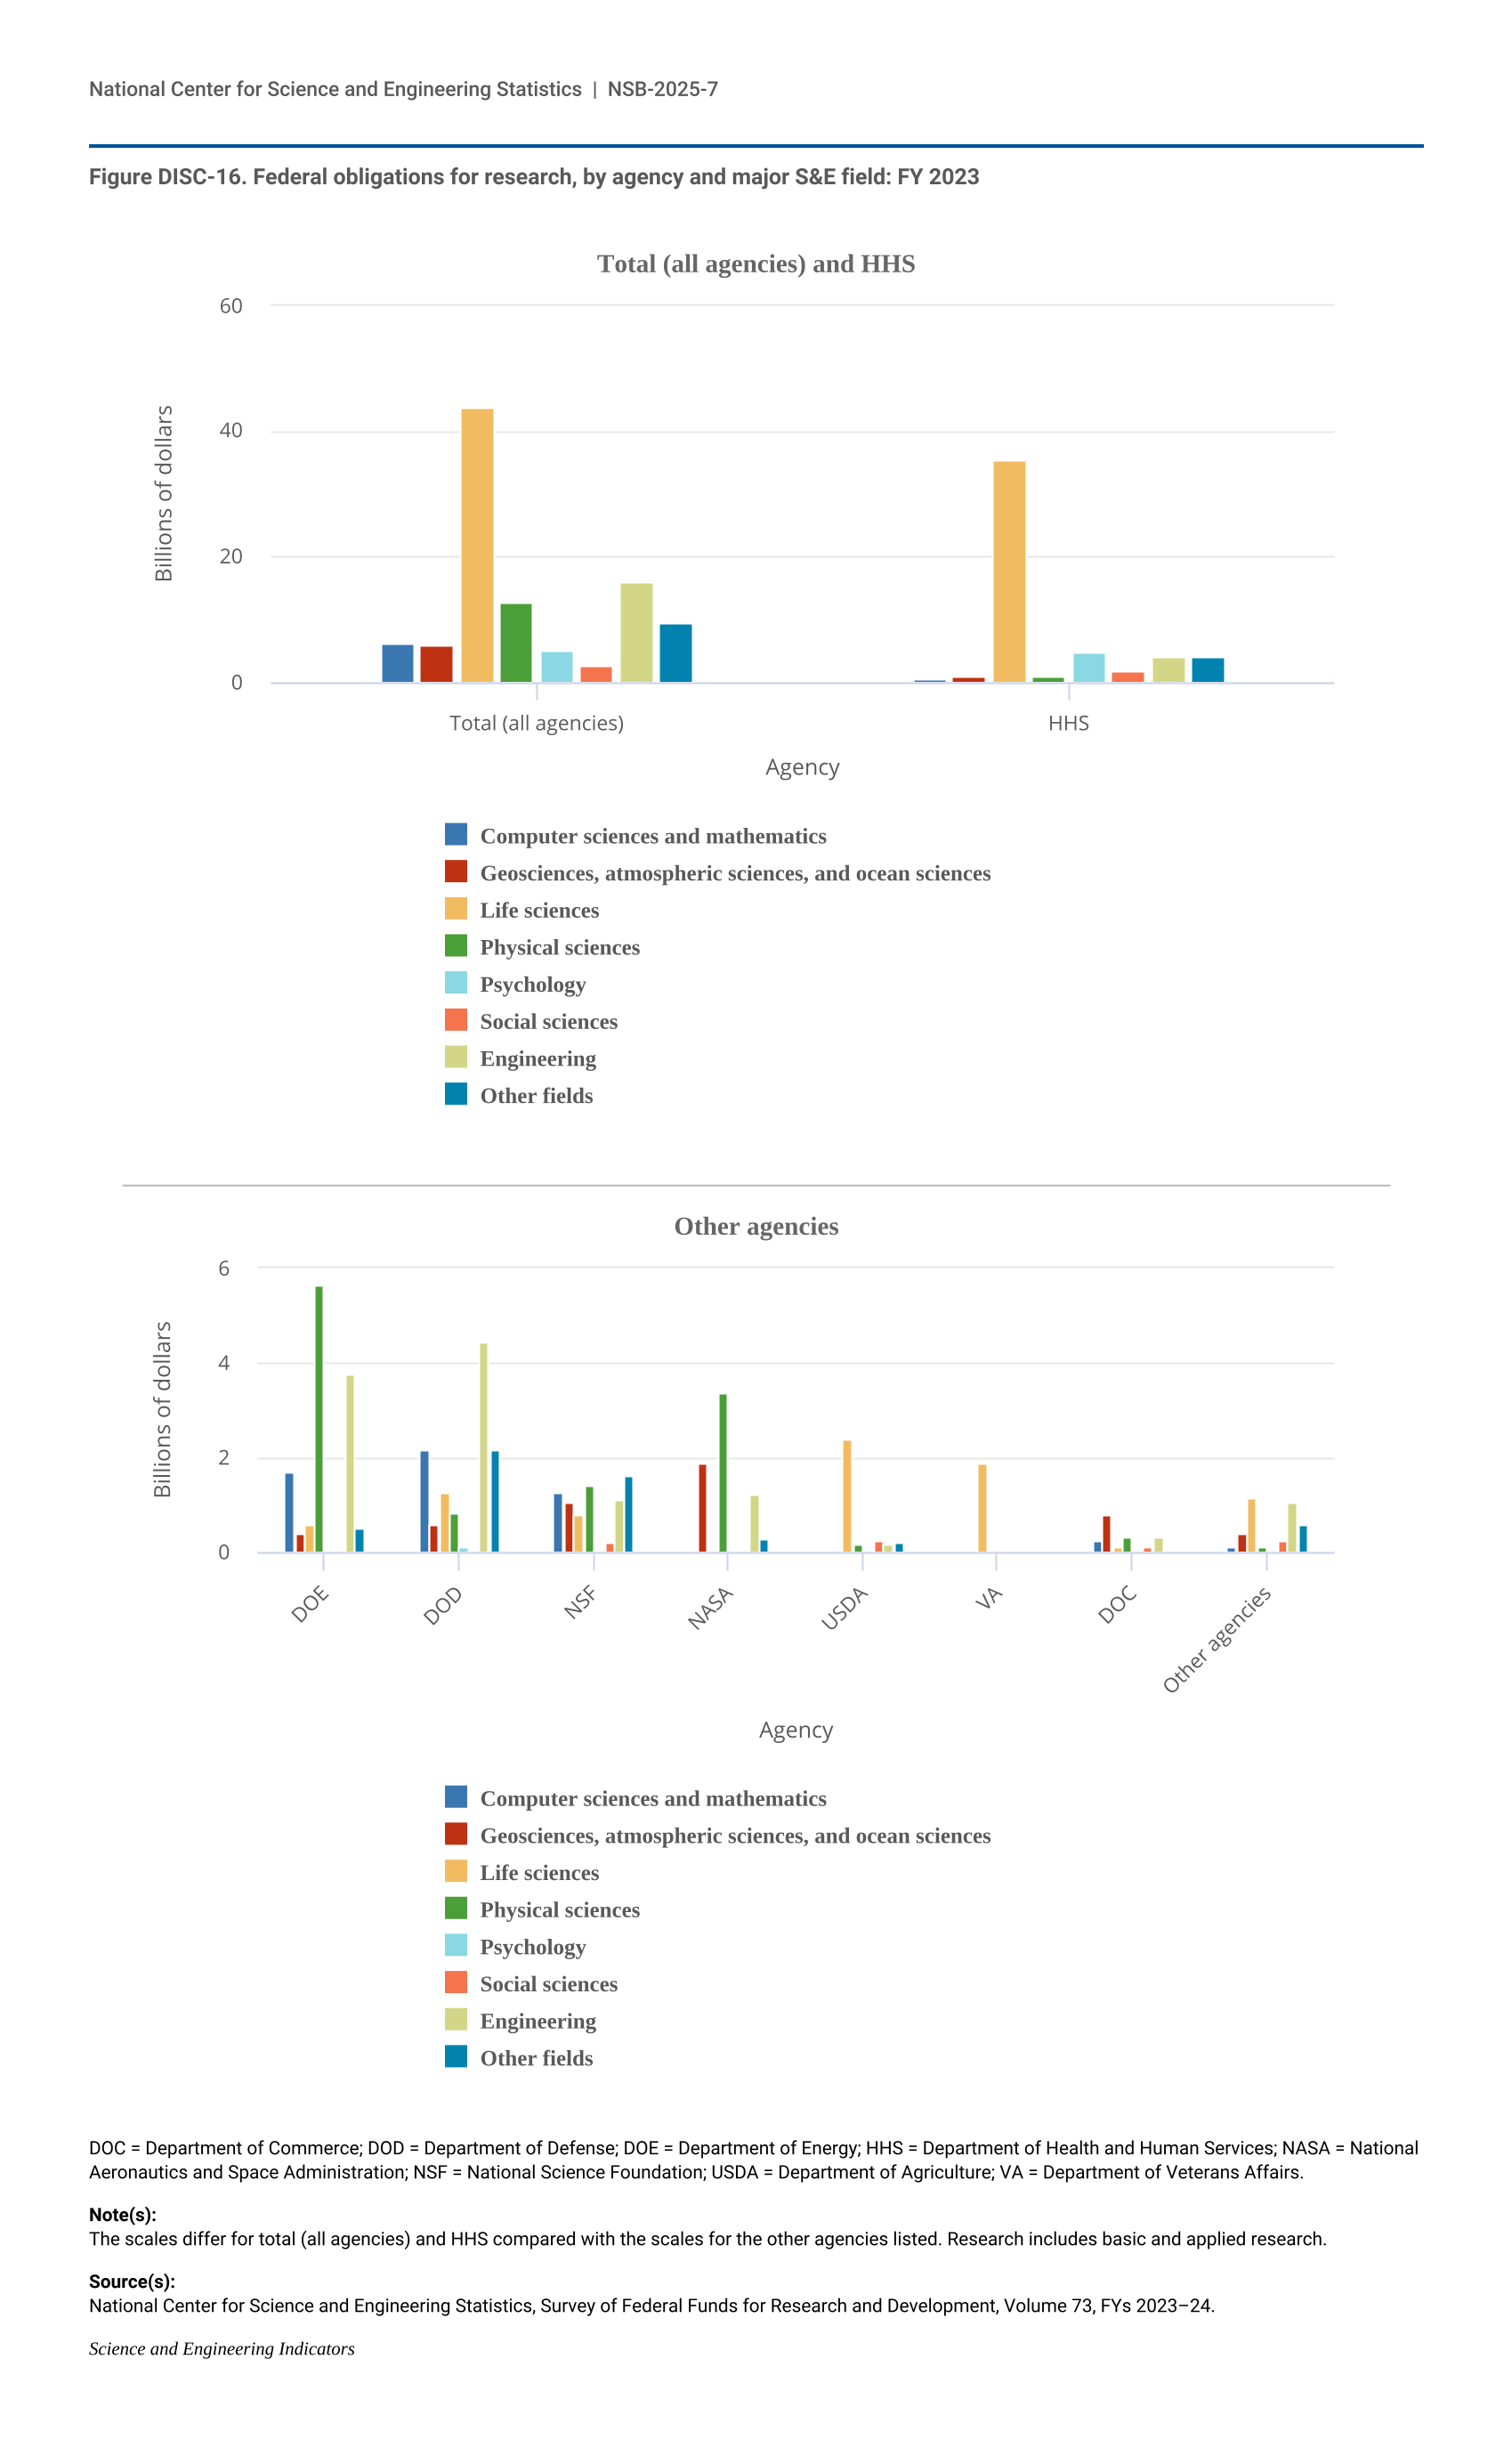
Figure DISC-16.
Federal obligations for research, by agency and major S&E field: FY 2023
Federal obligations for research, by agency and major S&E field: FY 2023
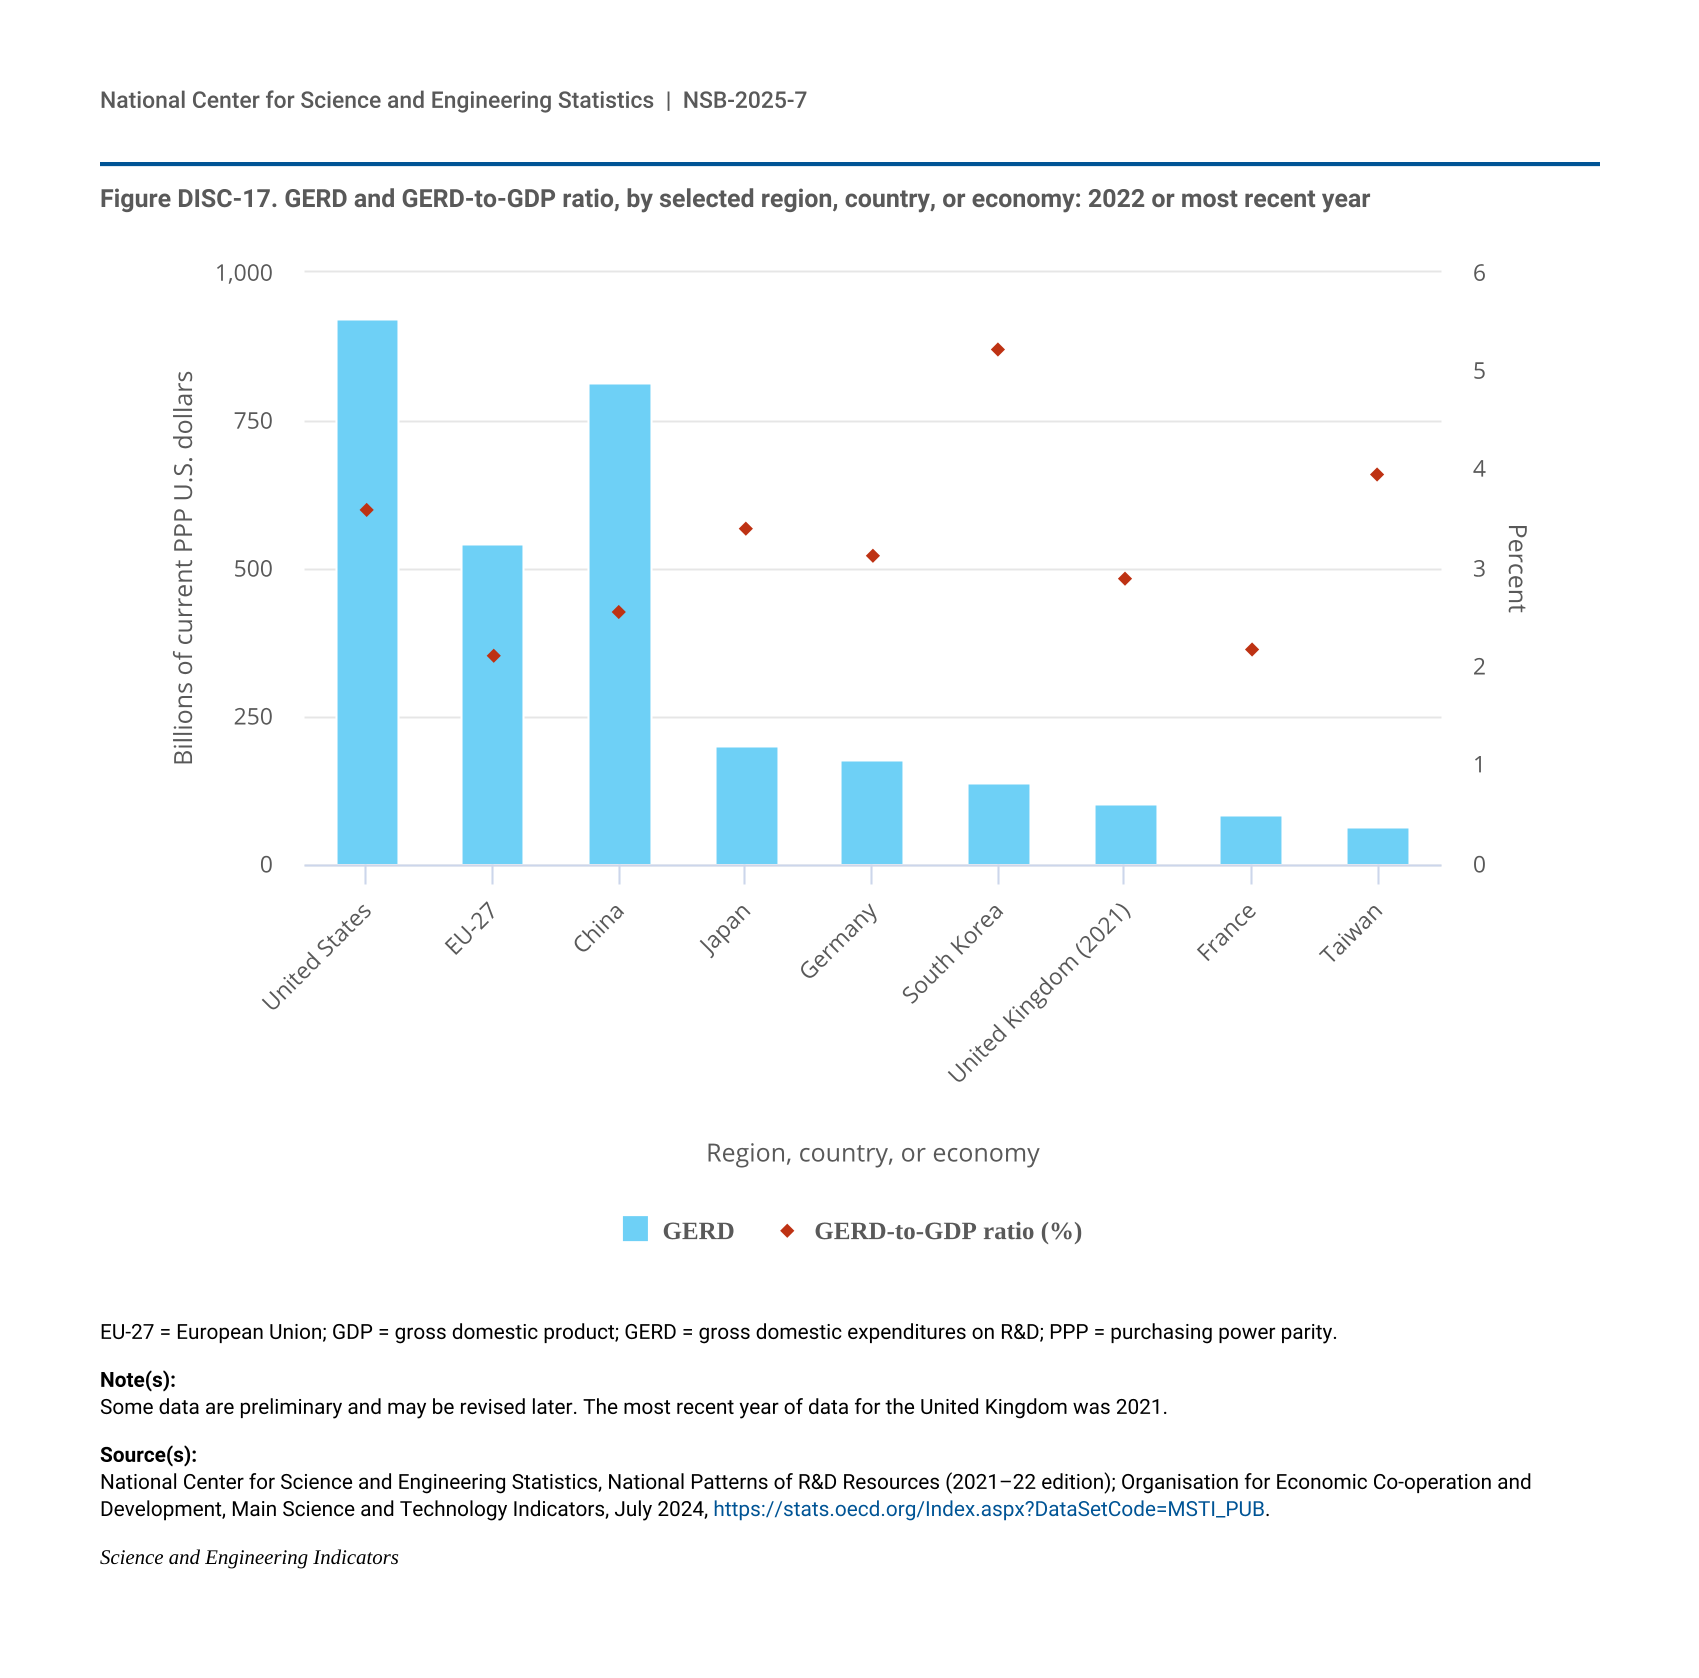
Figure DISC-17.
GERD and GERD-to-GDP ratio, by selected region, country, or economy: 2022 or most recent year
GERD and GERD-to-GDP ratio, by selected region, country, or economy: 2022 or most recent year
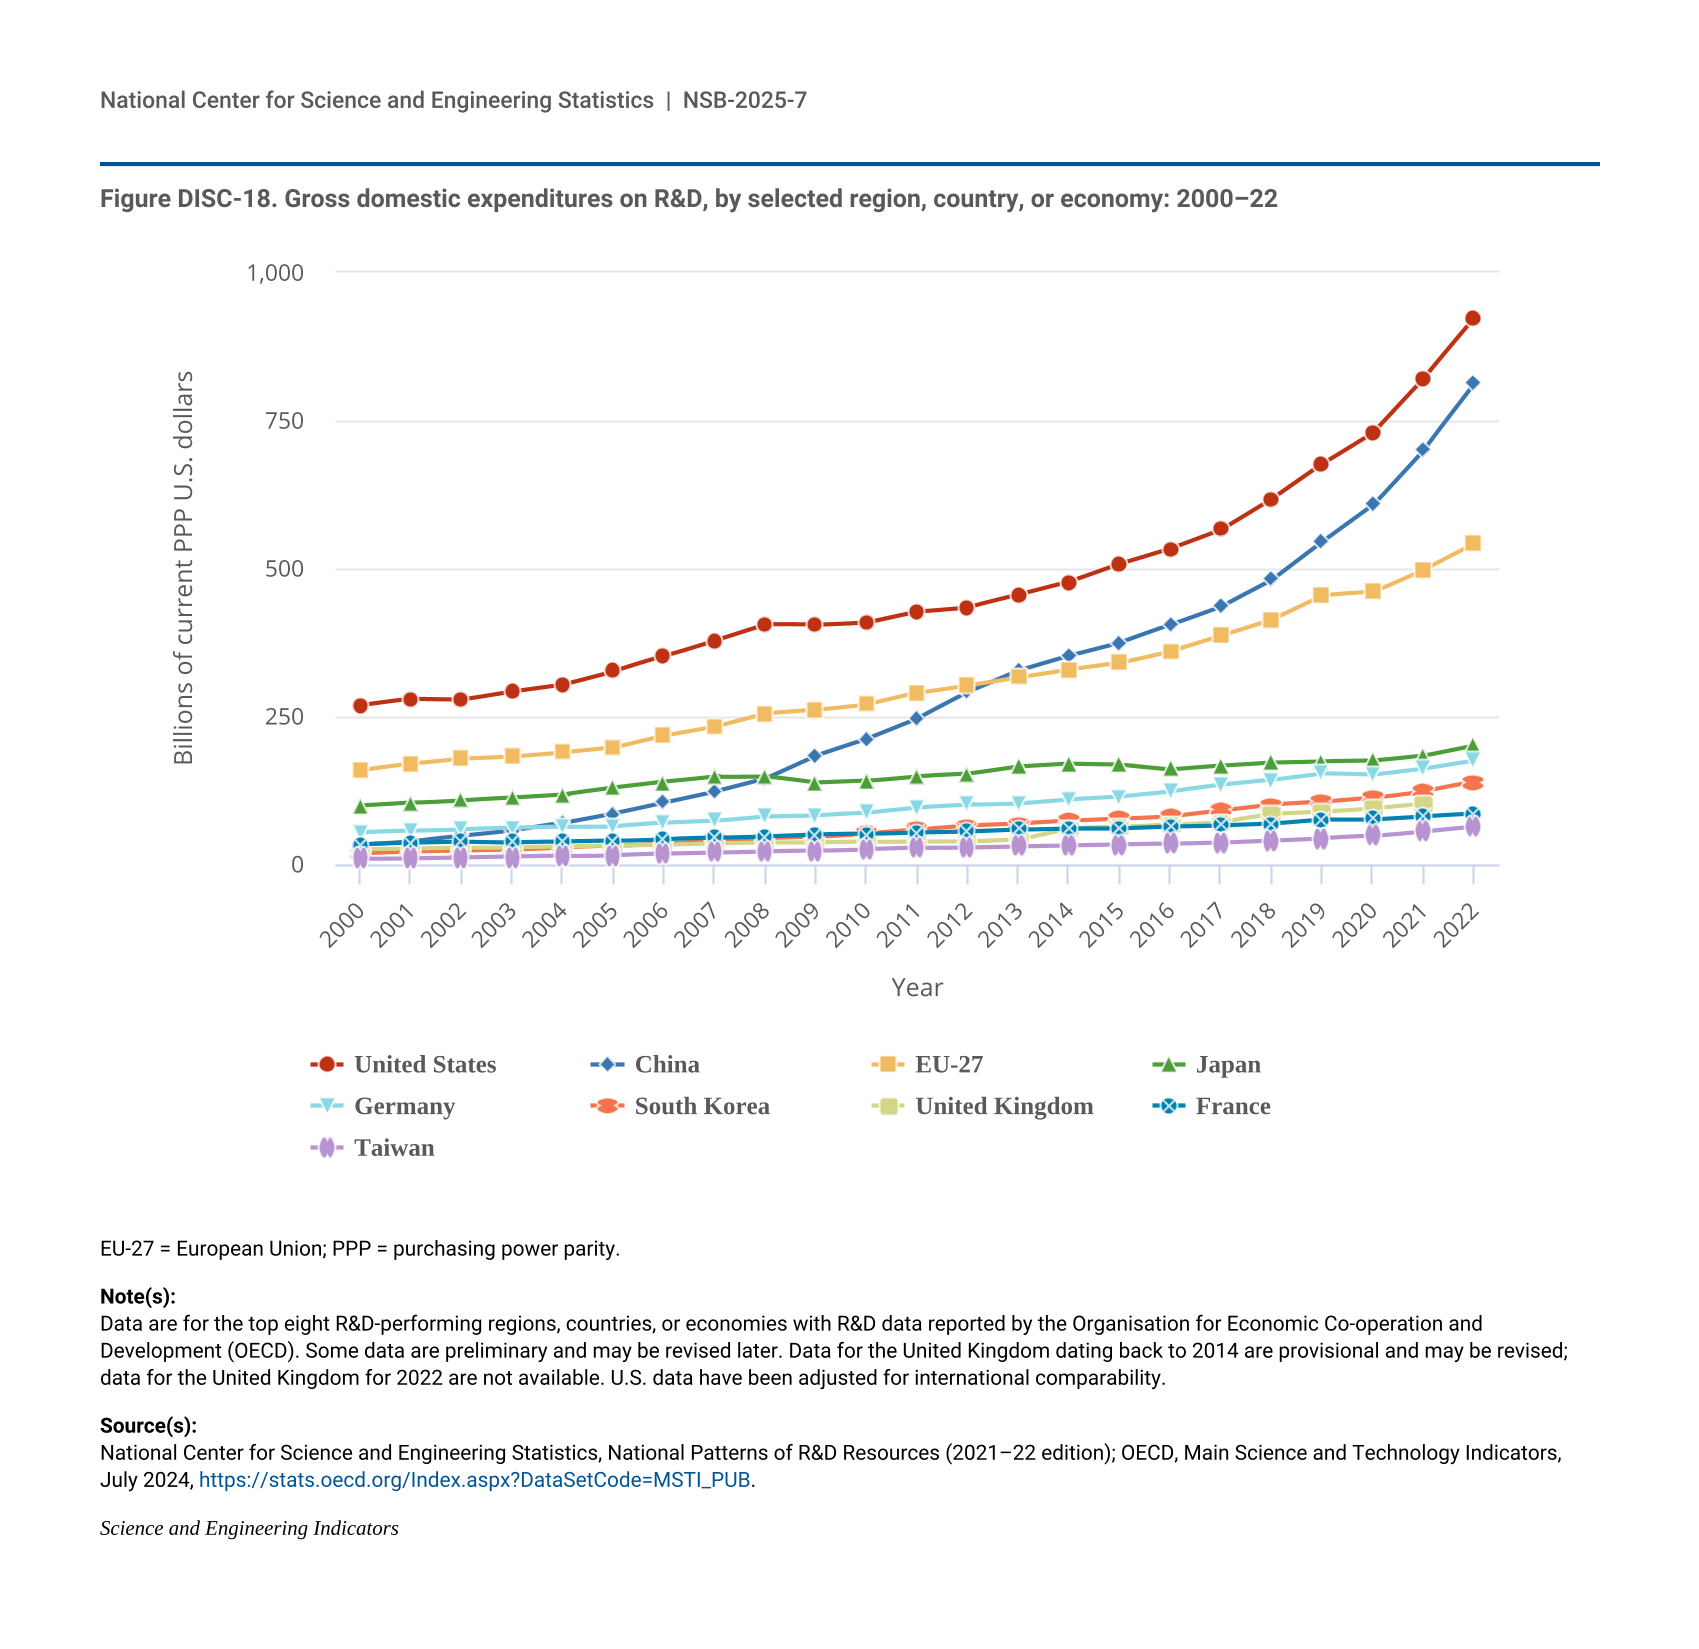
Figure DISC-18.
Gross domestic expenditures on R&D, by selected region, country, or economy: 2000–22
Gross domestic expenditures on R&D, by selected region, country, or economy: 2000–22
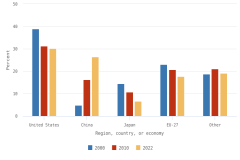
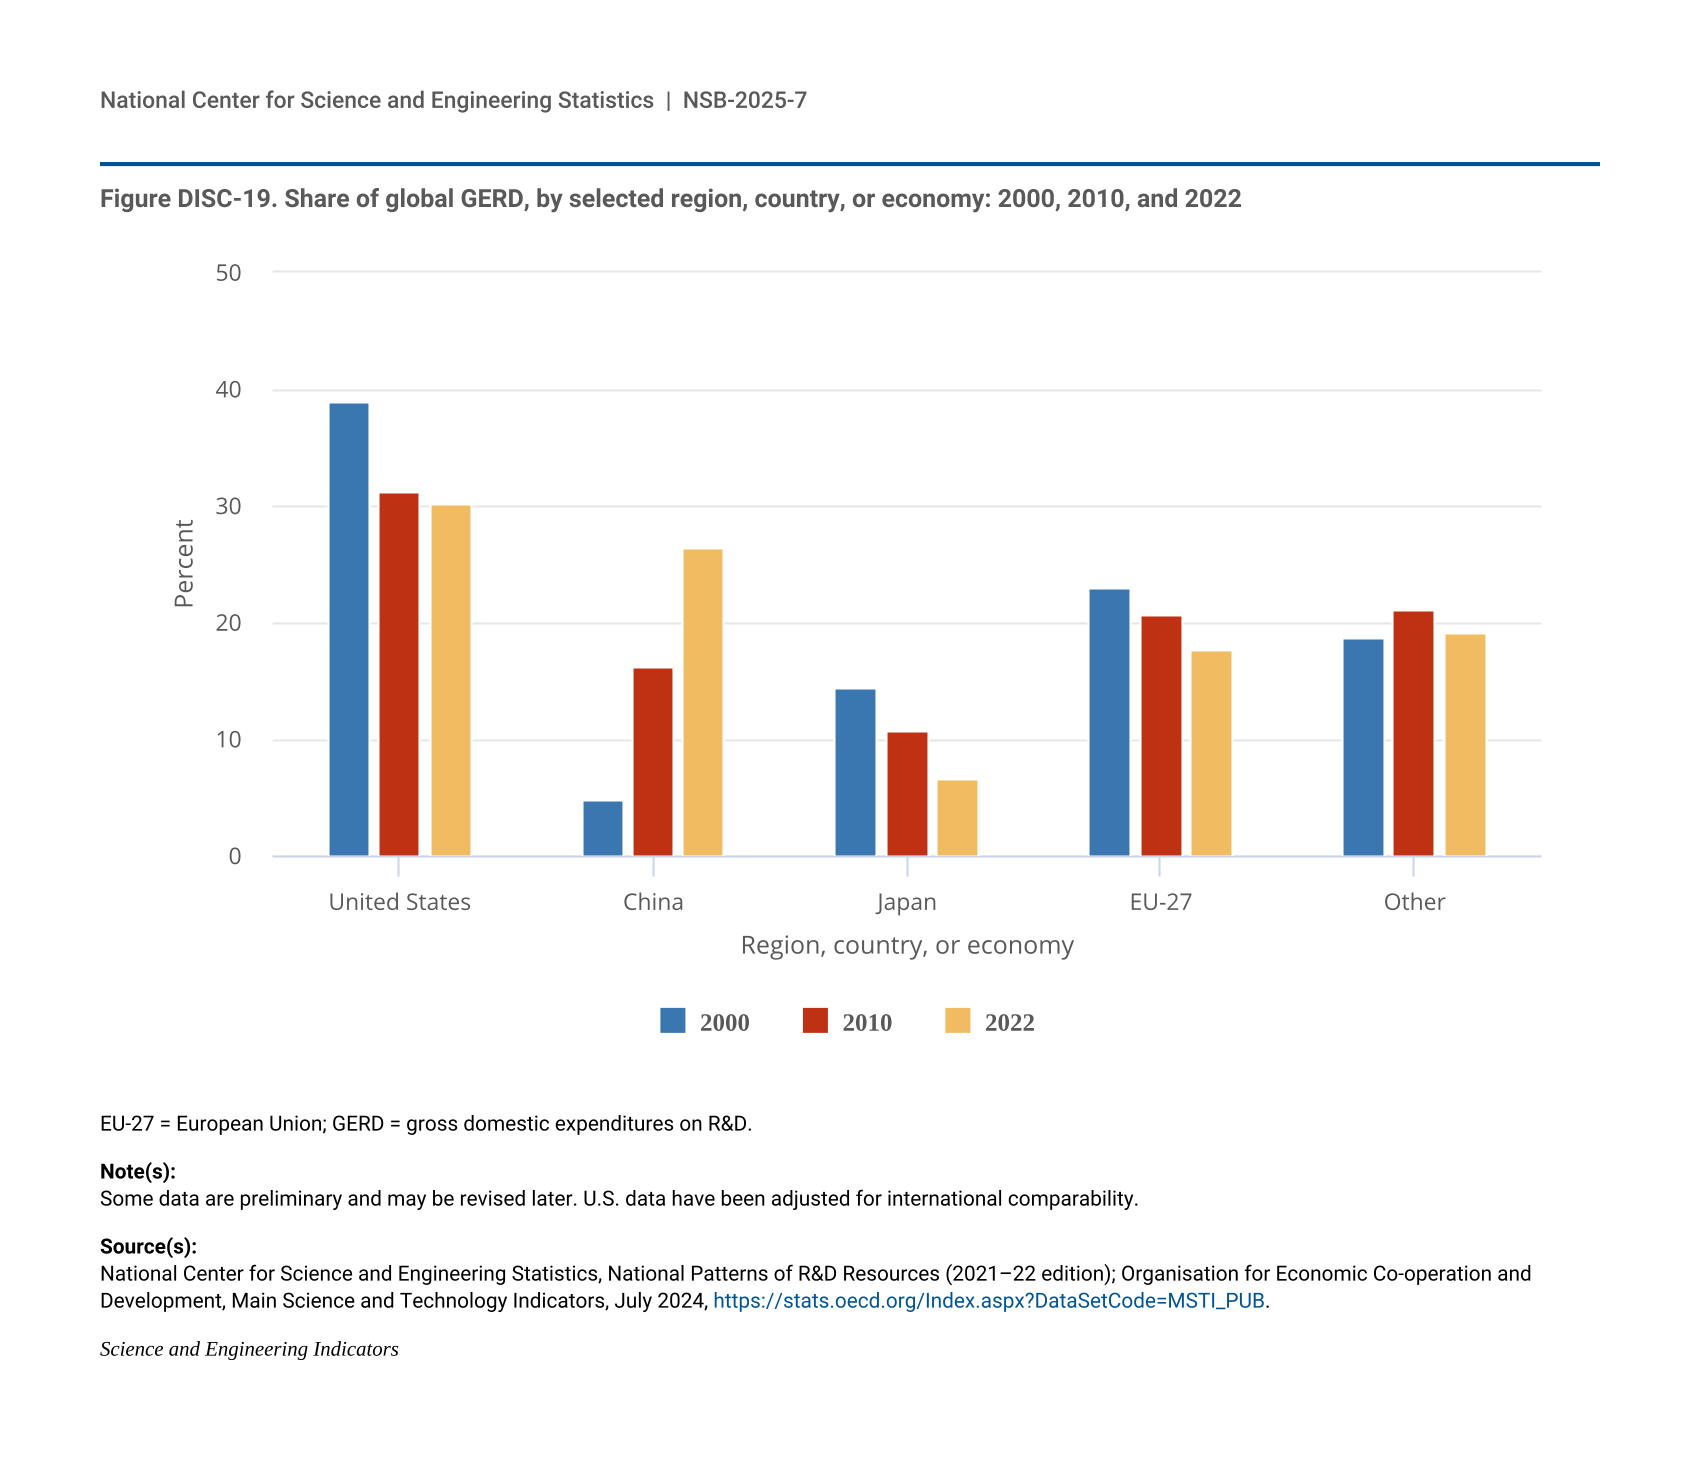
Figure DISC-19.
Share of global GERD, by selected region, country, or economy: 2000, 2010, and 2022
Share of global GERD, by selected region, country, or economy: 2000, 2010, and 2022
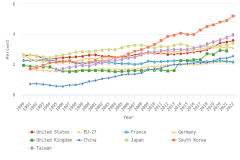
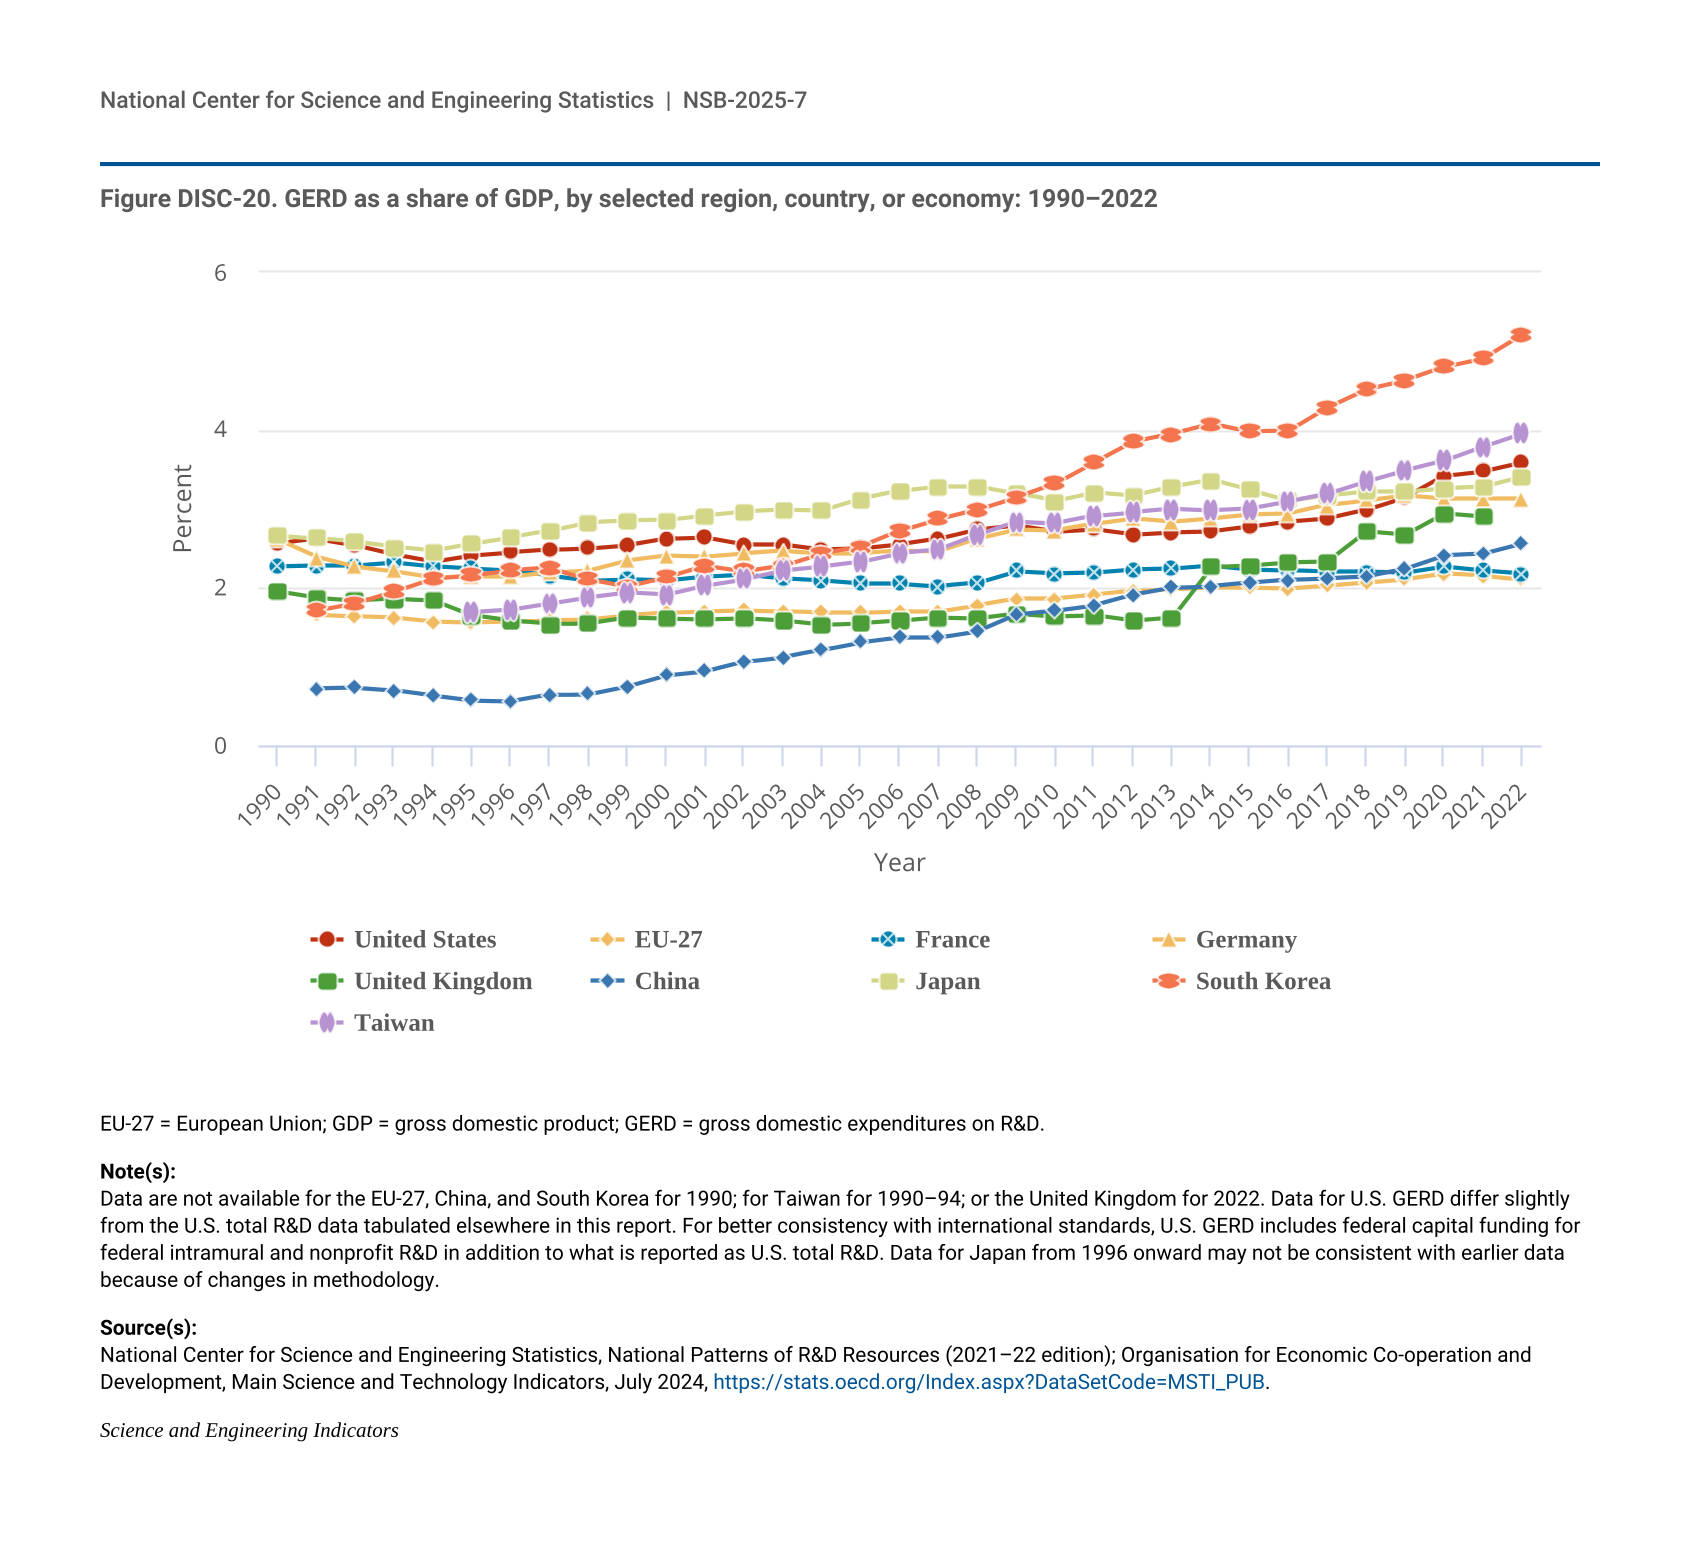
Figure DISC-20.
GERD as a share of GDP, by selected region, country, or economy: 1990–2022
GERD as a share of GDP, by selected region, country, or economy: 1990–2022
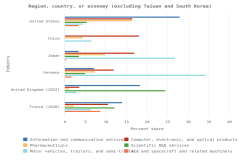
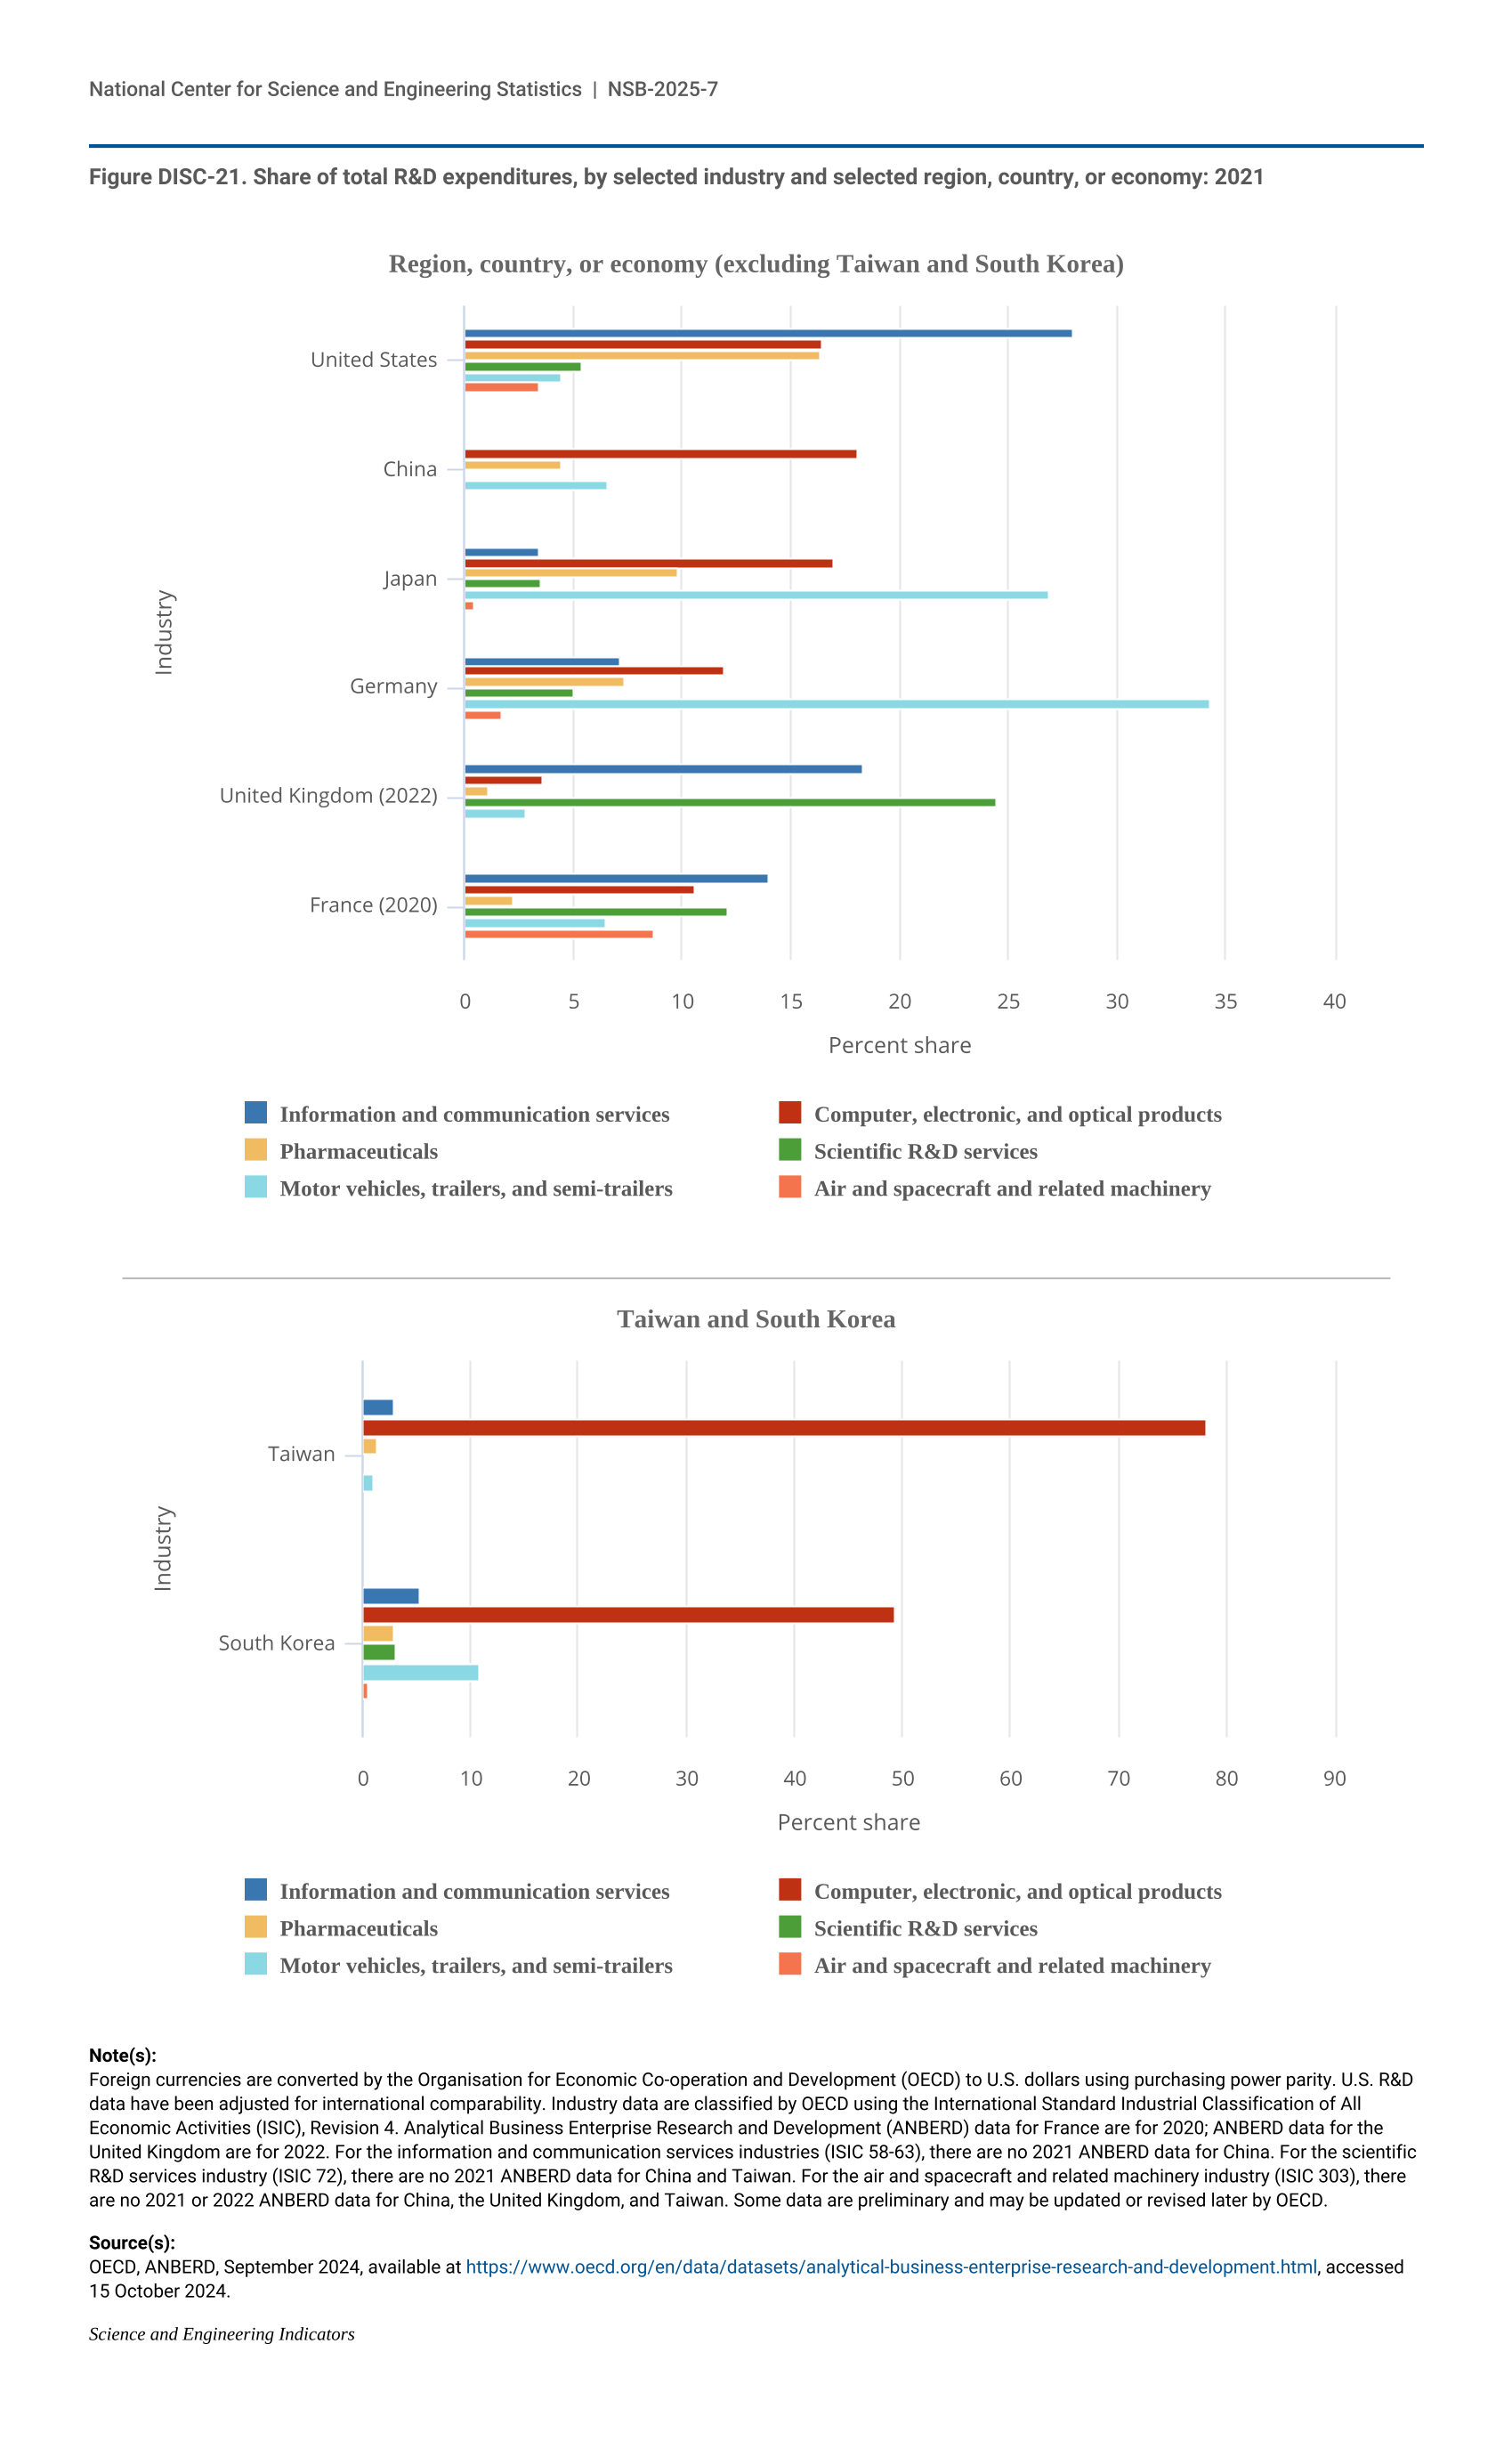
Figure DISC-21.
Share of total R&D expenditures, by selected industry and selected region, country, or economy: 2021
Share of total R&D expenditures, by selected industry and selected region, country, or economy: 2021
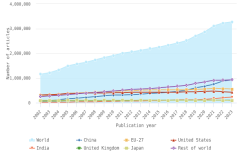
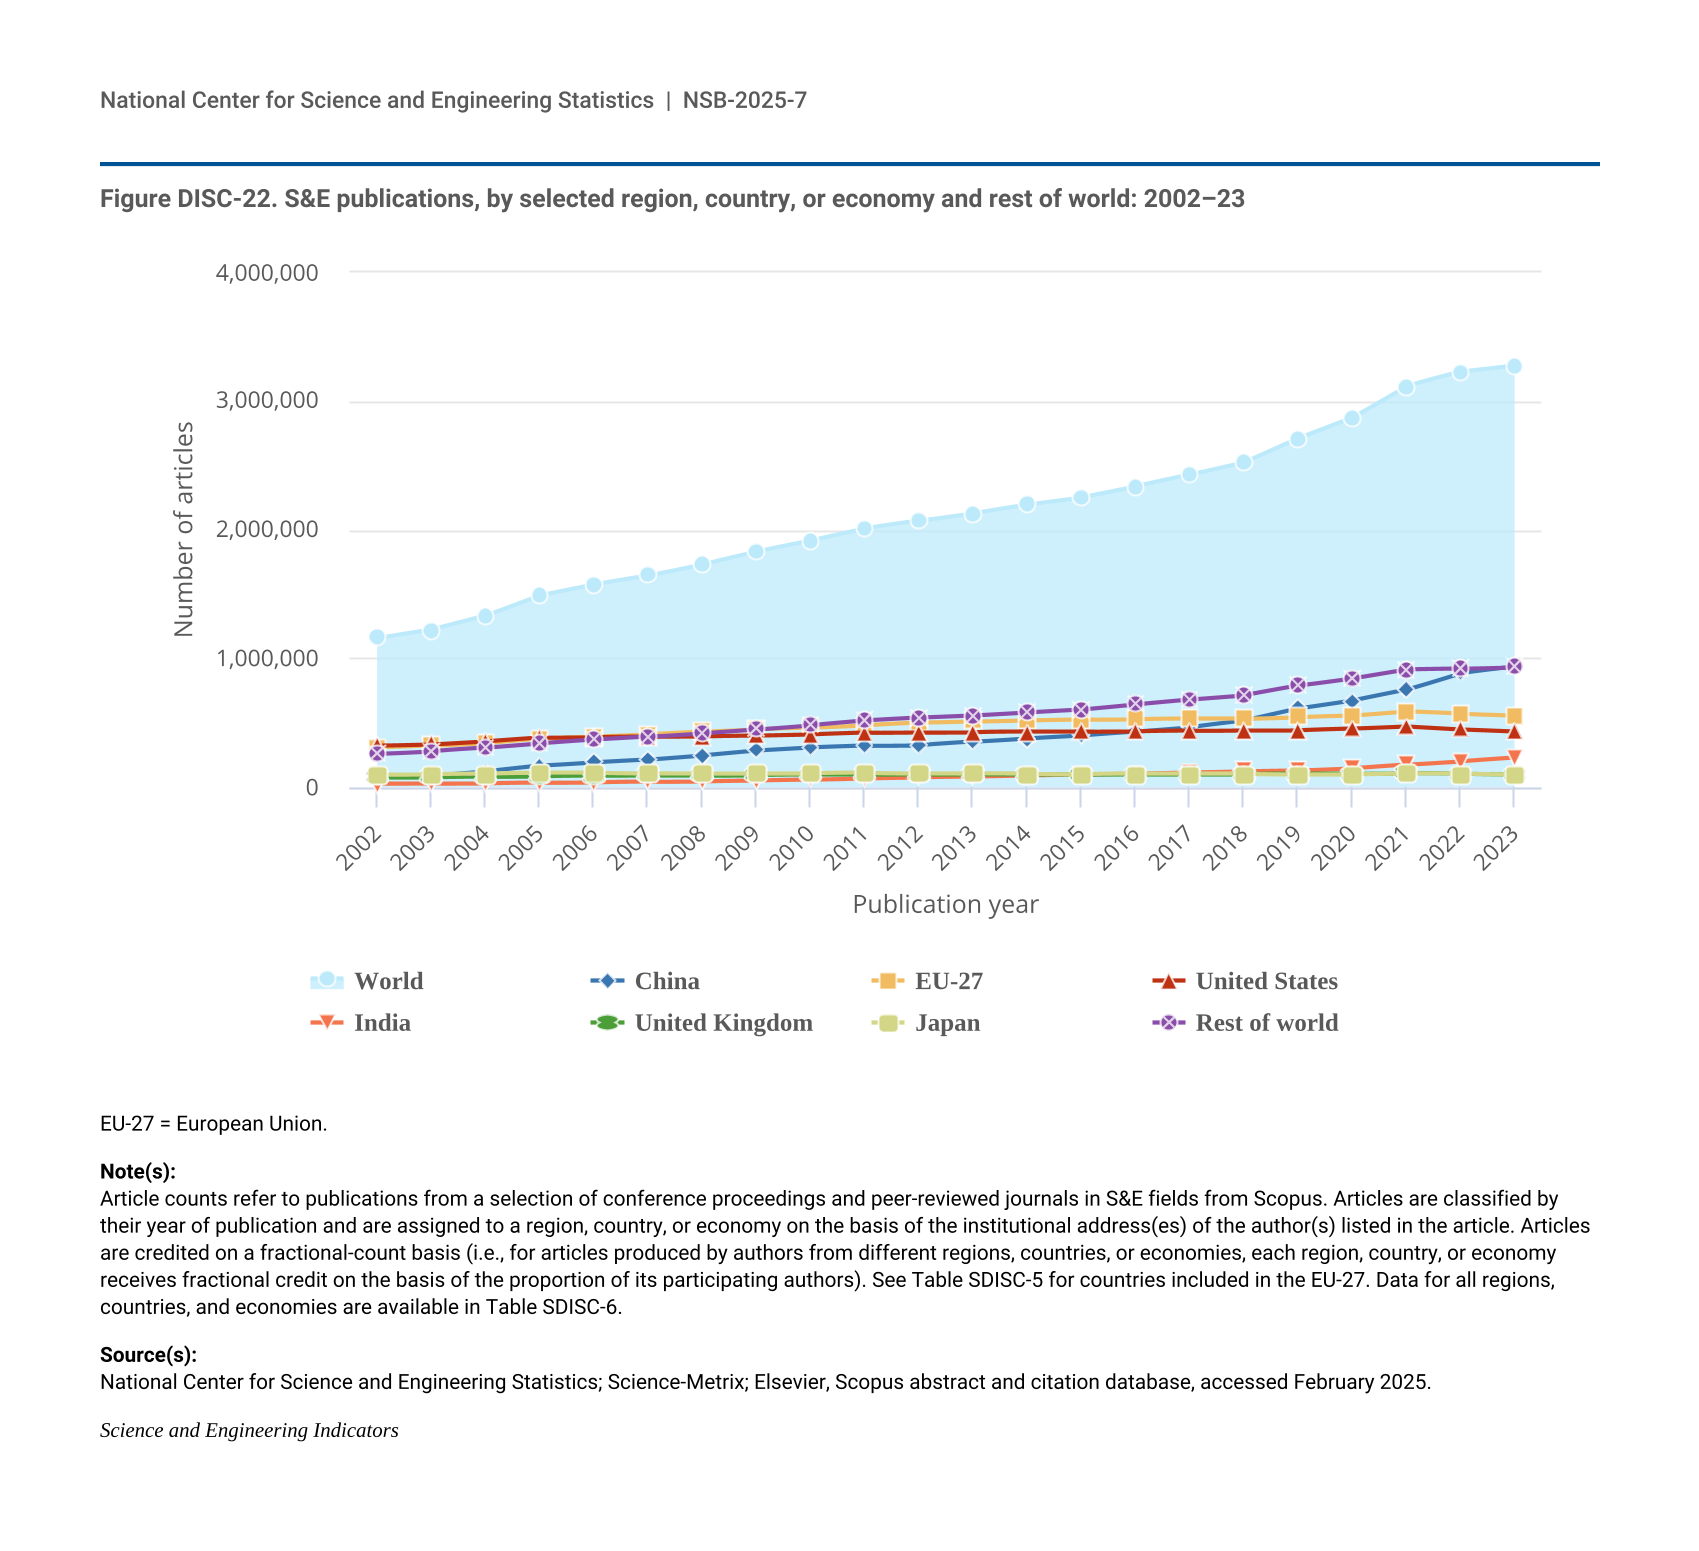
Figure DISC-22.
S&E publications, by selected region, country, or economy and rest of world: 2002–23
S&E publications, by selected region, country, or economy and rest of world: 2002–23
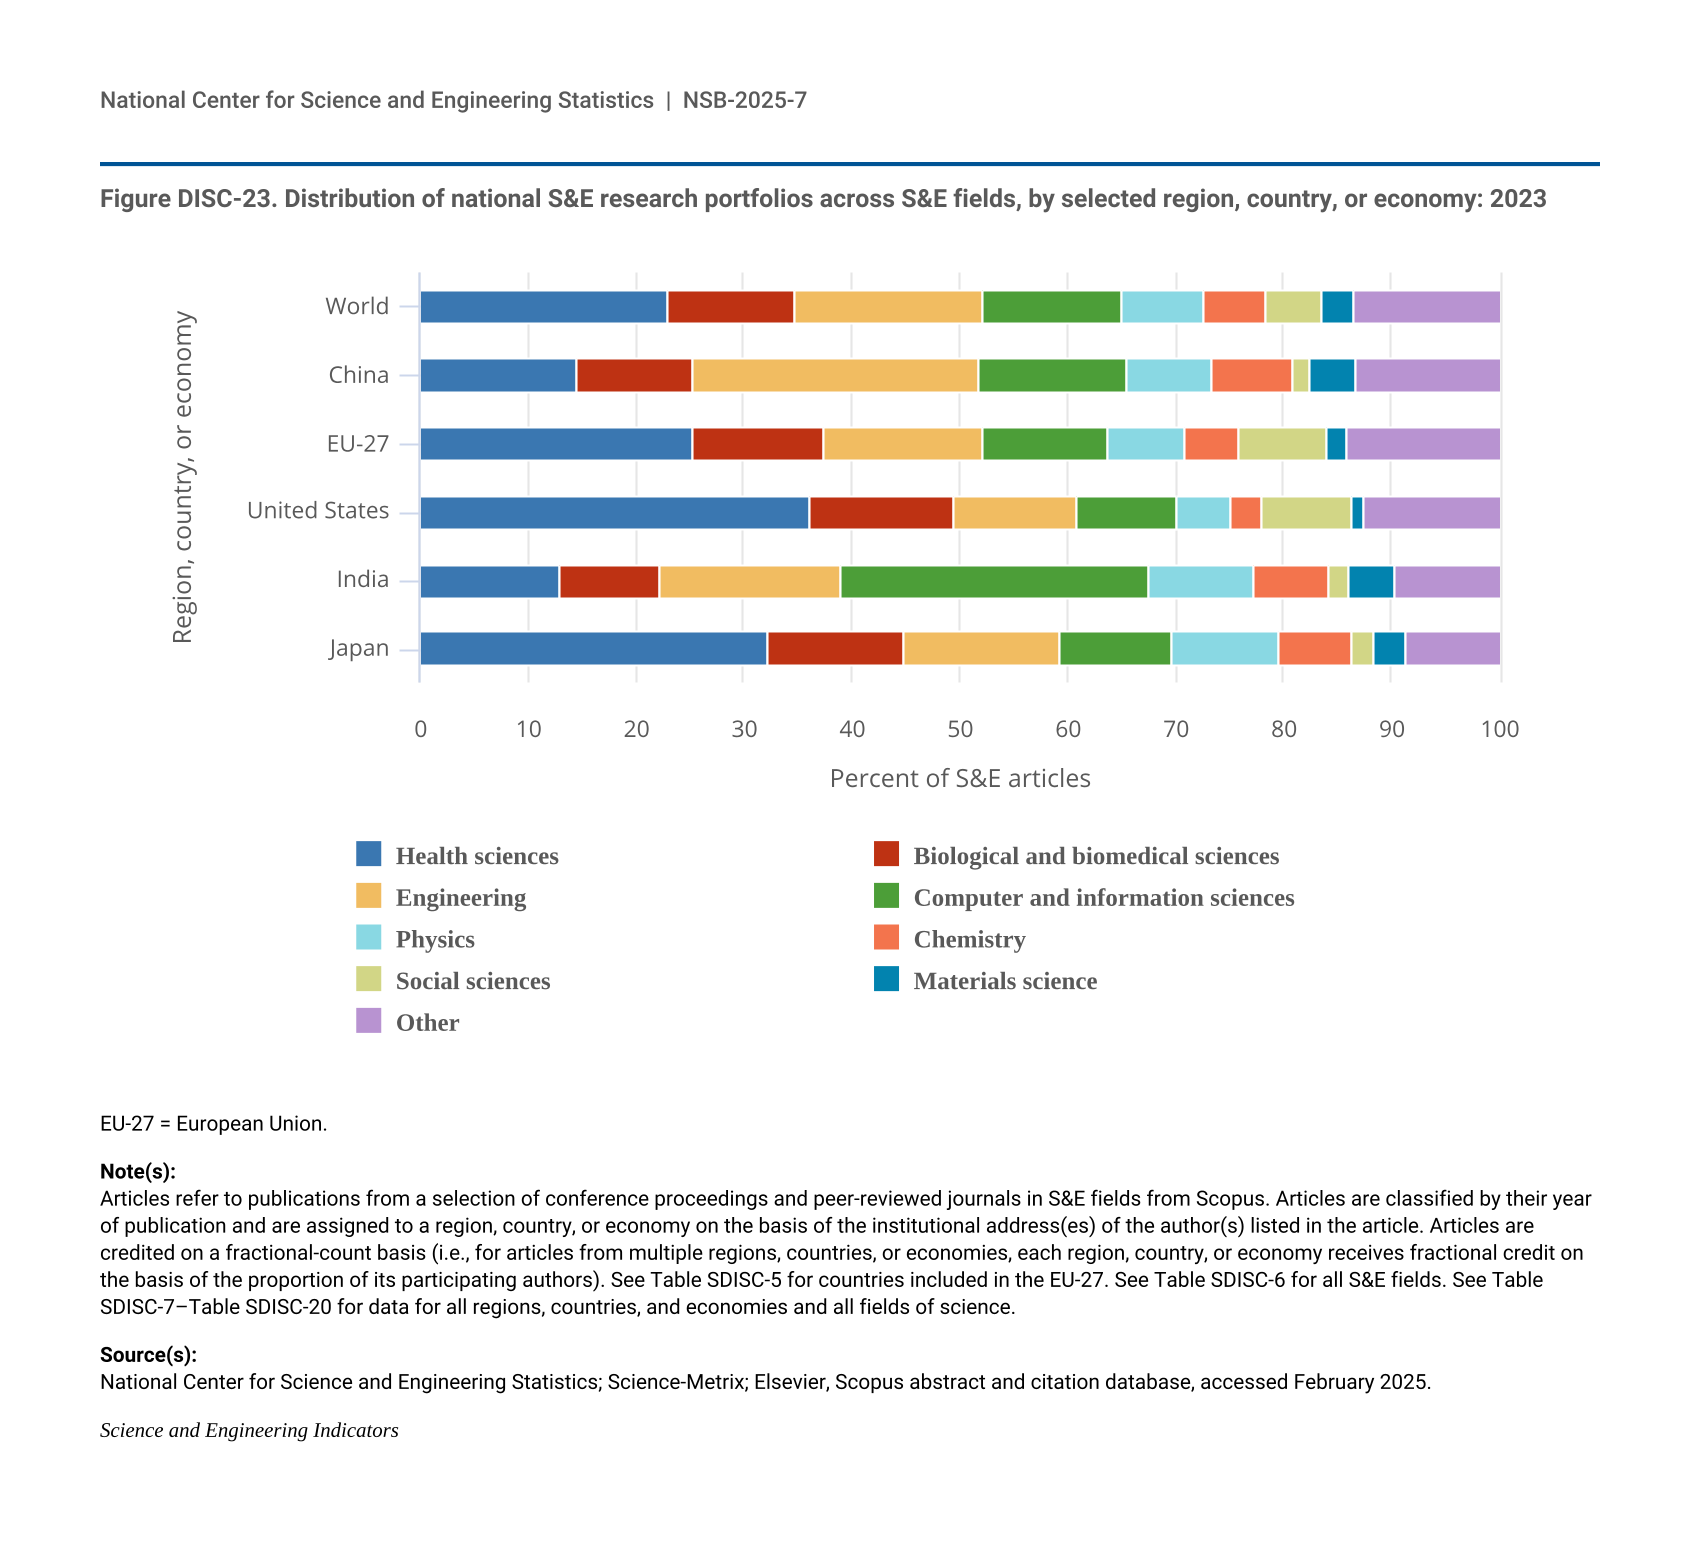
Figure DISC-23.
Distribution of national S&E research portfolios across S&E fields, by selected region, country, or economy: 2023
Distribution of national S&E research portfolios across S&E fields, by selected region, country, or economy: 2023
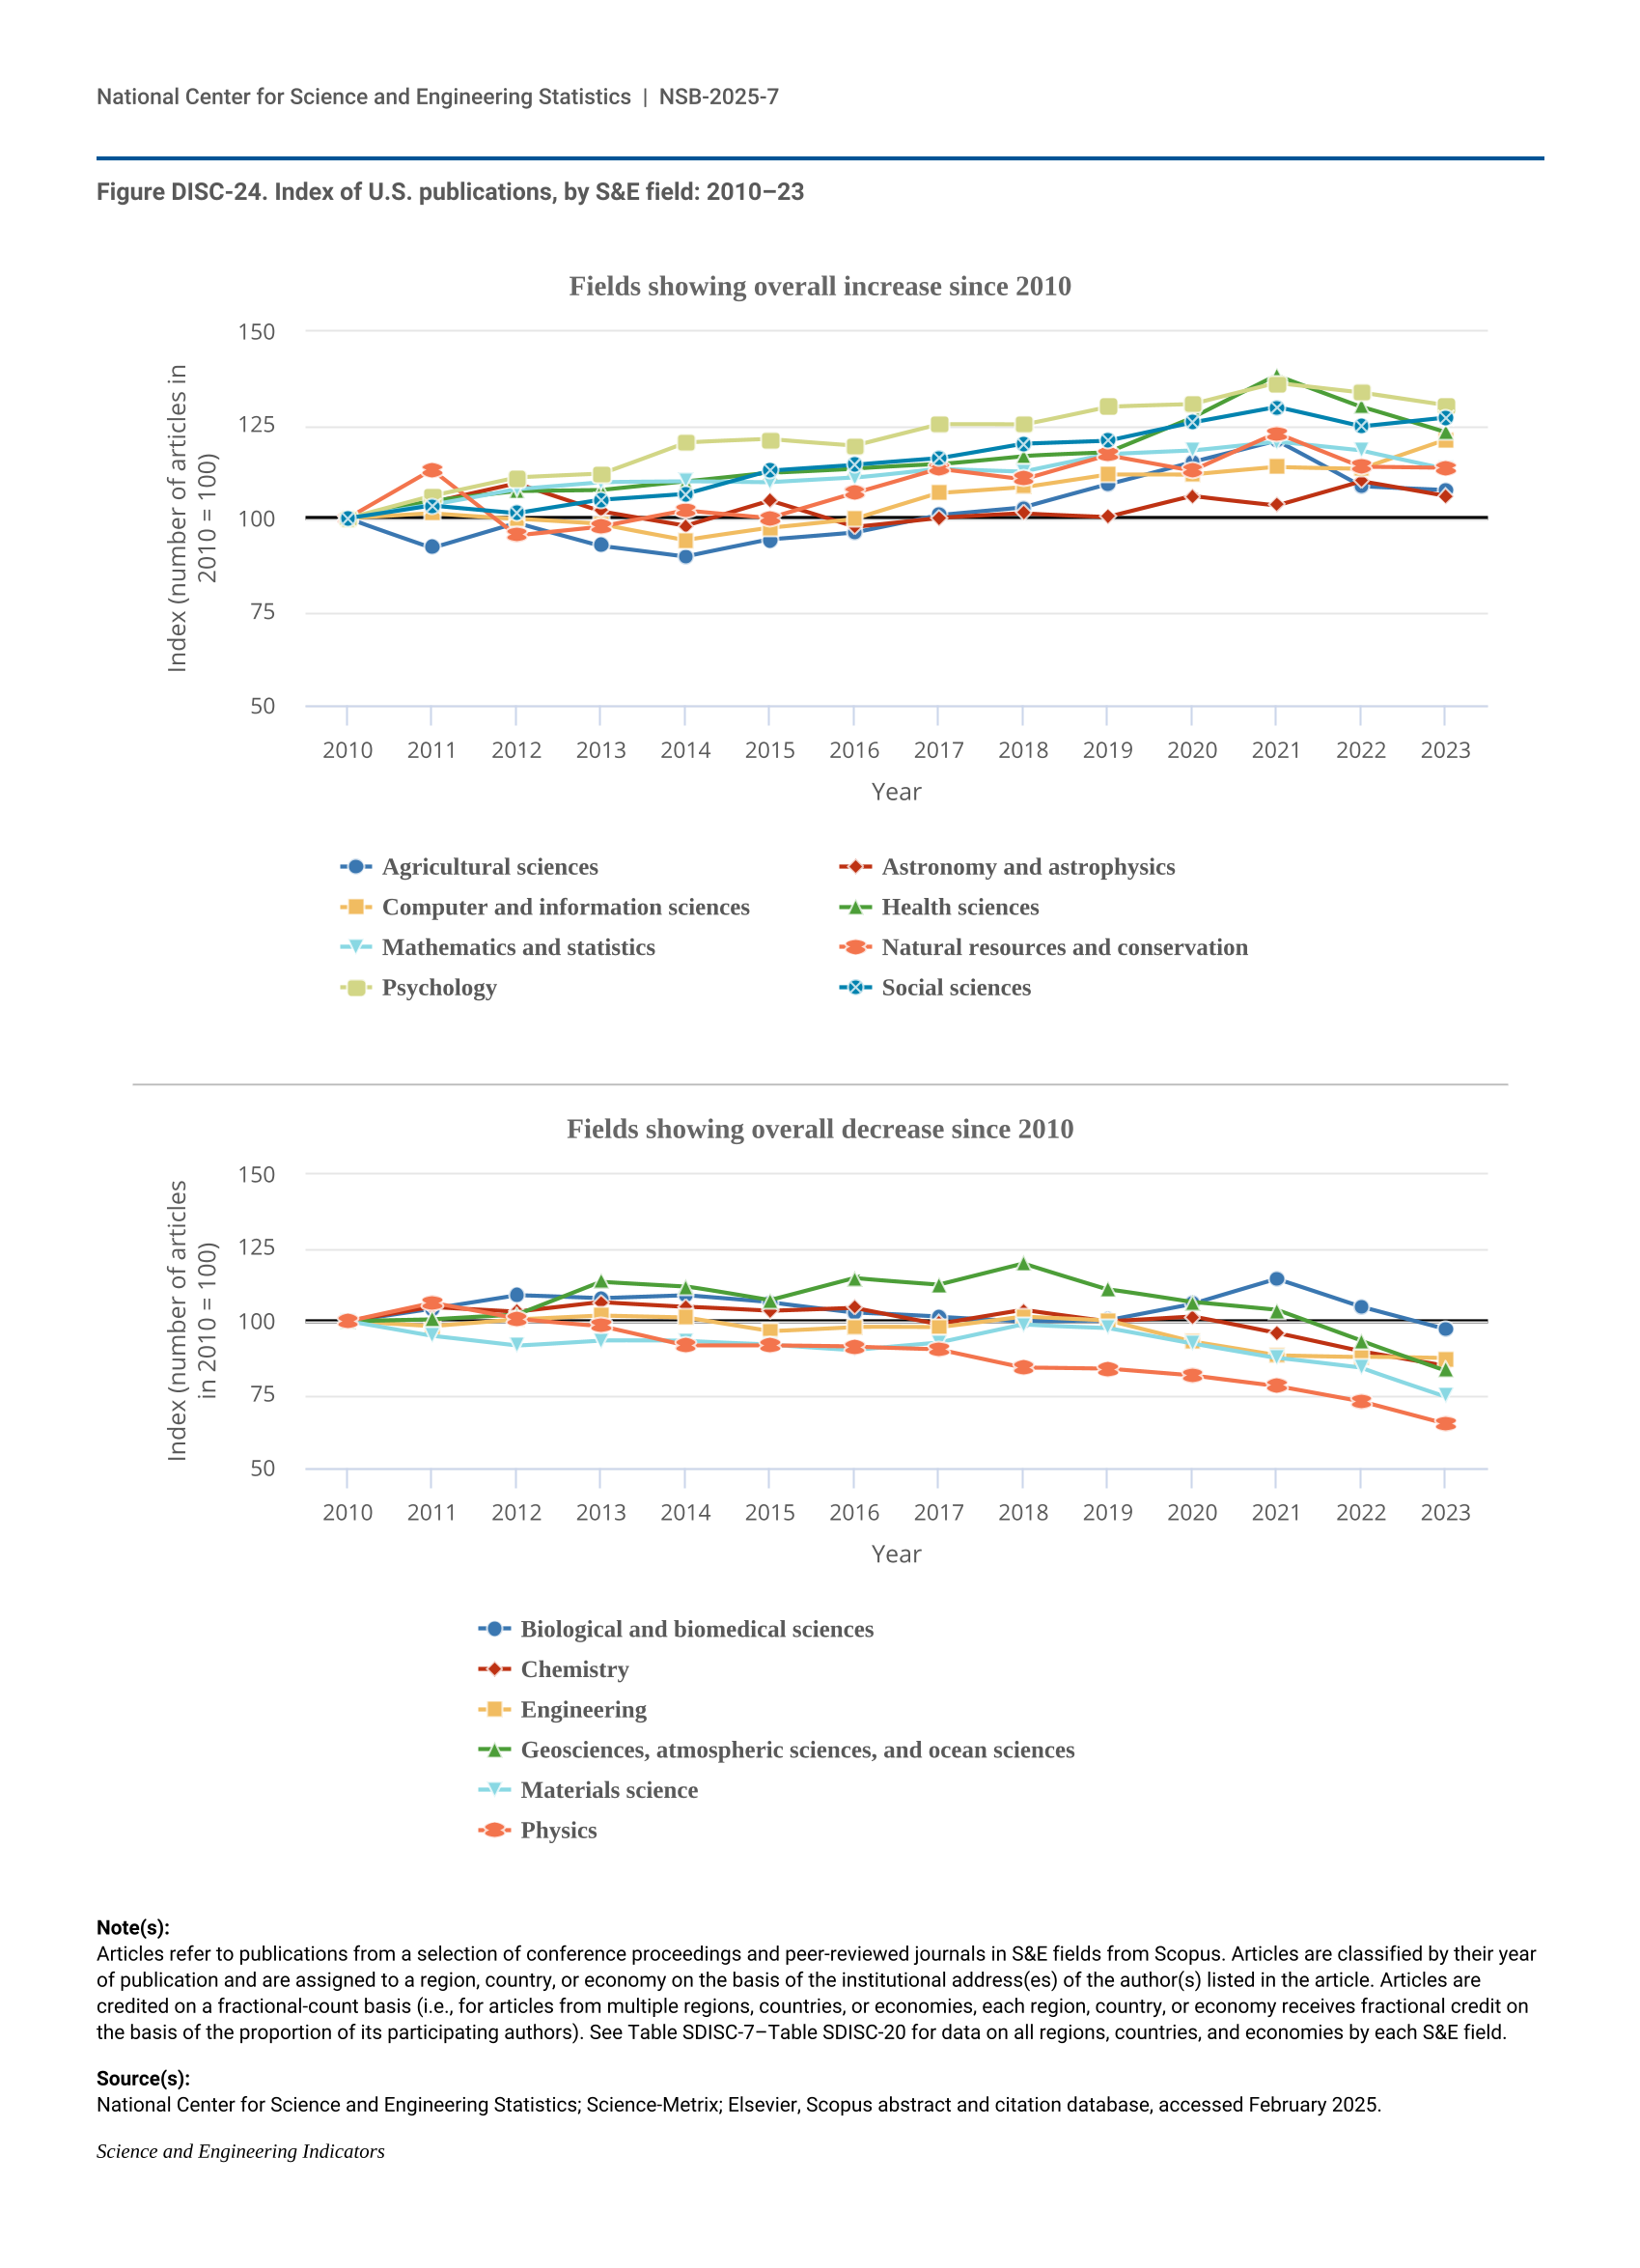
Figure DISC-24.
Index of U.S. publications, by S&E field: 2010–23
Index of U.S. publications, by S&E field: 2010–23
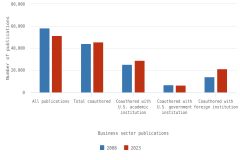
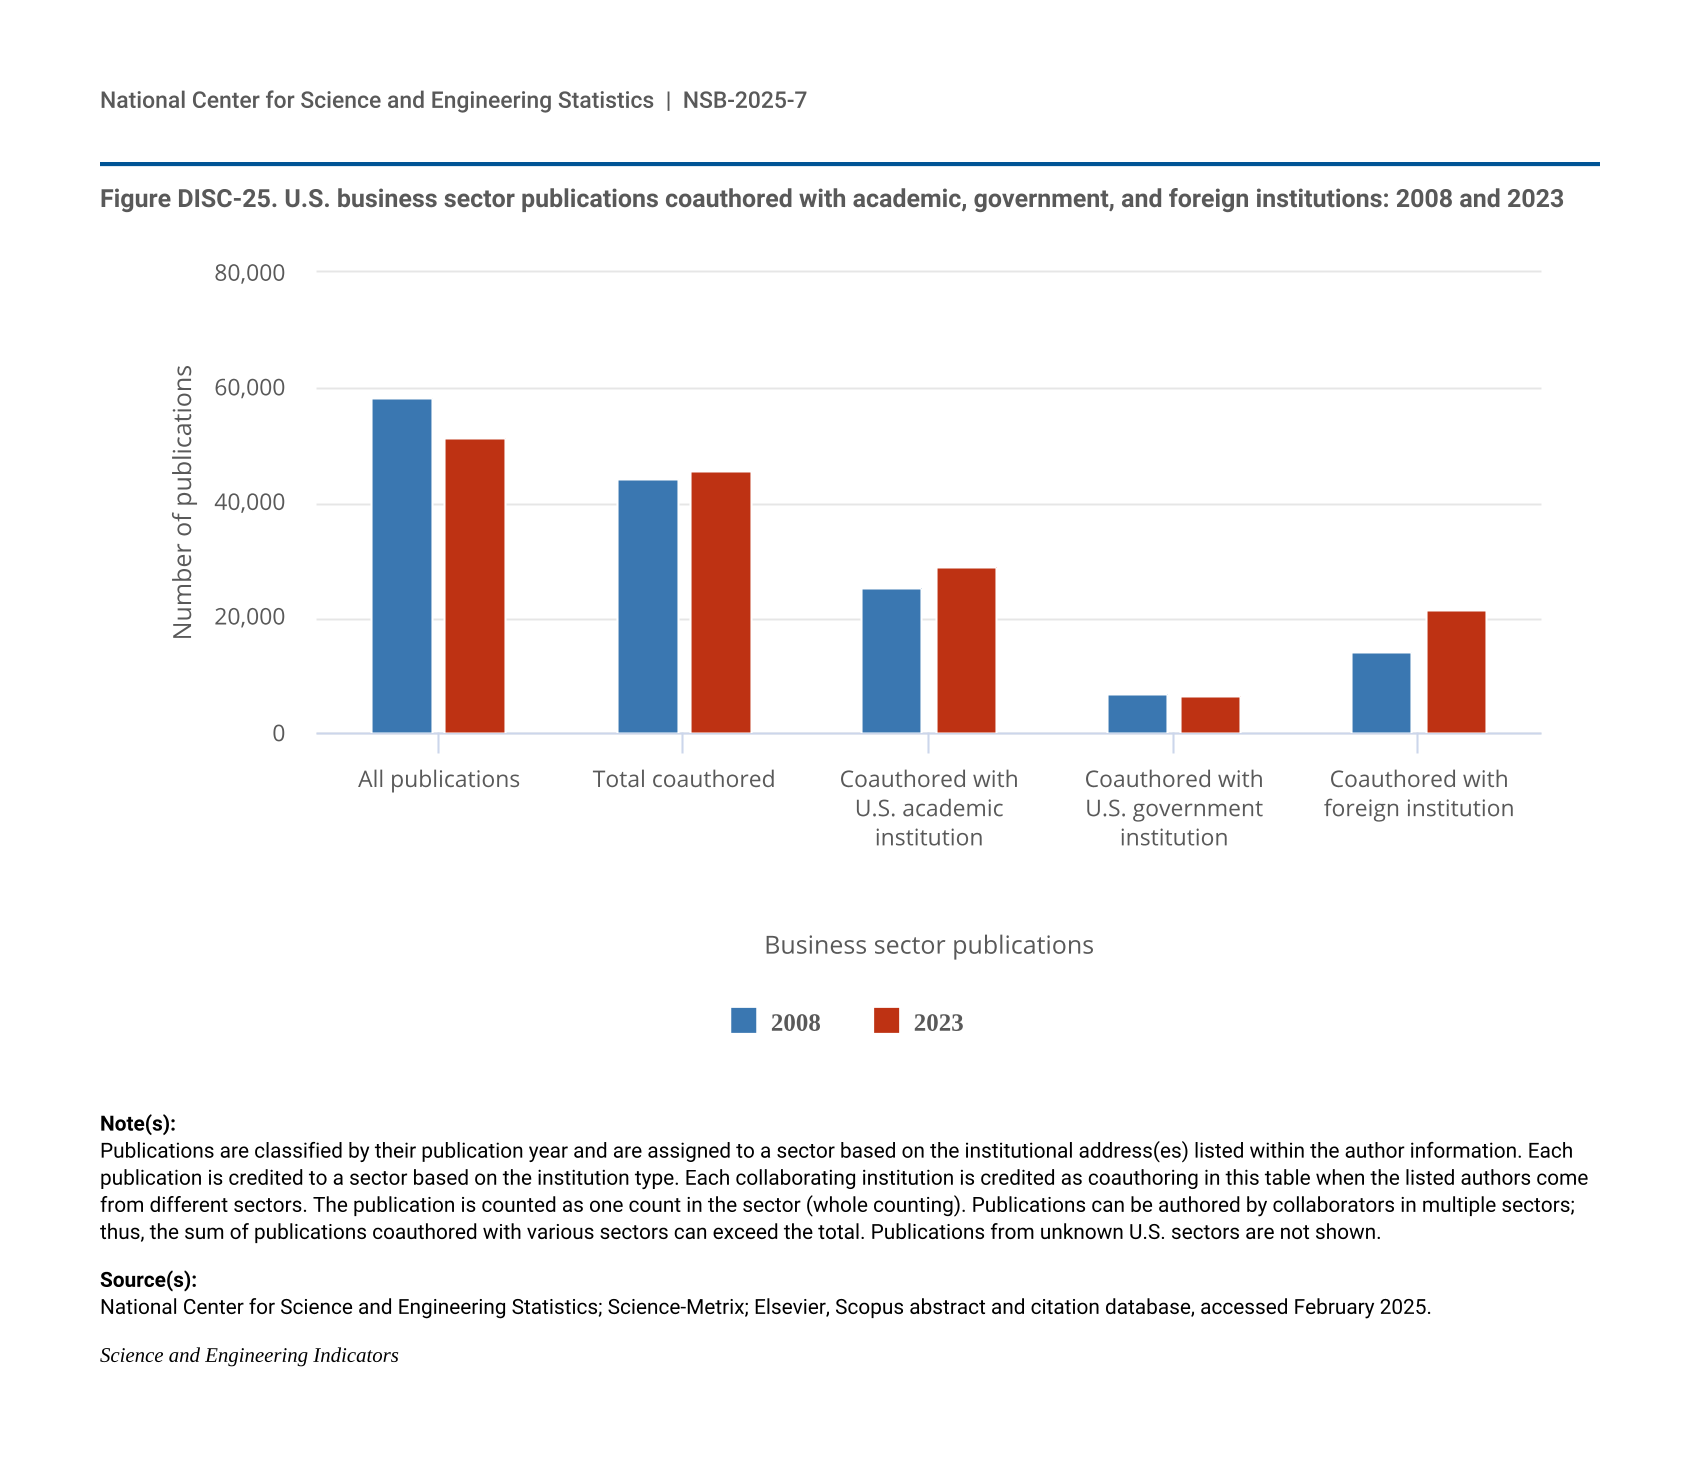
Figure DISC-25.
U.S. business sector publications coauthored with academic, government, and foreign institutions: 2008 and 2023
U.S. business sector publications coauthored with academic, government, and foreign institutions: 2008 and 2023
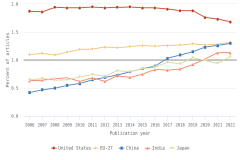
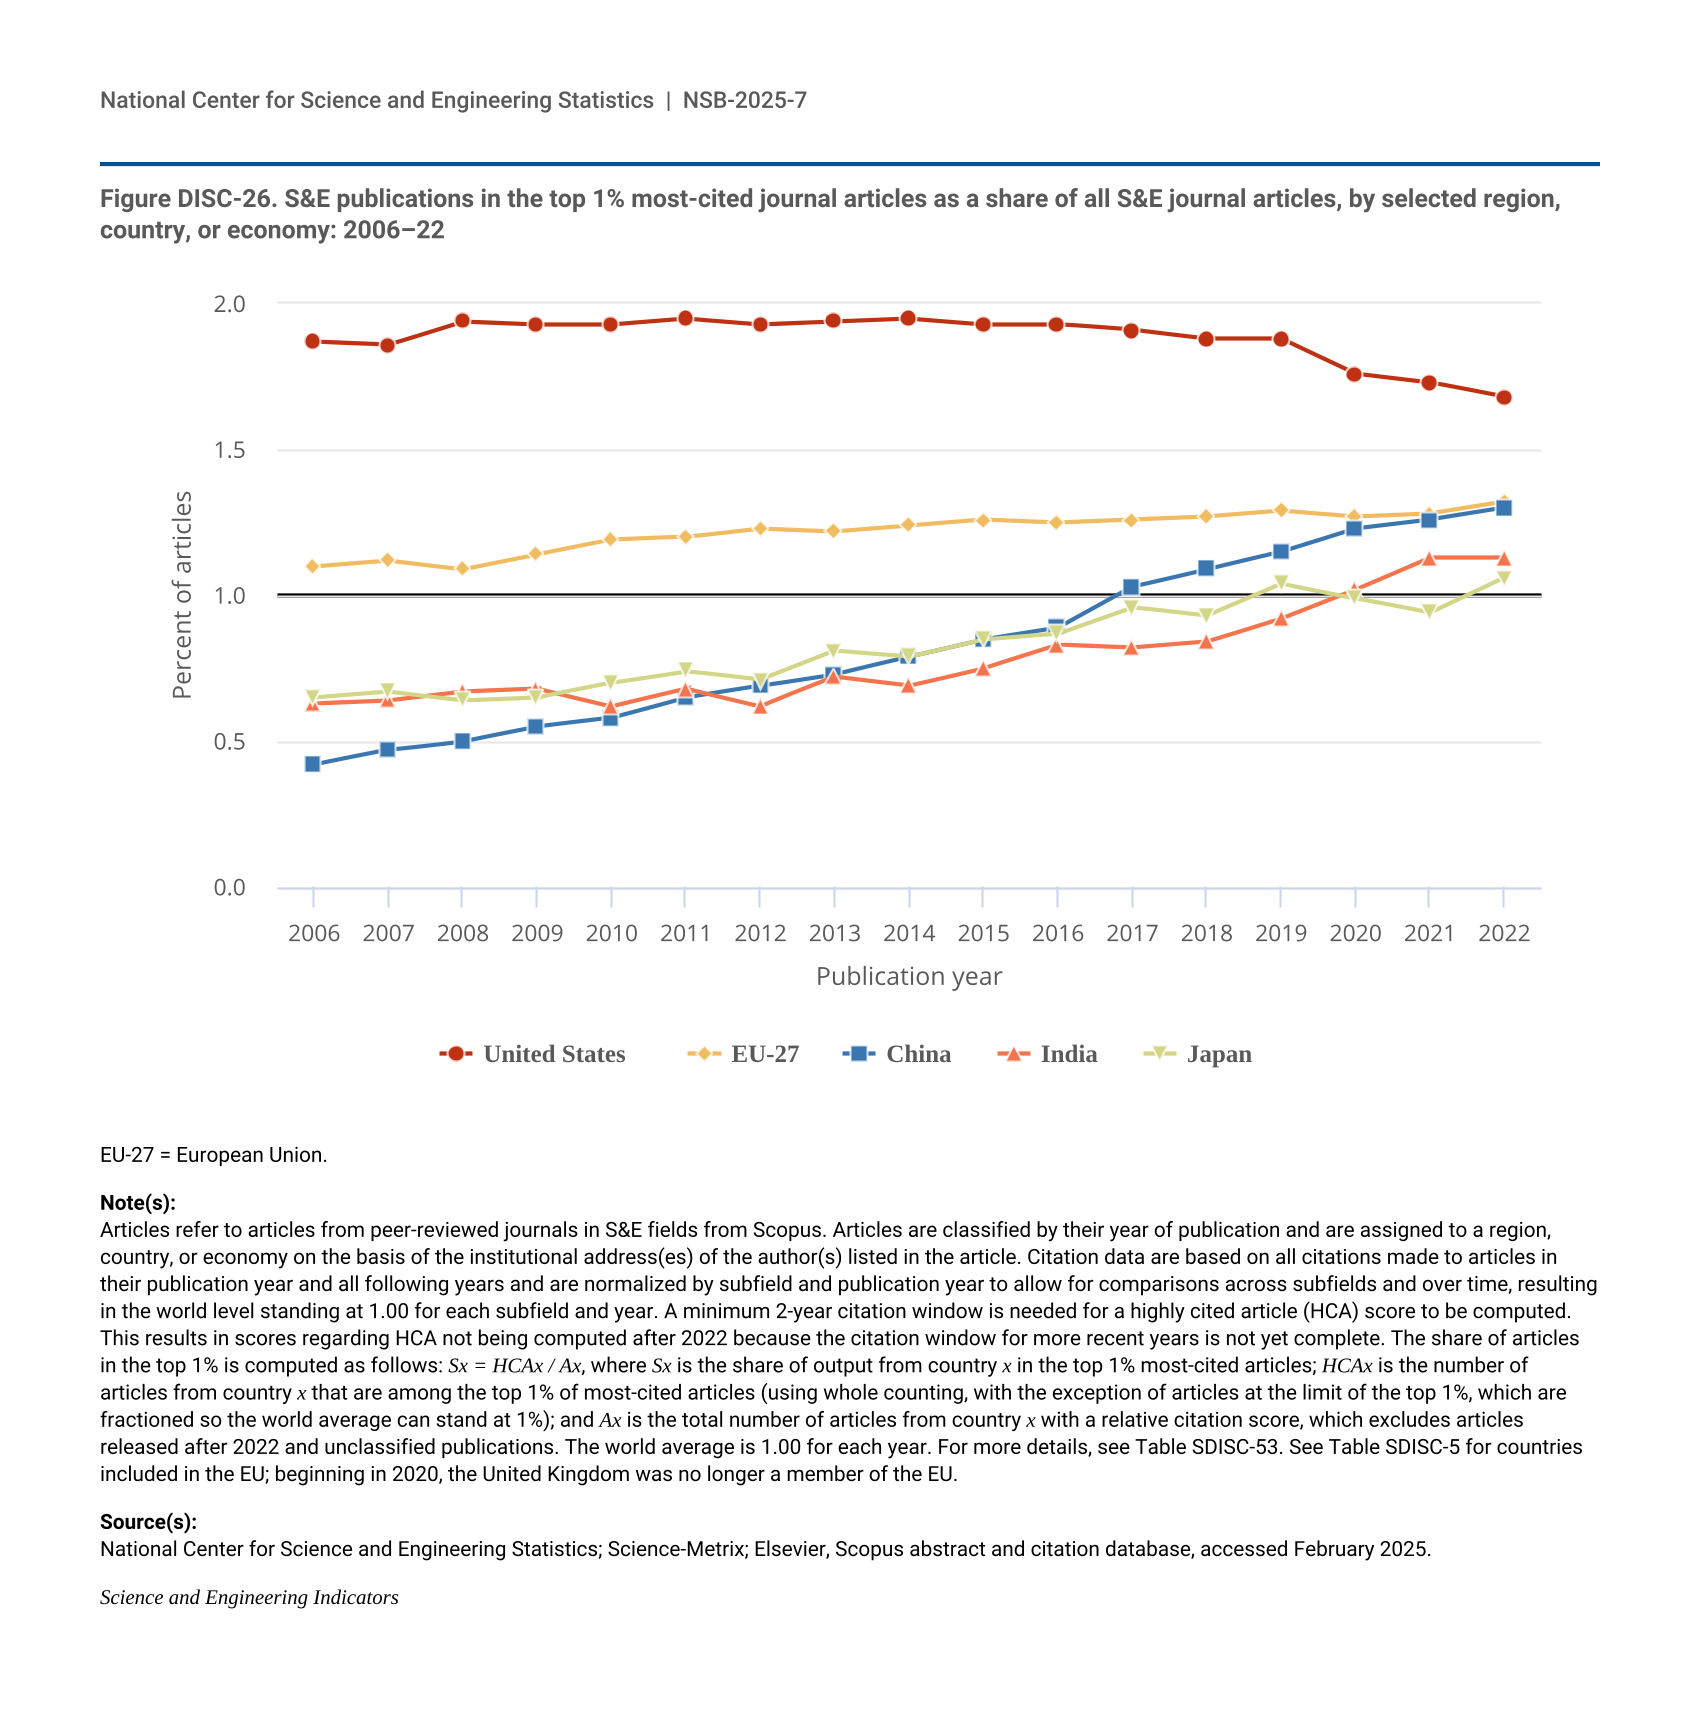
Figure DISC-26.
S&E publications in the top 1% most-cited journal articles as a share of all S&E journal articles, by selected region, country, or economy: 2006–22
S&E publications in the top 1% most-cited journal articles as a share of all S&E journal articles, by selected region, country, or economy: 2006–22
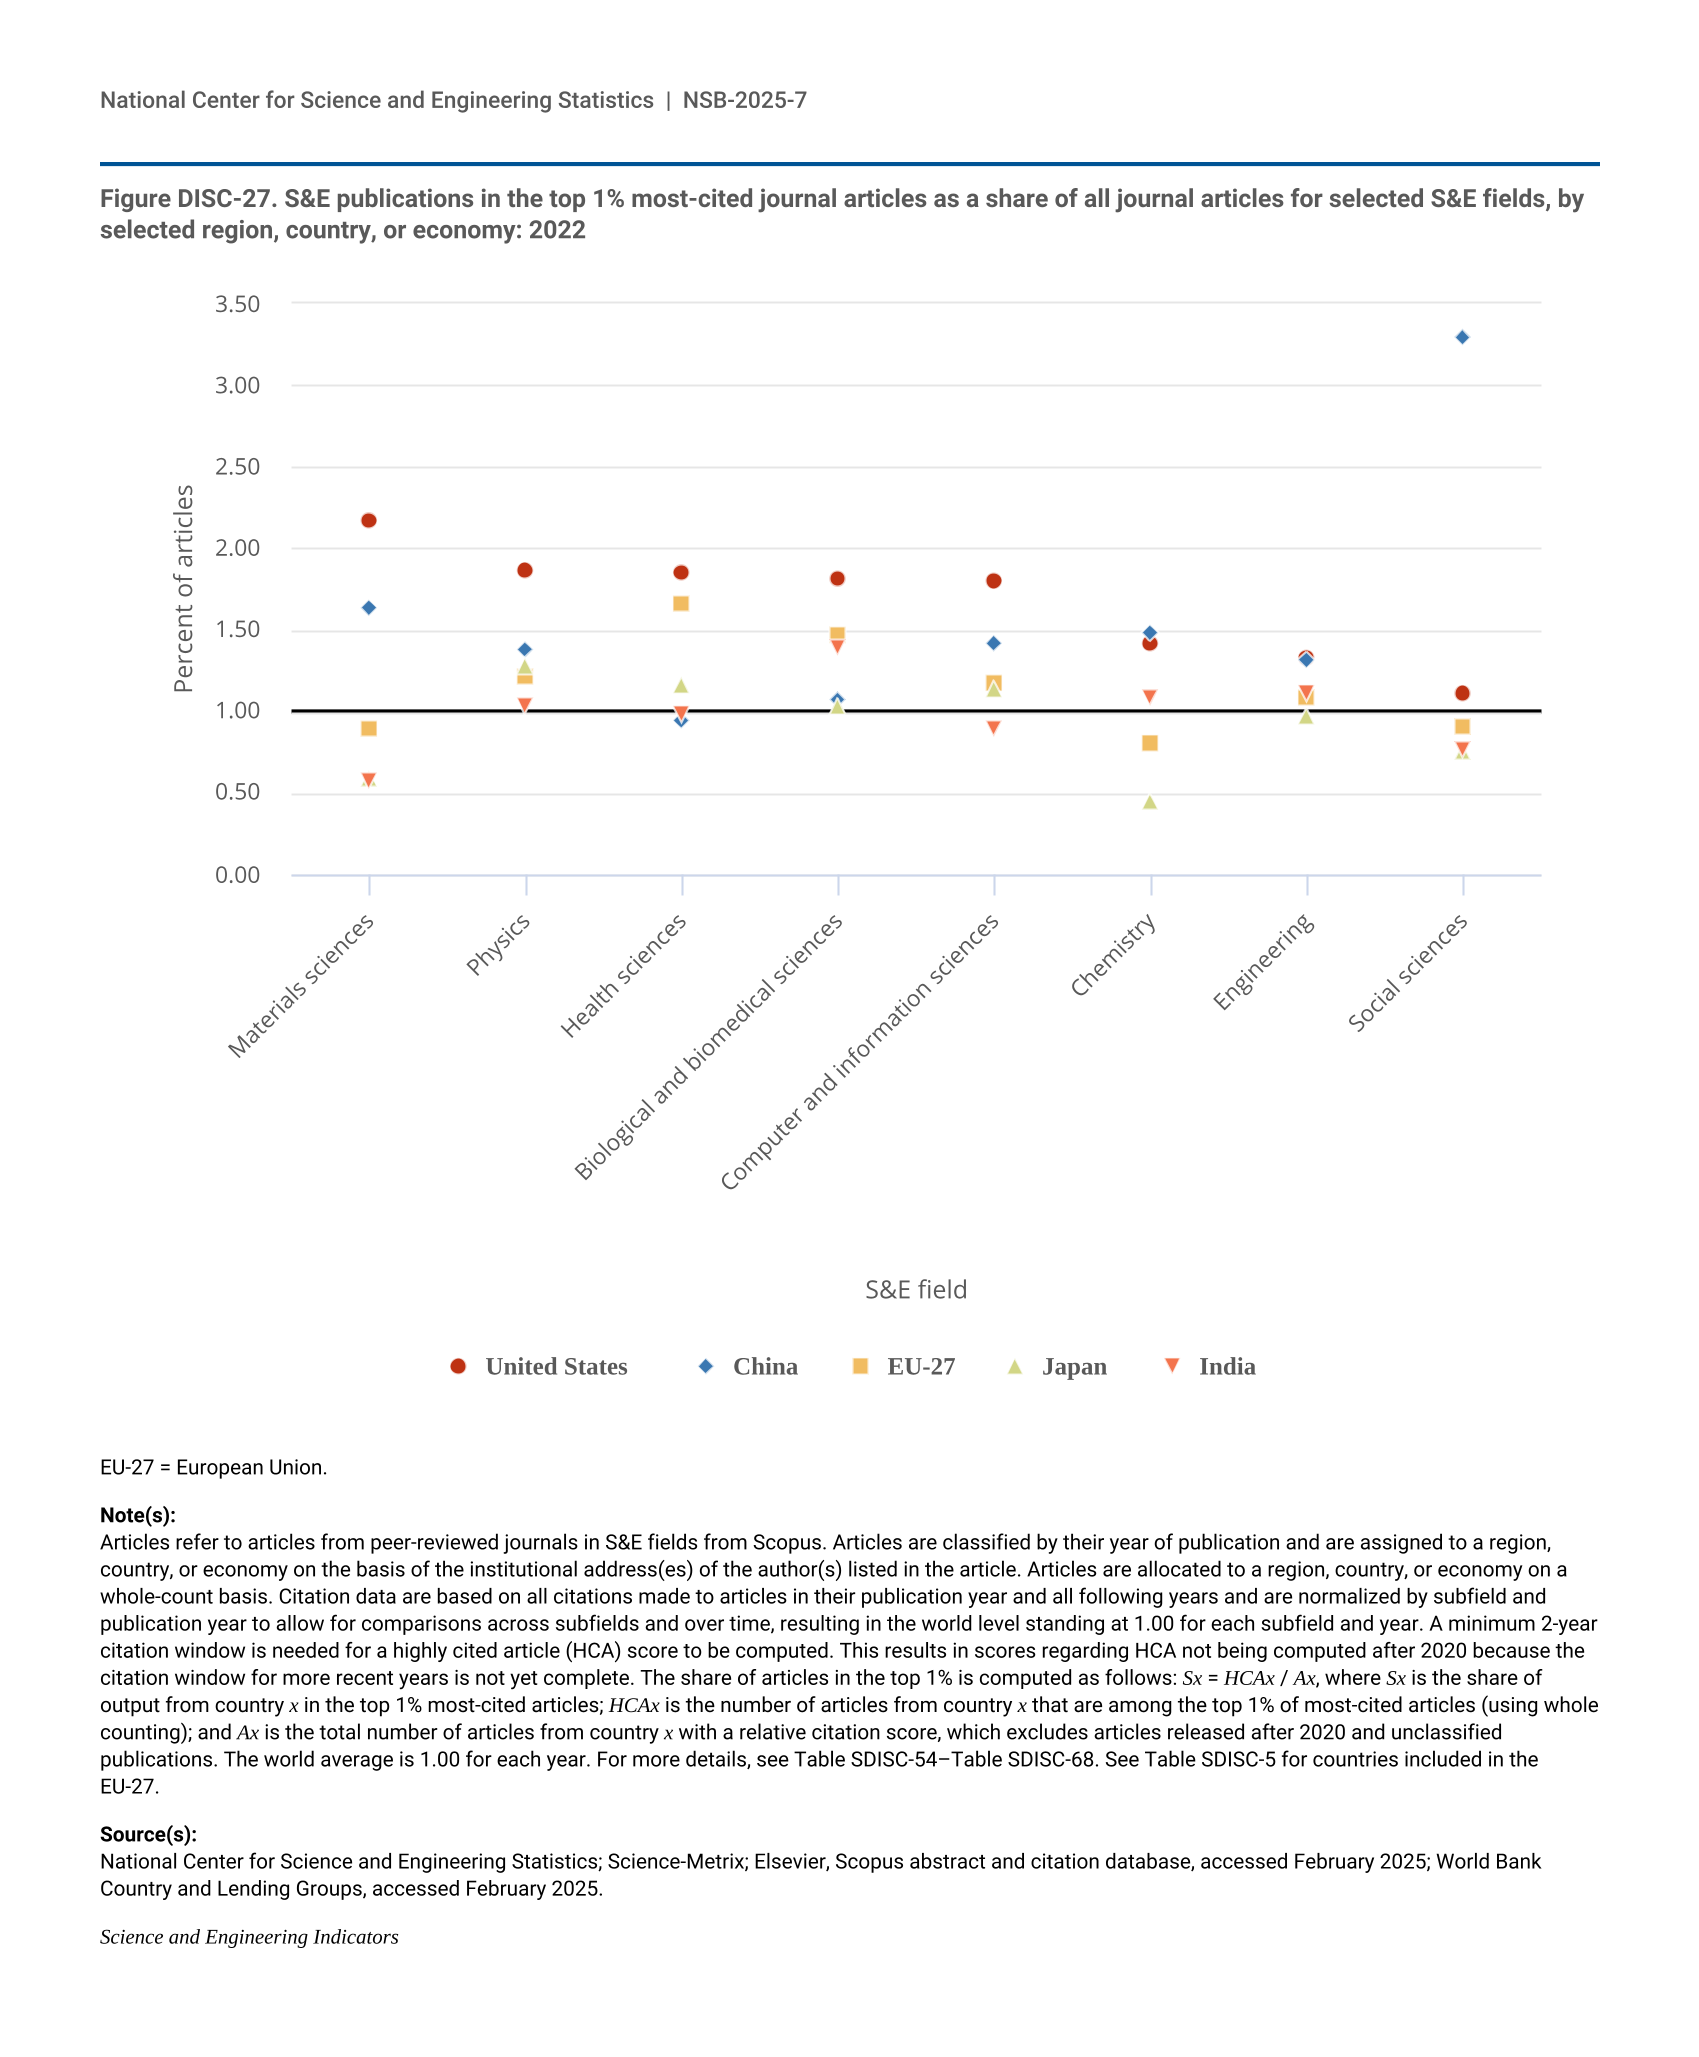
Figure DISC-27.
S&E publications in the top 1% most-cited journal articles as a share of all journal articles for selected S&E fields, by selected region, country, or economy: 2022
S&E publications in the top 1% most-cited journal articles as a share of all journal articles for selected S&E fields, by selected region, country, or economy: 2022
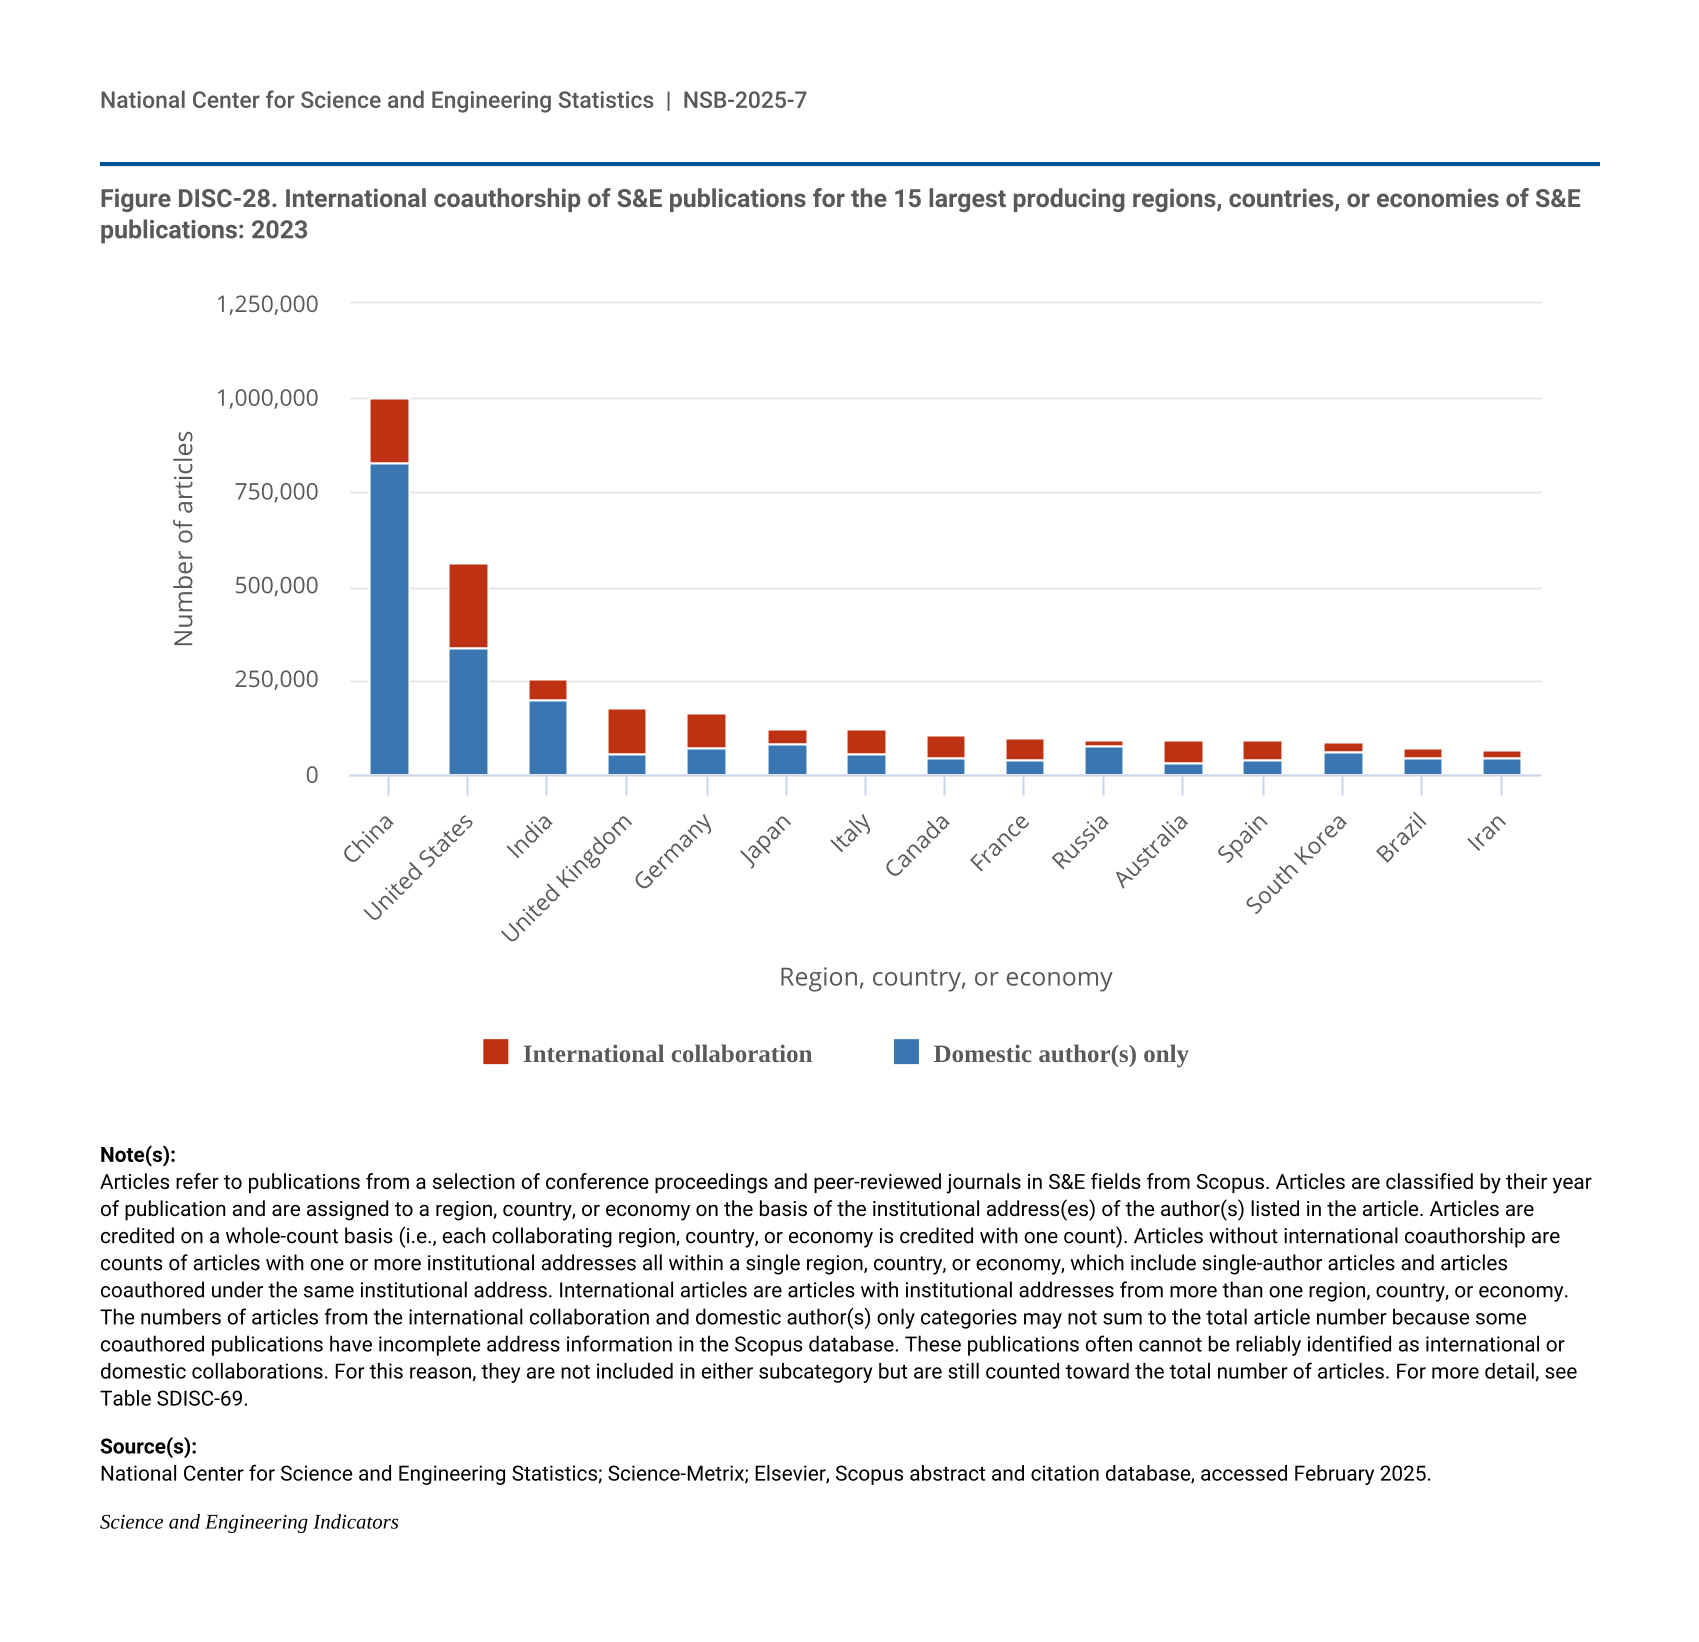
Figure DISC-28.
International coauthorship of S&E publications for the 15 largest producing regions, countries, or economies of S&E publications: 2023
International coauthorship of S&E publications for the 15 largest producing regions, countries, or economies of S&E publications: 2023
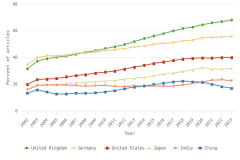
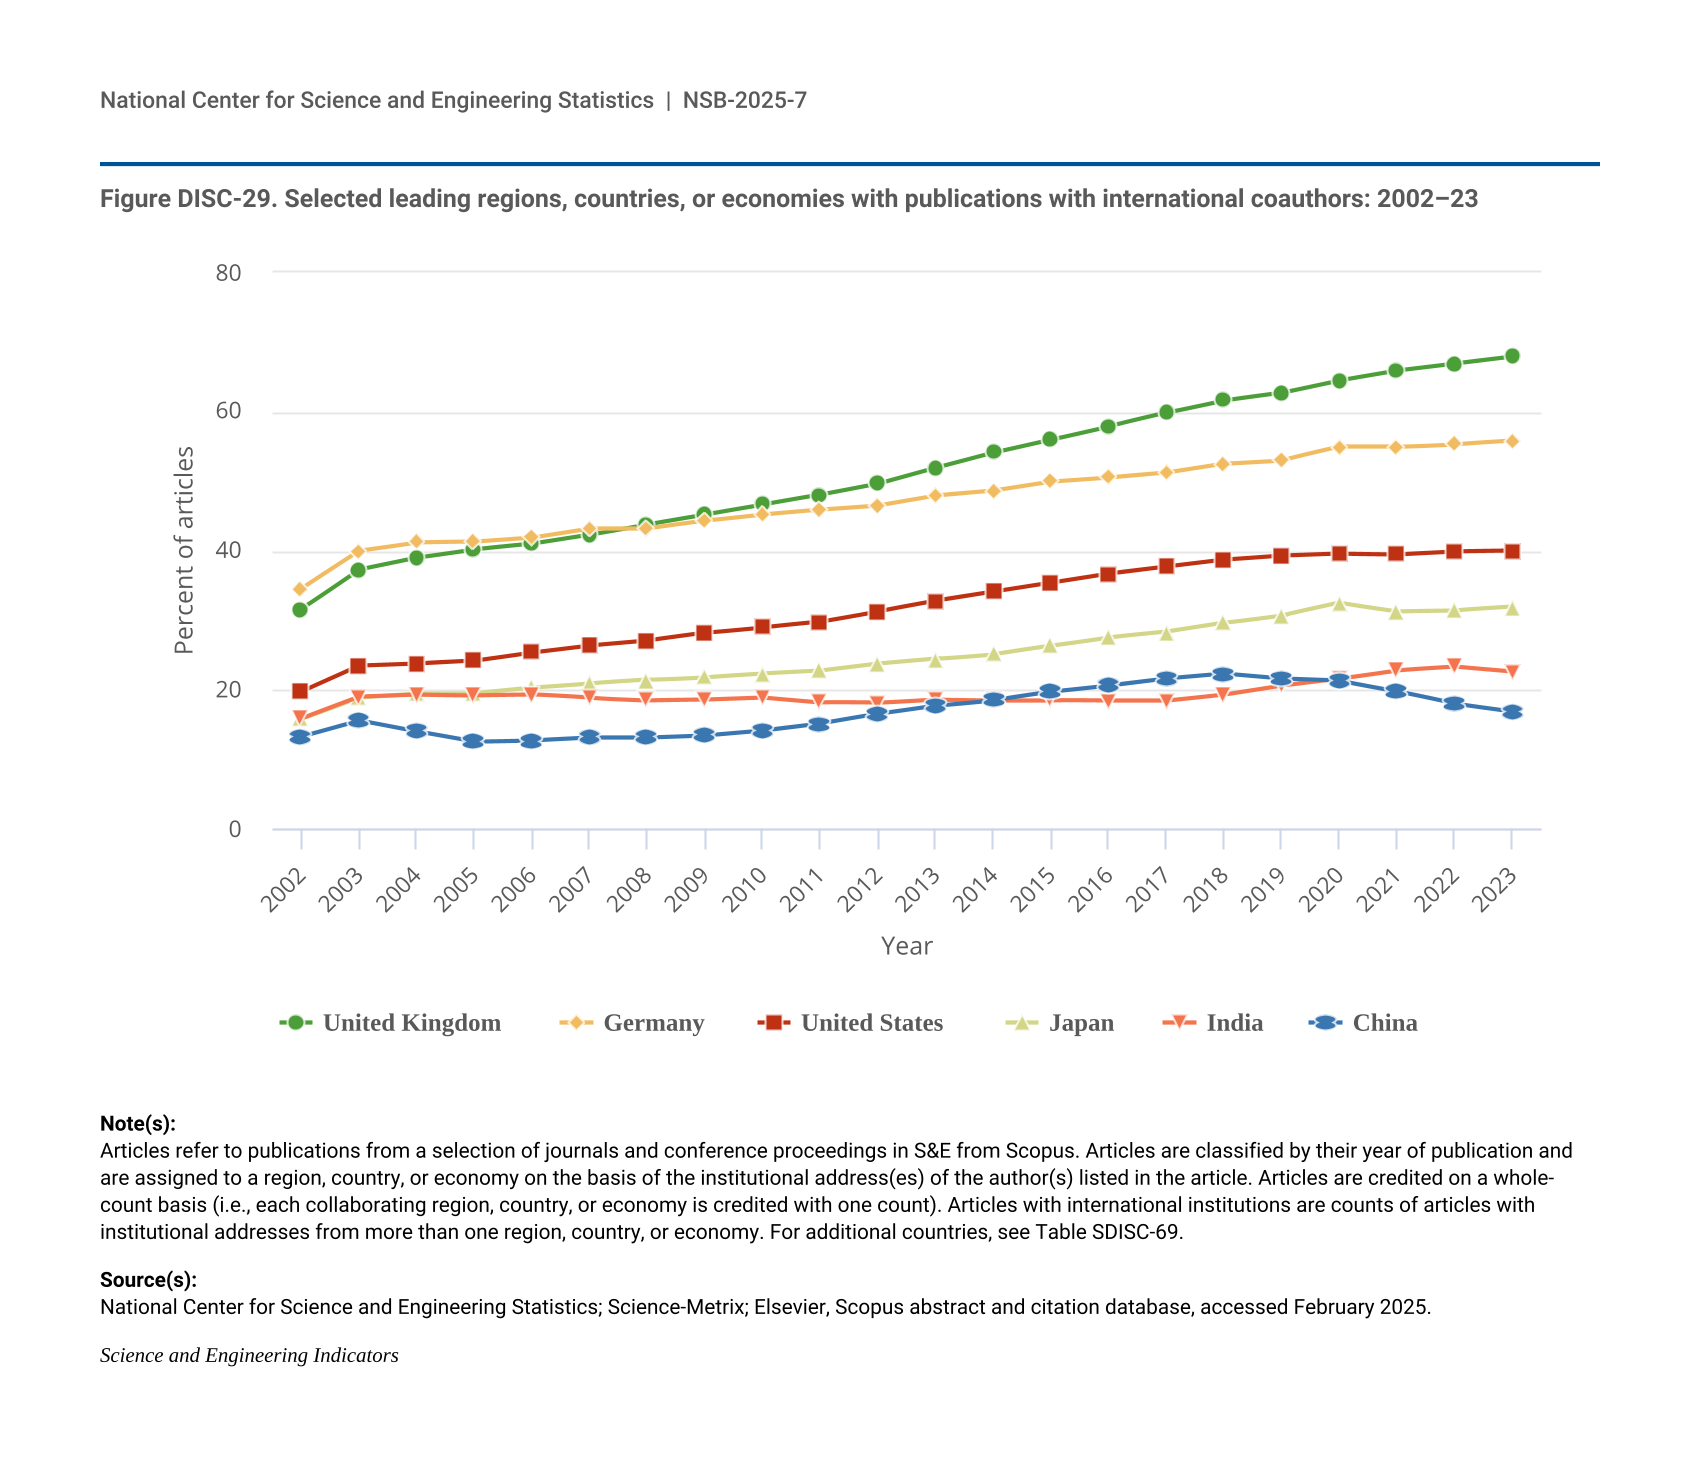
Figure DISC-29.
Selected leading regions, countries, or economies with publications with international coauthors: 2002–23
Selected leading regions, countries, or economies with publications with international coauthors: 2002–23
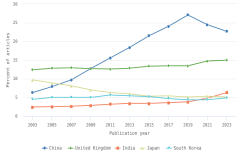
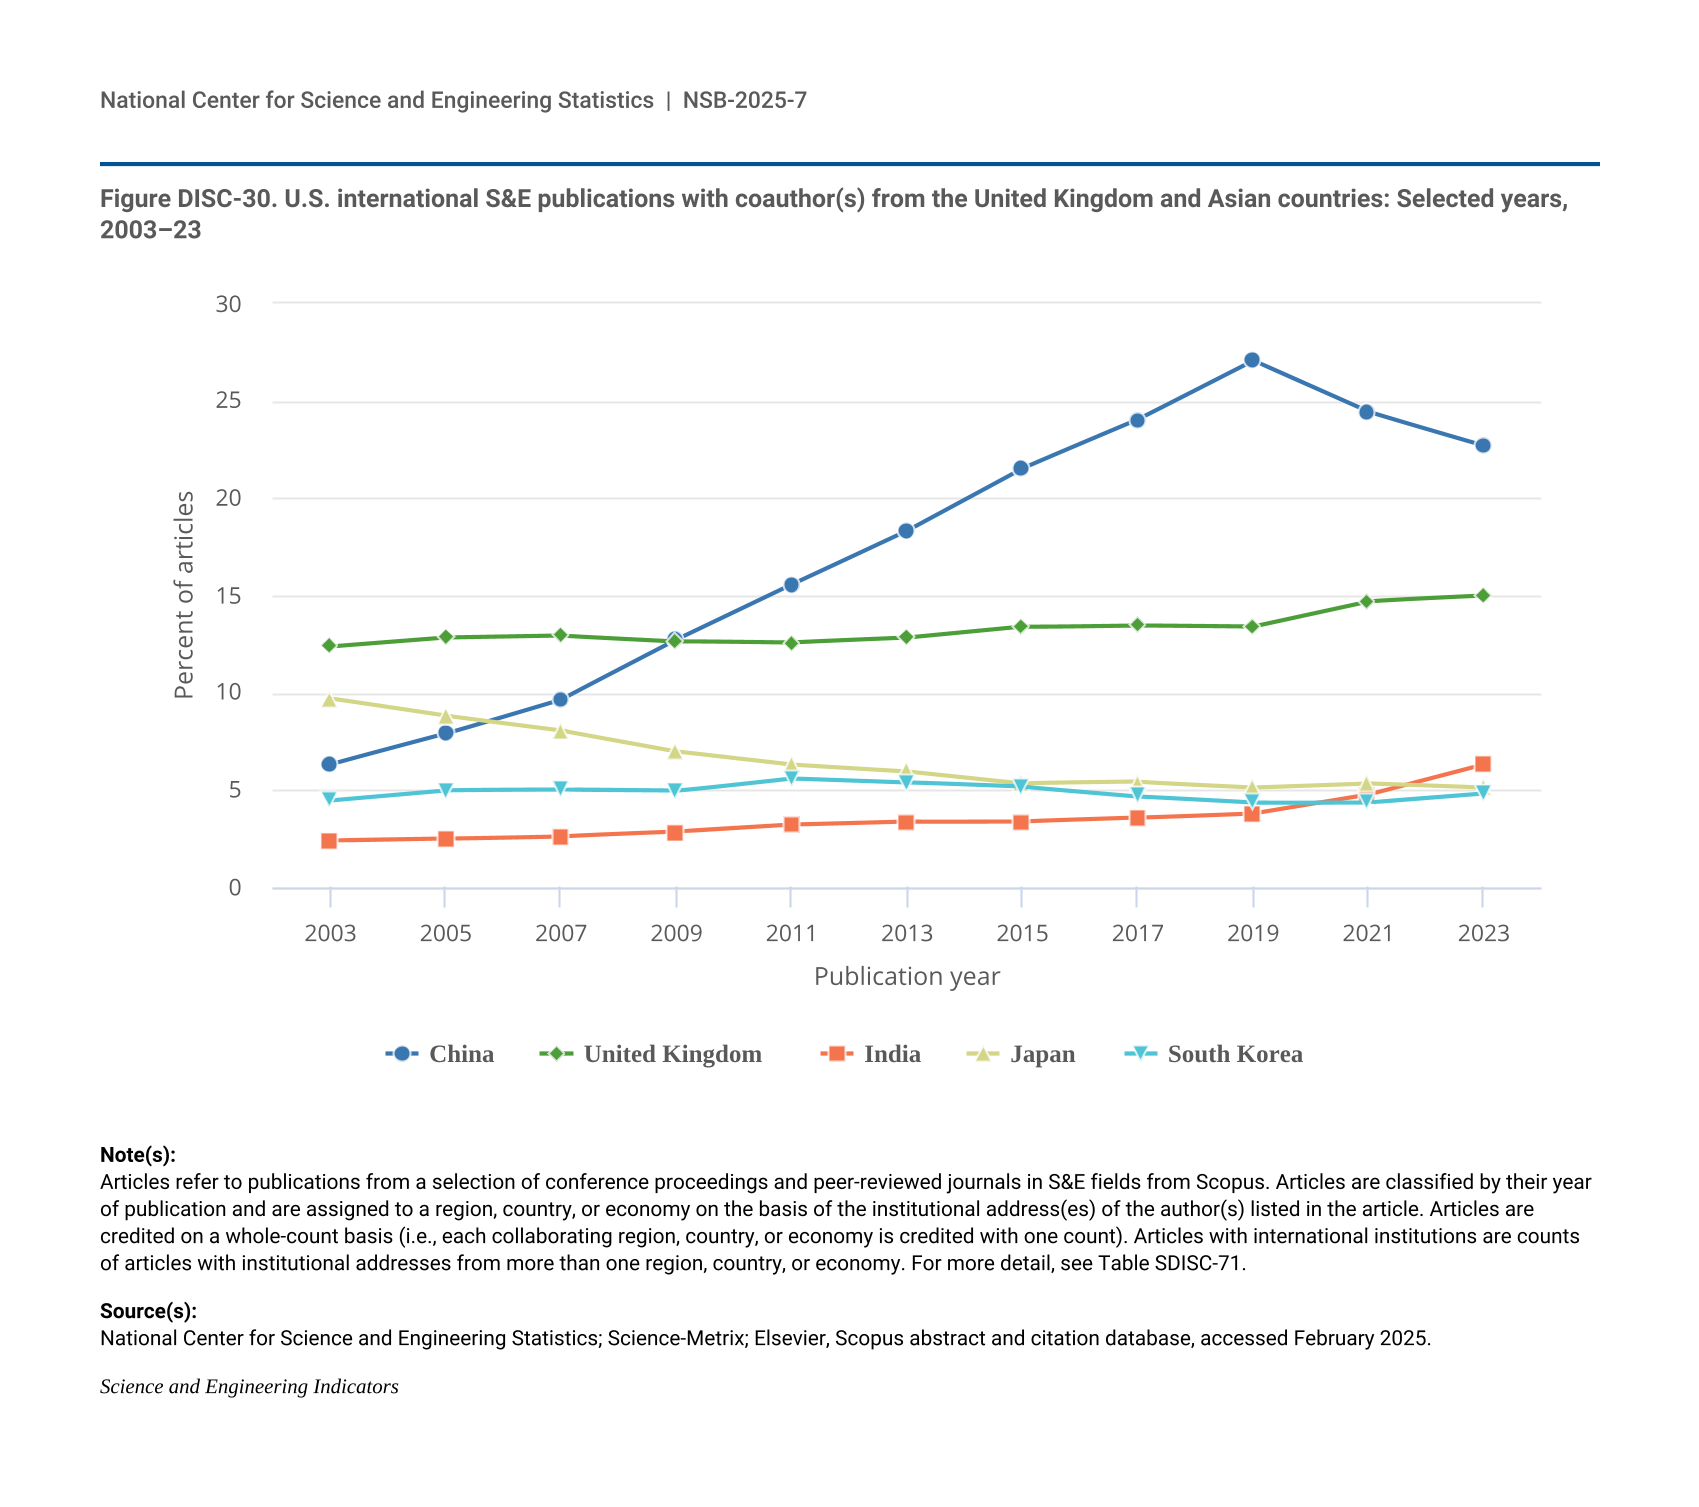
Figure DISC-30.
U.S. international S&E publications with coauthor(s) from the United Kingdom and Asian countries: Selected years, 2003–23
U.S. international S&E publications with coauthor(s) from the United Kingdom and Asian countries: Selected years, 2003–23
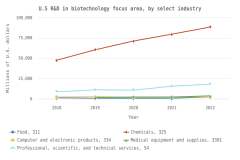
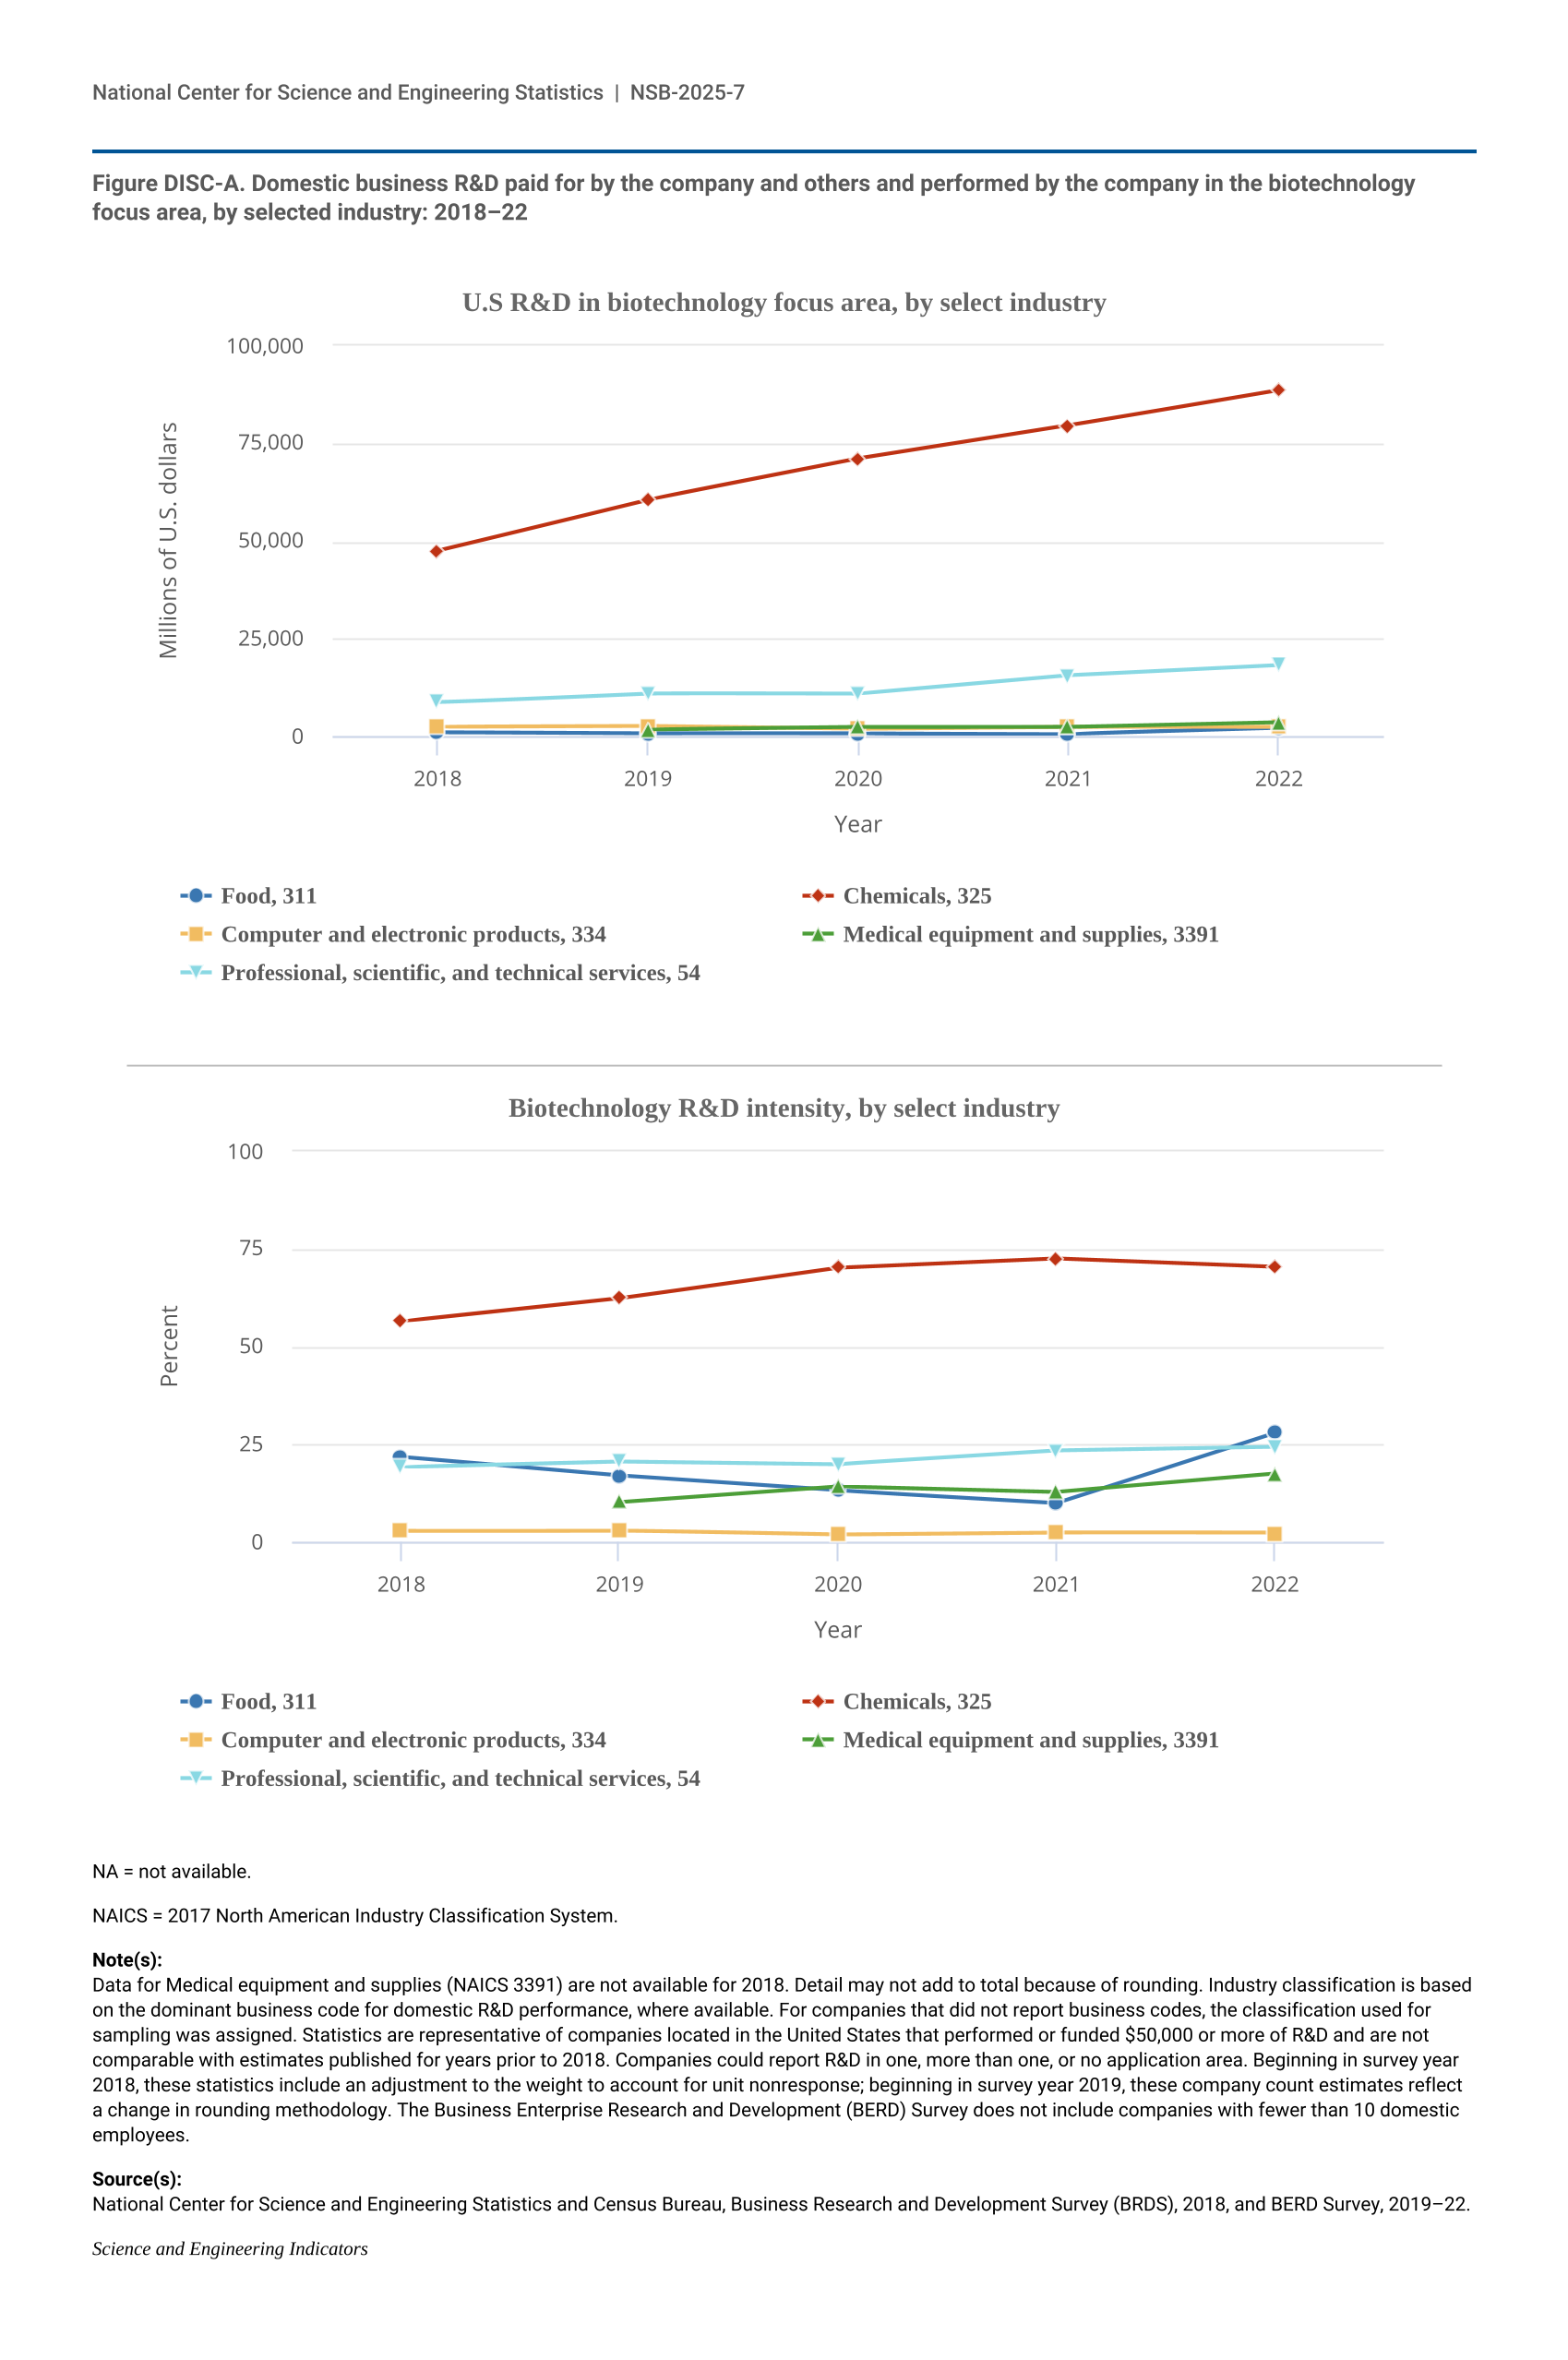
Figure DISC-A.
Domestic business R&D paid for by the company and others and performed by the company in the biotechnology focus area, by selected industry: 2018–22
Domestic business R&D paid for by the company and others and performed by the company in the biotechnology focus area, by selected industry: 2018–22
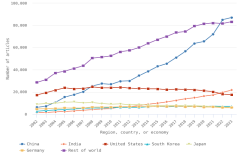
Figure DISC-B.
Biotechnology-related S&E articles, by selected region, country, or economy and rest of world: 2002–23
Biotechnology-related S&E articles, by selected region, country, or economy and rest of world: 2002–23
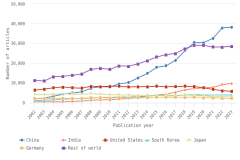
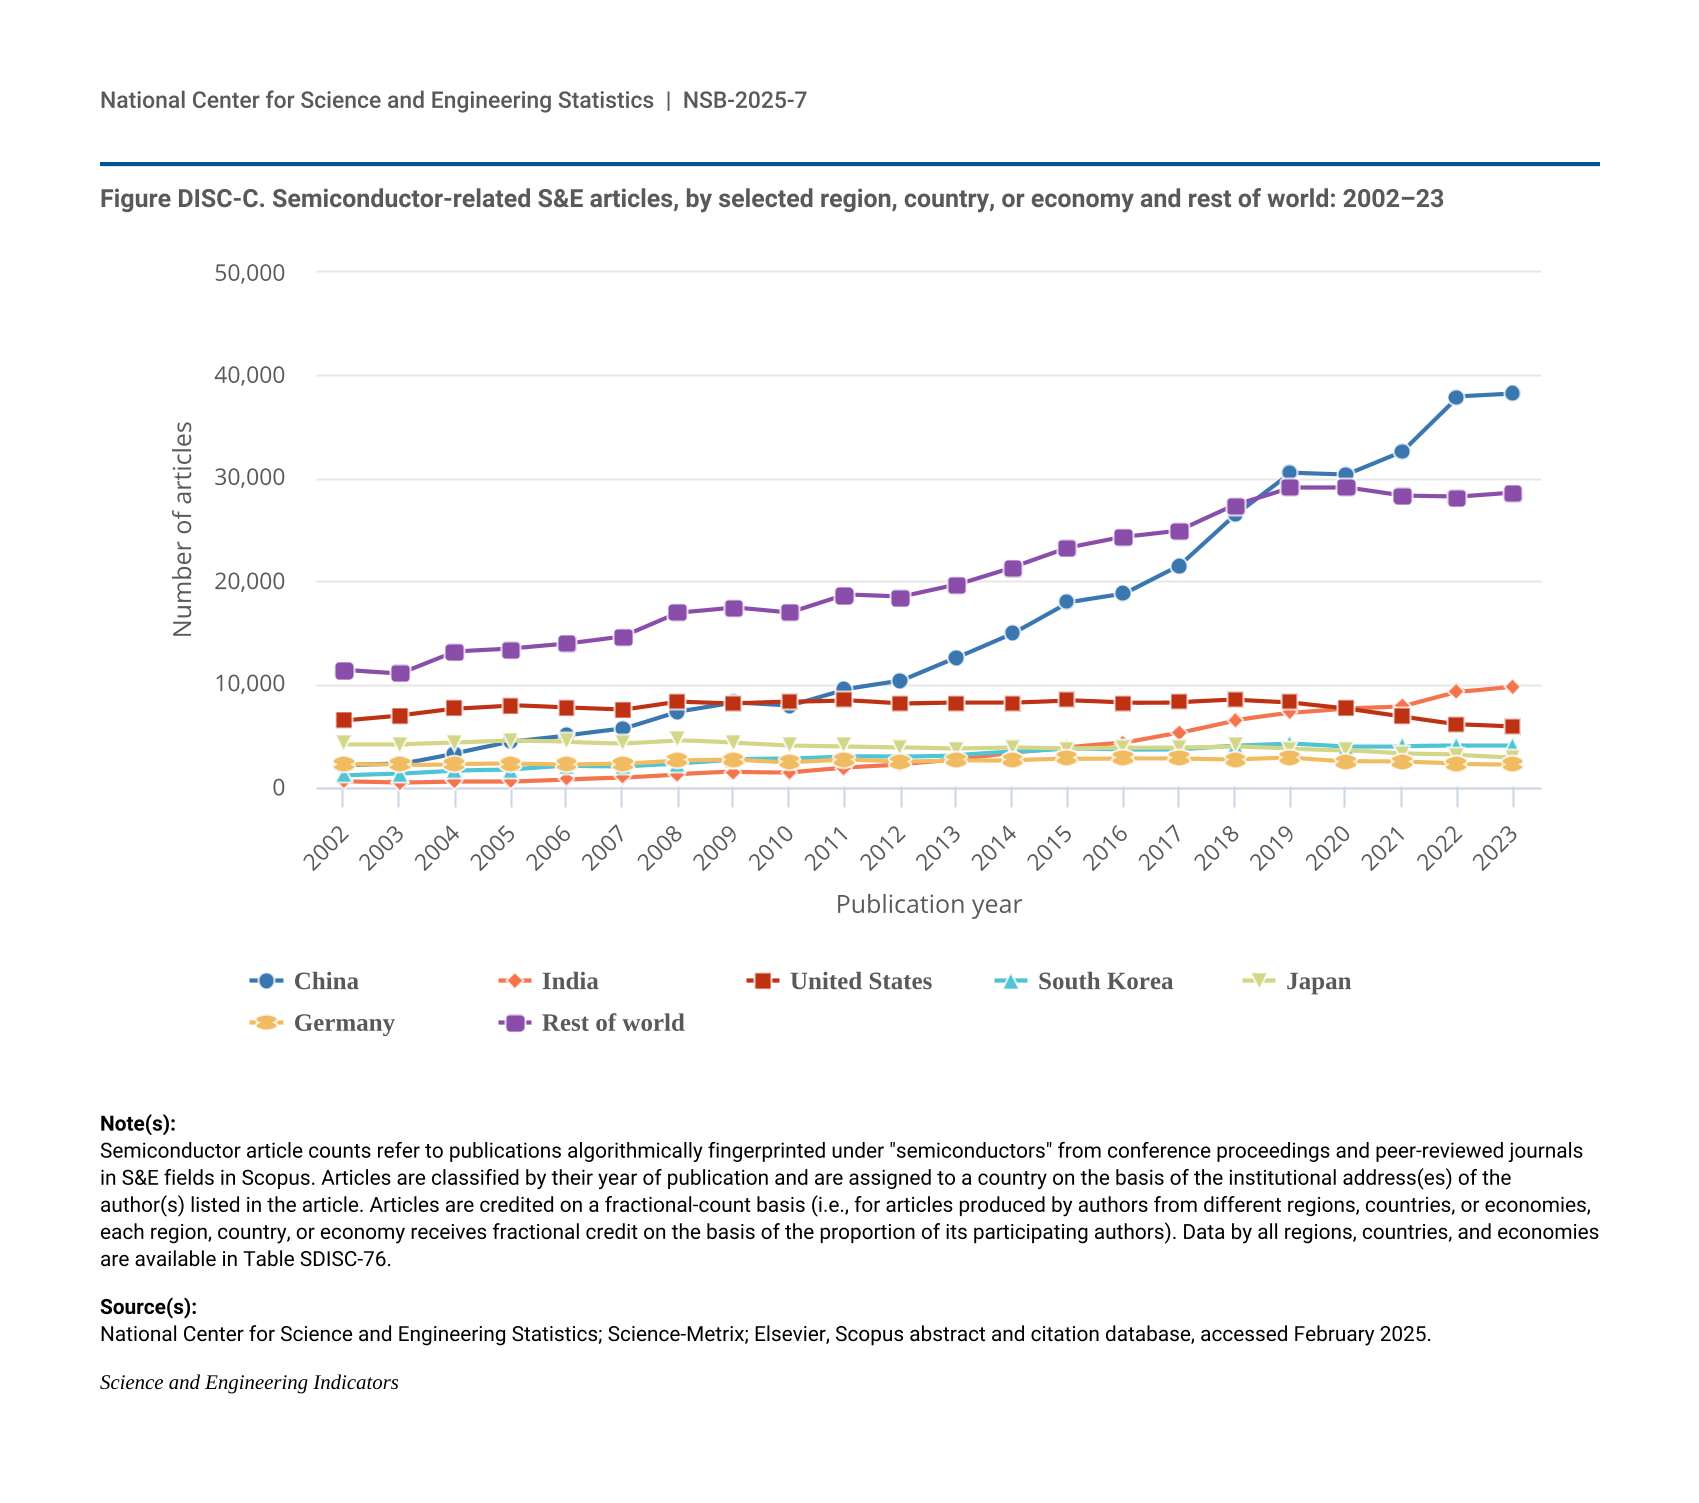
Figure DISC-C.
Semiconductor-related S&E articles, by selected region, country, or economy and rest of world: 2002–23
Semiconductor-related S&E articles, by selected region, country, or economy and rest of world: 2002–23
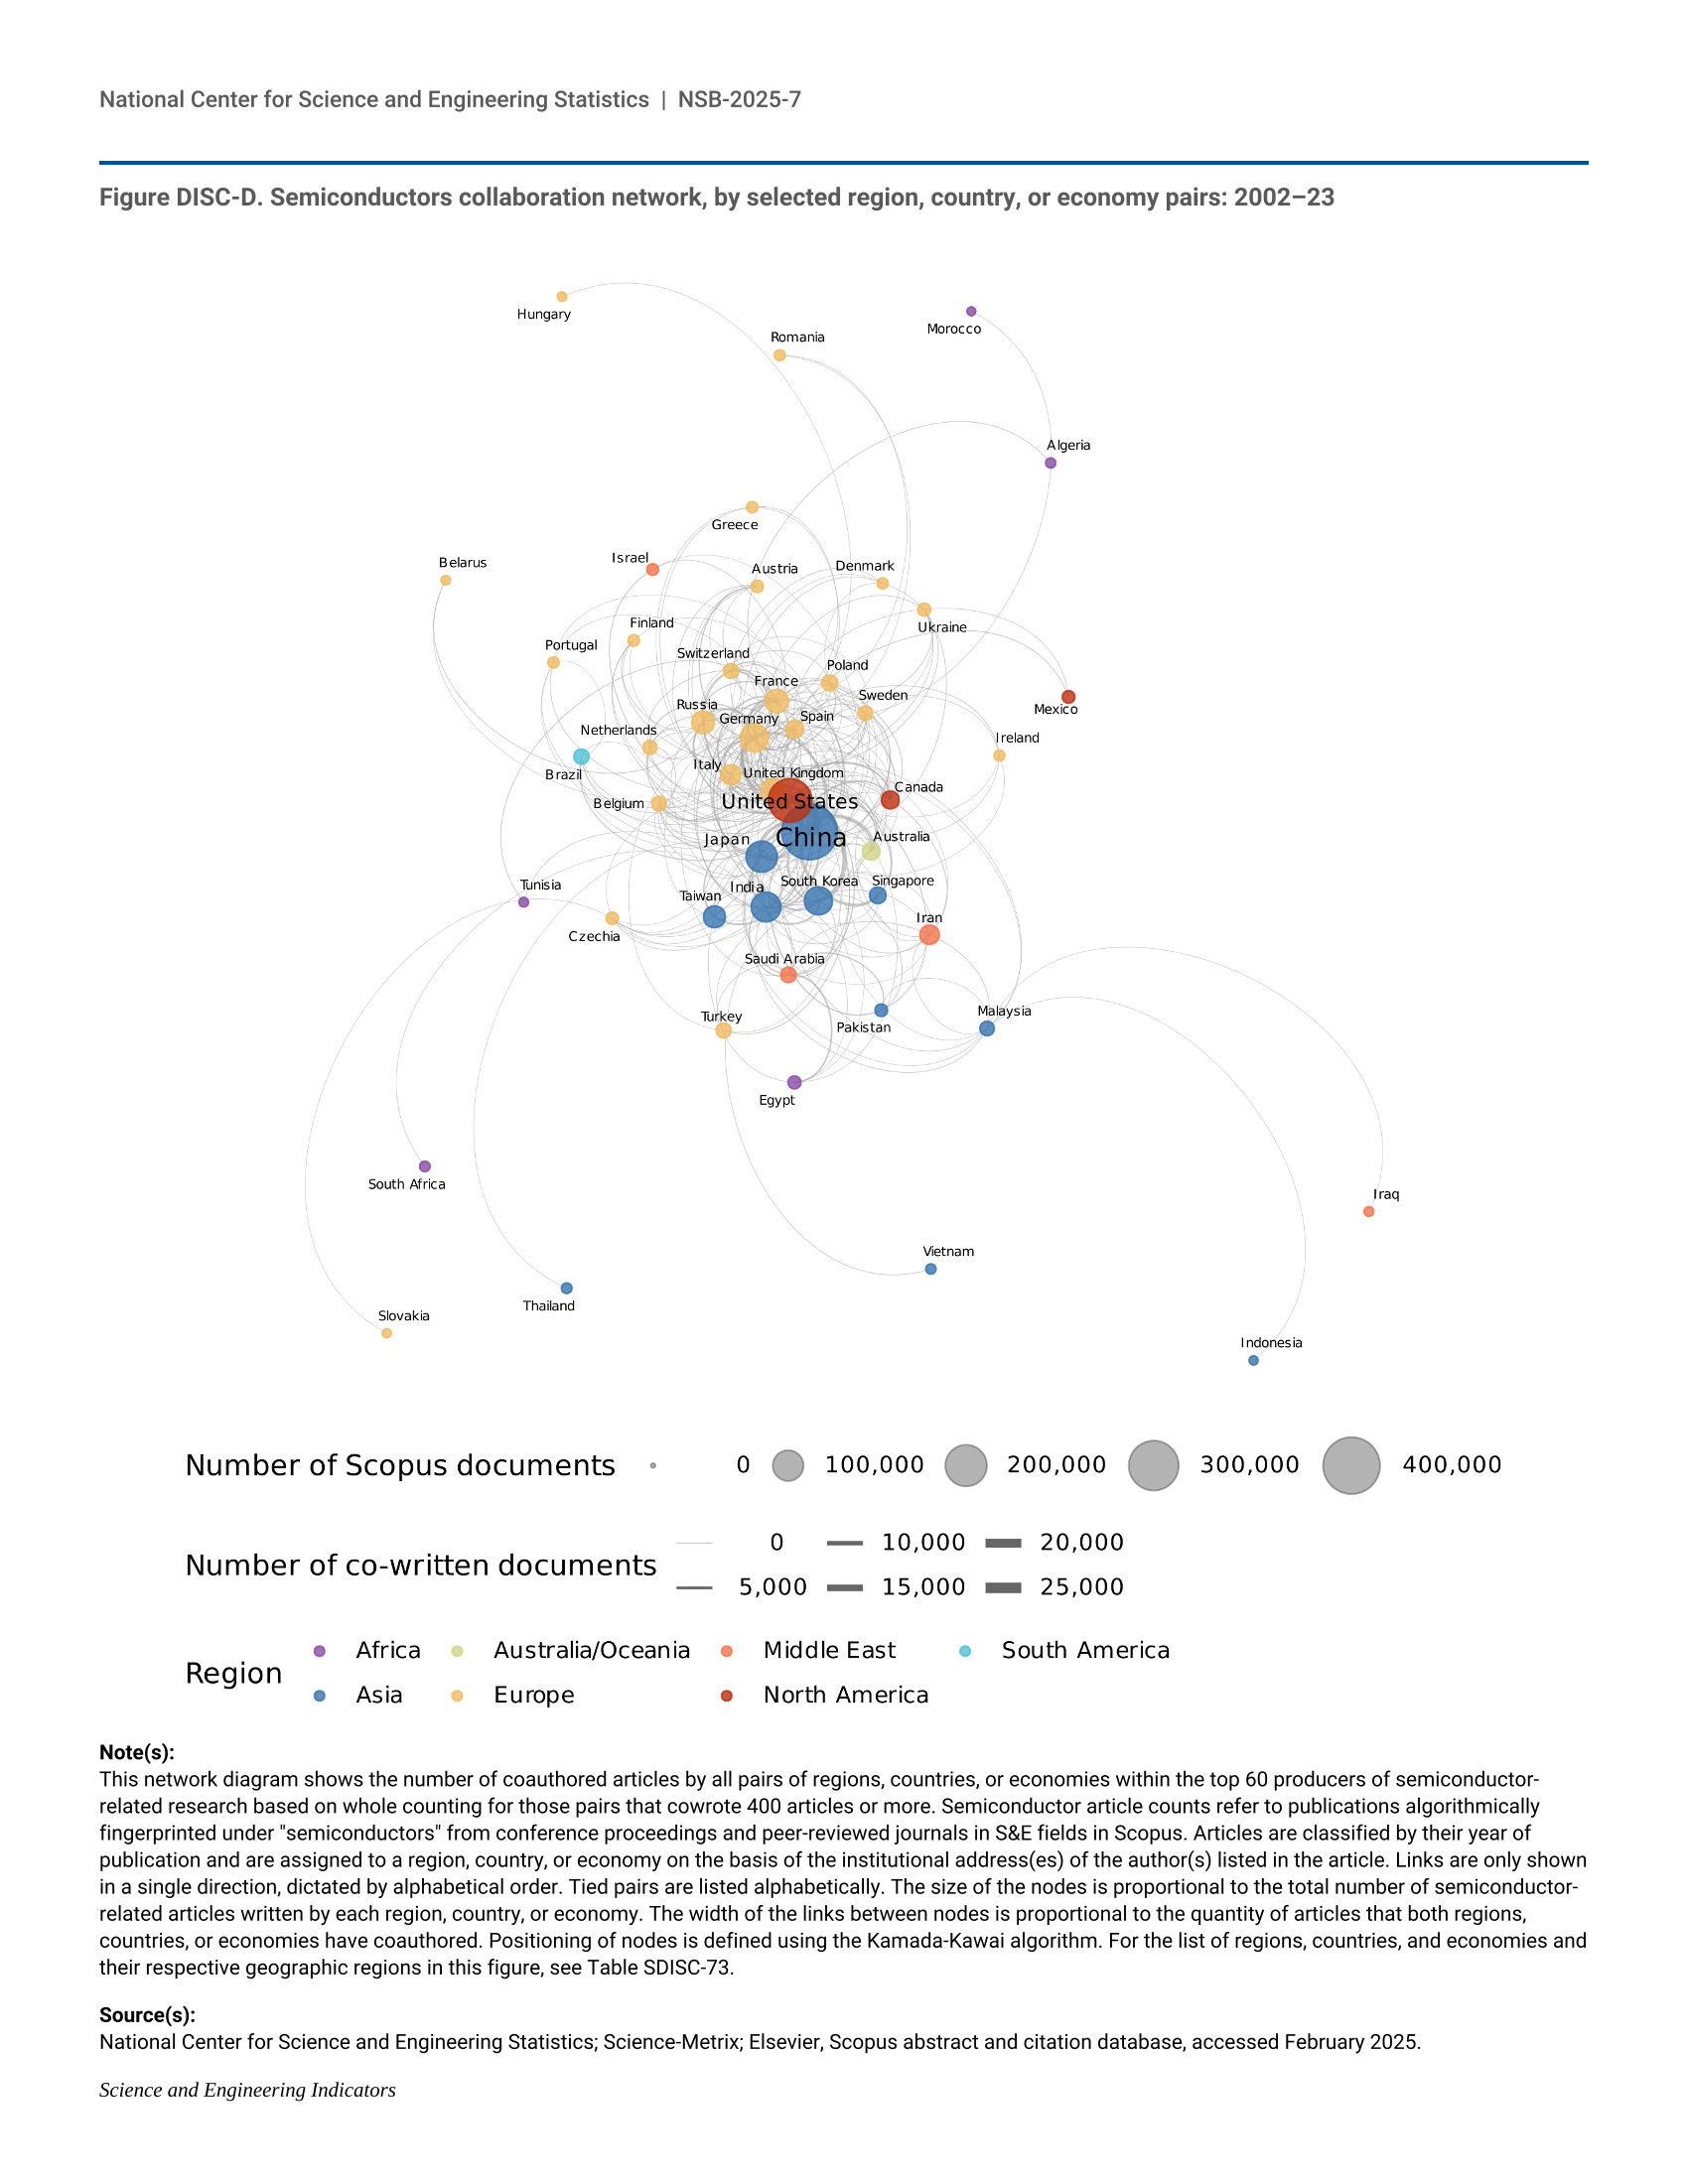
Figure DISC-D.
Semiconductors collaboration network, by selected region, country, or economy pairs: 2002–23
Semiconductors collaboration network, by selected region, country, or economy pairs: 2002–23
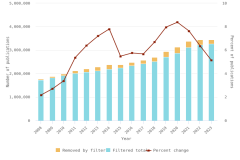
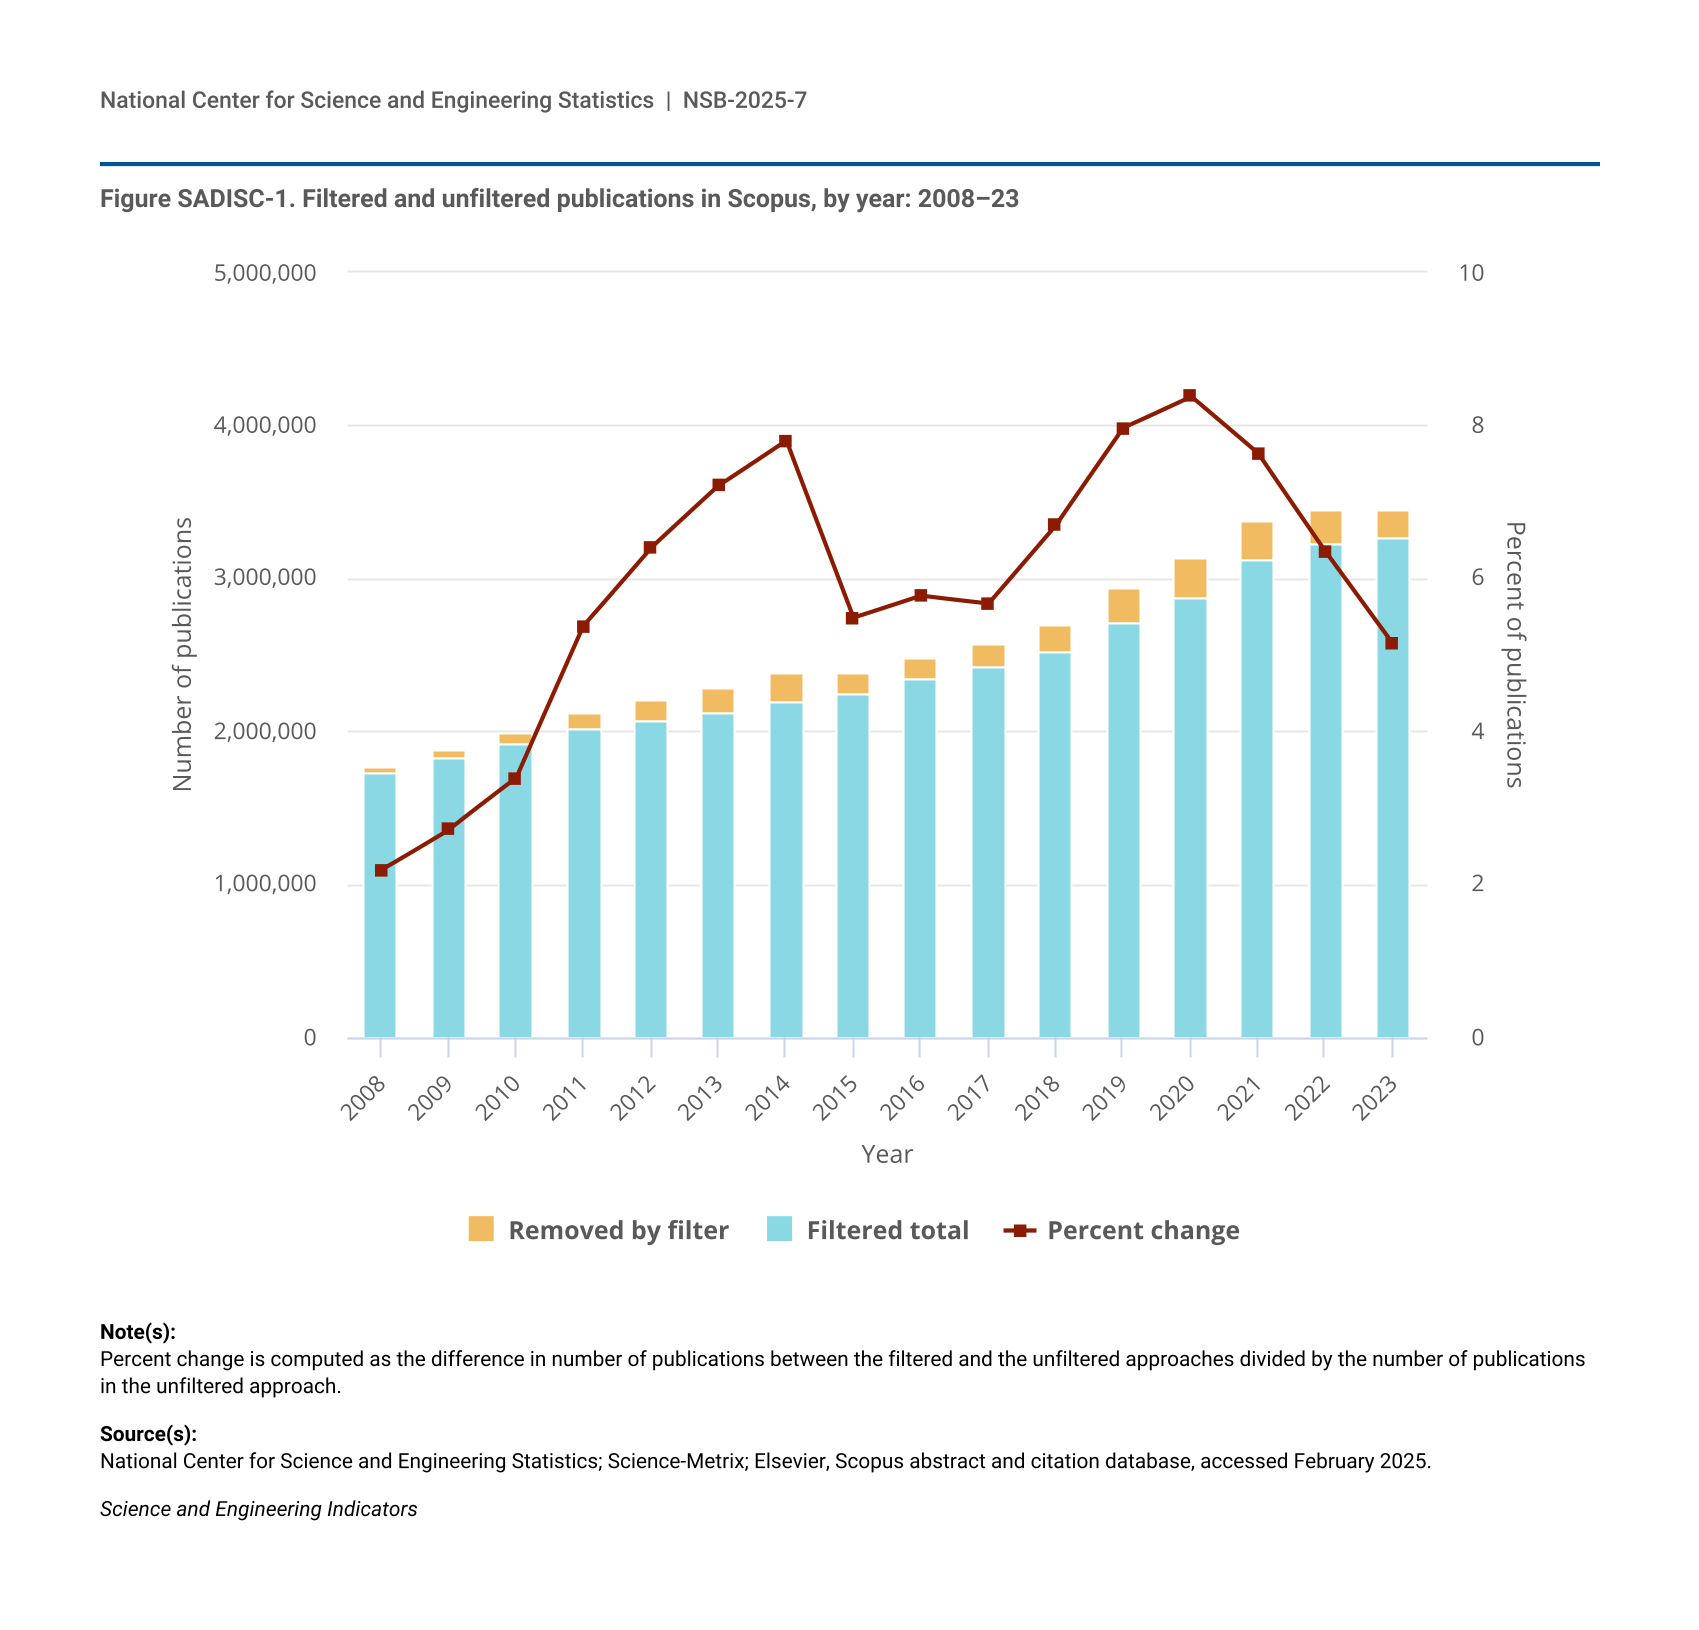
Figure SADISC-1.
Filtered and unfiltered publications in Scopus, by year: 2008–23
Filtered and unfiltered publications in Scopus, by year: 2008–23
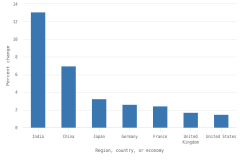
Figure SADISC-2.
Impact of removing low-quality publications from Scopus, by selected region, country, or economy: 2008–23
Impact of removing low-quality publications from Scopus, by selected region, country, or economy: 2008–23
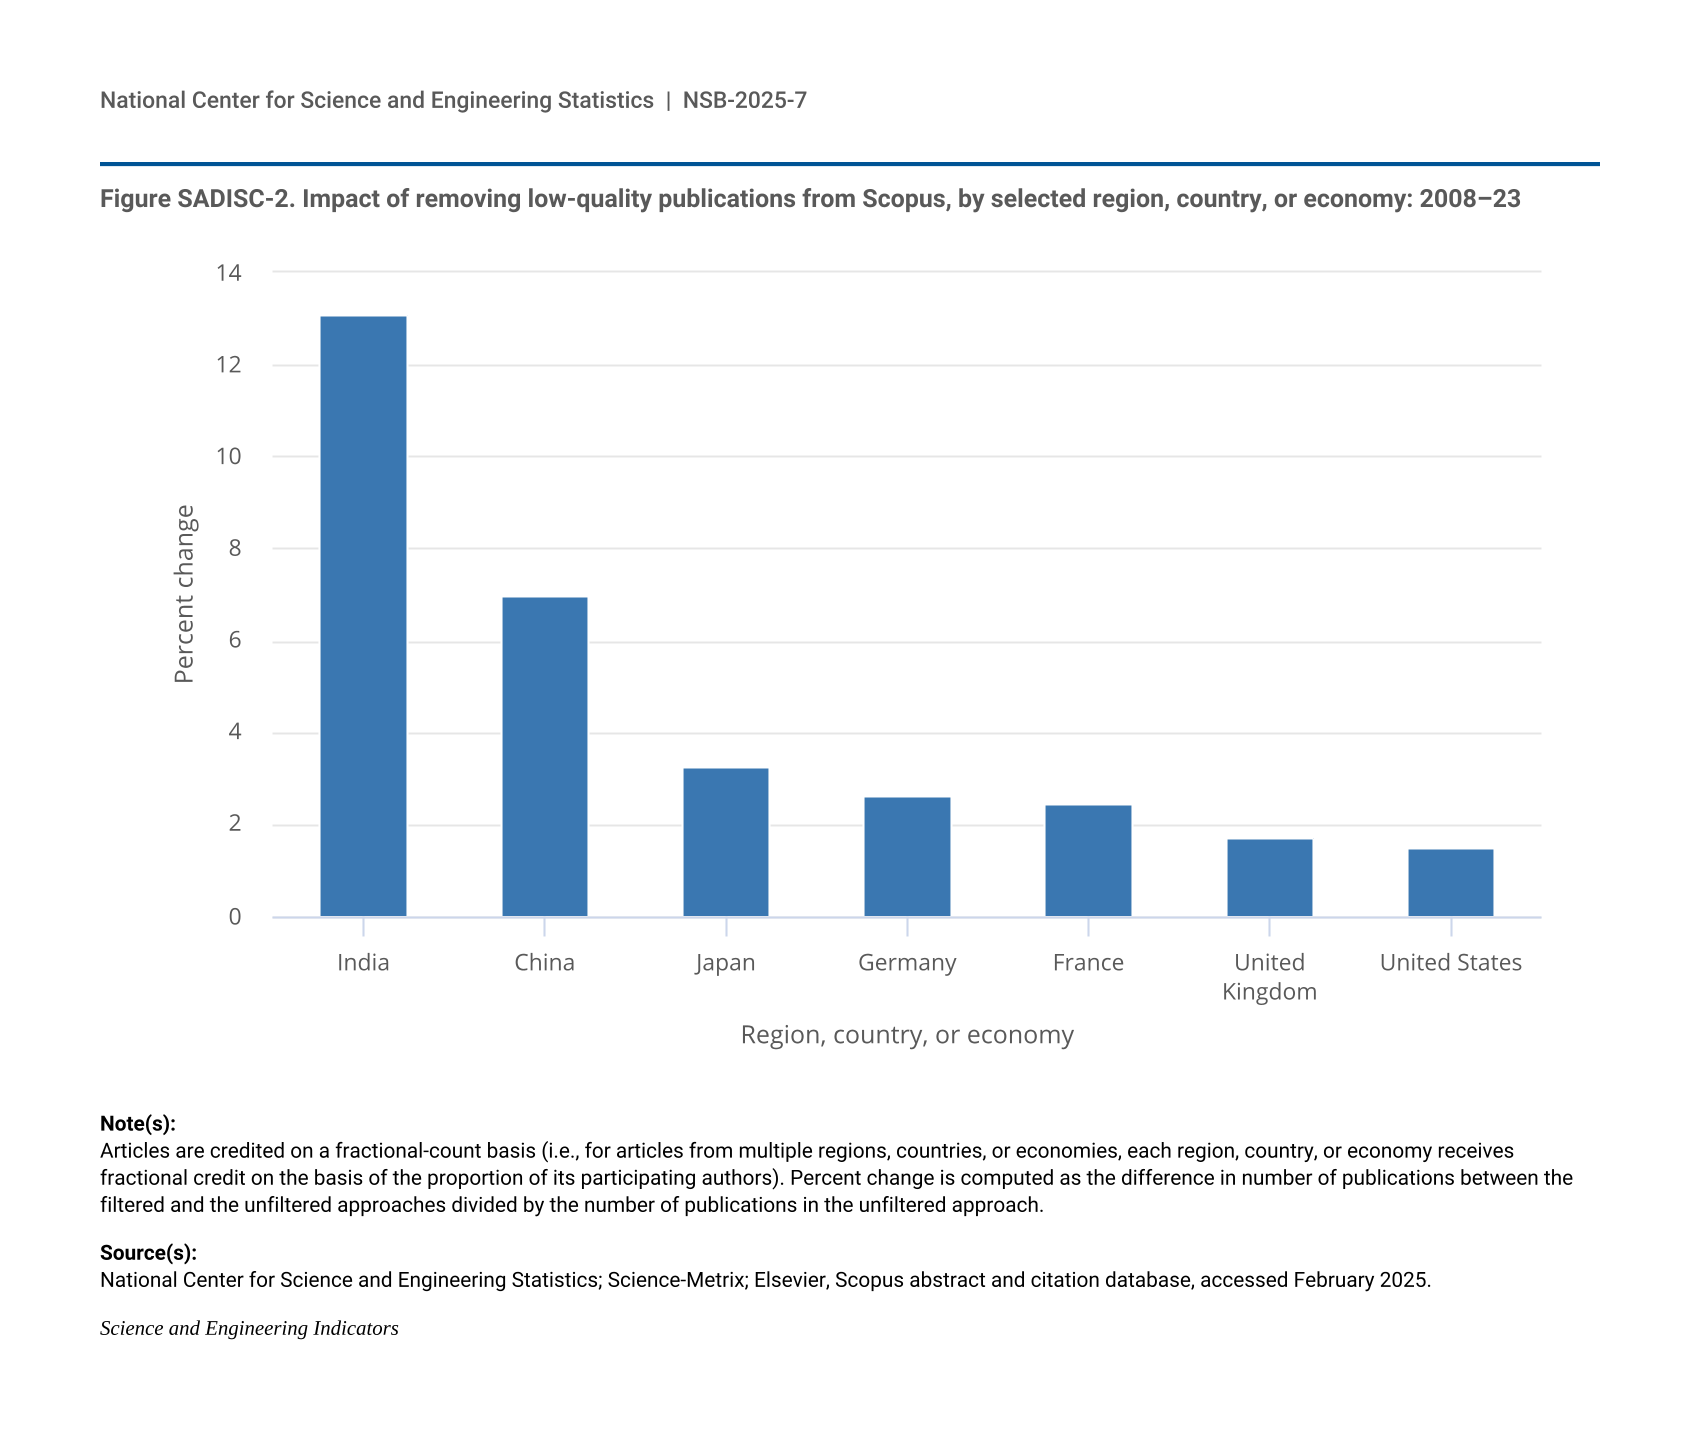
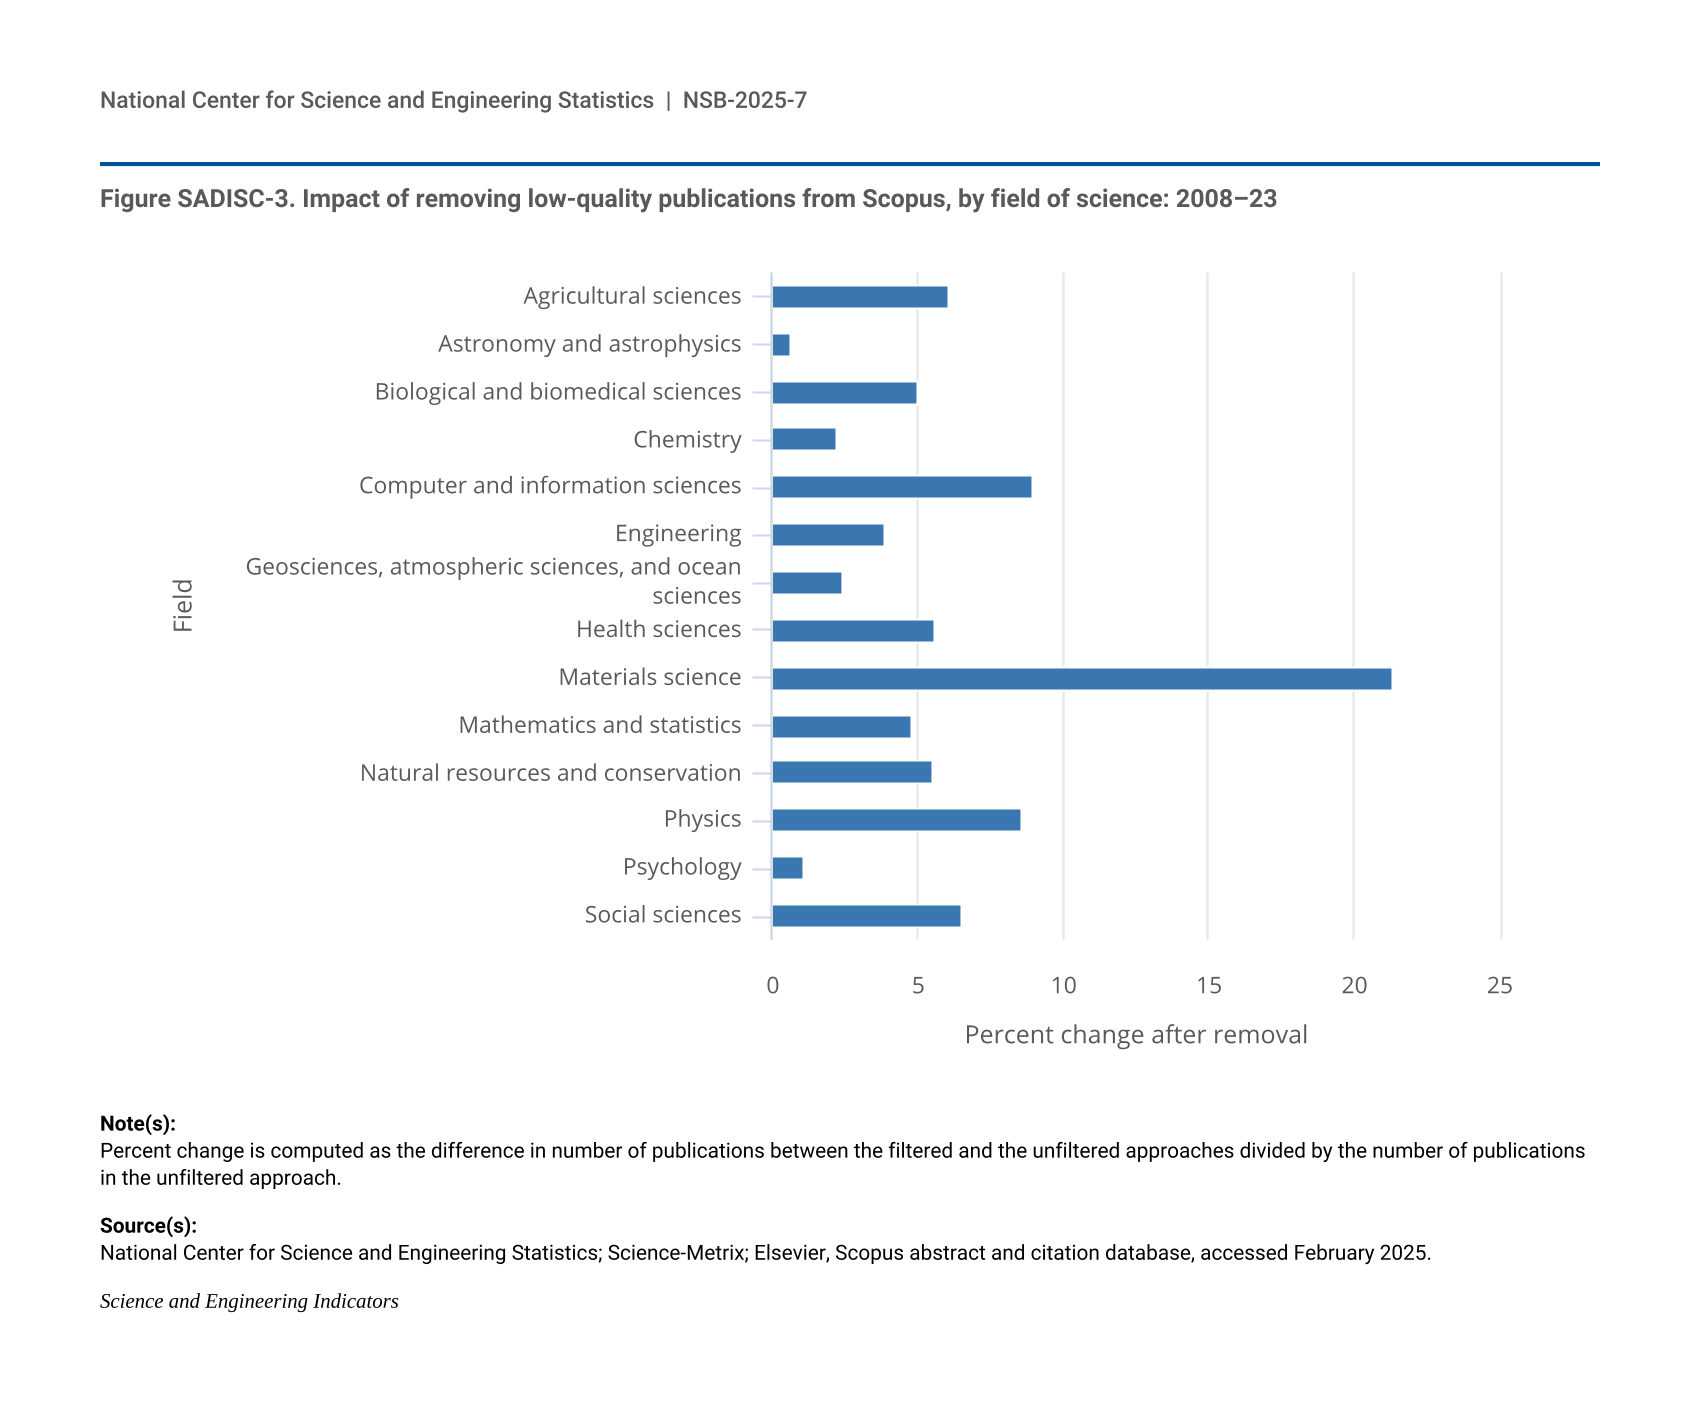
Figure SADISC-3.
Impact of removing low-quality publications from Scopus, by field of science: 2008–23
Impact of removing low-quality publications from Scopus, by field of science: 2008–23
Data Sources
Item
Title
Provider
Product
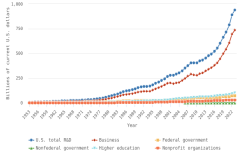
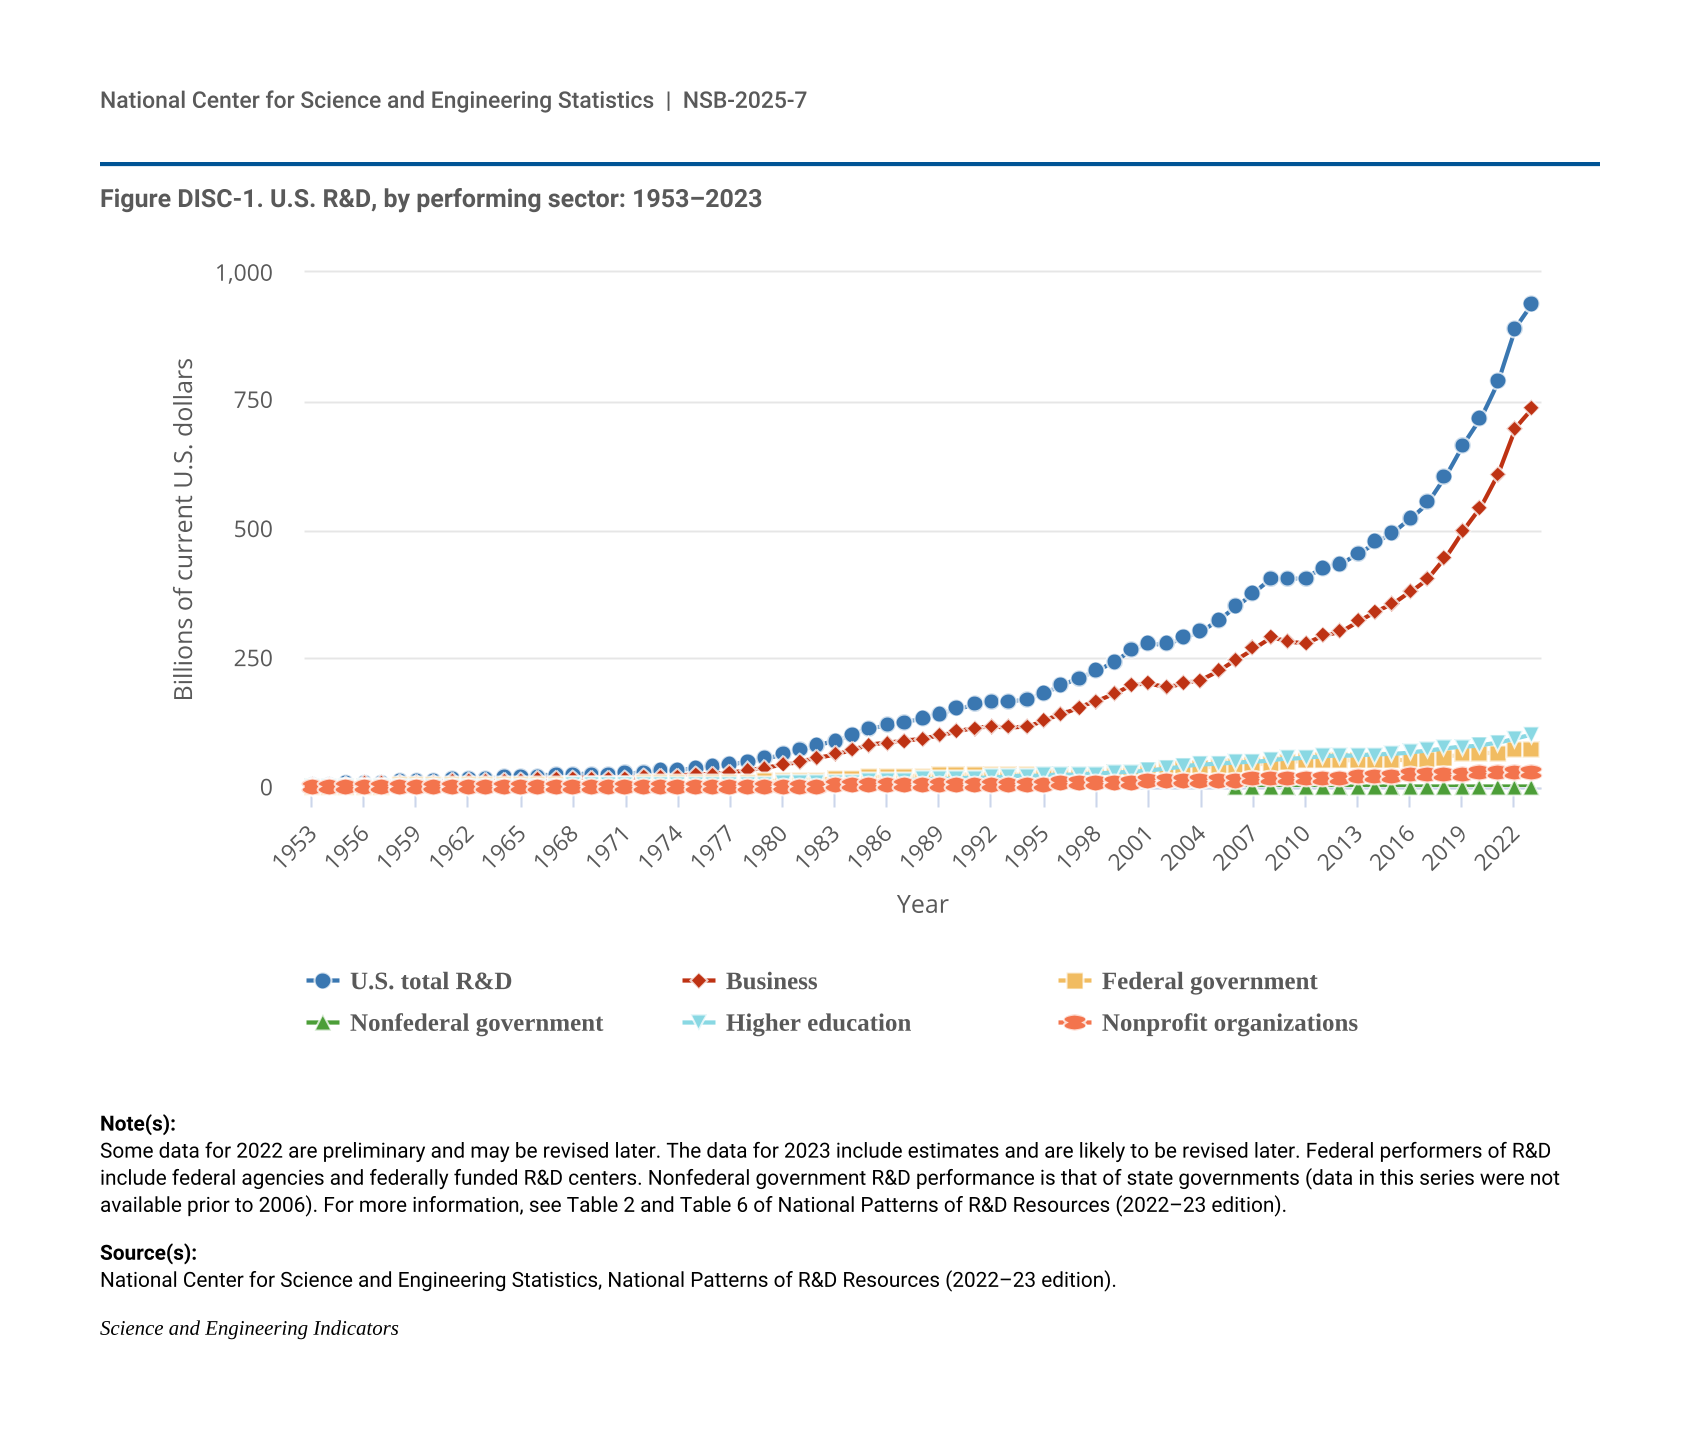
Figure DISC-1
U.S. R&D, by performing sector: 1953–2023
National Center for Science and Engineering Statistics
National Patterns of R&D Resources
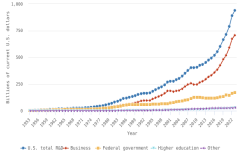
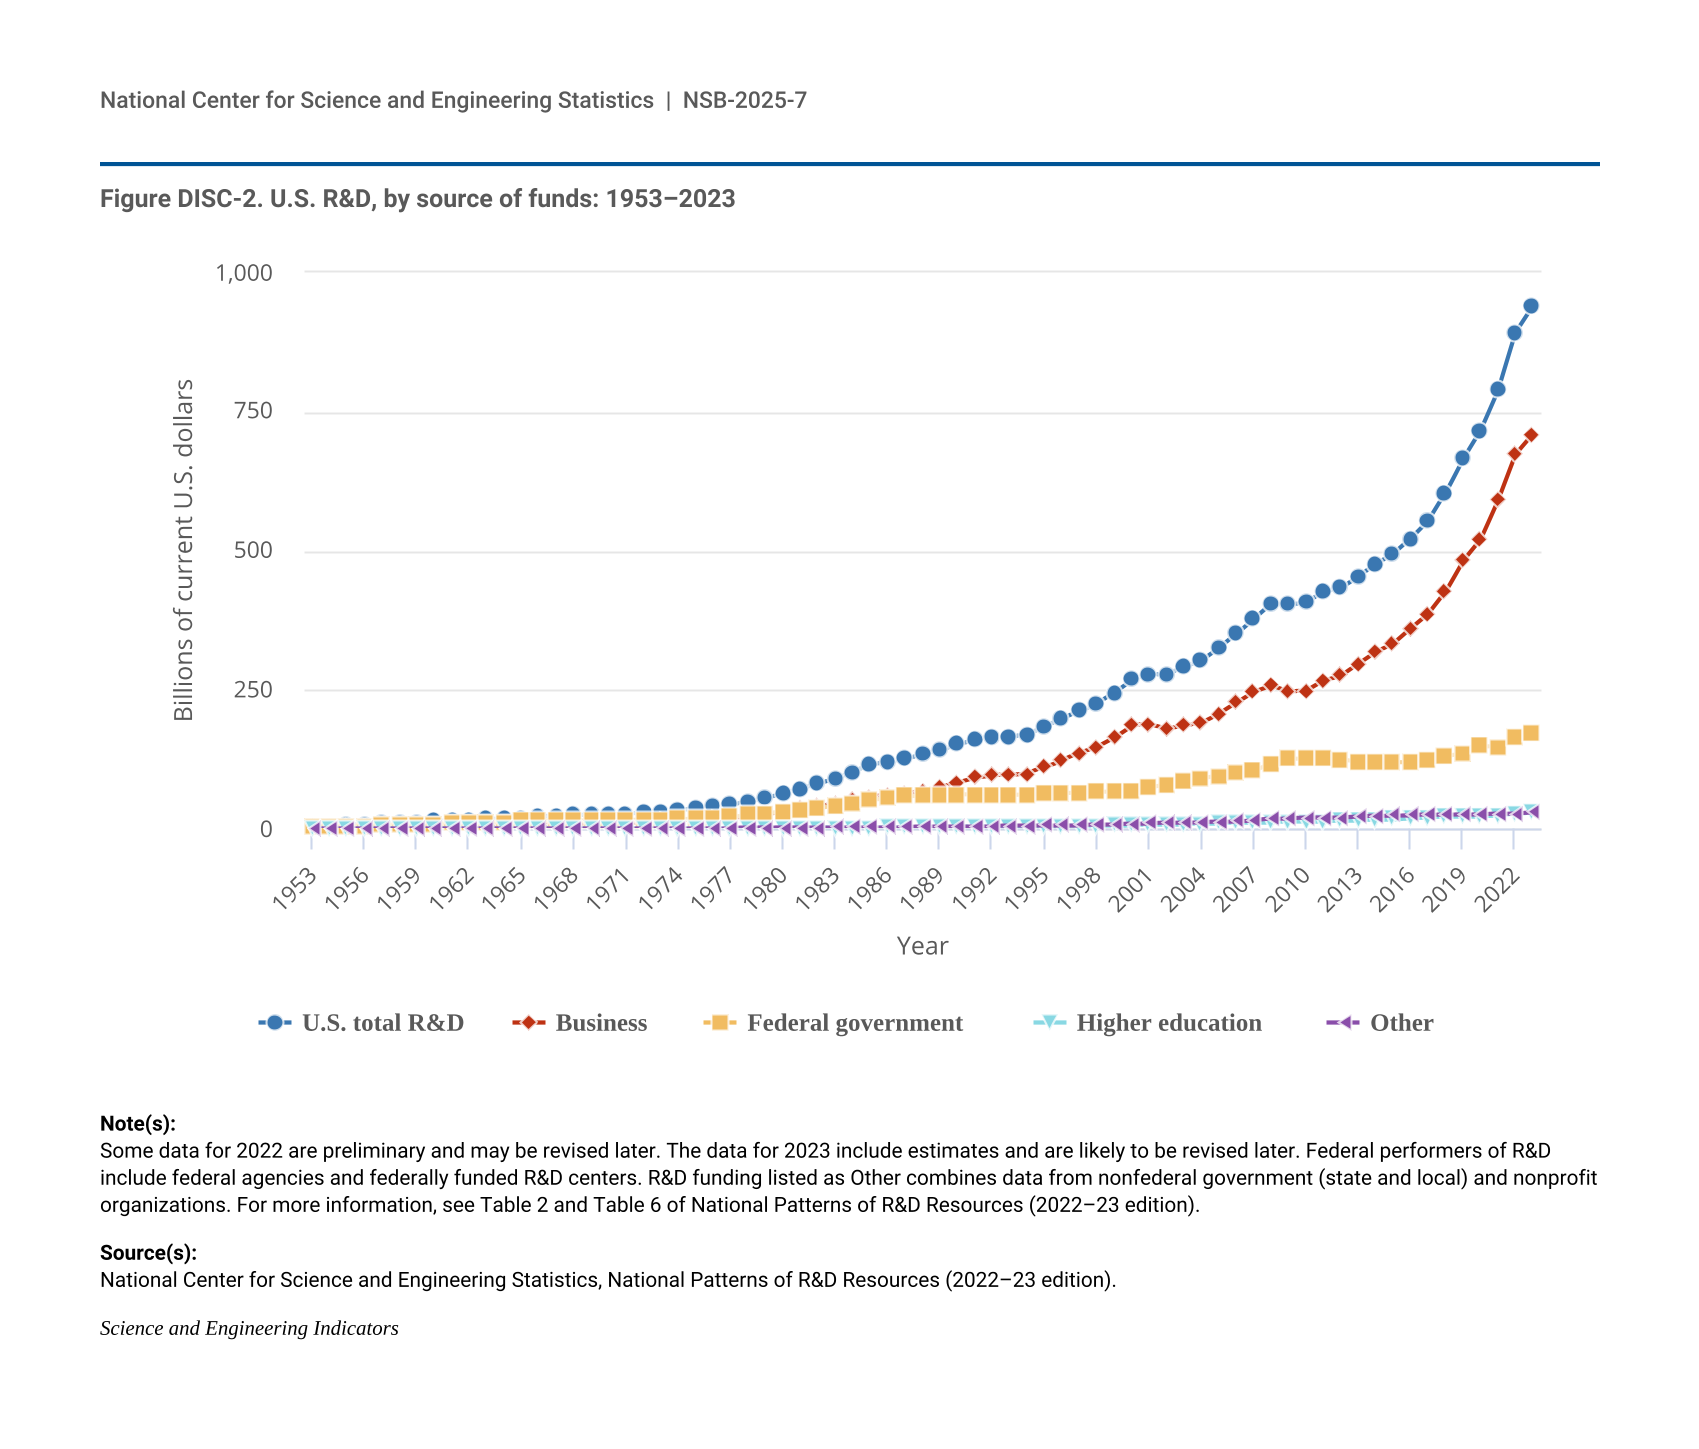
Figure DISC-2
U.S. R&D, by source of funds: 1953–2023
National Center for Science and Engineering Statistics
National Patterns of R&D Resources
Figure DISC-3
Total U.S. R&D expenditures, by performer sector, with long- and short-term growth rates: 1993‒2023
National Center for Science and Engineering Statistics
National Patterns of R&D Resources
Figure DISC-4
Ratio of U.S. R&D to GDP, by funding source: 1953–2023
National Center for Science and Engineering Statistics
National Patterns of R&D Resources
Figure DISC-5
U.S. R&D expenditures, shares by performing sector: 1953–2023
National Center for Science and Engineering Statistics
National Patterns of R&D Resources
Figure DISC-6
U.S. R&D, by type and funding source: 2023
National Center for Science and Engineering Statistics
National Patterns of R&D Resources
Figure DISC-7
U.S. R&D expenditures, shares by funding sector: 1953–2023
National Center for Science and Engineering Statistics
National Patterns of R&D Resources
Figure DISC-8
Total U.S. R&D expenditures, by source of funds, with long- and short-term growth rates: 1993‒2023
National Center for Science and Engineering Statistics
National Patterns of R&D Resources
Figure DISC-9
Industry share of U.S. business R&D, by top R&D-performing industries: 2019–22
National Center for Science and Engineering Statistics
Business Enterprise Research and Development Survey
Figure DISC-10
Academic R&D expenditures, by source of funds: FYs 1953–2023
National Center for Science and Engineering Statistics
Higher Education Research and Development Survey
Figure DISC-11
Federal and nonfederal funding of academic basic research: FYs 1979–2023
National Center for Science and Engineering Statistics
Higher Education Research and Development Survey
Figure DISC-12
Federal and nonfederal funding of academic experimental development and applied research: FYs 2010–23
National Center for Science and Engineering Statistics
Higher Education Research and Development Survey
Figure DISC-13
Academic R&D spending, by field: FYs 2013, 2018, and 2023
National Center for Science and Engineering Statistics
Higher Education Research and Development Survey
Figure DISC-14
Federally and nonfederally funded academic R&D spending, by field: FYs 2013, 2018, and 2023
National Center for Science and Engineering Statistics
Higher Education Research and Development Survey
Figure DISC-15
Federally financed academic R&D expenditures, by agency and field: FY 2023
National Center for Science and Engineering Statistics
Higher Education Research and Development Survey
Figure DISC-16
Federal obligations for research, by agency and major S&E field: FY 2023
National Center for Science and Engineering Statistics
Survey of Federal Funds for Research and Development
Figure DISC-17
GERD and GERD-to-GDP ratio, by selected region, country, or economy: 2022 or most recent year
National Center for Science and Engineering Statistics
National Patterns of R&D Resources
Figure DISC-17
GERD and GERD-to-GDP ratio, by selected region, country, or economy: 2022 or most recent year
Organisation for Economic Co-operation and Development
Main Science and Technology Indicators
Figure DISC-18
Gross domestic expenditures on R&D, by selected region, country, or economy: 2000–22
National Center for Science and Engineering Statistics
National Patterns of R&D Resources
Figure DISC-18
Gross domestic expenditures on R&D, by selected region, country, or economy: 2000–22
Organisation for Economic Co-operation and Development
Main Science and Technology Indicators
Figure DISC-19
Share of global GERD, by selected region, country, or economy: 2000, 2010, and 2022
National Center for Science and Engineering Statistics
National Patterns of R&D Resources
Figure DISC-19
Share of global GERD, by selected region, country, or economy: 2000, 2010, and 2022
Organisation for Economic Co-operation and Development
Main Science and Technology Indicators
Figure DISC-20
GERD as a share of GDP, by selected region, country, or economy: 1990–2022
National Center for Science and Engineering Statistics
National Patterns of R&D Resources
Figure DISC-20
GERD as a share of GDP, by selected region, country, or economy: 1990–2022
Organisation for Economic Co-operation and Development
Main Science and Technology Indicators
Figure DISC-21
Share of total R&D expenditures, by selected industry and selected region, country, or economy: 2021
Organisation for Economic Co-operation and Development
Analytical Business Enterprise Resarch and Development (ANBERD) Database
Figure DISC-22
S&E publications, by selected region, country, or economy and rest of world: 2002–23
Elsevier
Scopus
Figure DISC-23
Distribution of national S&E research portfolios across S&E fields, by selected region, country, or economy: 2023
Elsevier
Scopus
Figure DISC-25
U.S. business sector publications coauthored with academic, government, and foreign institutions: 2008 and 2023
Elsevier
Scopus
Figure DISC-26
S&E publications in the top 1% most-cited journal articles as a share of all S&E journal articles, by selected region, country, or economy: 2006–22
Elsevier
Scopus
Figure DISC-27
S&E publications in the top 1% most-cited journal articles as a share of all journal articles for selected S&E fields, by selected region, country, or economy: 2022
Elsevier
Scopus
Figure DISC-27
S&E publications in the top 1% most-cited journal articles as a share of all journal articles for selected S&E fields, by selected region, country, or economy: 2022
World Bank
World Bank Country and Lending Groups
Figure DISC-28
International coauthorship of S&E publications for the 15 largest producing regions, countries, or economies of S&E publications: 2023
Elsevier
Scopus
Figure DISC-29
Selected leading regions, countries, or economies with publications with international coauthors: 2002–23
Elsevier
Scopus
Figure DISC-30
U.S. international S&E publications with coauthor(s) from the United Kingdom and Asian countries: Selected years, 2003–23
Elsevier
Scopus
Figure DISC-A
Domestic business R&D paid for by the company and others and performed by the company in the biotechnology focus area, by selected industry: 2018–22
National Center for Science and Engineering Statistics
Business Enterprise Research and Development Survey
Figure DISC-B
Biotechnology-related S&E articles, by selected region, country, or economy and rest of world: 2002–23
Elsevier
Scopus
Figure DISC-C
Semiconductor-related S&E articles, by selected region, country, or economy and rest of world: 2002–23
Elsevier
Scopus
Figure DISC-D
Semiconductors collaboration network, by selected region, country, or economy pairs: 2002–23
Elsevier
Scopus
Figure SADISC-2
Impact of removing low-quality publications from Scopus, by selected region, country, or economy: 2008–23
Elsevier
Scopus
Figure SADISC-3
Impact of removing low-quality publications from Scopus, by field of science: 2008–23
Elsevier
Scopus
Table DISC-1
U.S. R&D expenditures, by performing sector and source of funds: 2010–23
National Center for Science and Engineering Statistics
National Patterns of R&D Resources
Table DISC-2
U.S. R&D expenditures, by type of R&D: Selected years, 2000–23
National Center for Science and Engineering Statistics
National Patterns of R&D Resources
Table DISC-3
Domestic net sales, R&D, and R&D-to-sales ratio for companies that performed or funded U.S. business R&D, by selected industry: 2022
National Center for Science and Engineering Statistics
Business Enterprise Research and Development Survey
Table DISC-4
U.S. business R&D performance, by source of funds: 2022
National Center for Science and Engineering Statistics
Business Enterprise Research and Development Survey
Table DISC-5
U.S. business R&D performed, by industry and select technology focus: 2022
National Center for Science and Engineering Statistics
Business Enterprise Research and Development Survey
Table DISC-6
Federal agency support of academic R&D spending: FYs 2013, 2018, 2022, and 2023
National Center for Science and Engineering Statistics
Higher Education Research and Development Survey
Table DISC-7
Federal obligations for R&D and R&D plant, by agency: FYs 2008–24
National Center for Science and Engineering Statistics
Survey of Federal Funds for Research and Development
Table DISC-8
Federal obligations for R&D and R&D plant, by agency and performer: FY 2023
National Center for Science and Engineering Statistics
Survey of Federal Funds for Research and Development
Table DISC-9
Federal obligations for R&D, by agency and type of R&D: FY 2023
National Center for Science and Engineering Statistics
Survey of Federal Funds for Research and Development
Table DISC-12
S&E publications in all fields for the 15 largest producing regions, countries, or economies: 2013 and 2023
Elsevier
Scopus
Table SDISC-1
Federal and nonfederal funding of academic basic research: FYs 1979–2023
National Center for Science and Engineering Statistics
Higher Education Research and Development Survey
Table SDISC-2
Higher education R&D expenditures, by R&D field: FYs 2010–23
National Center for Science and Engineering Statistics
Higher Education Research and Development Survey
Table SDISC-3
GERD, GDP, GERD-to-GDP ratio, and growth rates, by selected region, country, or economy: Selected years, 1990–2022
National Center for Science and Engineering Statistics
National Patterns of R&D Resources
Table SDISC-3
GERD, GDP, GERD-to-GDP ratio, and growth rates, by selected region, country, or economy: Selected years, 1990–2022
Organisation for Economic Co-operation and Development
Main Science and Technology Indicators
Table SDISC-4
GERD for selected region, country, or economy, by performing sector and source of funds: 2022 or most recent year
National Center for Science and Engineering Statistics
National Patterns of R&D Resources
Table SDISC-4
GERD for selected region, country, or economy, by performing sector and source of funds: 2022 or most recent year
Organisation for Economic Co-operation and Development
Main Science and Technology Indicators
Table SDISC-5
Regions, countries, and economies in S&E publications data
World Bank
World Bank Country and Lending Groups
Table SDISC-6
S&E articles in all S&E fields, fractional count, by region, country, or economy: 2002–23
Elsevier
Scopus
Table SDISC-6
S&E articles in all S&E fields, fractional count, by region, country, or economy: 2002–23
World Bank
World Bank Country and Lending Groups
Table SDISC-7
S&E articles in agricultural sciences, fractional count, by region, country, or economy: 2002–23
Elsevier
Scopus
Table SDISC-8
S&E articles in astronomy and astrophysics, fractional count, by region, country, or economy: 2002–23
Elsevier
Scopus
Table SDISC-9
S&E articles in biological and biomedical sciences, fractional count, by region, country, or economy: 2002–23
Elsevier
Scopus
Table SDISC-10
S&E articles in chemistry, fractional count, by region, country, or economy: 2002–23
Elsevier
Scopus
Table SDISC-11
S&E articles in computer and information sciences, fractional count, by region, country, or economy: 2002–23
Elsevier
Scopus
Table SDISC-12
S&E articles in engineering, fractional count, by region, country, or economy: 2002–23
Elsevier
Scopus
Table SDISC-13
S&E articles in geosciences, atmospheric sciences, and ocean sciences, fractional count, by region, country, or economy: 2002–23
Elsevier
Scopus
Table SDISC-14
S&E articles in health sciences, fractional count, by region, country, or economy: 2002–23
Elsevier
Scopus
Table SDISC-15
S&E articles in materials science, fractional count, by region, country, or economy: 2002–23
Elsevier
Scopus
Table SDISC-16
S&E articles in mathematics and statistics, fractional count, by region, country, or economy: 2002–23
Elsevier
Scopus
Table SDISC-17
S&E articles in natural resources and conservation, fractional count, by region, country, or economy: 2002–23
Elsevier
Scopus
Table SDISC-18
S&E articles in physics, fractional count, by region, country, or economy: 2002–23
Elsevier
Scopus
Table SDISC-19
S&E articles in psychology, fractional count, by region, country, or economy: 2002–23
Elsevier
Scopus
Table SDISC-20
S&E articles in social sciences, fractional count, by region, country, or economy: 2002–23
Elsevier
Scopus
Table SDISC-21
S&E articles in all S&E fields, whole count, by region, country, or economy: 2002–23
Elsevier
Scopus
Table SDISC-21
S&E articles in all S&E fields, whole count, by region, country, or economy: 2002–23
World Bank
World Bank Country and Lending Groups
Table SDISC-22
S&E articles in agricultural sciences, whole count, by region, country, or economy: 2002–23
Elsevier
Scopus
Table SDISC-22
S&E articles in agricultural sciences, whole count, by region, country, or economy: 2002–23
World Bank
World Bank Country and Lending Groups
Table SDISC-23
S&E articles in astronomy and astrophysics, whole count, by region, country, or economy: 2002–23
Elsevier
Scopus
Table SDISC-23
S&E articles in astronomy and astrophysics, whole count, by region, country, or economy: 2002–23
World Bank
World Bank Country and Lending Groups
Table SDISC-24
S&E articles in biological and biomedical sciences, whole count, by region, country, or economy: 2002–23
Elsevier
Scopus
Table SDISC-24
S&E articles in biological and biomedical sciences, whole count, by region, country, or economy: 2002–23
World Bank
World Bank Country and Lending Groups
Table SDISC-25
S&E articles in chemistry, whole count, by region, country, or economy: 2002–23
Elsevier
Scopus
Table SDISC-25
S&E articles in chemistry, whole count, by region, country, or economy: 2002–23
World Bank
World Bank Country and Lending Groups
Table SDISC-26
S&E articles in computer and information sciences, whole count, by region, country, or economy: 2002–23
Elsevier
Scopus
Table SDISC-26
S&E articles in computer and information sciences, whole count, by region, country, or economy: 2002–23
World Bank
World Bank Country and Lending Groups
Table SDISC-27
S&E articles in engineering, whole count, by region, country, or economy: 2002–23
Elsevier
Scopus
Table SDISC-27
S&E articles in engineering, whole count, by region, country, or economy: 2002–23
World Bank
World Bank Country and Lending Groups
Table SDISC-28
S&E articles in geosciences, atmospheric sciences, and ocean sciences, whole count, by region, country, or economy: 2002–23
Elsevier
Scopus
Table SDISC-28
S&E articles in geosciences, atmospheric sciences, and ocean sciences, whole count, by region, country, or economy: 2002–23
World Bank
World Bank Country and Lending Groups
Table SDISC-29
S&E articles in health sciences, whole count, by region, country, or economy: 2002–23
Elsevier
Scopus
Table SDISC-29
S&E articles in health sciences, whole count, by region, country, or economy: 2002–23
World Bank
World Bank Country and Lending Groups
Table SDISC-30
S&E articles in materials science, whole count, by region, country, or economy: 2002–23
Elsevier
Scopus
Table SDISC-30
S&E articles in materials science, whole count, by region, country, or economy: 2002–23
World Bank
World Bank Country and Lending Groups
Table SDISC-31
S&E articles in mathematics and statistics, whole count, by region, country, or economy: 2002–23
Elsevier
Scopus
Table SDISC-31
S&E articles in mathematics and statistics, whole count, by region, country, or economy: 2002–23
World Bank
World Bank Country and Lending Groups
Table SDISC-32
S&E articles in natural resources and conservation, whole count, by region, country, or economy: 2002–23
Elsevier
Scopus
Table SDISC-32
S&E articles in natural resources and conservation, whole count, by region, country, or economy: 2002–23
World Bank
World Bank Country and Lending Groups
Table SDISC-33
S&E articles in physics, whole count, by region, country, or economy: 2002–23
Elsevier
Scopus
Table SDISC-33
S&E articles in physics, whole count, by region, country, or economy: 2002–23
World Bank
World Bank Country and Lending Groups
Table SDISC-34
S&E articles in psychology, whole count, by region, country, or economy: 2002–23
Elsevier
Scopus
Table SDISC-34
S&E articles in psychology, whole count, by region, country, or economy: 2002–23
World Bank
World Bank Country and Lending Groups
Table SDISC-35
S&E articles in social sciences, whole count, by region, country, or economy: 2002–23
Elsevier
Scopus
Table SDISC-35
S&E articles in social sciences, whole count, by region, country, or economy: 2002–23
World Bank
World Bank Country and Lending Groups
Table SDISC-36
S&E research portfolios of selected region, country, or economy, by field: 2023
Elsevier
Scopus
Table SDISC-37
Share of S&E publications in the top 1% most-cited journal articles in the Scopus database, fractional count, by region, country, or economy: 2002–22
Elsevier
Scopus
Table SDISC-37
Share of S&E publications in the top 1% most-cited journal articles in the Scopus database, fractional count, by region, country, or economy: 2002–22
World Bank
World Bank Country and Lending Groups
Table SDISC-38
Share of S&E publications in the top 1% most-cited journal articles in agricultural sciences, fractional count, by region, country, or economy: 2002–22
Elsevier
Scopus
Table SDISC-38
Share of S&E publications in the top 1% most-cited journal articles in agricultural sciences, fractional count, by region, country, or economy: 2002–22
World Bank
World Bank Country and Lending Groups
Table SDISC-39
Share of S&E publications in the top 1% most-cited journal articles in astronomy and astrophysics, fractional count, by region, country, or economy: 2002–22
Elsevier
Scopus
Table SDISC-39
Share of S&E publications in the top 1% most-cited journal articles in astronomy and astrophysics, fractional count, by region, country, or economy: 2002–22
World Bank
World Bank Country and Lending Groups
Table SDISC-40
Share of S&E publications in the top 1% most-cited journal articles in biological and biomedical sciences, fractional count, by region, country, or economy: 2002–22
Elsevier
Scopus
Table SDISC-40
Share of S&E publications in the top 1% most-cited journal articles in biological and biomedical sciences, fractional count, by region, country, or economy: 2002–22
World Bank
World Bank Country and Lending Groups
Table SDISC-41
Share of S&E publications in the top 1% most-cited journal articles in chemistry, fractional count, by region, country, or economy: 2002–22
Elsevier
Scopus
Table SDISC-41
Share of S&E publications in the top 1% most-cited journal articles in chemistry, fractional count, by region, country, or economy: 2002–22
World Bank
World Bank Country and Lending Groups
Table SDISC-42
Share of S&E publications in the top 1% most-cited journal articles in computer and information sciences, fractional count, by region, country, or economy: 2002–22
Elsevier
Scopus
Table SDISC-42
Share of S&E publications in the top 1% most-cited journal articles in computer and information sciences, fractional count, by region, country, or economy: 2002–22
World Bank
World Bank Country and Lending Groups
Table SDISC-43
Share of S&E publications in the top 1% most-cited journal articles in engineering, fractional count, by region, country, or economy: 2002–22
Elsevier
Scopus
Table SDISC-43
Share of S&E publications in the top 1% most-cited journal articles in engineering, fractional count, by region, country, or economy: 2002–22
World Bank
World Bank Country and Lending Groups
Table SDISC-44
Share of S&E publications in the top 1% most-cited journal articles in geosciences, atmospheric sciences, and ocean sciences, fractional count, by region, country, or economy: 2002–22
Elsevier
Scopus
Table SDISC-44
Share of S&E publications in the top 1% most-cited journal articles in geosciences, atmospheric sciences, and ocean sciences, fractional count, by region, country, or economy: 2002–22
World Bank
World Bank Country and Lending Groups
Table SDISC-45
Share of S&E publications in the top 1% most-cited journal articles in health sciences, fractional count, by region, country, or economy: 2002–22
Elsevier
Scopus
Table SDISC-45
Share of S&E publications in the top 1% most-cited journal articles in health sciences, fractional count, by region, country, or economy: 2002–22
World Bank
World Bank Country and Lending Groups
Table SDISC-46
Share of S&E publications in the top 1% most-cited journal articles in materials science, fractional count, by region, country, or economy: 2002–22
Elsevier
Scopus
Table SDISC-46
Share of S&E publications in the top 1% most-cited journal articles in materials science, fractional count, by region, country, or economy: 2002–22
World Bank
World Bank Country and Lending Groups
Table SDISC-47
Share of S&E publications in the top 1% most-cited journal articles in mathematics and statistics, fractional count, by region, country, or economy: 2002–22
Elsevier
Scopus
Table SDISC-47
Share of S&E publications in the top 1% most-cited journal articles in mathematics and statistics, fractional count, by region, country, or economy: 2002–22
World Bank
World Bank Country and Lending Groups
Table SDISC-48
Share of S&E publications in the top 1% most-cited journal articles in natural resources and conservation, fractional count, by region, country, or economy: 2002–22
Elsevier
Scopus
Table SDISC-48
Share of S&E publications in the top 1% most-cited journal articles in natural resources and conservation, fractional count, by region, country, or economy: 2002–22
World Bank
World Bank Country and Lending Groups
Table SDISC-49
Share of S&E publications in the top 1% most-cited journal articles in physics, fractional count, by region, country, or economy: 2002–22
Elsevier
Scopus
Table SDISC-49
Share of S&E publications in the top 1% most-cited journal articles in physics, fractional count, by region, country, or economy: 2002–22
World Bank
World Bank Country and Lending Groups
Table SDISC-50
Share of S&E publications in the top 1% most-cited journal articles in psychology, fractional count, by region, country, or economy: 2002–22
Elsevier
Scopus
Table SDISC-50
Share of S&E publications in the top 1% most-cited journal articles in psychology, fractional count, by region, country, or economy: 2002–22
World Bank
World Bank Country and Lending Groups
Table SDISC-51
Share of S&E publications in the top 1% most-cited journal articles in social sciences, fractional count, by region, country, or economy: 2002–22
Elsevier
Scopus
Table SDISC-51
Share of S&E publications in the top 1% most-cited journal articles in social sciences, fractional count, by region, country, or economy: 2002–22
World Bank
World Bank Country and Lending Groups
Table SDISC-52
Share of S&E publications in the top 1% most-cited journal articles and conference proceedings in computer and information sciences, fractional count, by region, country, or economy: 2002–22
Elsevier
Scopus
Table SDISC-52
Share of S&E publications in the top 1% most-cited journal articles and conference proceedings in computer and information sciences, fractional count, by region, country, or economy: 2002–22
World Bank
World Bank Country and Lending Groups
Table SDISC-53
Share of S&E publications in the top 1% most-cited journal articles in the Scopus database, whole count, by region, country, or economy: 2002–22
Elsevier
Scopus
Table SDISC-53
Share of S&E publications in the top 1% most-cited journal articles in the Scopus database, whole count, by region, country, or economy: 2002–22
World Bank
World Bank Country and Lending Groups
Table SDISC-54
Share of S&E publications in the top 1% most-cited journal articles in agricultural sciences, whole count, by region, country, or economy: 2002–22
Elsevier
Scopus
Table SDISC-54
Share of S&E publications in the top 1% most-cited journal articles in agricultural sciences, whole count, by region, country, or economy: 2002–22
World Bank
World Bank Country and Lending Groups
Table SDISC-55
Share of S&E publications in the top 1% most-cited journal articles in astronomy and astrophysics, whole count, by region, country, or economy: 2002–22
Elsevier
Scopus
Table SDISC-55
Share of S&E publications in the top 1% most-cited journal articles in astronomy and astrophysics, whole count, by region, country, or economy: 2002–22
World Bank
World Bank Country and Lending Groups
Table SDISC-56
Share of S&E publications in the top 1% most-cited journal articles in biological and biomedical sciences, whole count, by region, country, or economy: 2002–22
Elsevier
Scopus
Table SDISC-56
Share of S&E publications in the top 1% most-cited journal articles in biological and biomedical sciences, whole count, by region, country, or economy: 2002–22
World Bank
World Bank Country and Lending Groups
Table SDISC-57
Share of S&E publications in the top 1% most-cited journal articles in chemistry, whole count, by region, country, or economy: 2002–22
Elsevier
Scopus
Table SDISC-57
Share of S&E publications in the top 1% most-cited journal articles in chemistry, whole count, by region, country, or economy: 2002–22
World Bank
World Bank Country and Lending Groups
Table SDISC-58
Share of S&E publications in the top 1% most-cited journal articles in computer and information sciences, whole count, by region, country, or economy: 2002–22
Elsevier
Scopus
Table SDISC-58
Share of S&E publications in the top 1% most-cited journal articles in computer and information sciences, whole count, by region, country, or economy: 2002–22
World Bank
World Bank Country and Lending Groups
Table SDISC-59
Share of S&E publications in the top 1% most-cited journal articles in engineering, whole count, by region, country, or economy: 2002–22
Elsevier
Scopus
Table SDISC-59
Share of S&E publications in the top 1% most-cited journal articles in engineering, whole count, by region, country, or economy: 2002–22
World Bank
World Bank Country and Lending Groups
Table SDISC-60
Share of S&E publications in the top 1% most-cited journal articles in geosciences, atmospheric sciences, and ocean sciences, whole count, by region, country, or economy: 2002–22
Elsevier
Scopus
Table SDISC-60
Share of S&E publications in the top 1% most-cited journal articles in geosciences, atmospheric sciences, and ocean sciences, whole count, by region, country, or economy: 2002–22
World Bank
World Bank Country and Lending Groups
Table SDISC-61
Share of S&E publications in the top 1% most-cited journal articles in health sciences, whole count, by region, country, or economy: 2002–22
Elsevier
Scopus
Table SDISC-61
Share of S&E publications in the top 1% most-cited journal articles in health sciences, whole count, by region, country, or economy: 2002–22
World Bank
World Bank Country and Lending Groups
Table SDISC-62
Share of S&E publications in the top 1% most-cited journal articles in materials science, whole count, by region, country, or economy: 2002–22
Elsevier
Scopus
Table SDISC-62
Share of S&E publications in the top 1% most-cited journal articles in materials science, whole count, by region, country, or economy: 2002–22
World Bank
World Bank Country and Lending Groups
Table SDISC-63
Share of S&E publications in the top 1% most-cited journal articles in mathematics and statistics, whole count, by region, country, or economy: 2002–22
Elsevier
Scopus
Table SDISC-63
Share of S&E publications in the top 1% most-cited journal articles in mathematics and statistics, whole count, by region, country, or economy: 2002–22
World Bank
World Bank Country and Lending Groups
Table SDISC-64
Share of S&E publications in the top 1% most-cited journal articles in natural resources and conservation, whole count, by region, country, or economy: 2002–22
Elsevier
Scopus
Table SDISC-64
Share of S&E publications in the top 1% most-cited journal articles in natural resources and conservation, whole count, by region, country, or economy: 2002–22
World Bank
World Bank Country and Lending Groups
Table SDISC-65
Share of S&E publications in the top 1% most-cited journal articles in physics, whole count, by region, country, or economy: 2002–22
Elsevier
Scopus
Table SDISC-65
Share of S&E publications in the top 1% most-cited journal articles in physics, whole count, by region, country, or economy: 2002–22
World Bank
World Bank Country and Lending Groups
Table SDISC-66
Share of S&E publications in the top 1% most-cited journal articles in psychology, whole count, by region, country, or economy: 2002–22
Elsevier
Scopus
Table SDISC-66
Share of S&E publications in the top 1% most-cited journal articles in psychology, whole count, by region, country, or economy: 2002–22
World Bank
World Bank Country and Lending Groups
Table SDISC-67
Share of S&E publications in the top 1% most-cited journal articles in social sciences, whole count, by region, country, or economy: 2002–22
Elsevier
Scopus
Table SDISC-67
Share of S&E publications in the top 1% most-cited journal articles in social sciences, whole count, by region, country, or economy: 2002–22
World Bank
World Bank Country and Lending Groups
Table SDISC-68
Share of S&E publications in the top 1% most-cited journal articles and conference proceedings in computer and information sciences, whole count, by region, country, or economy: 2002–22
Elsevier
Scopus
Table SDISC-68
Share of S&E publications in the top 1% most-cited journal articles and conference proceedings in computer and information sciences, whole count, by region, country, or economy: 2002–22
World Bank
World Bank Country and Lending Groups
Table SDISC-69
S&E articles in all fields combined, by coauthorship attribute and selected region, country, or economy: 2002–23
Elsevier
Scopus
Table SDISC-70
Internationally coauthored S&E publications, by selected region, country, or economy pairs: 2003, 2013 and 2023
Elsevier
Scopus
Table SDISC-71
U.S. international articles with coauthor from selected countries: Selected years, 2002–23
Elsevier
Scopus
Table SDISC-72
International articles from 15 largest producing regions, countries, or economies with U.S. coauthor: 2002–23
Elsevier
Scopus
Table SDISC-73
Semiconductor-related S&E articles by coauthorship attribute, whole and fractional counting, by region, country, or economy: 2002–23
Elsevier
Scopus
Table SDISC-74
Internationally coauthored semiconductor articles, by selected region, country, or economy: 2002–23
Elsevier
Scopus
Table SDISC-75
International collaboration network analysis for semiconductor research papers, by selected region, country, or economy: 2002–23
Elsevier
Scopus
Table SDISC-76
Semiconductor-related S&E articles, by region, country, or economy: 2002–23
Elsevier
Scopus
Table SDISC-76
Semiconductor-related S&E articles, by region, country, or economy: 2002–23
World Bank
World Bank Country and Lending Groups
Table SDISC-77
Semiconductor-related articles, by coauthorship attribute and selected region, country, or economy: 2002–23
Elsevier
Scopus
Table SDISC-78
Biotechnology-related articles, by selected region, country, or economy: 2002–23
Elsevier
Scopus
Table SDISC-78
Biotechnology-related articles, by selected region, country, or economy: 2002–23
World Bank
World Bank Country and Lending Groups