 An official website of the United States government
 Executive Summary
Economic Impact of Science and Engineering Activities
Science and engineering (S&E) activities continue to be strong drivers of economic growth in the United States and abroad, with research-intensive sectors demonstrating particularly strong performance across multiple measures of economic value creation.
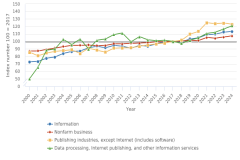
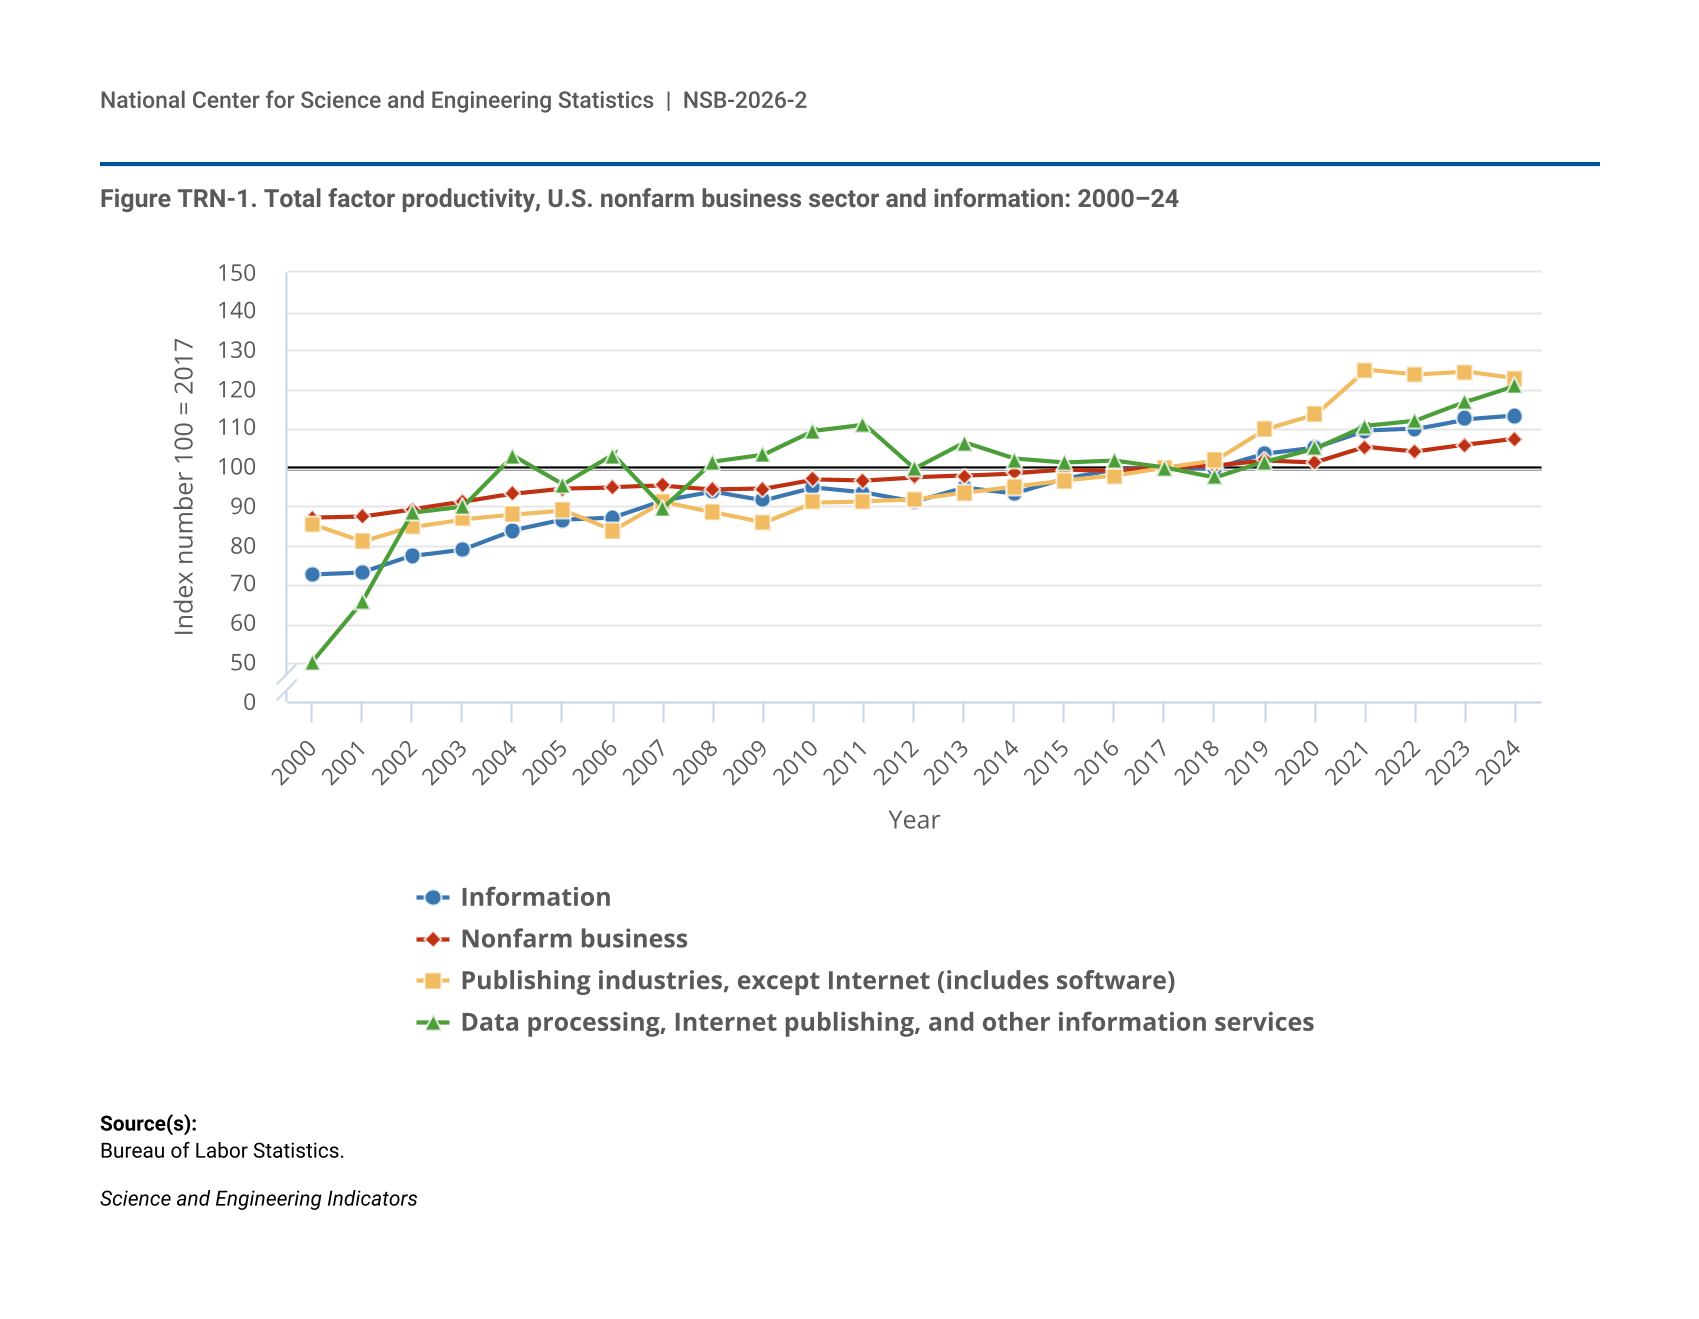
- Total factor productivity (TFP) is a broad measure of the impact of S&E activities (beyond labor and capital) on economic growth. Between 2017 and 2024, TFP grew faster in the high-R&D information sector (13%) in the United States than in the domestic nonfarm economy as a whole (8%).
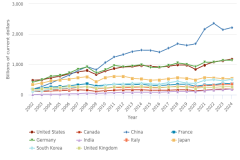
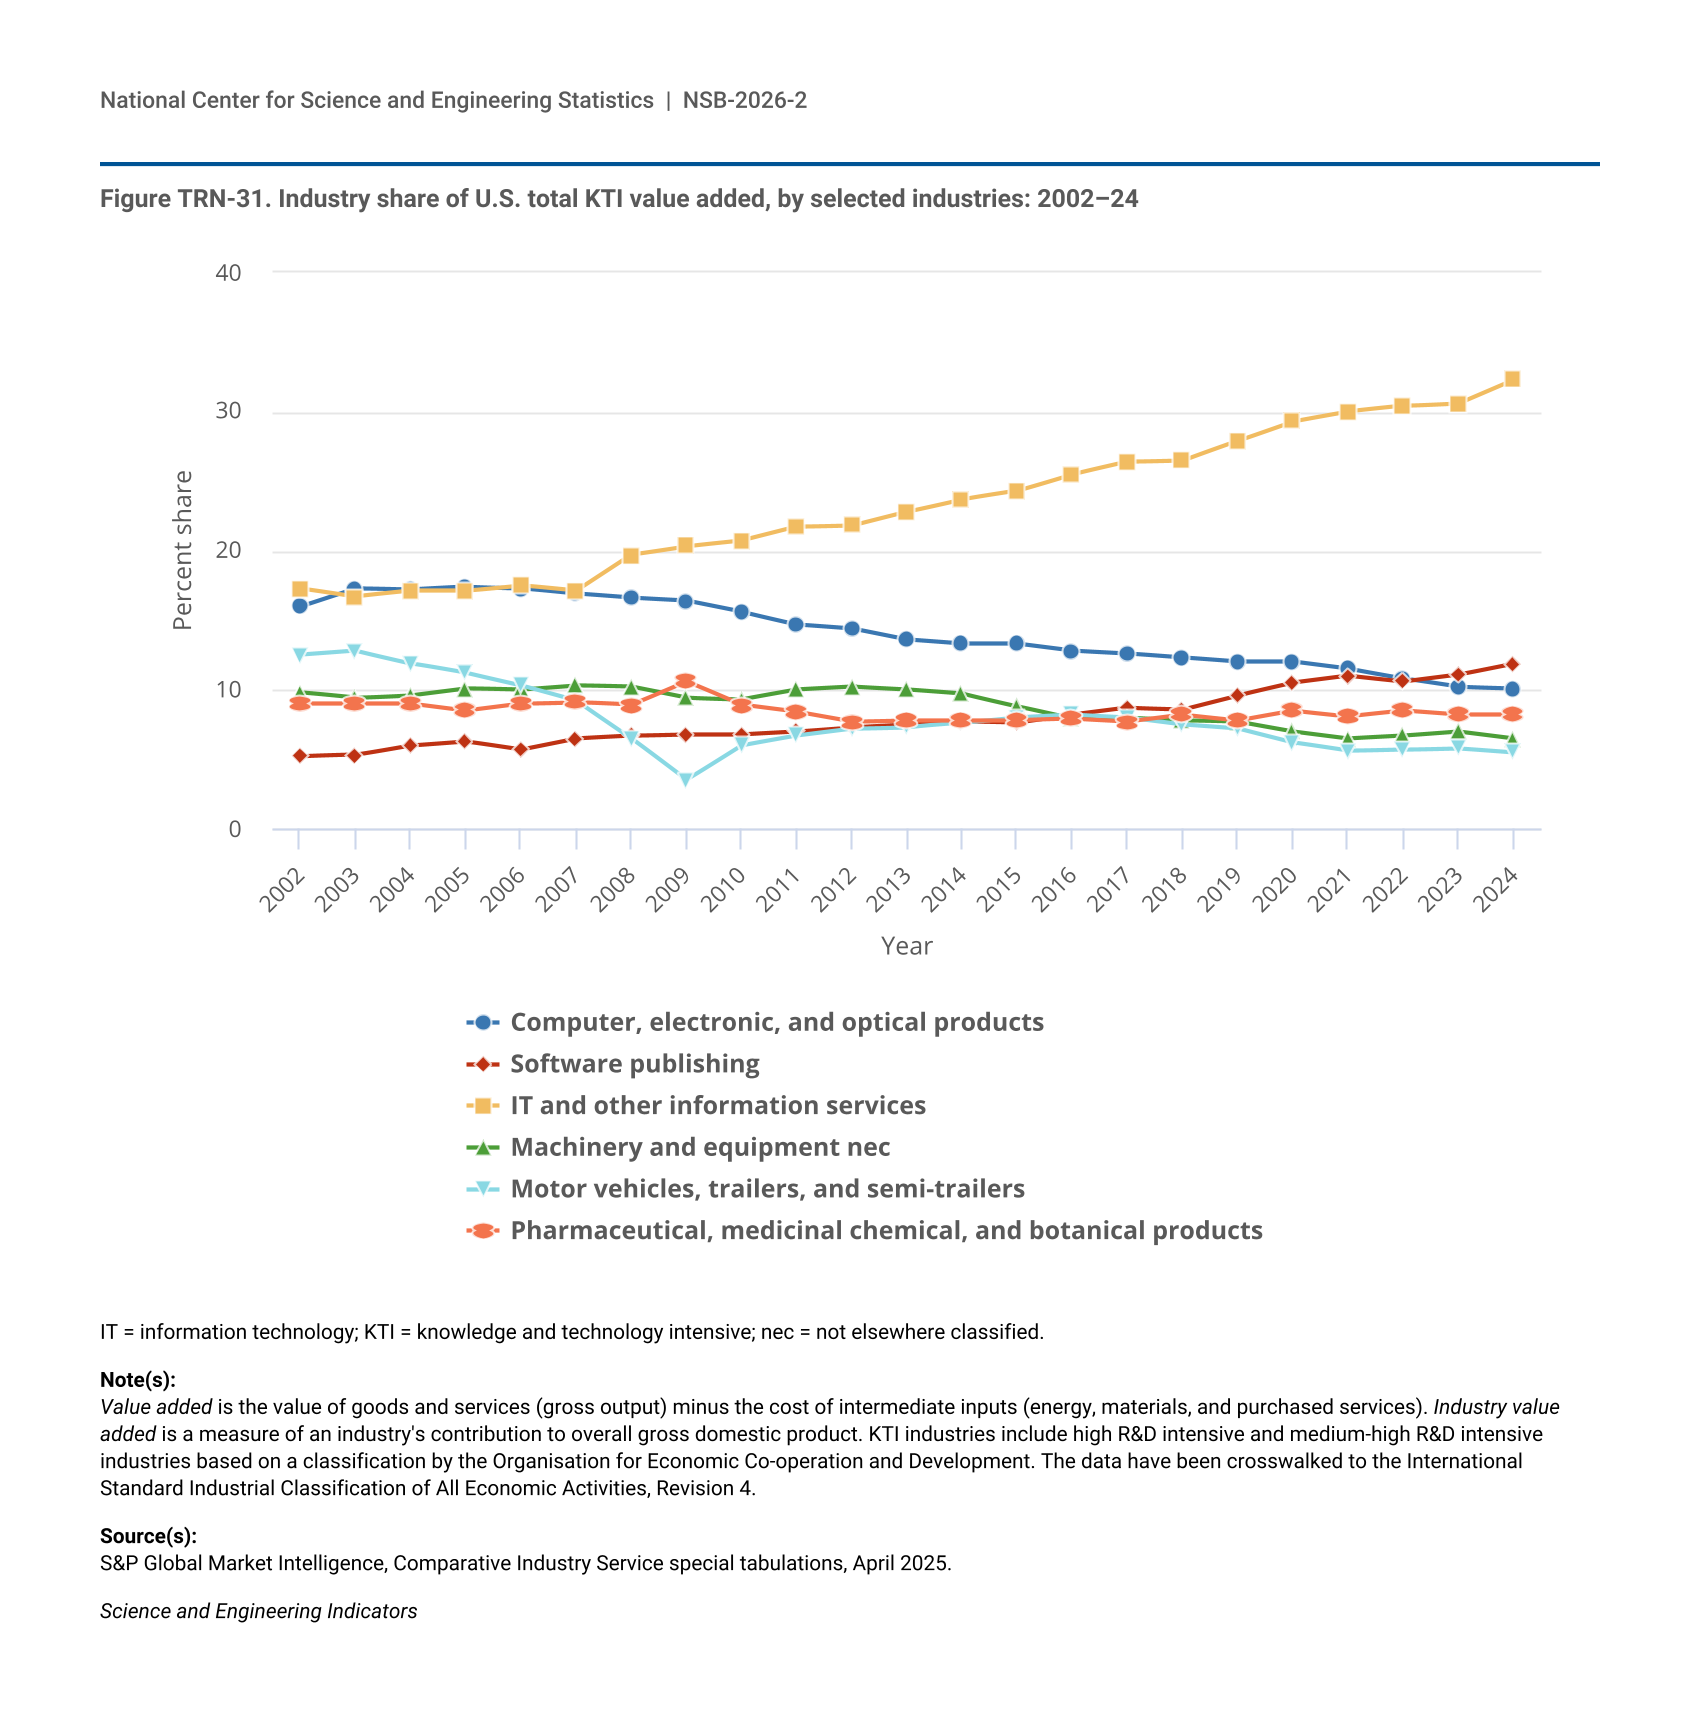
- Knowledge- and technology-intensive (KTI) industries (based on Organisation for Economic Co-operation and Development measures of R&D intensity) worldwide produced $11.7 trillion of value added (net economic output) in 2024, in current dollars, a 4% increase from 2023. In the United States, KTI industries produced $3.3 trillion of value added in 2024, accounting for 11% of U.S. gross domestic product.
Innovation Commercialization and Technology Transfer
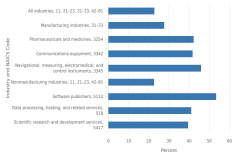
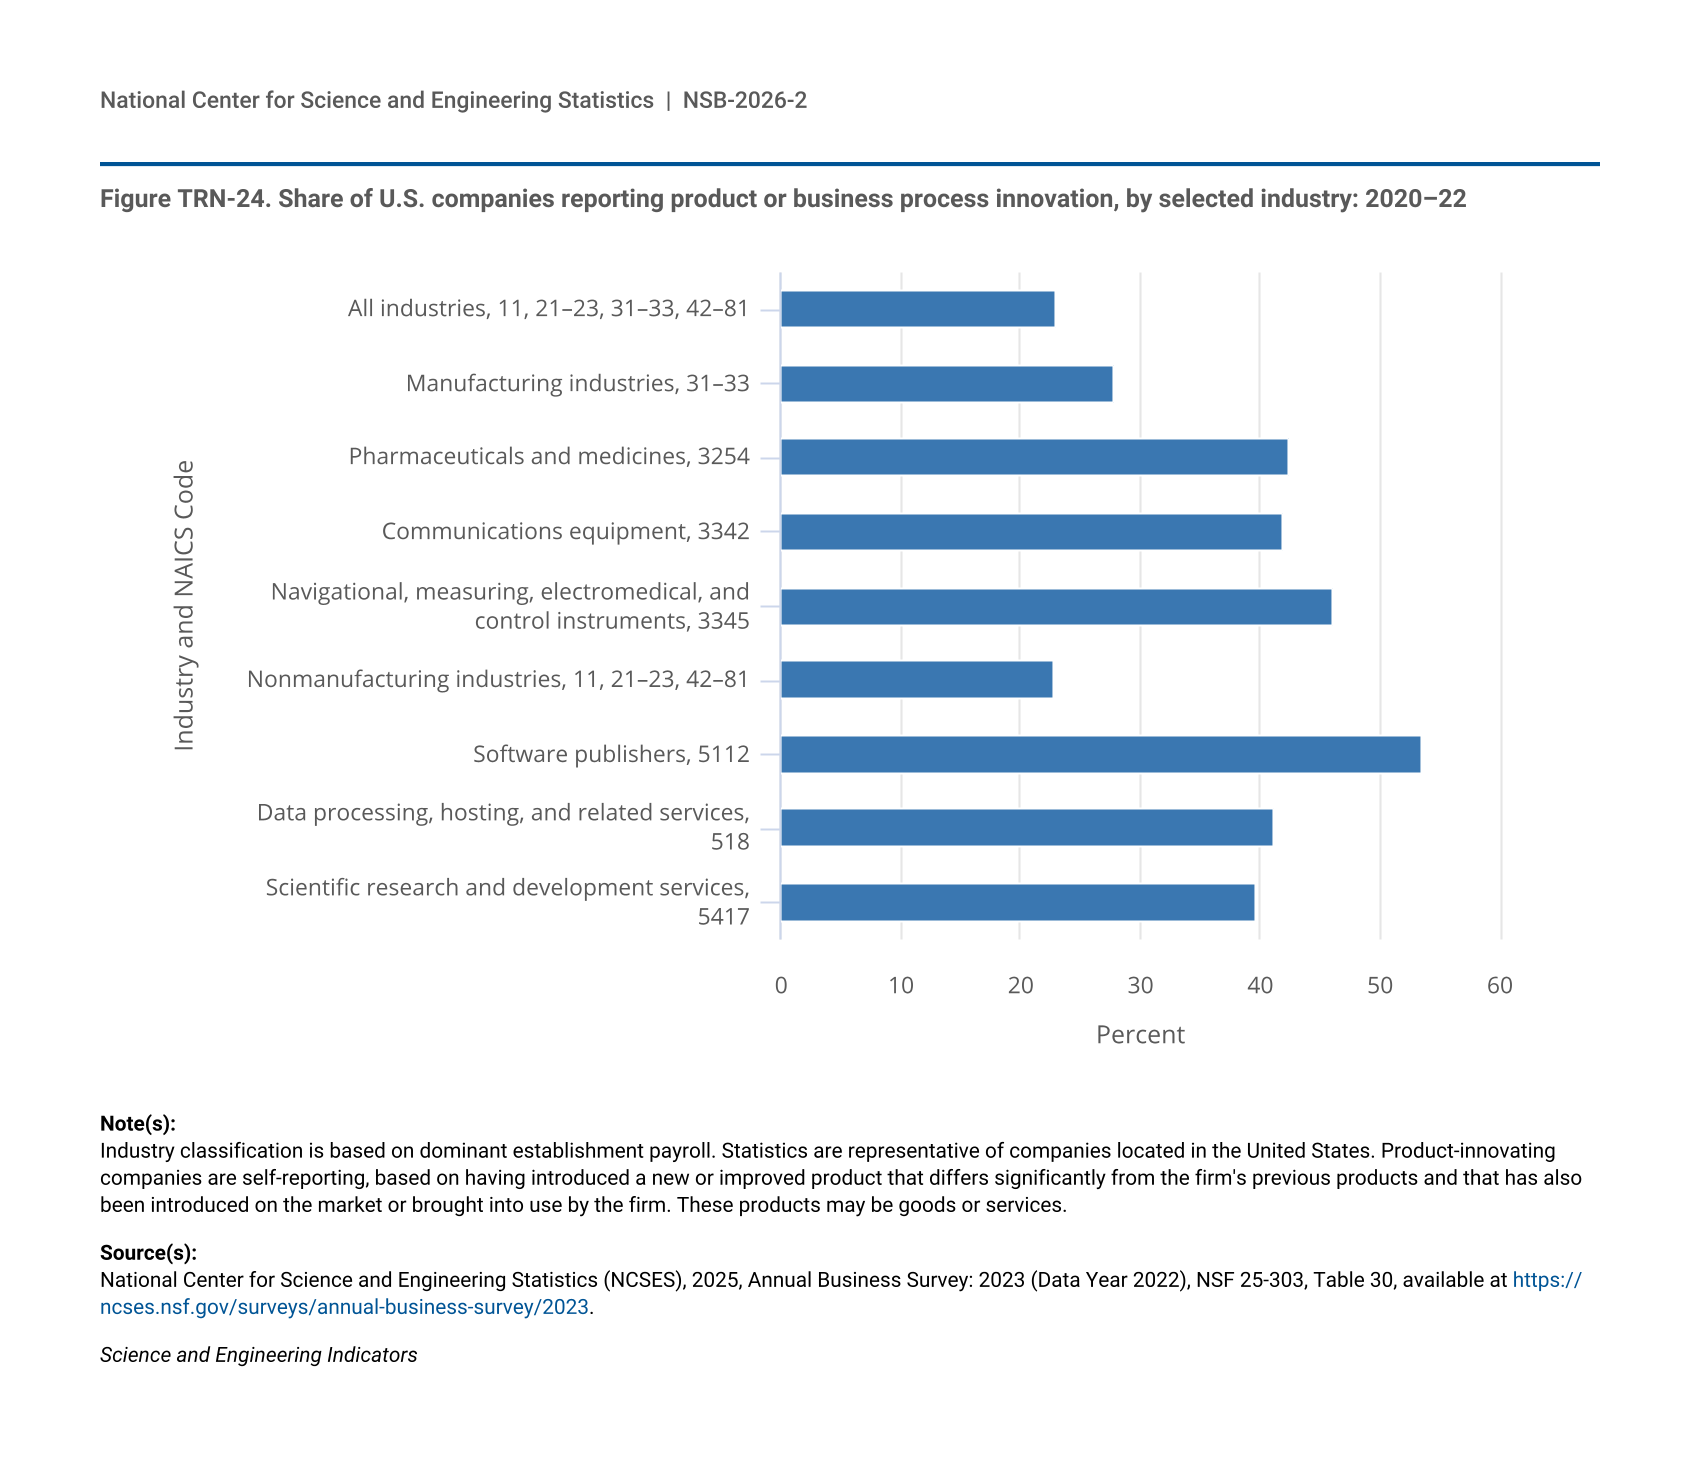
Commercialization, technology transfer, and adoption data highlight variations across industries and time periods. Firms in high-R&D industries within the information and manufacturing sectors reported higher new product or service introduction rates compared to all industries.
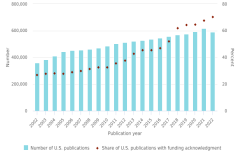
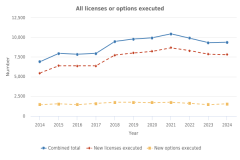
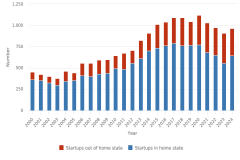
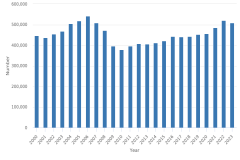
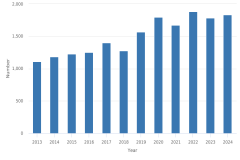
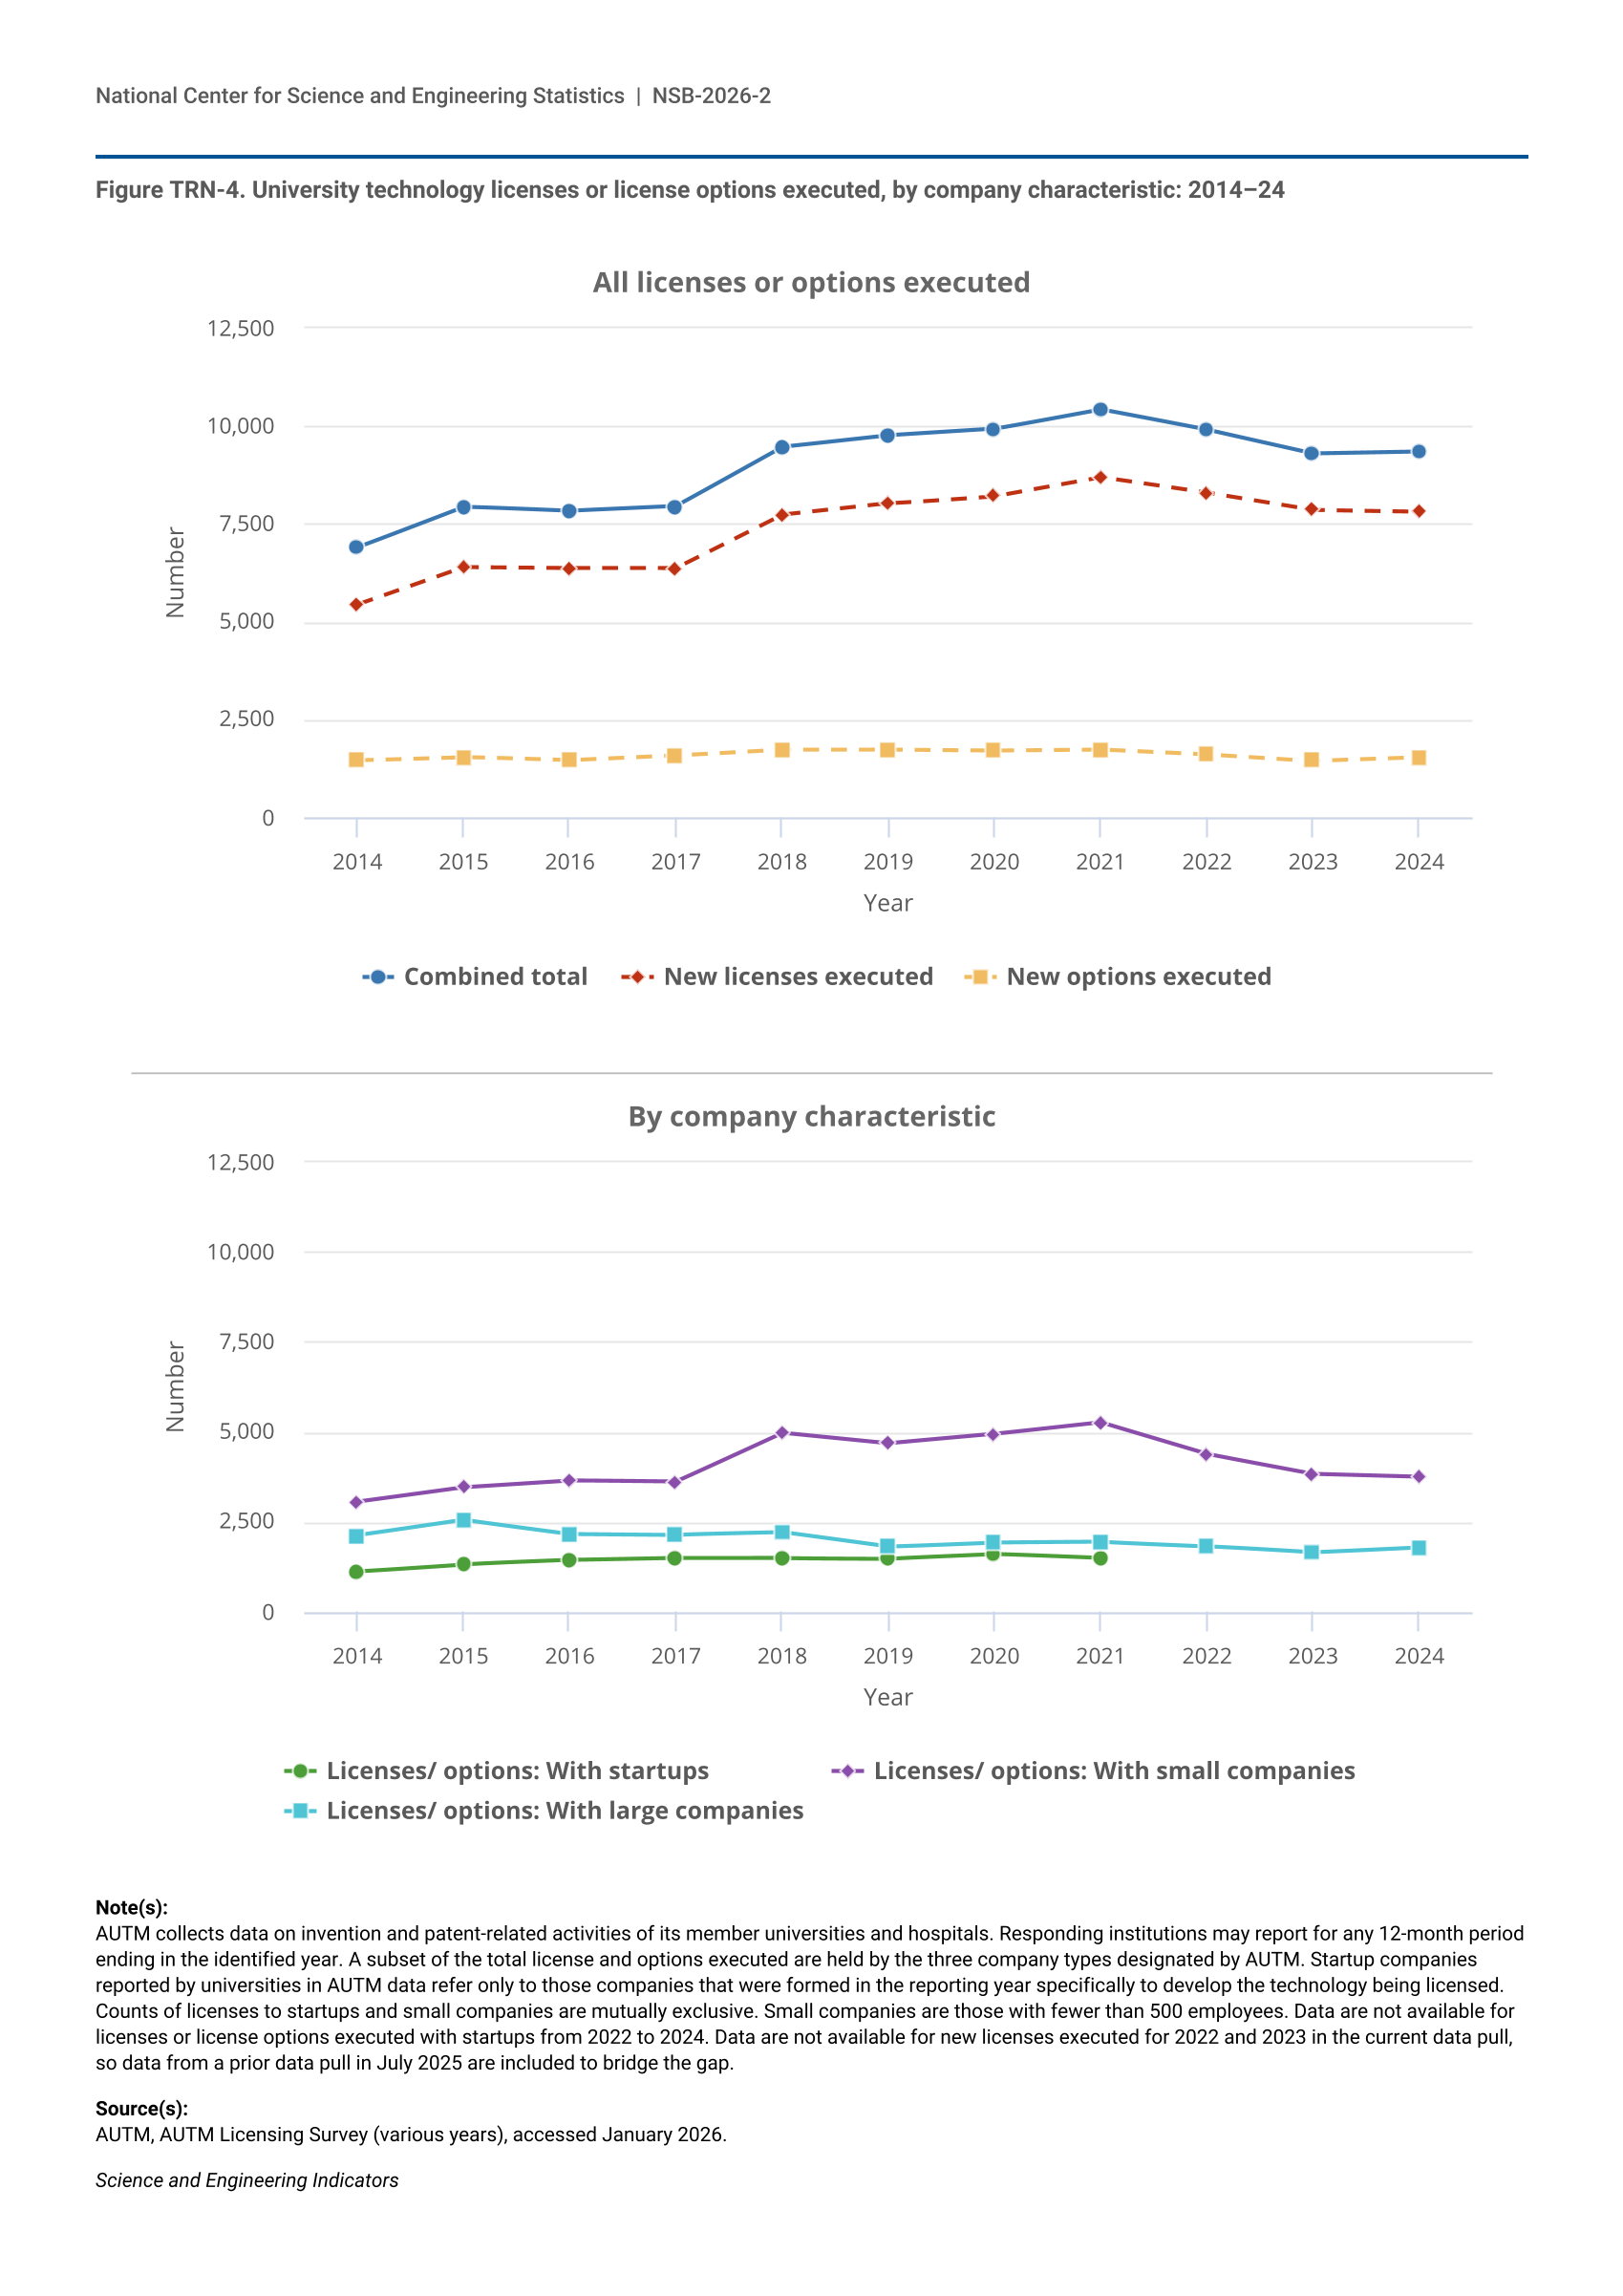
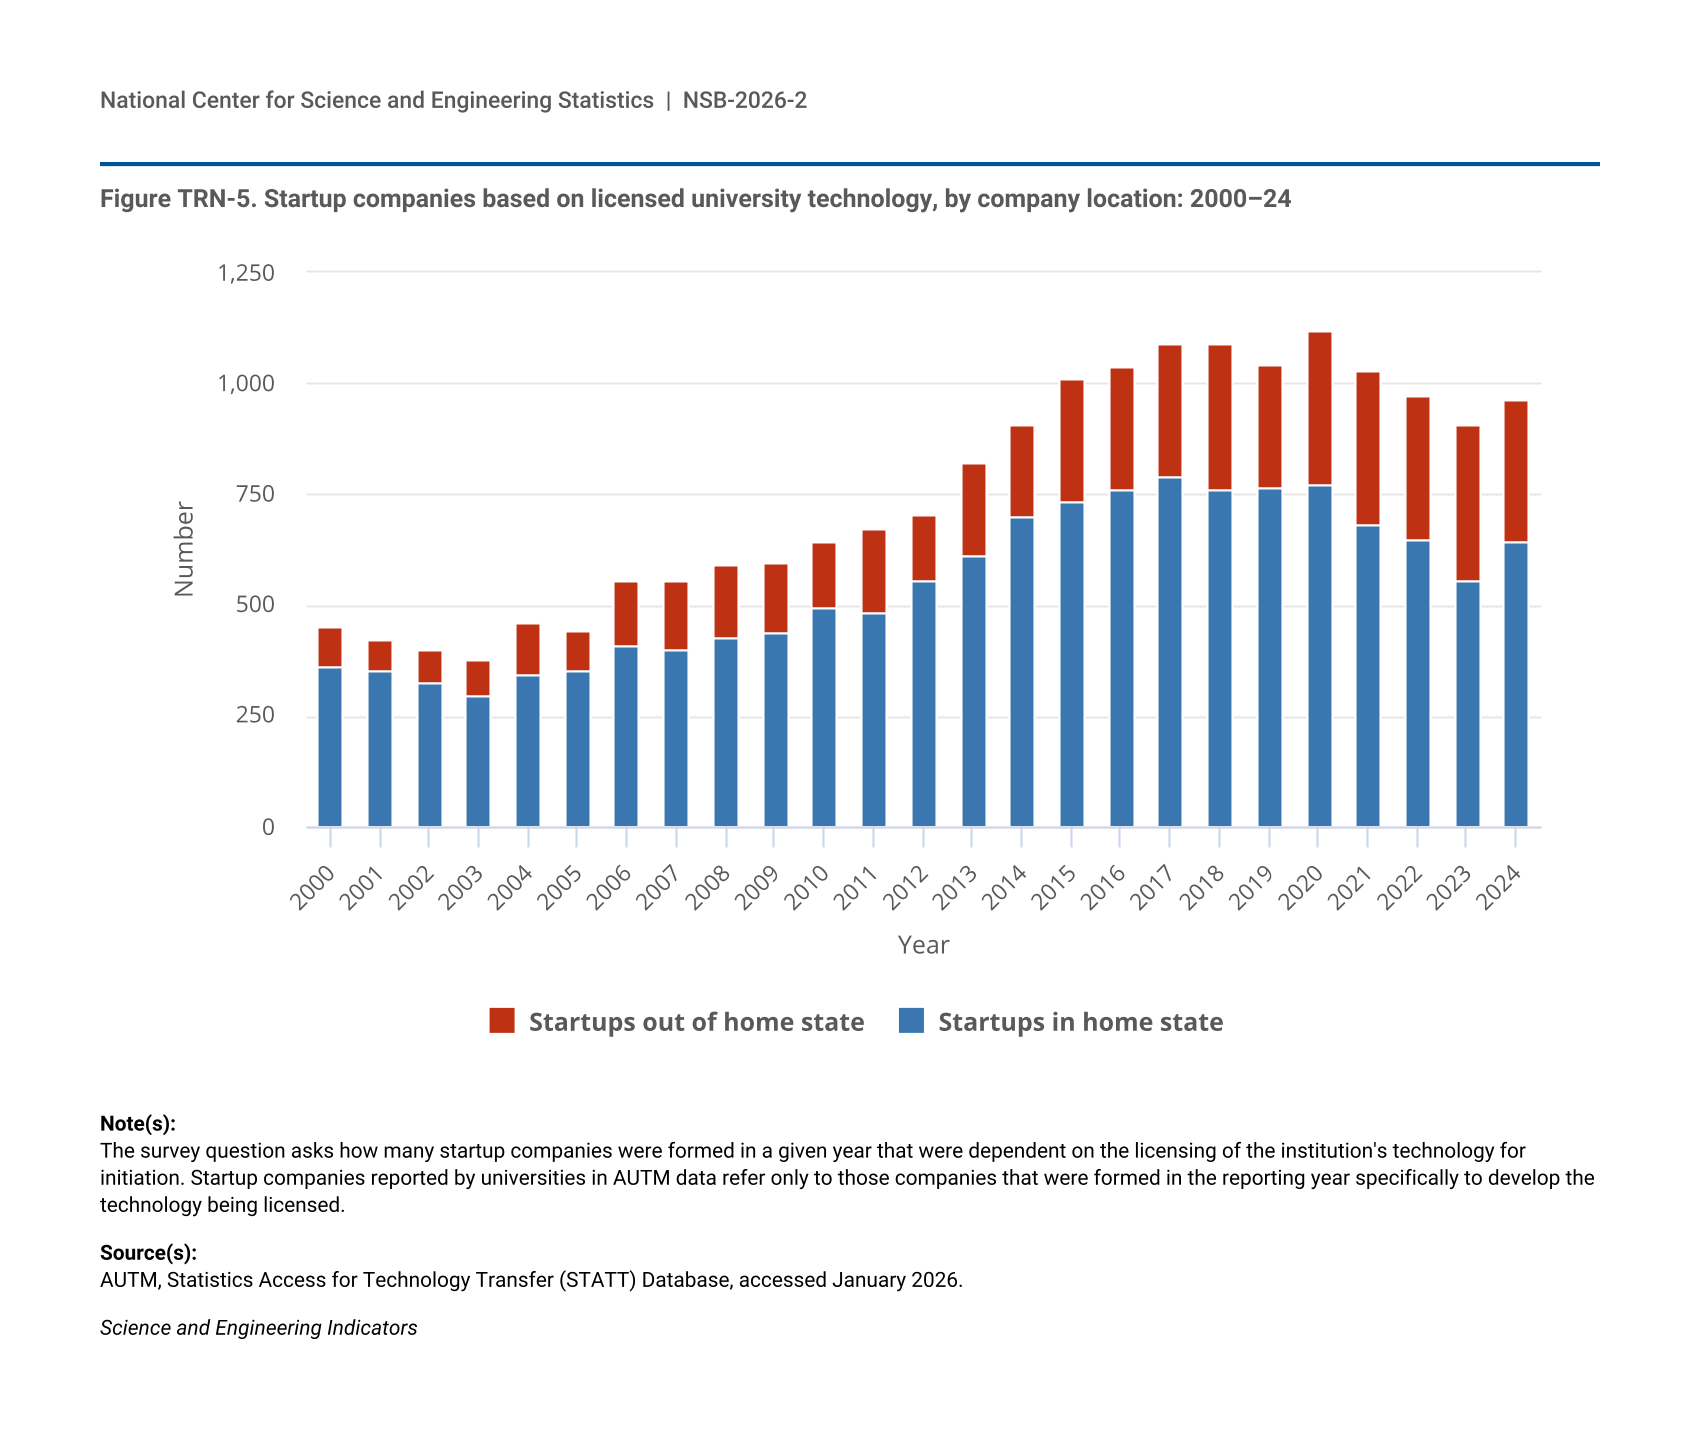
- The number of university licenses and options granted in the United States to private-sector entities peaked in 2021 but have declined since then. University-related startups similarly peaked in 2020 and have decreased since then through 2024.
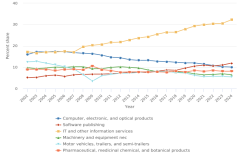
- Industries in the information sector, such as software publishing, telecommunications, data processing, and Internet providers, posted above-average rates of introducing new products and services. In 2022, over half (54%) of software publishers reported introducing a new product or service in the past 3 years, compared with 23% for all industries.
- Within the manufacturing sector in 2022, firms producing navigational, measuring, electromedical, and control instruments reported the highest rate (46%) of introducing a new product or service in the past 3 years.
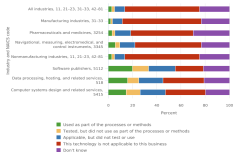
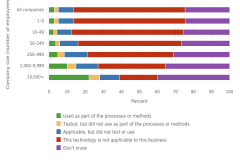
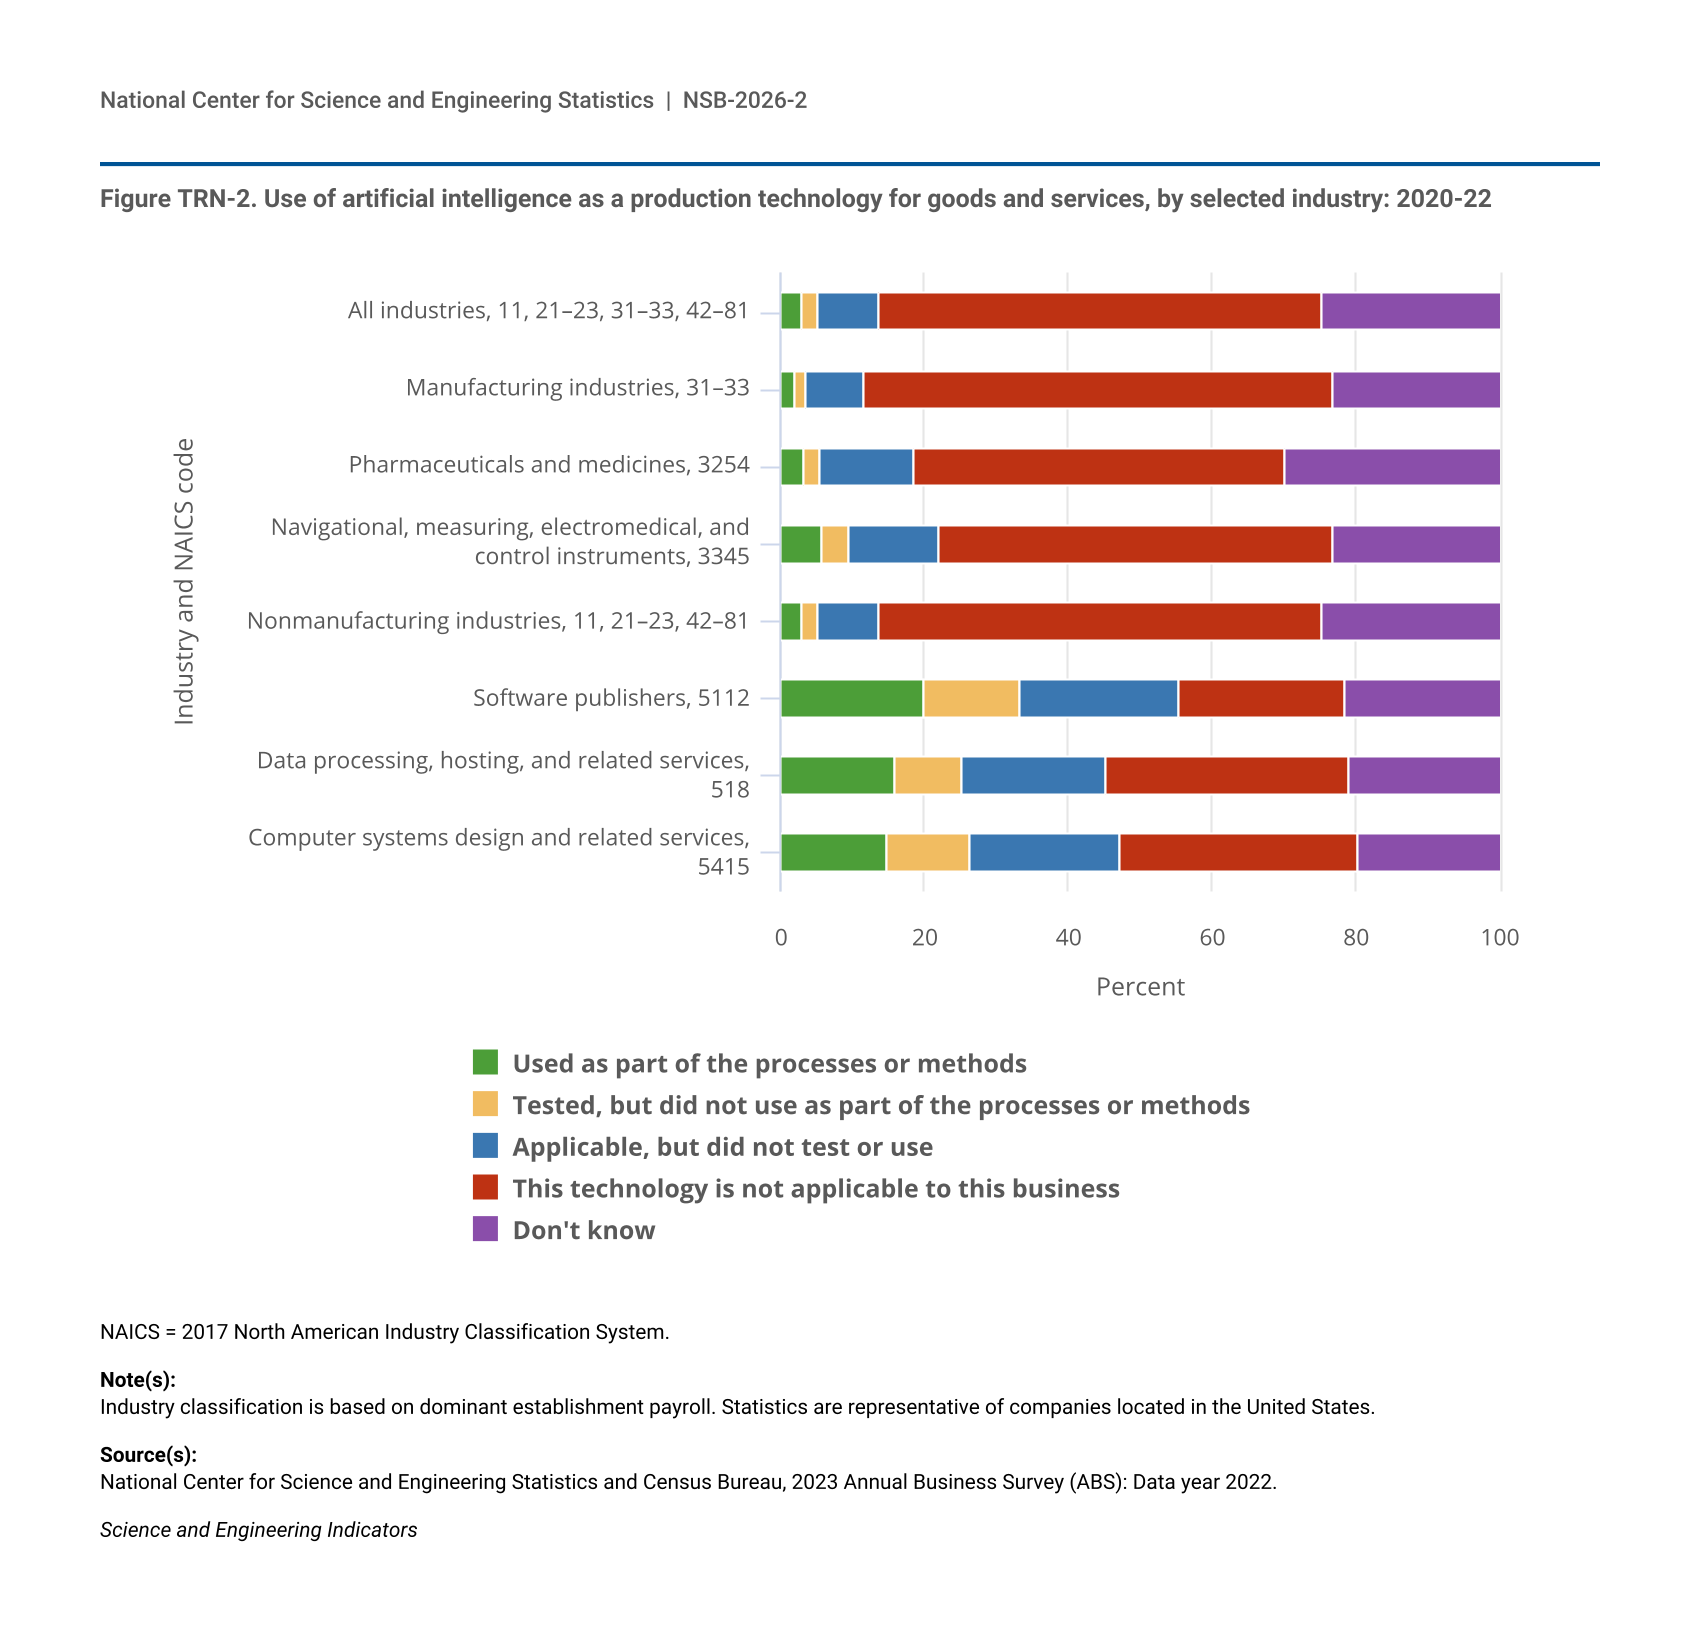
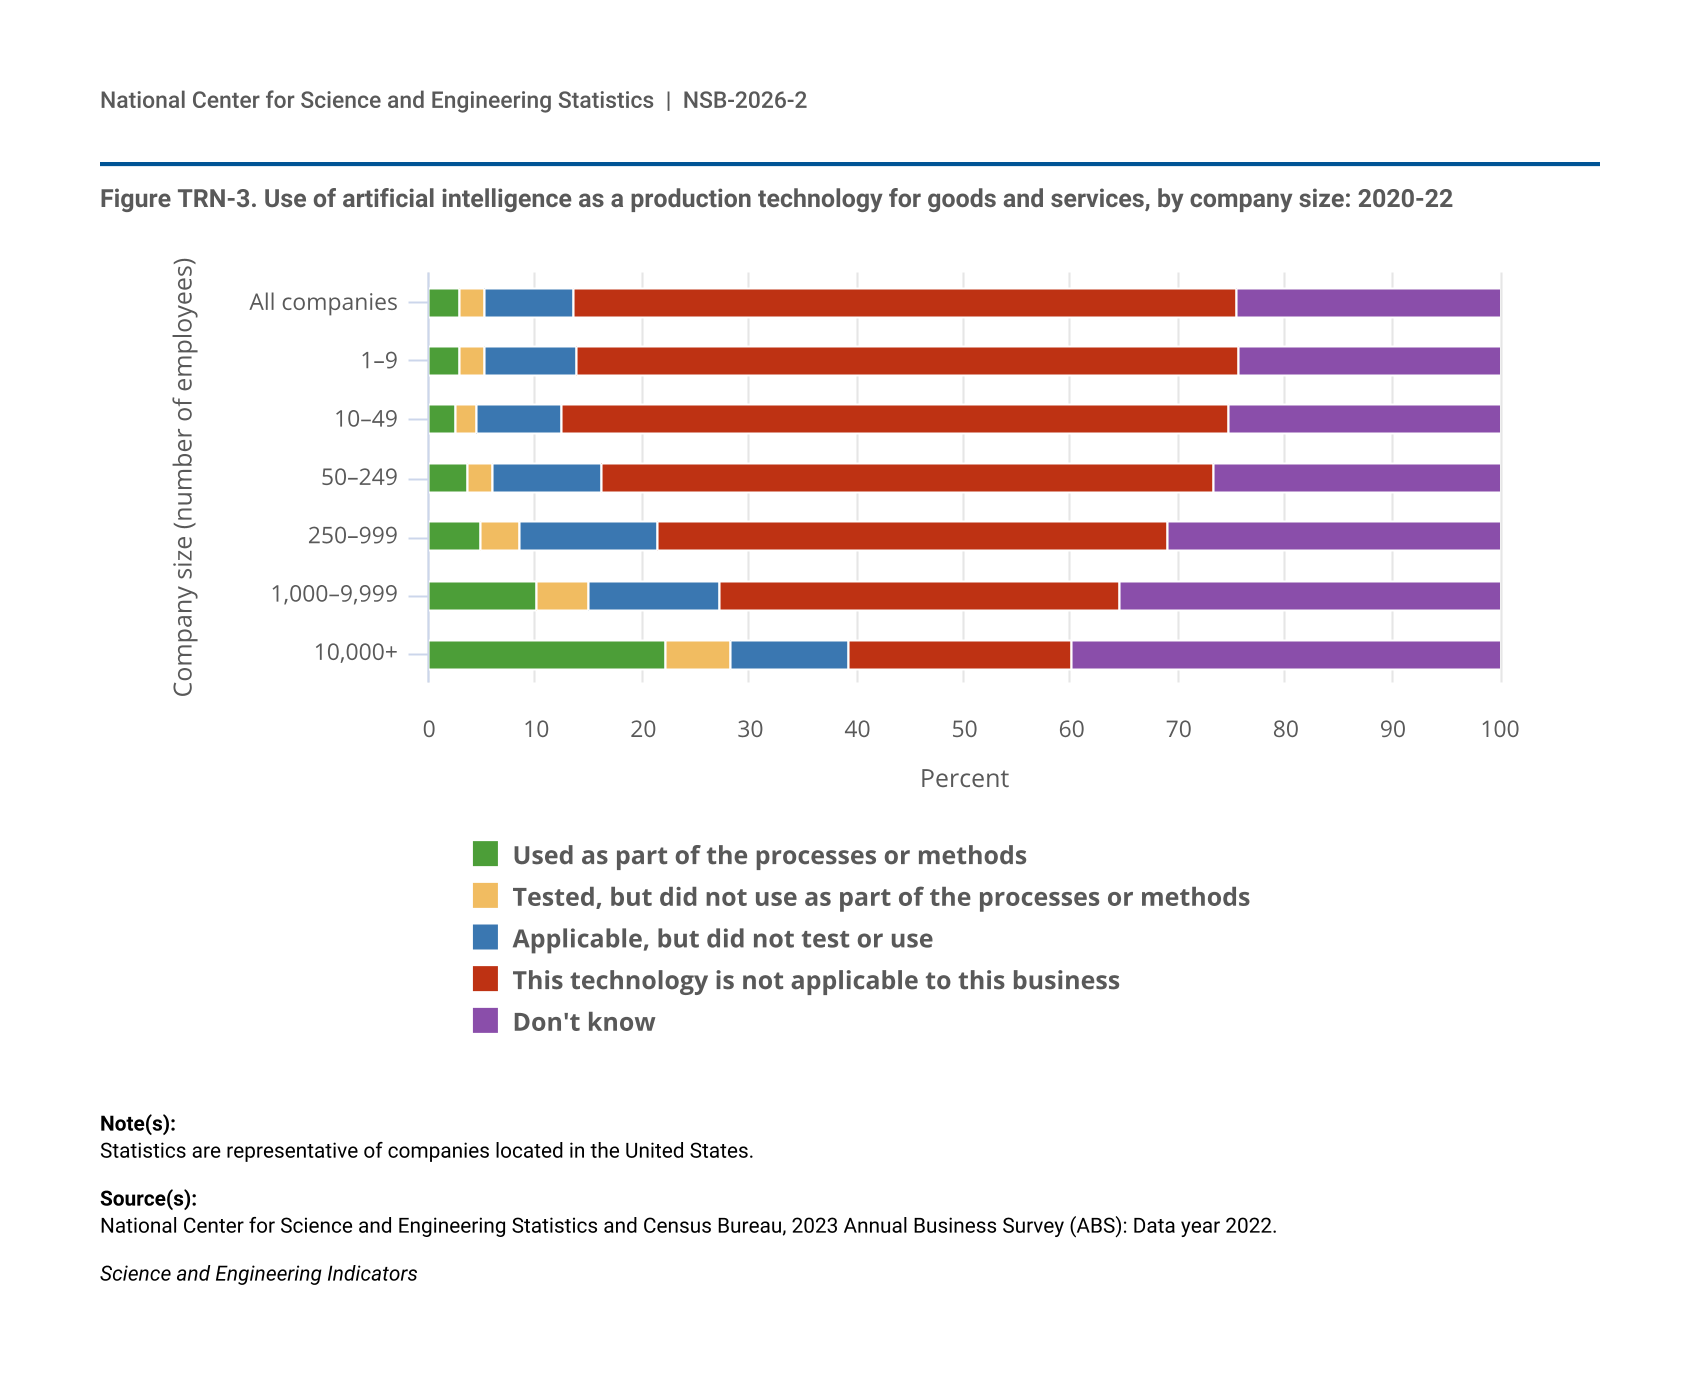
- Artificial intelligence (AI) adoption was more widespread in larger U.S. companies (measured by employees) and in companies in particular industries, such as software, where 20% of companies reported using the technology as a production technology between 2020 and 2022.
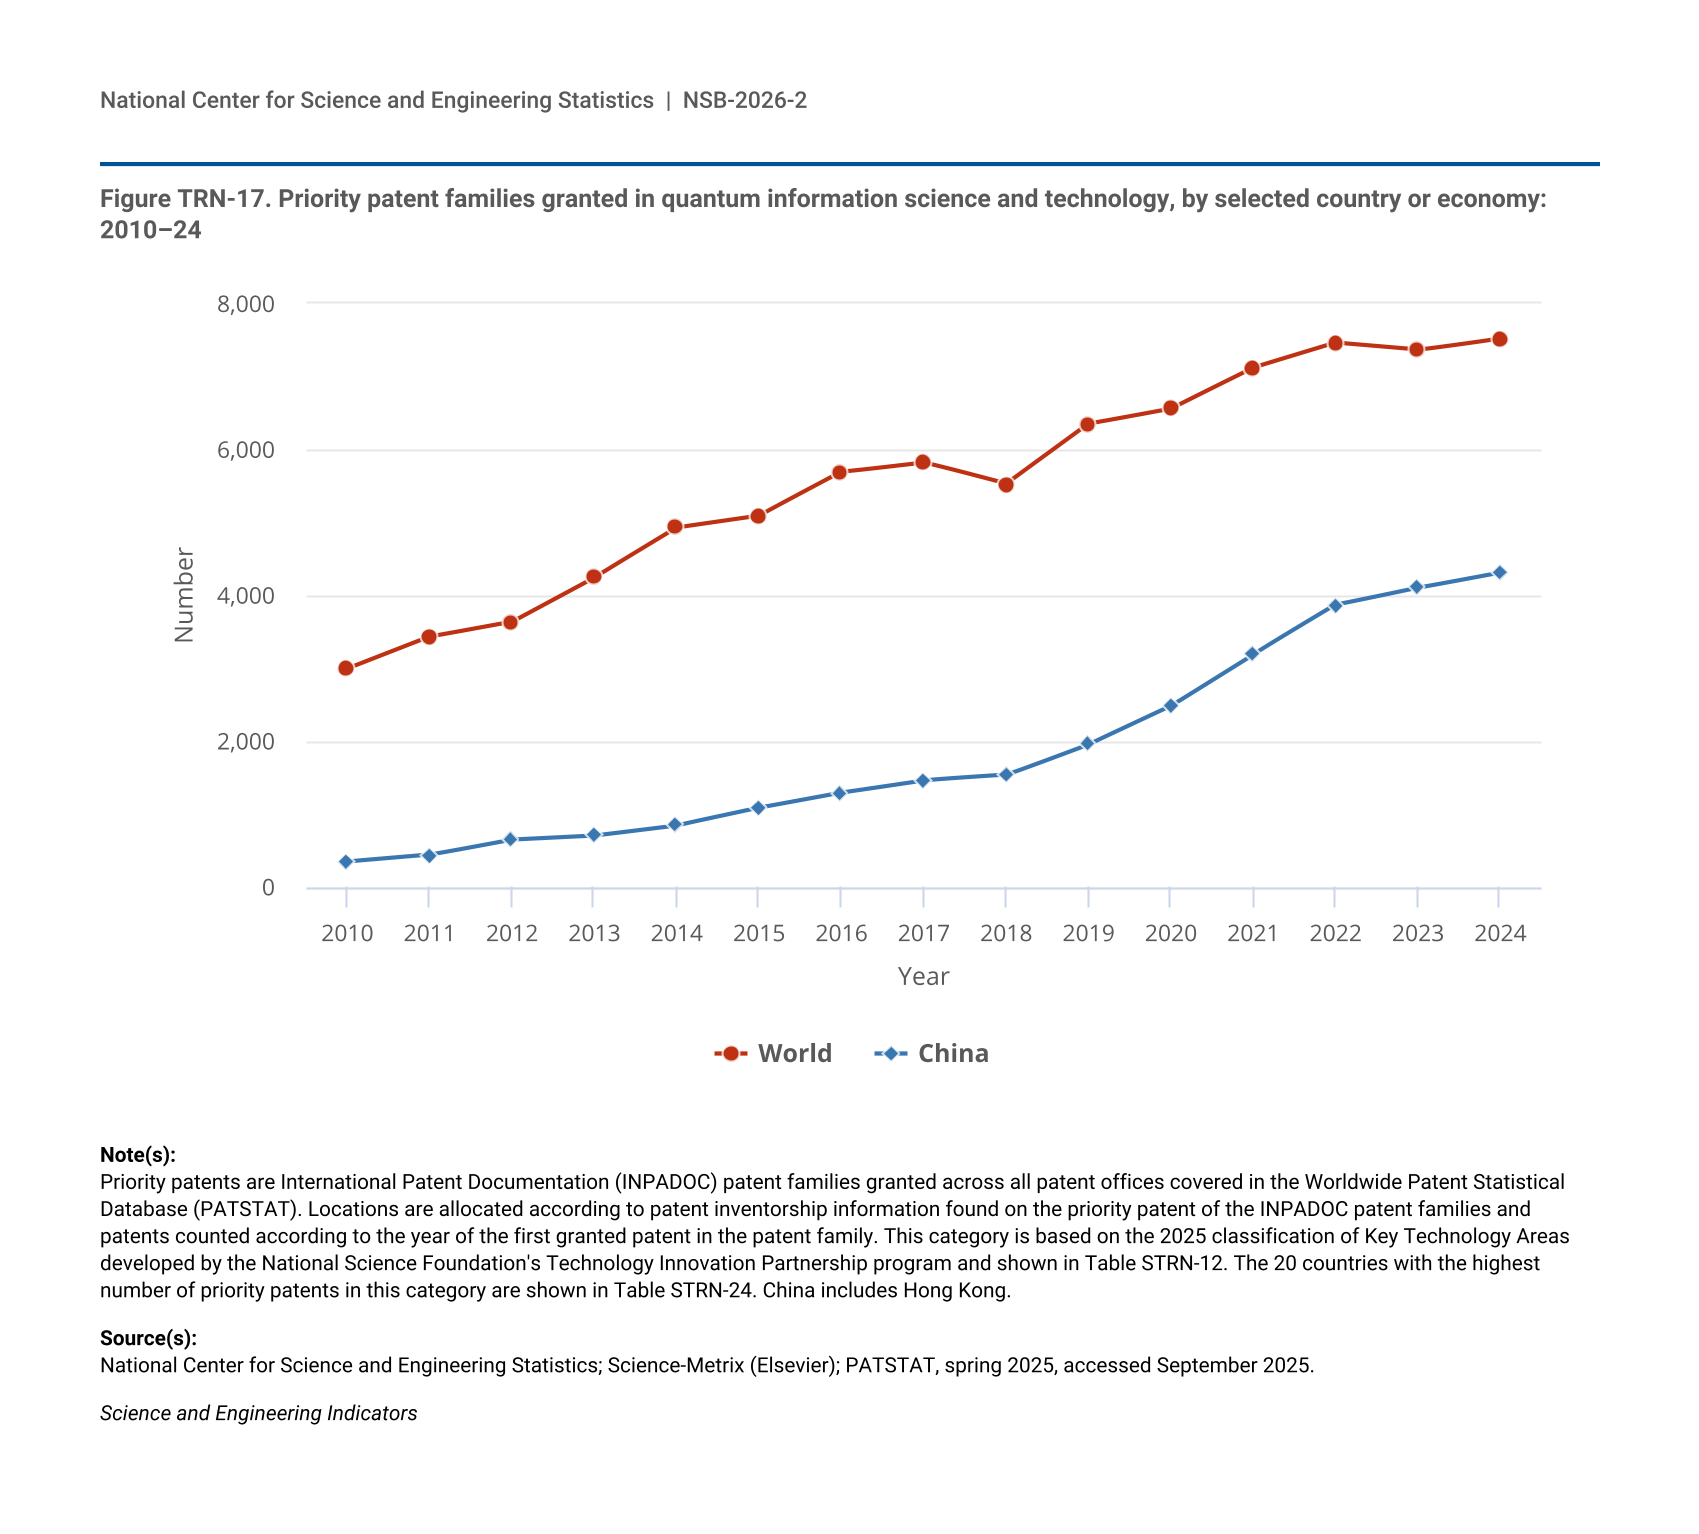
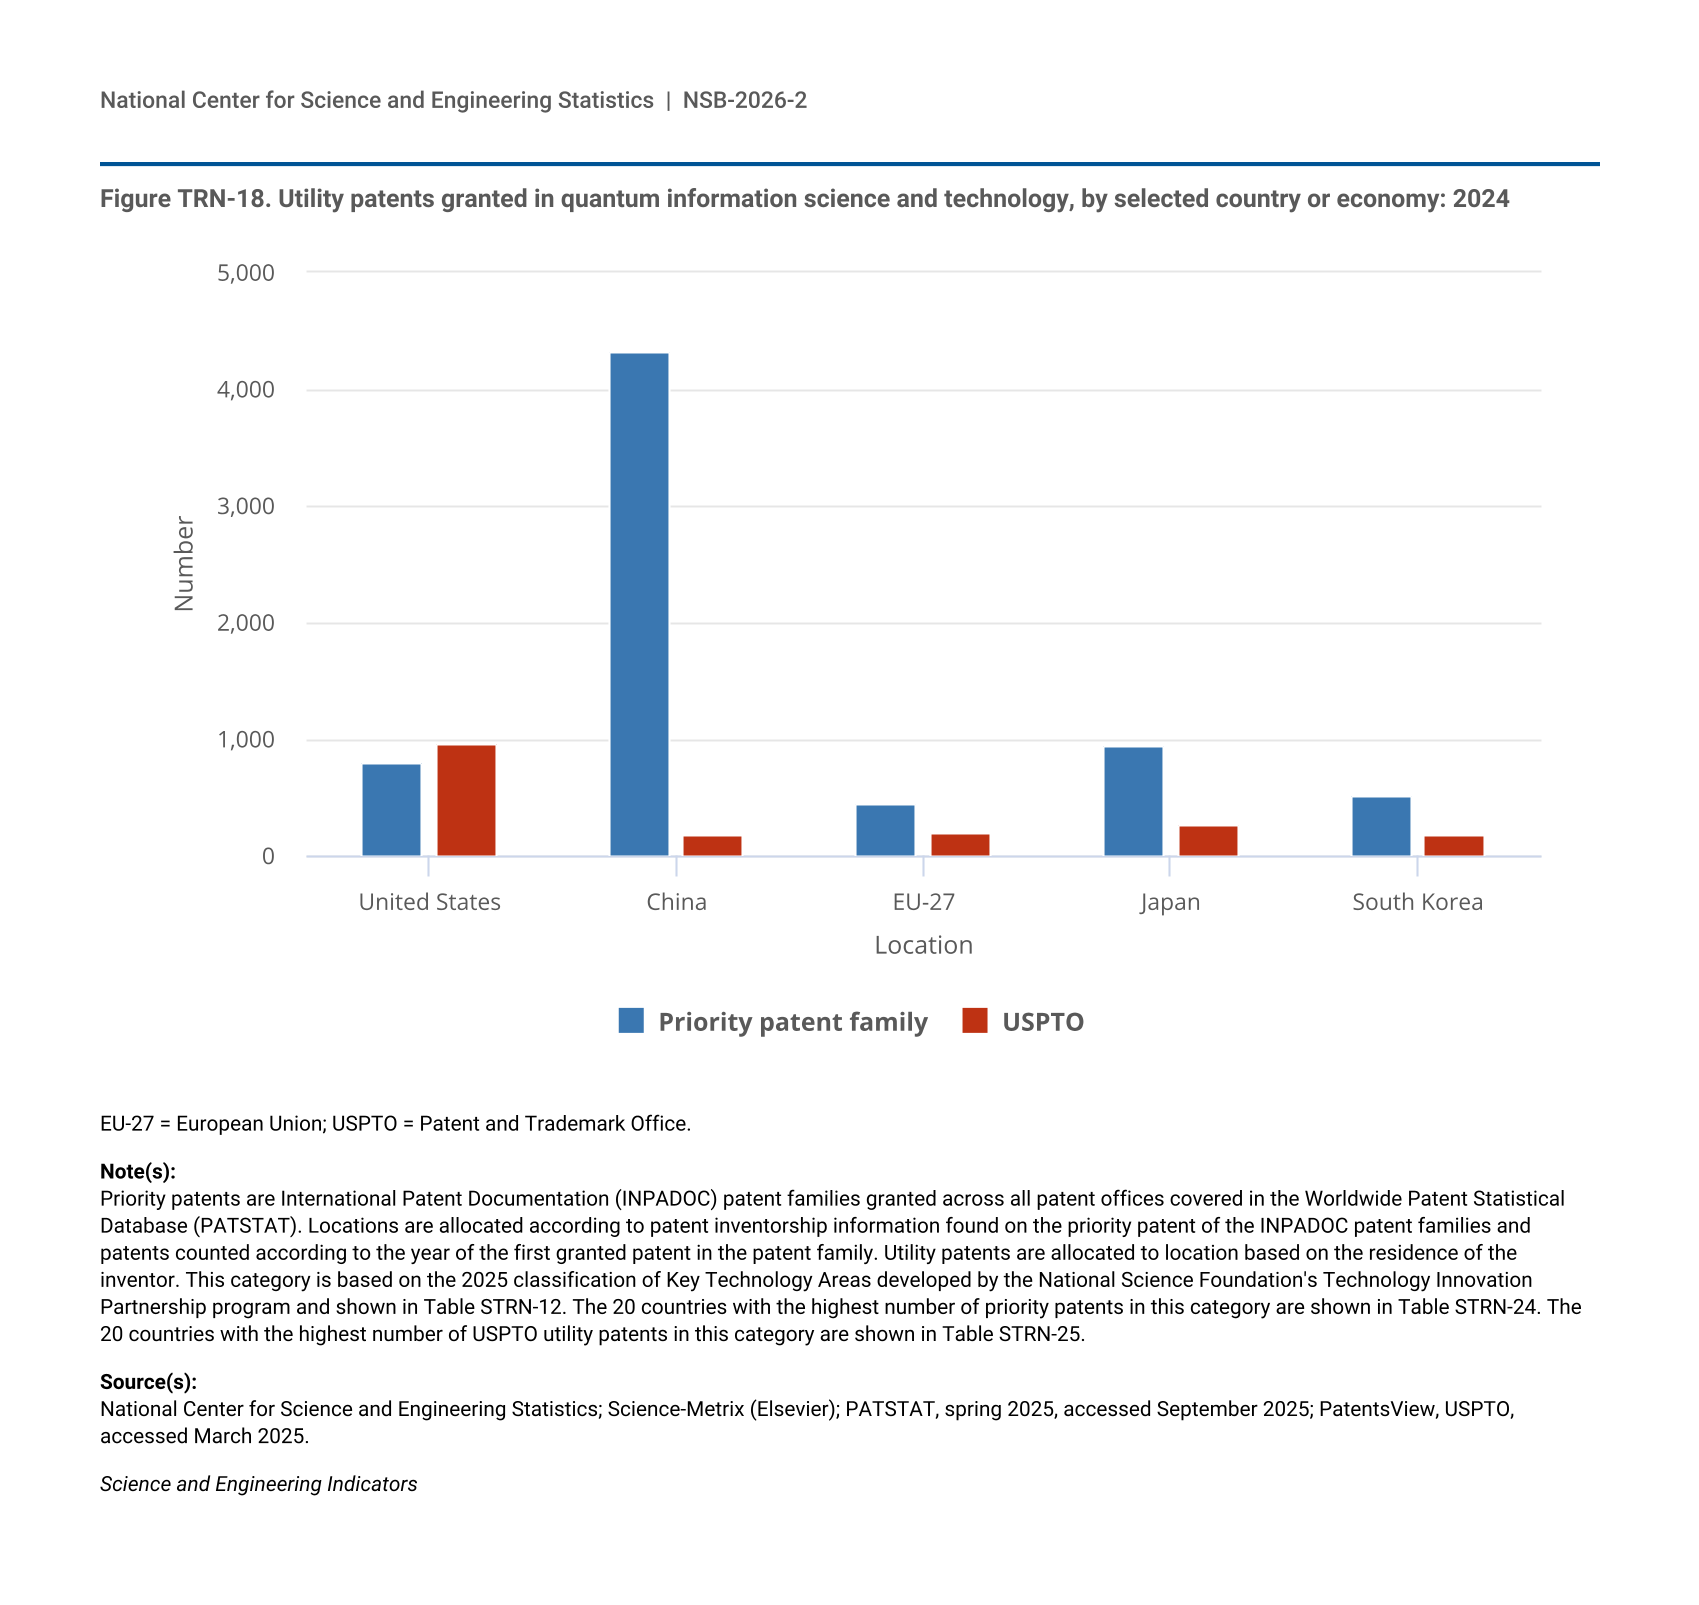
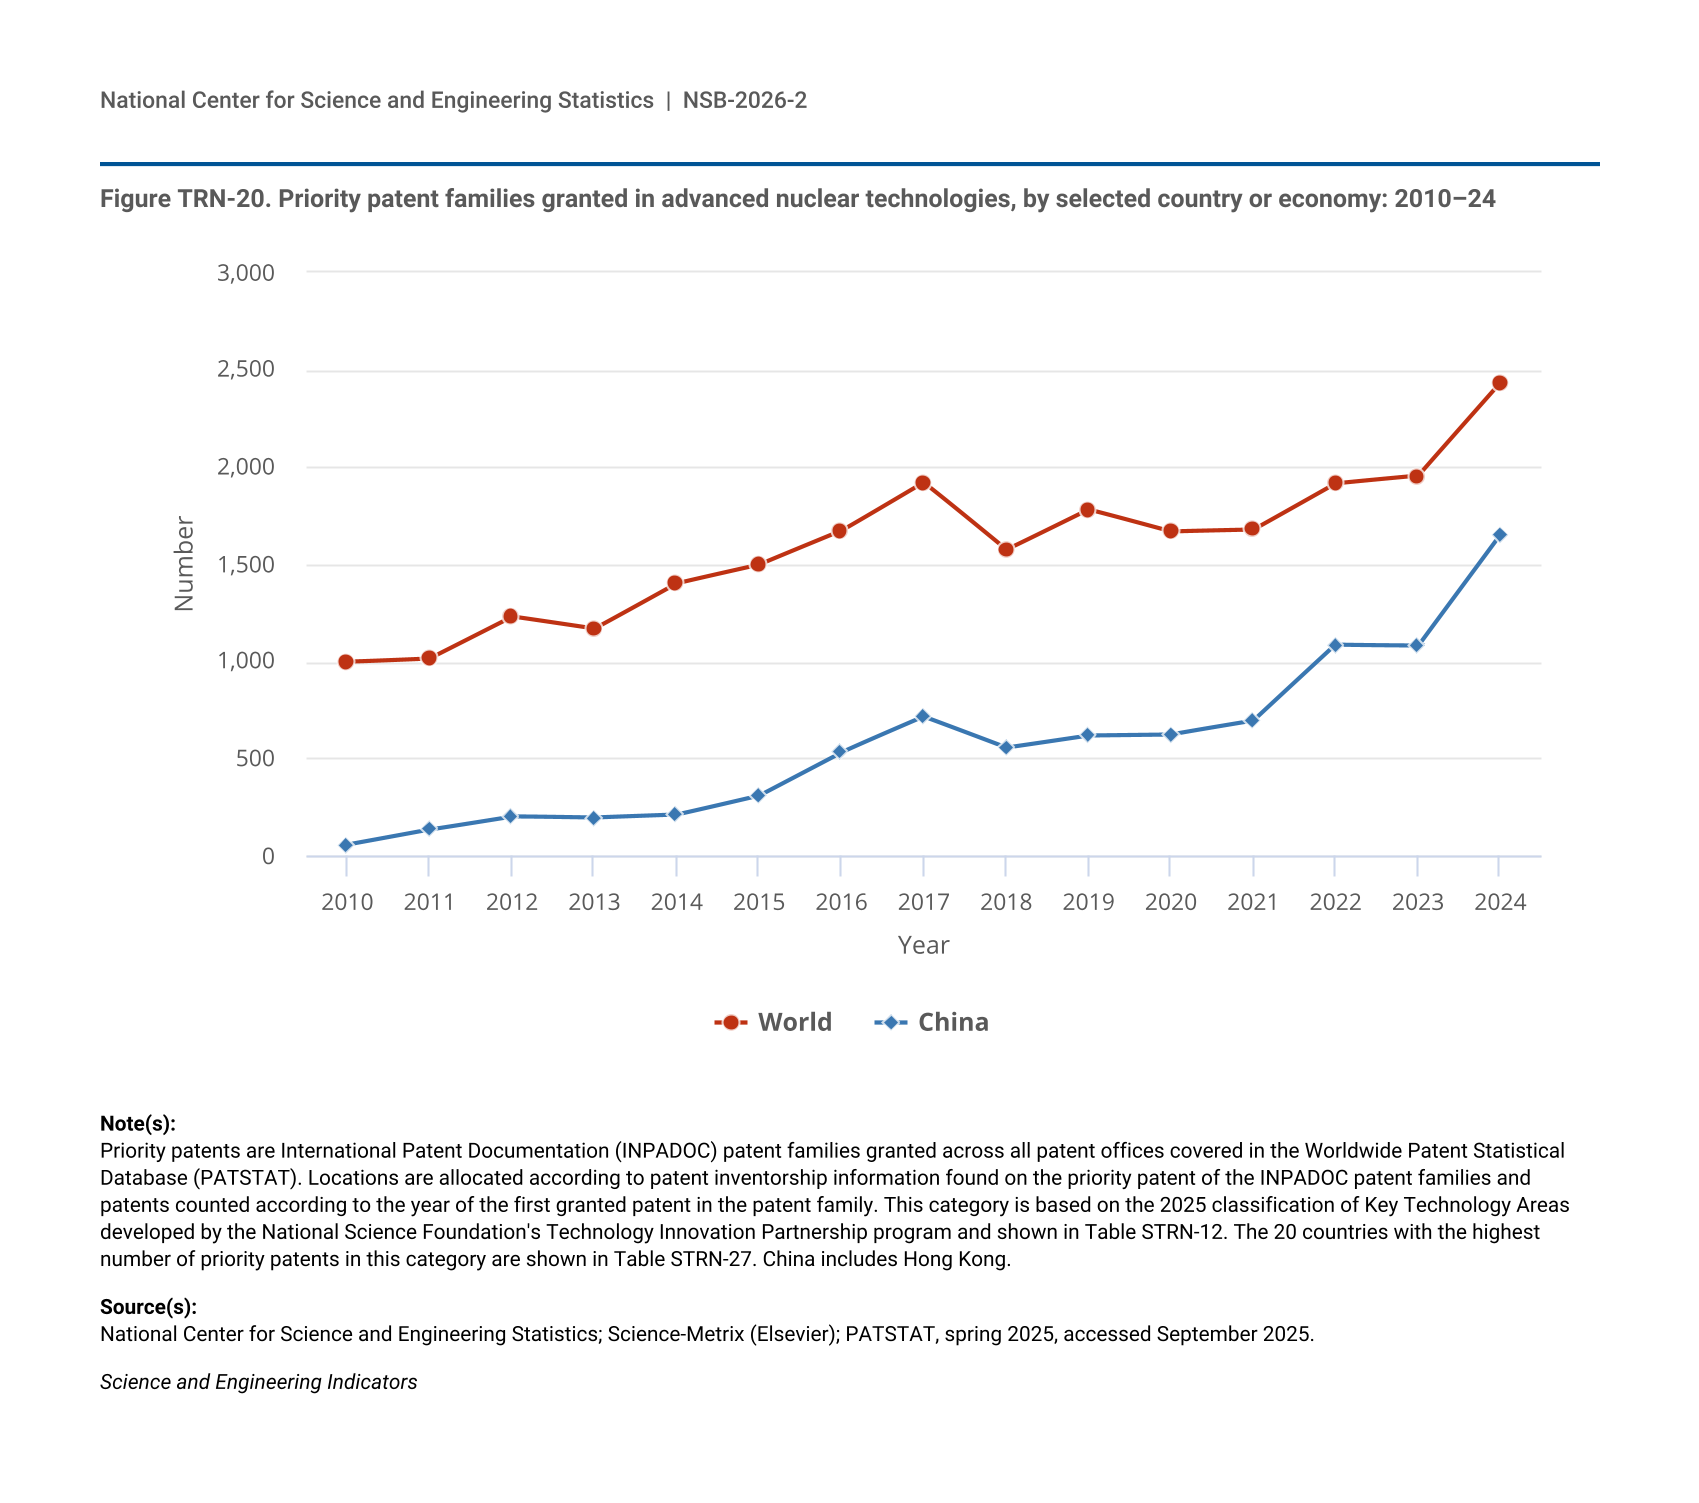
Global Innovation and Patent Landscapes
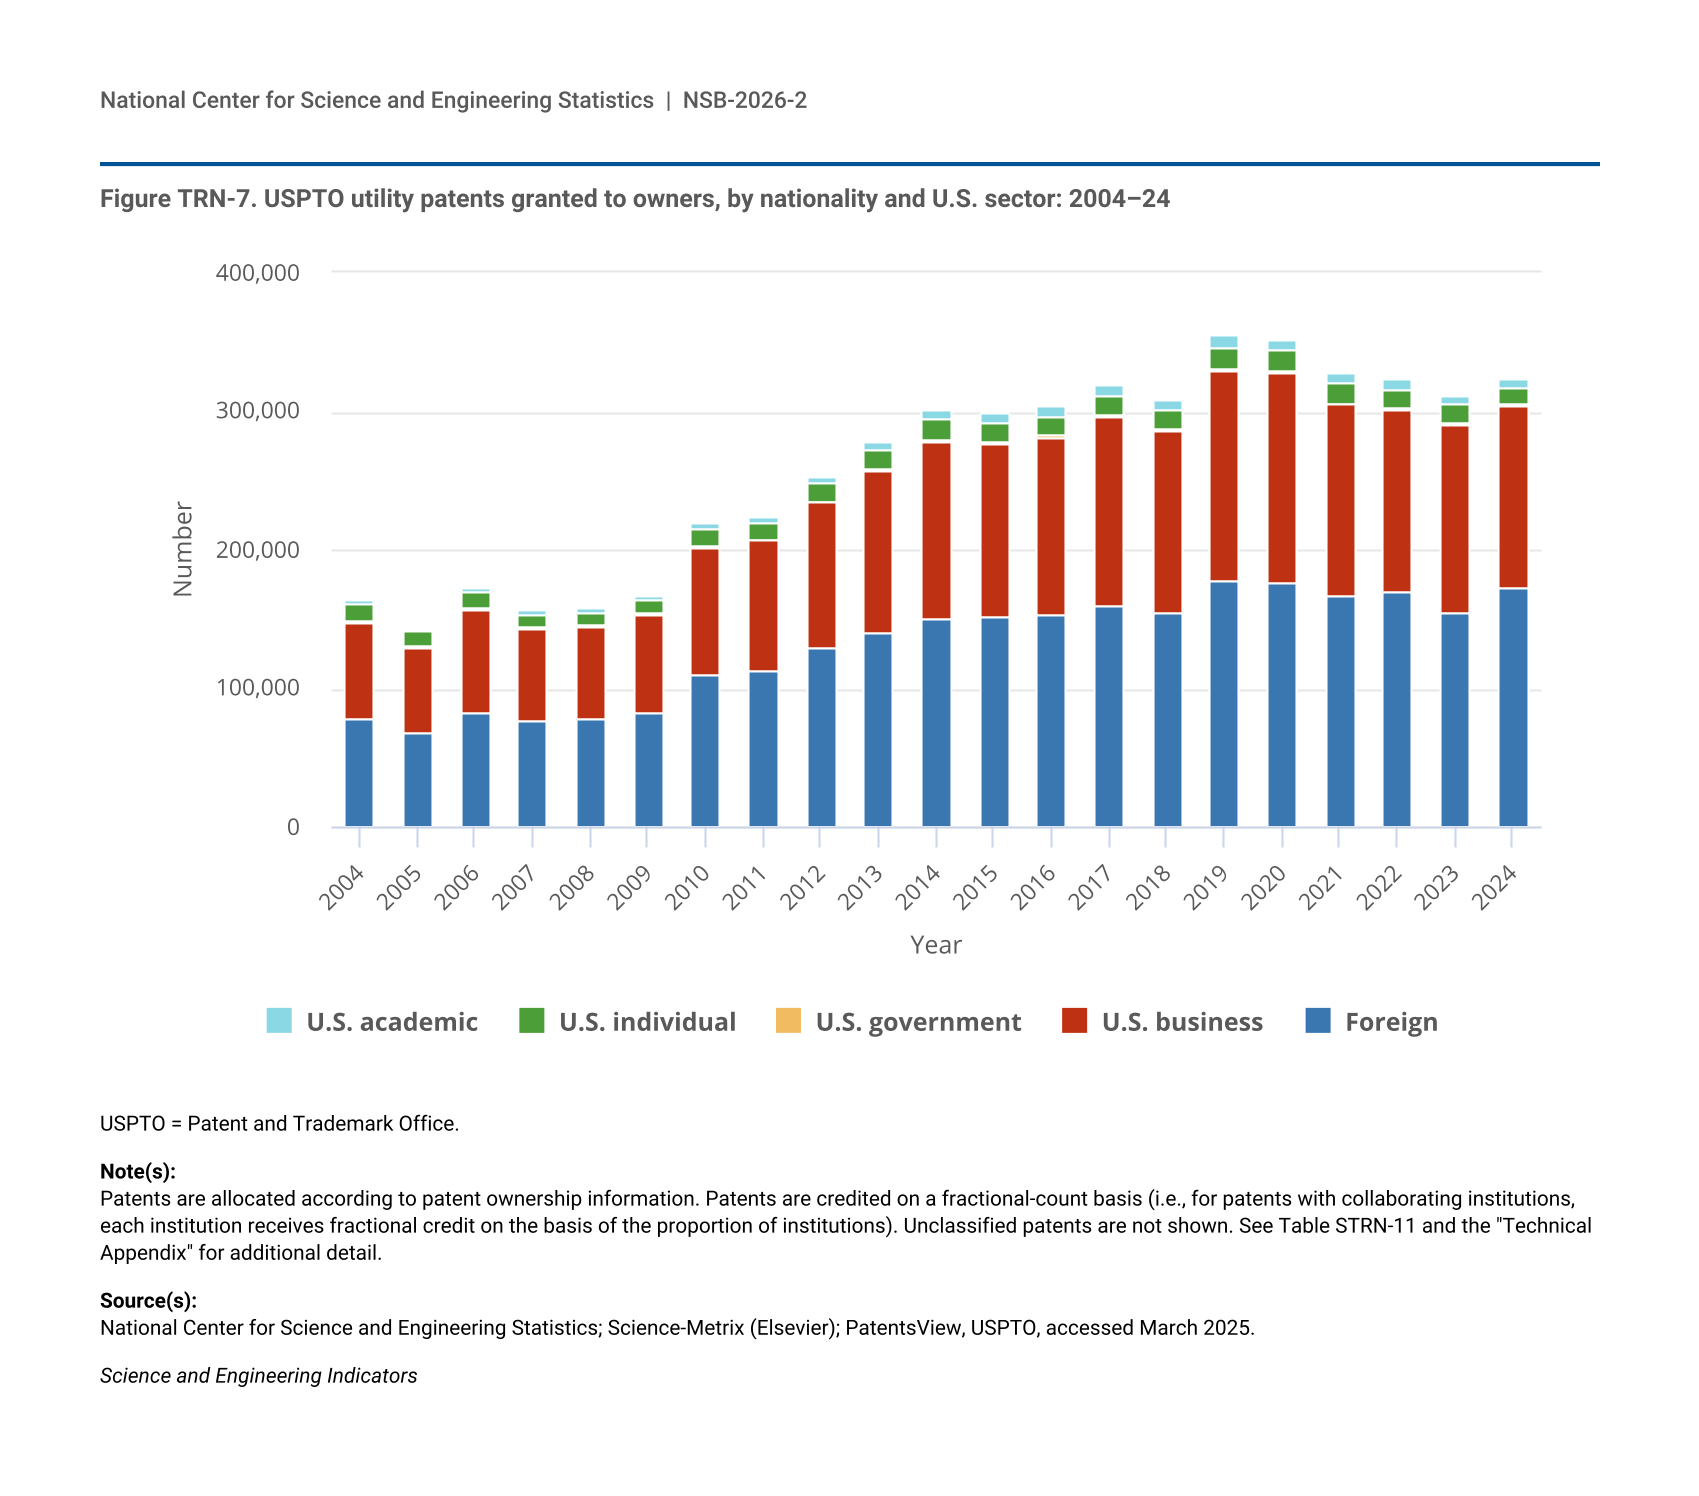
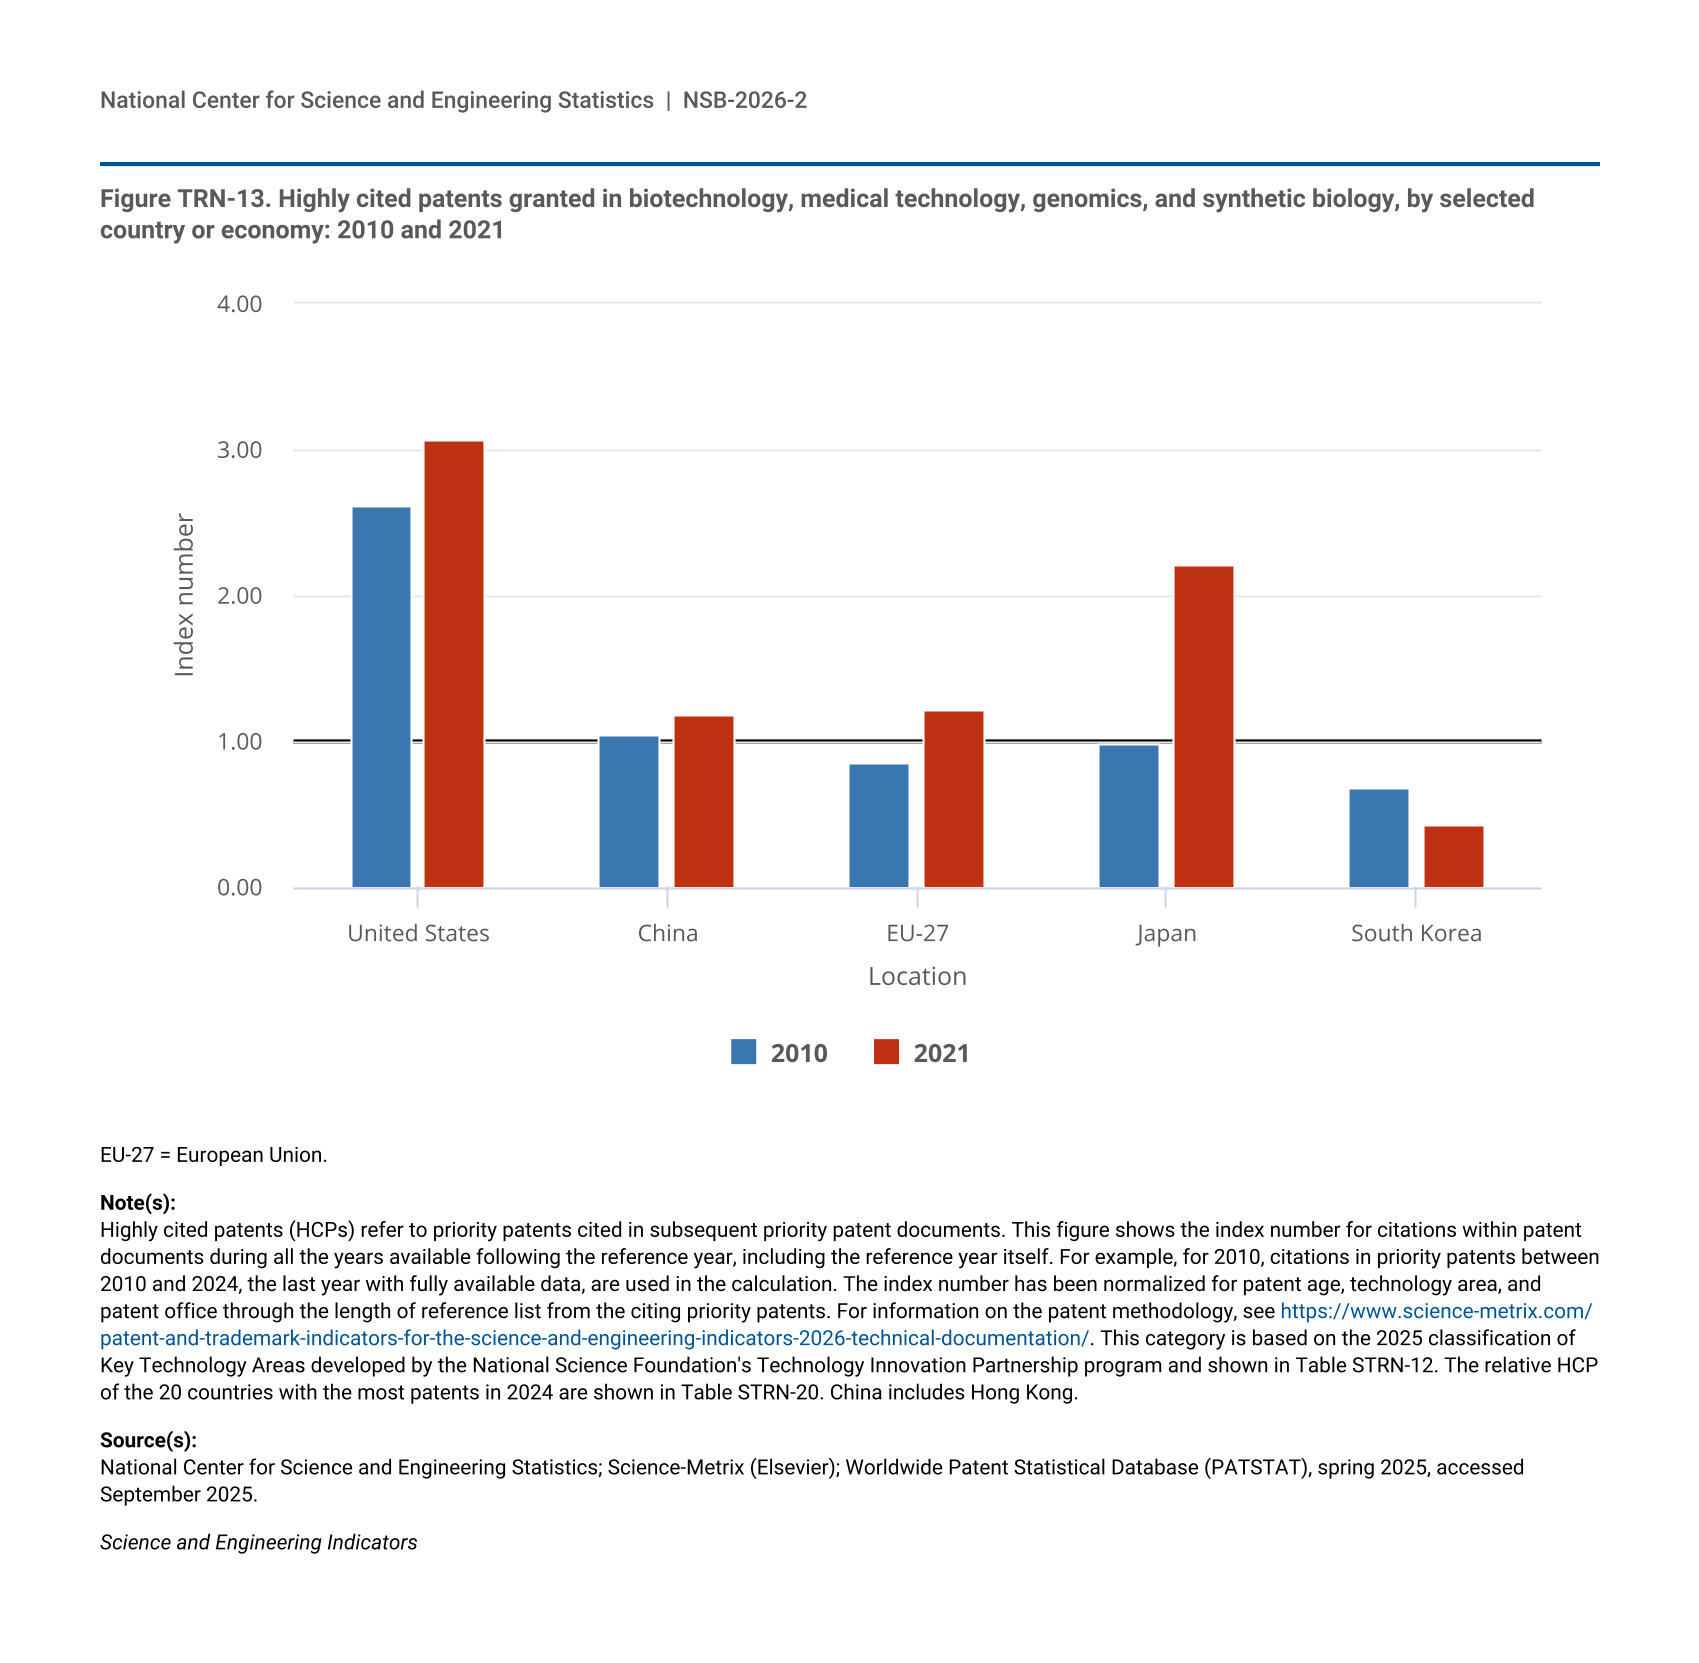
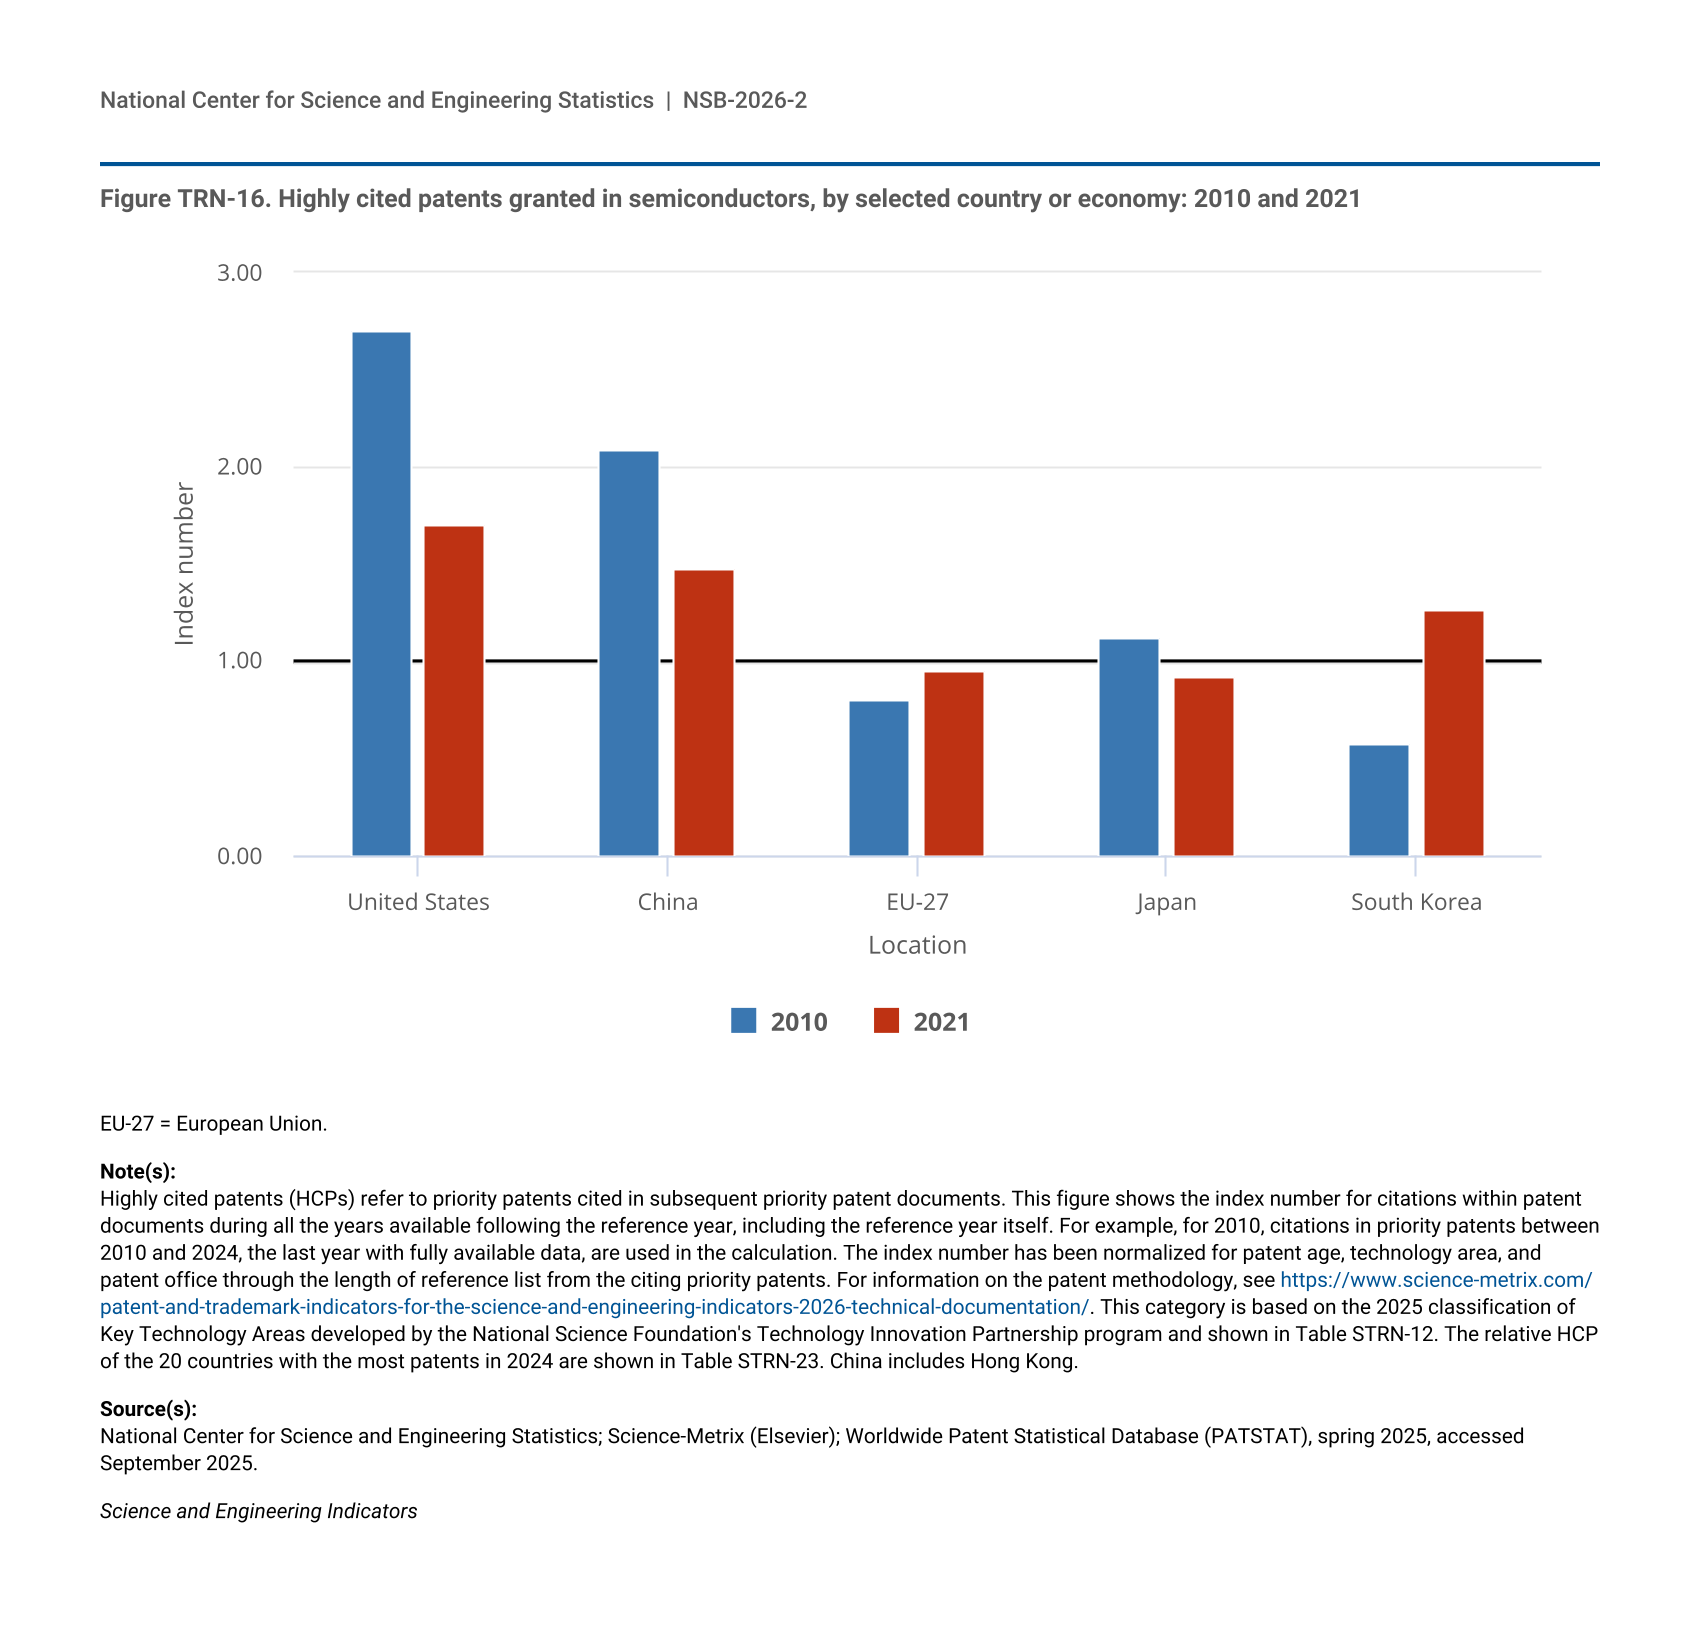
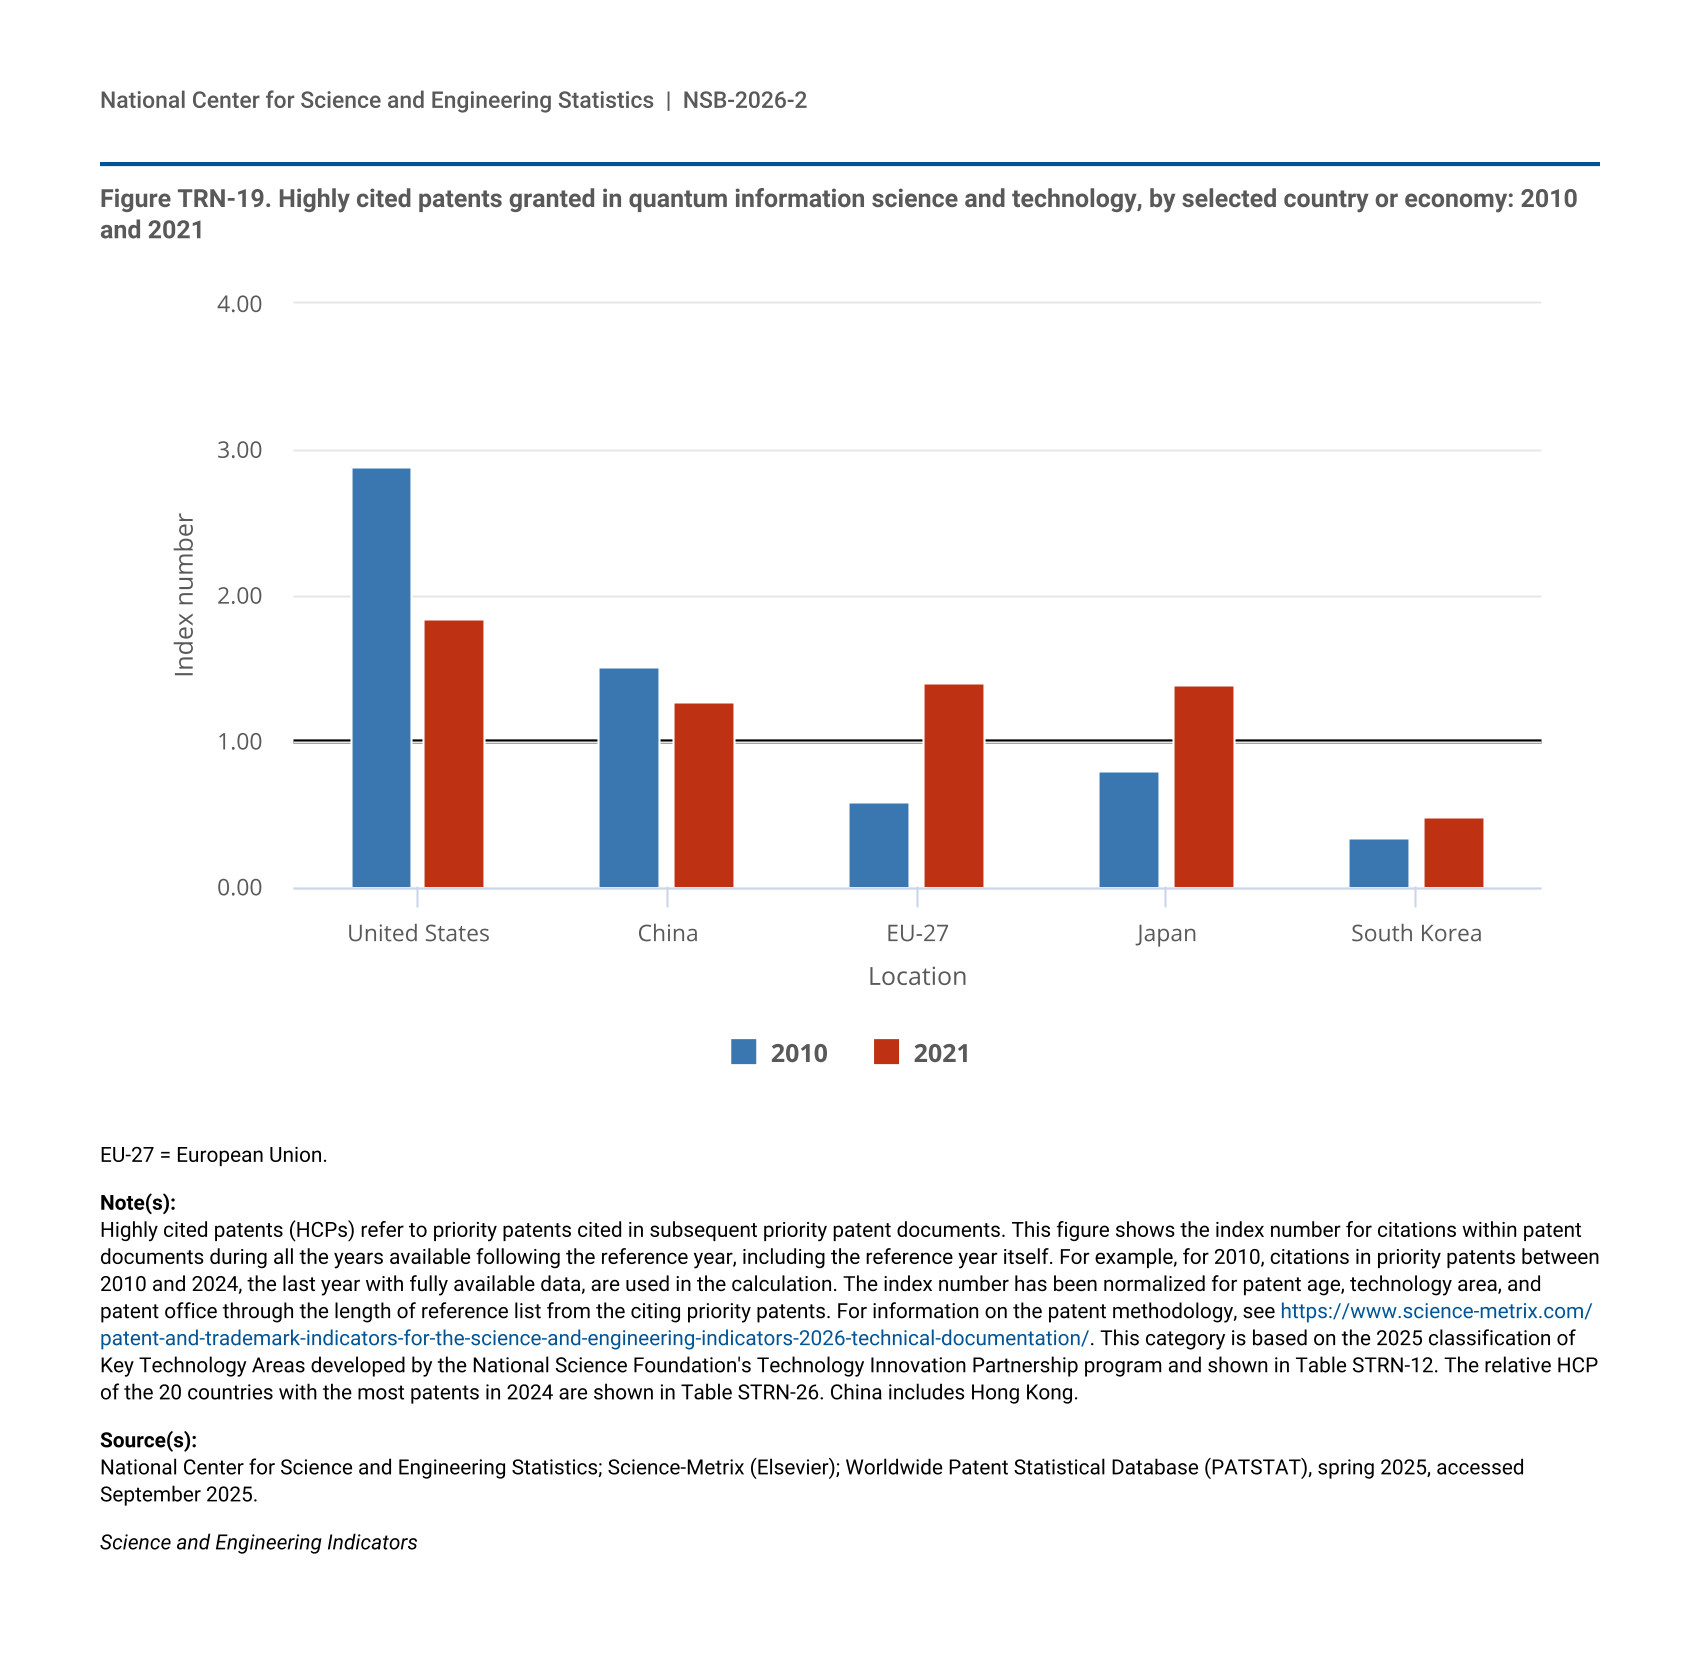
International competition to develop critical technologies is intense, with different regions establishing leadership in specific technologies as evidenced by patterns in U.S. and international patent data. U.S. inventors show particular strength in biotechnology and the biomedical and health sciences, an area with historically high shares of federal government research funding. Citations to both publications and patents provide an indicator of research impact.
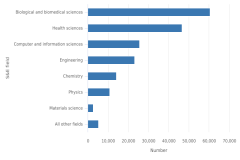
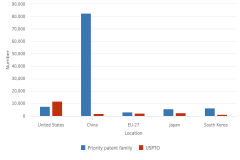
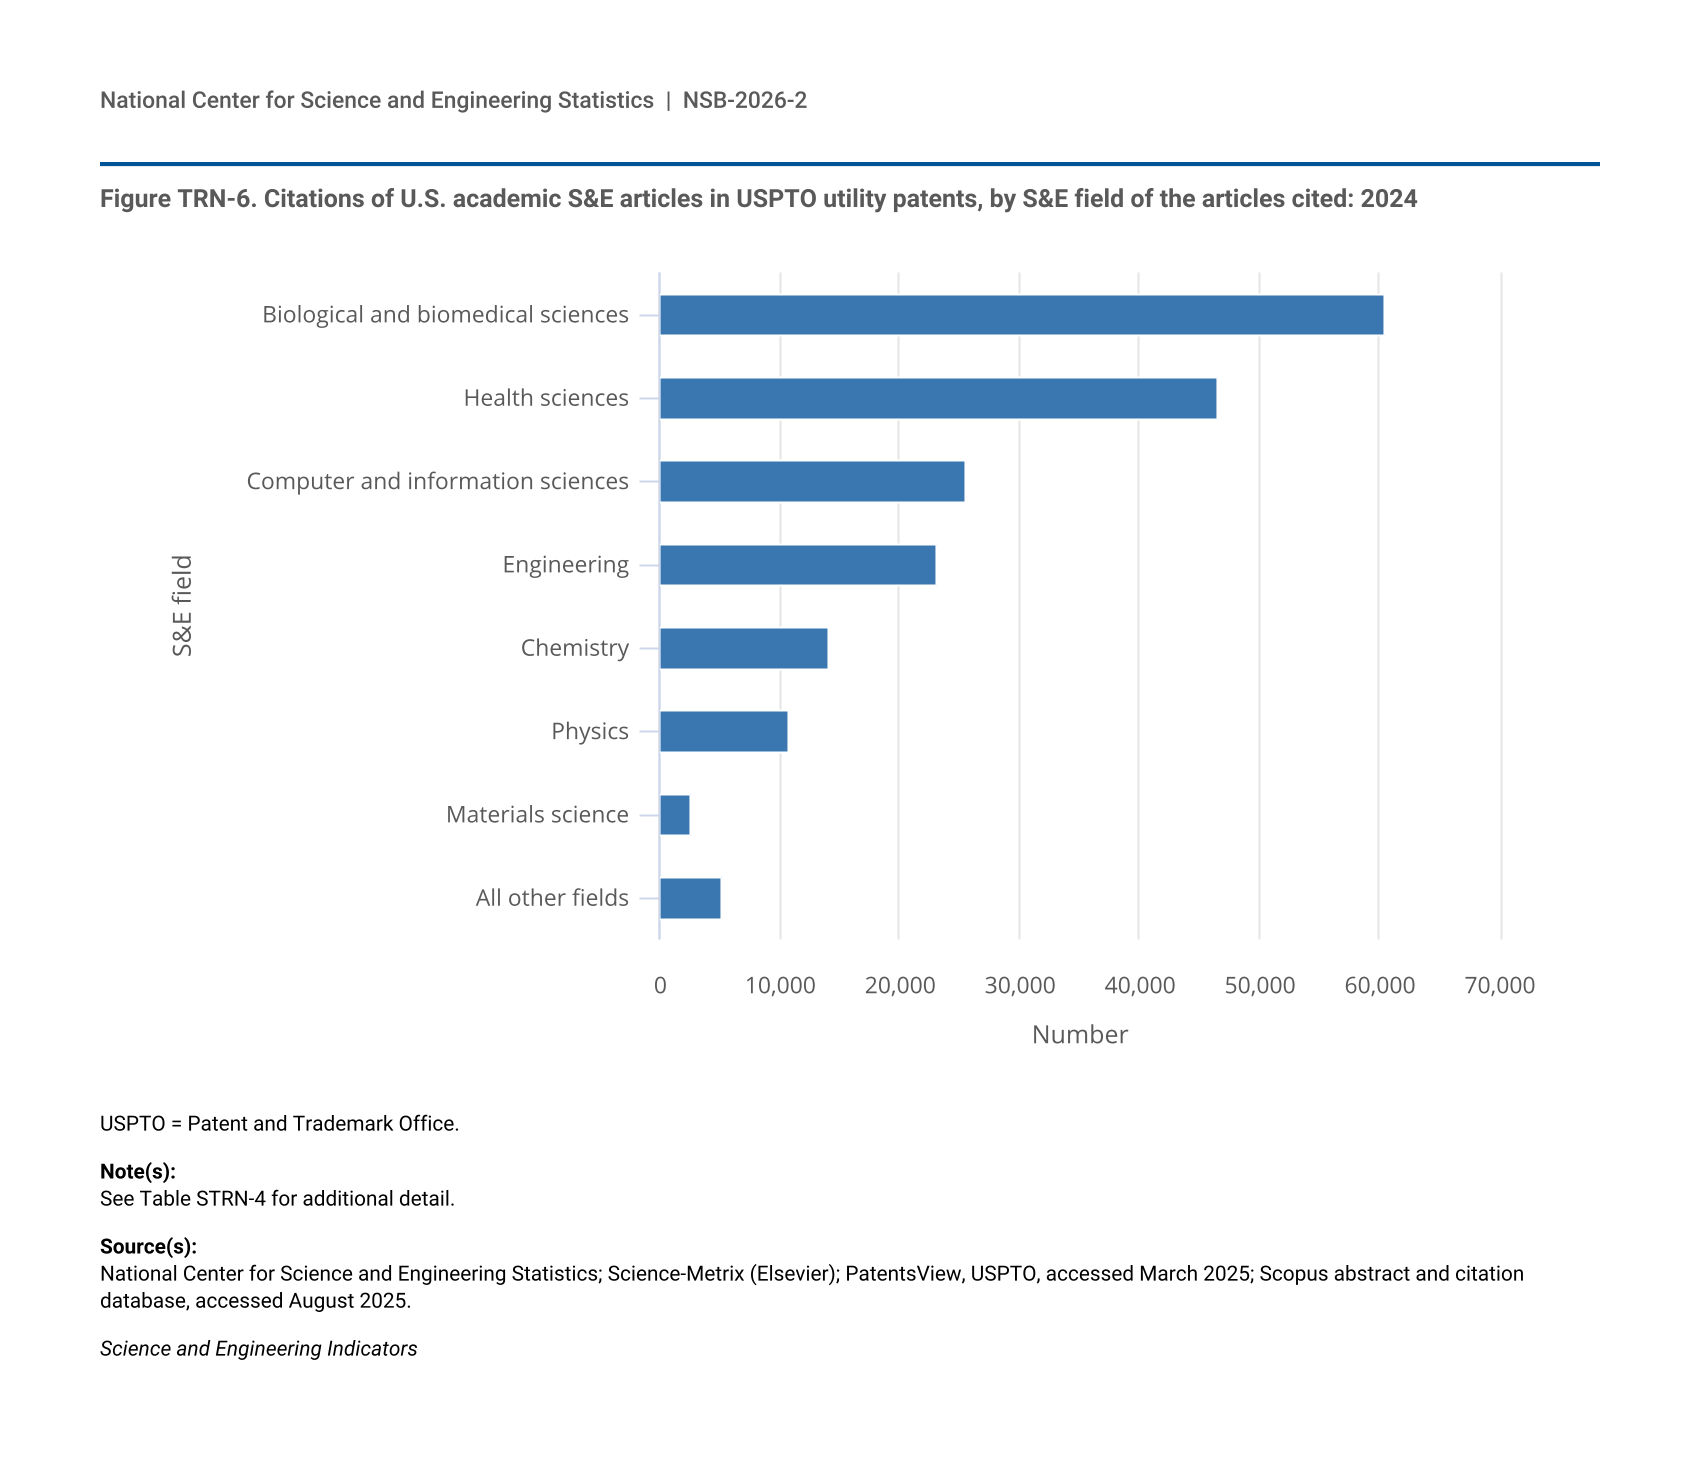
- Articles from the biological and biomedical sciences were cited in Patent and Trademark Office (USPTO) patents more often than articles from any other S&E field in 2024, accounting for 27% of all citations, followed by articles from the health sciences at 23%.
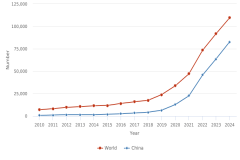
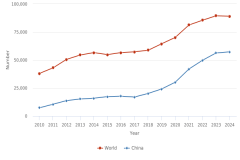
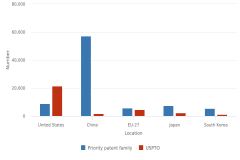
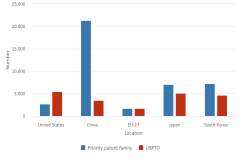
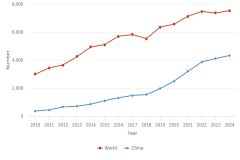
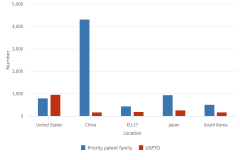
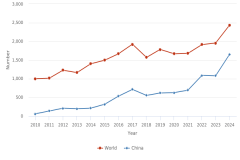
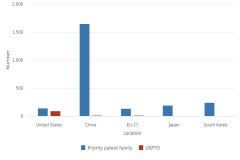
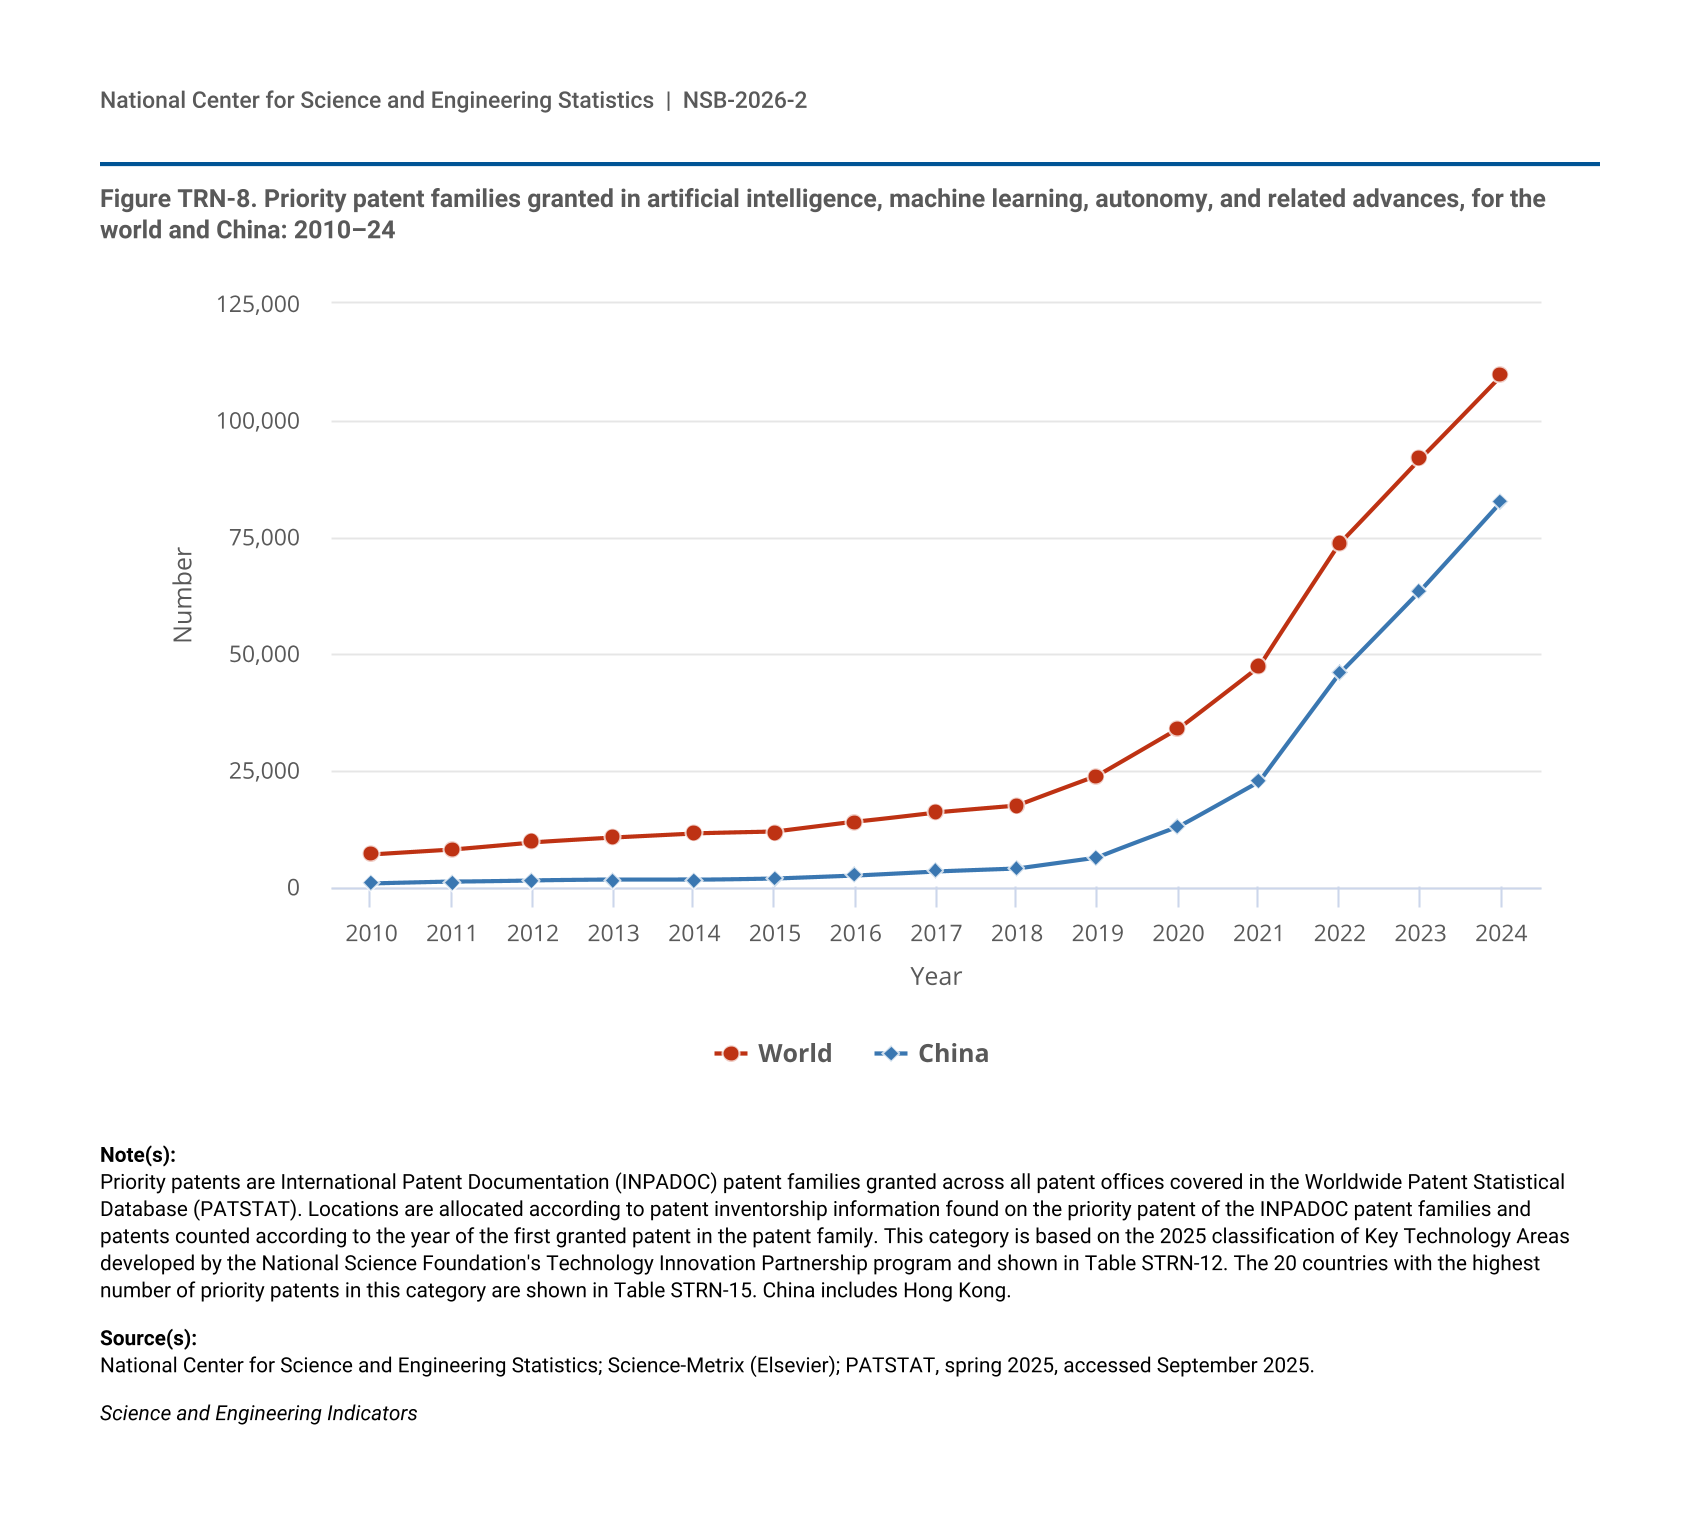
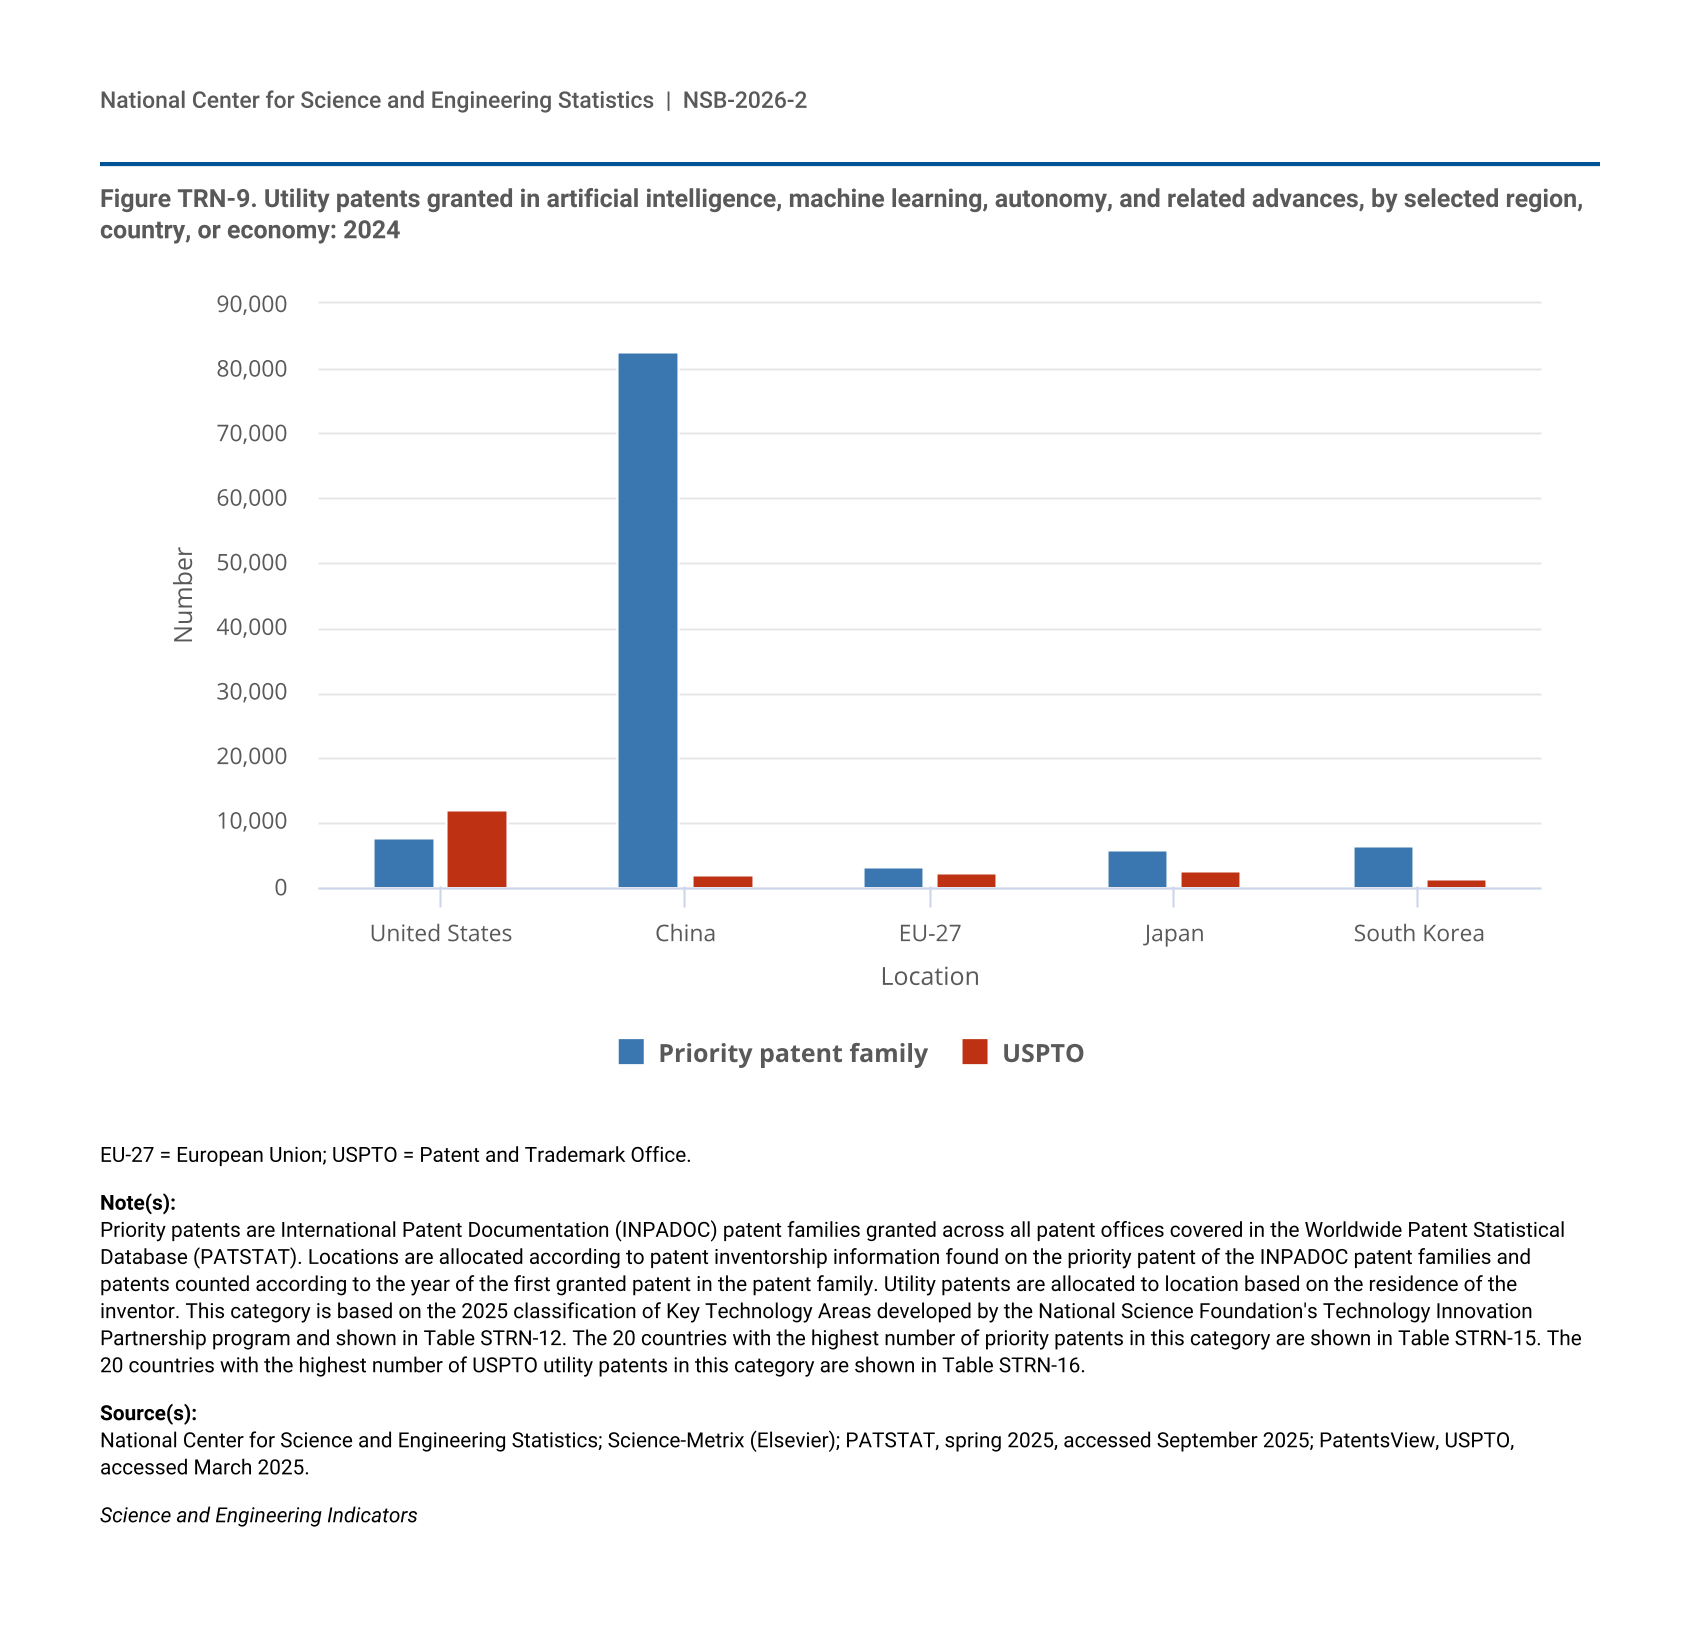
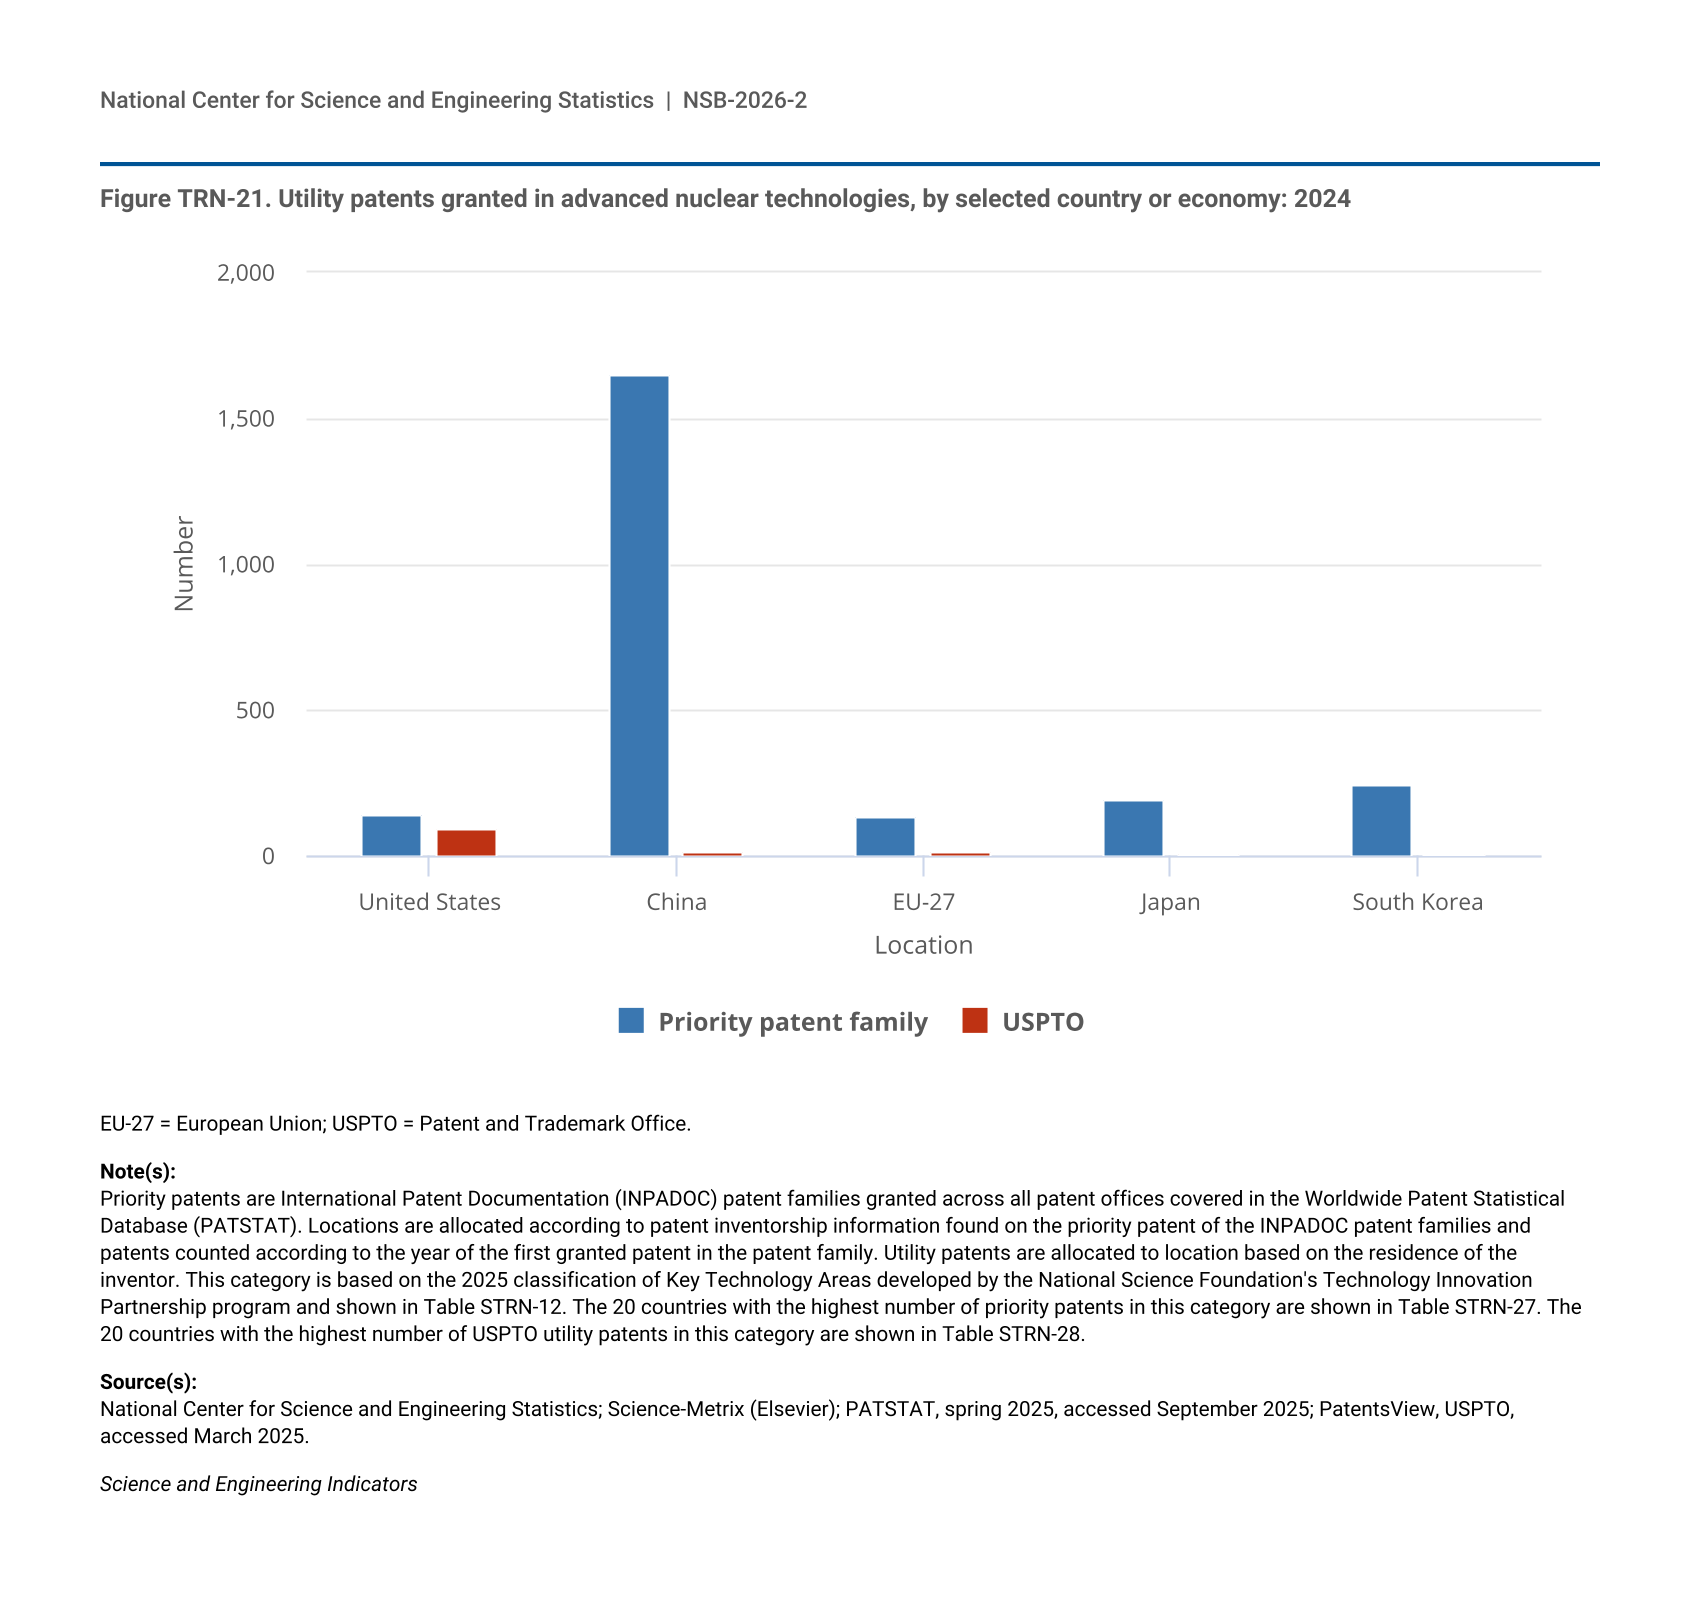
- Priority patent data are an international data source that allows each patented innovation to be counted once as a priority patent family, based on the first filing globally. Inventors from China attributed the largest number of AI priority patent families, averaging three-fourths (75%) of the patents granted in AI technologies in 2024.
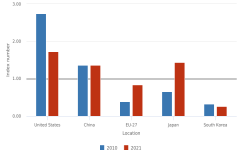
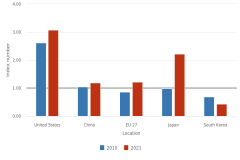
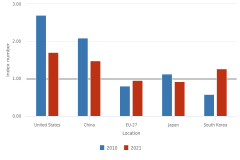
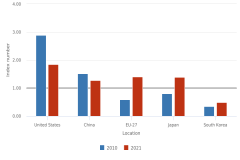
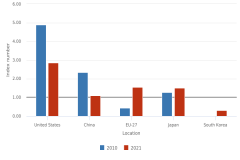
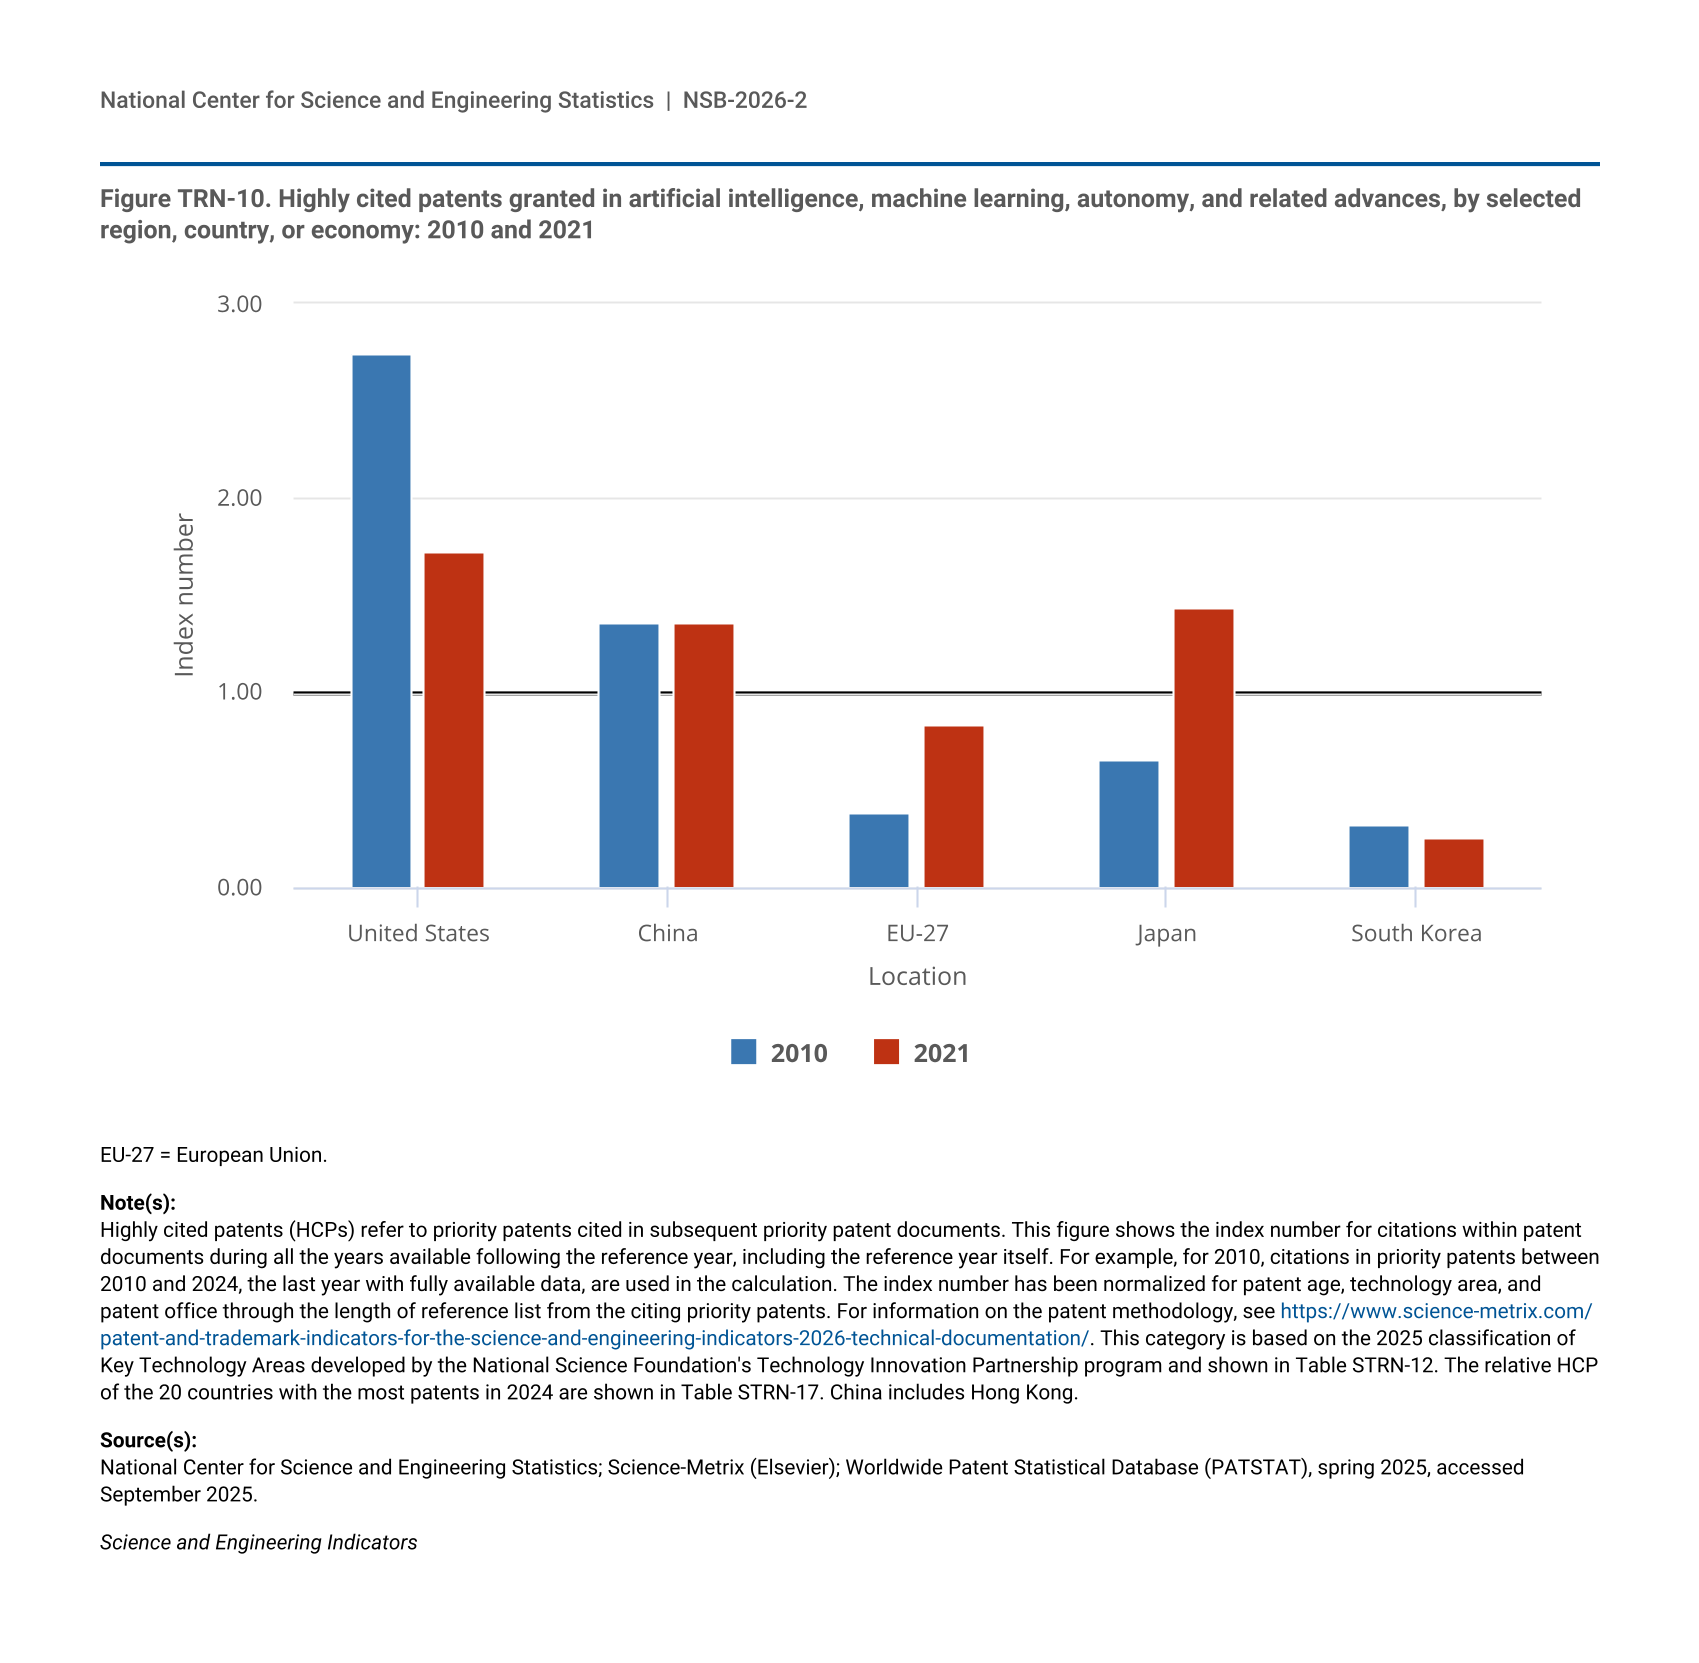
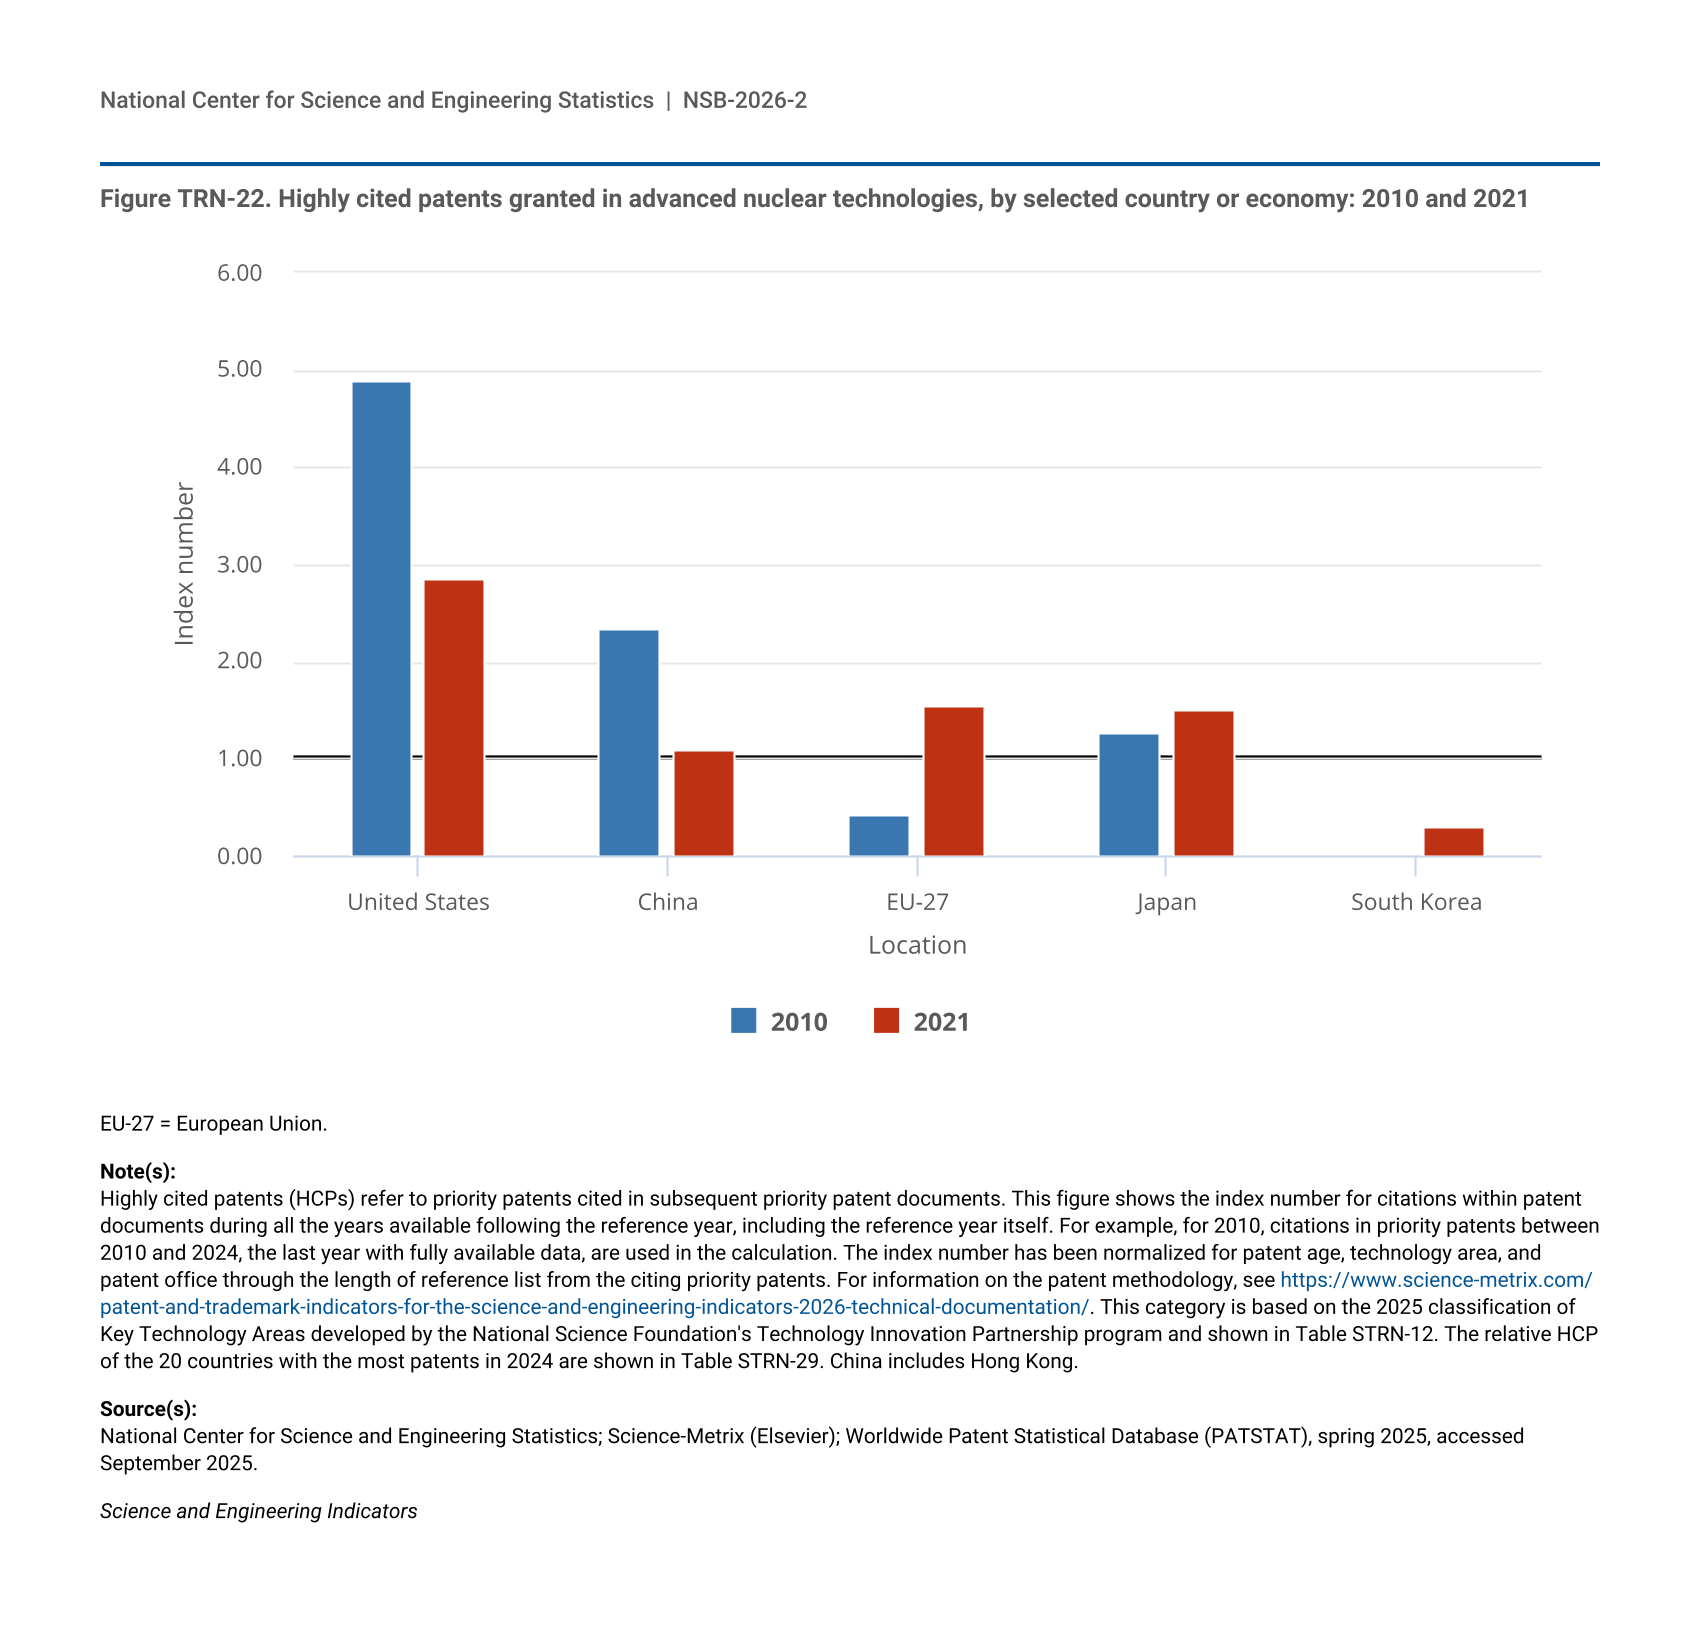
- Patents granted to U.S. inventors in biotechnology and related technologies consistently have high impact, as measured by the share of these priority patent families in the top 1% of all cited priority patent families. The highly cited patent (HCP) share for U.S. inventors has risen from 2.6% in 2010 to 3.1% in 2021. As inventive activity spreads across the globe, the HCP share for U.S. inventors in AI had decreased from 2.7% of the top 1% list in 2010 to 1.7% in 2021.
Global Market Dynamics and Investment Patterns
International market dynamics, the location of production capabilities, and collaborative networks reflect the evolving geography of technical innovation and economic competitiveness in a global economy.
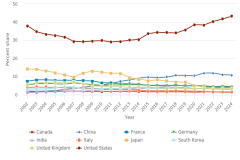
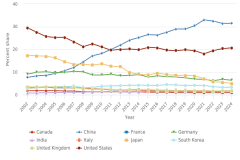
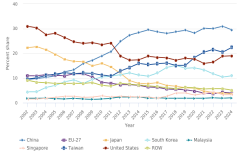
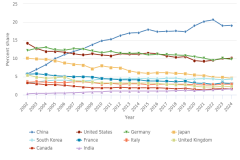
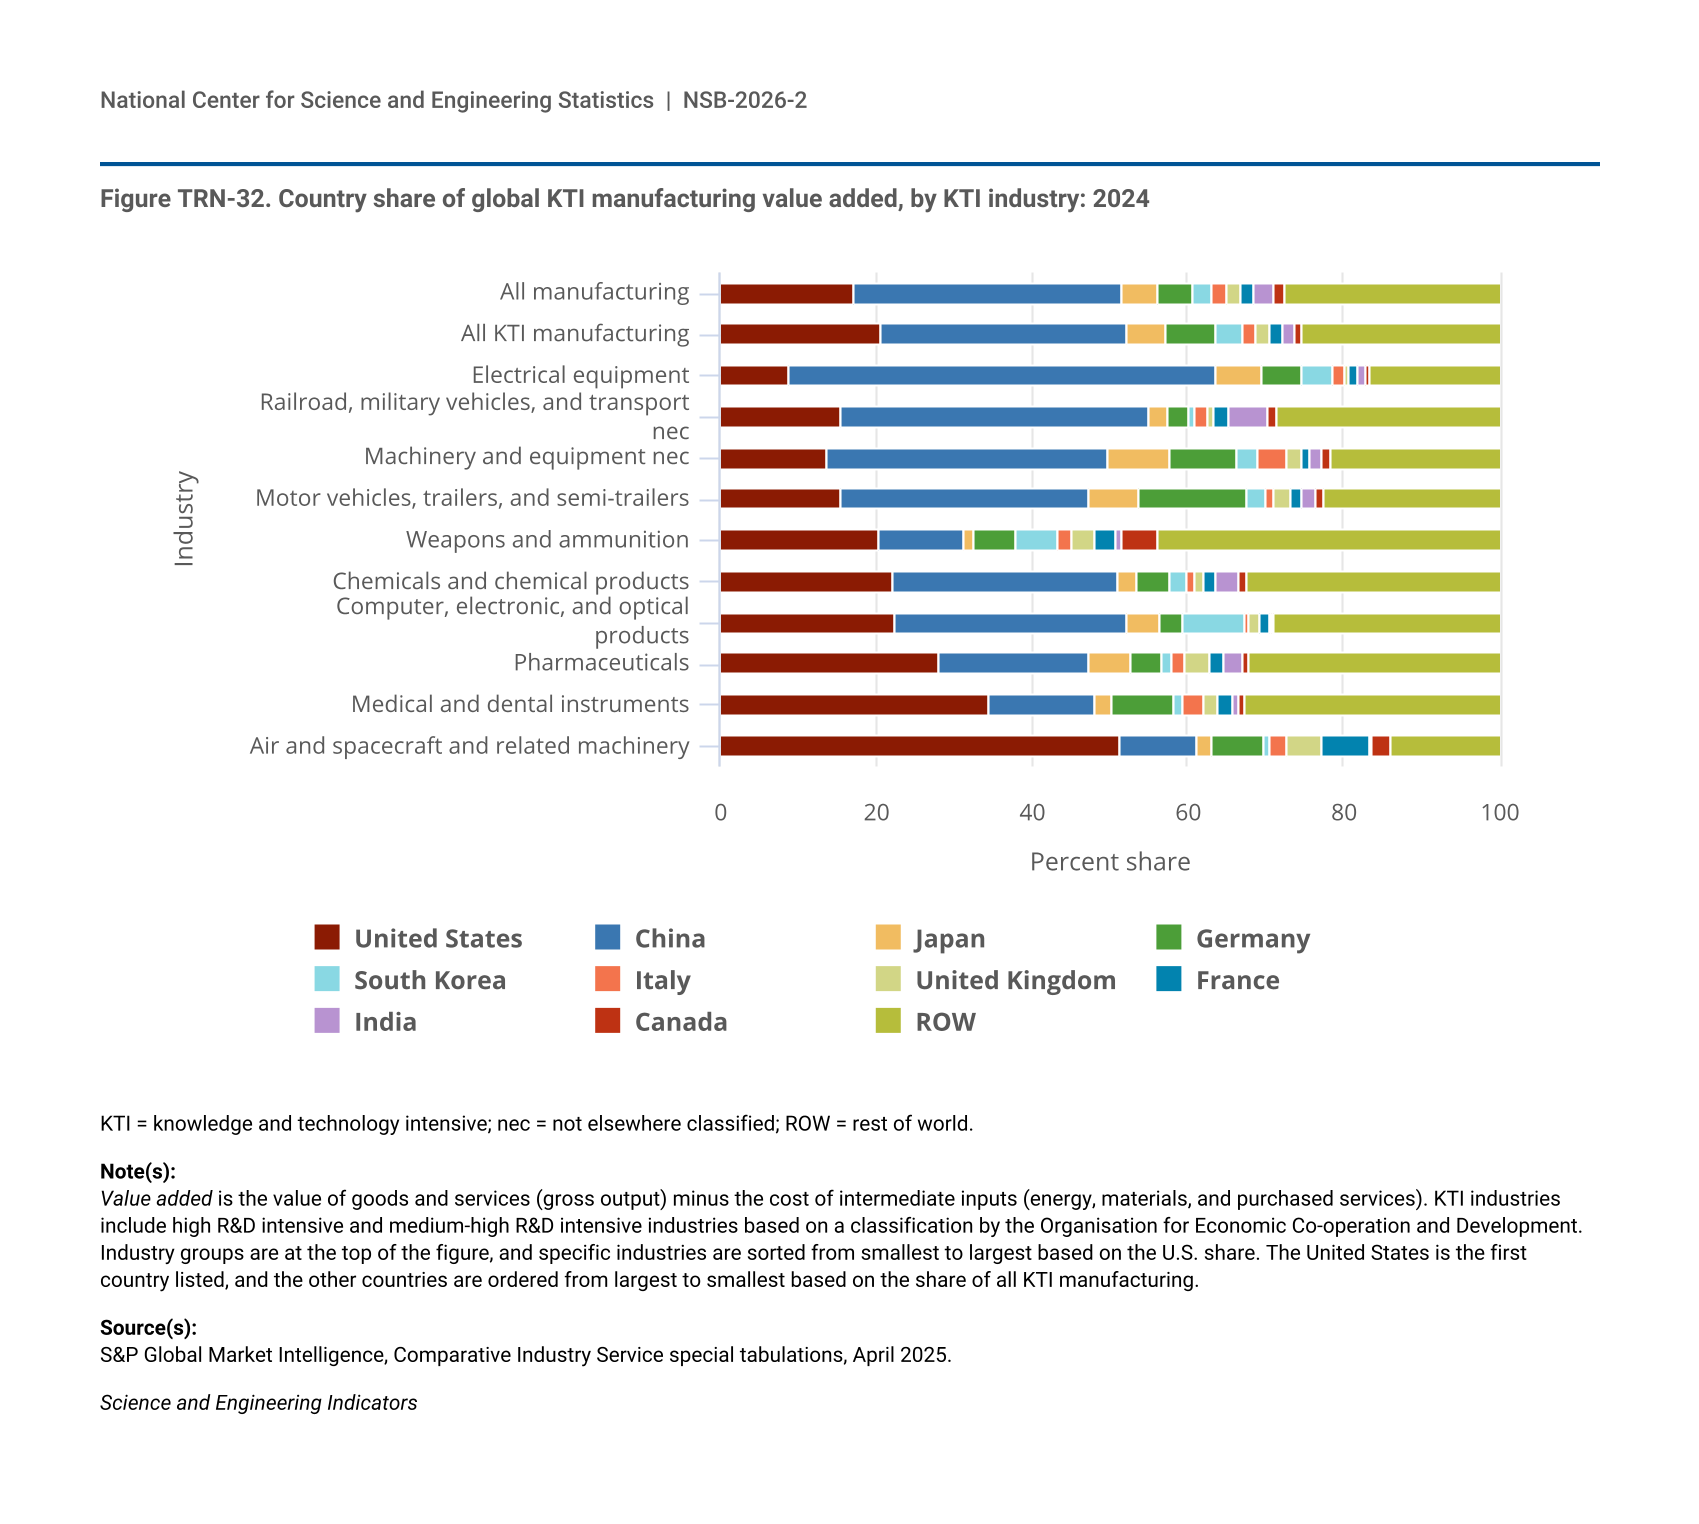
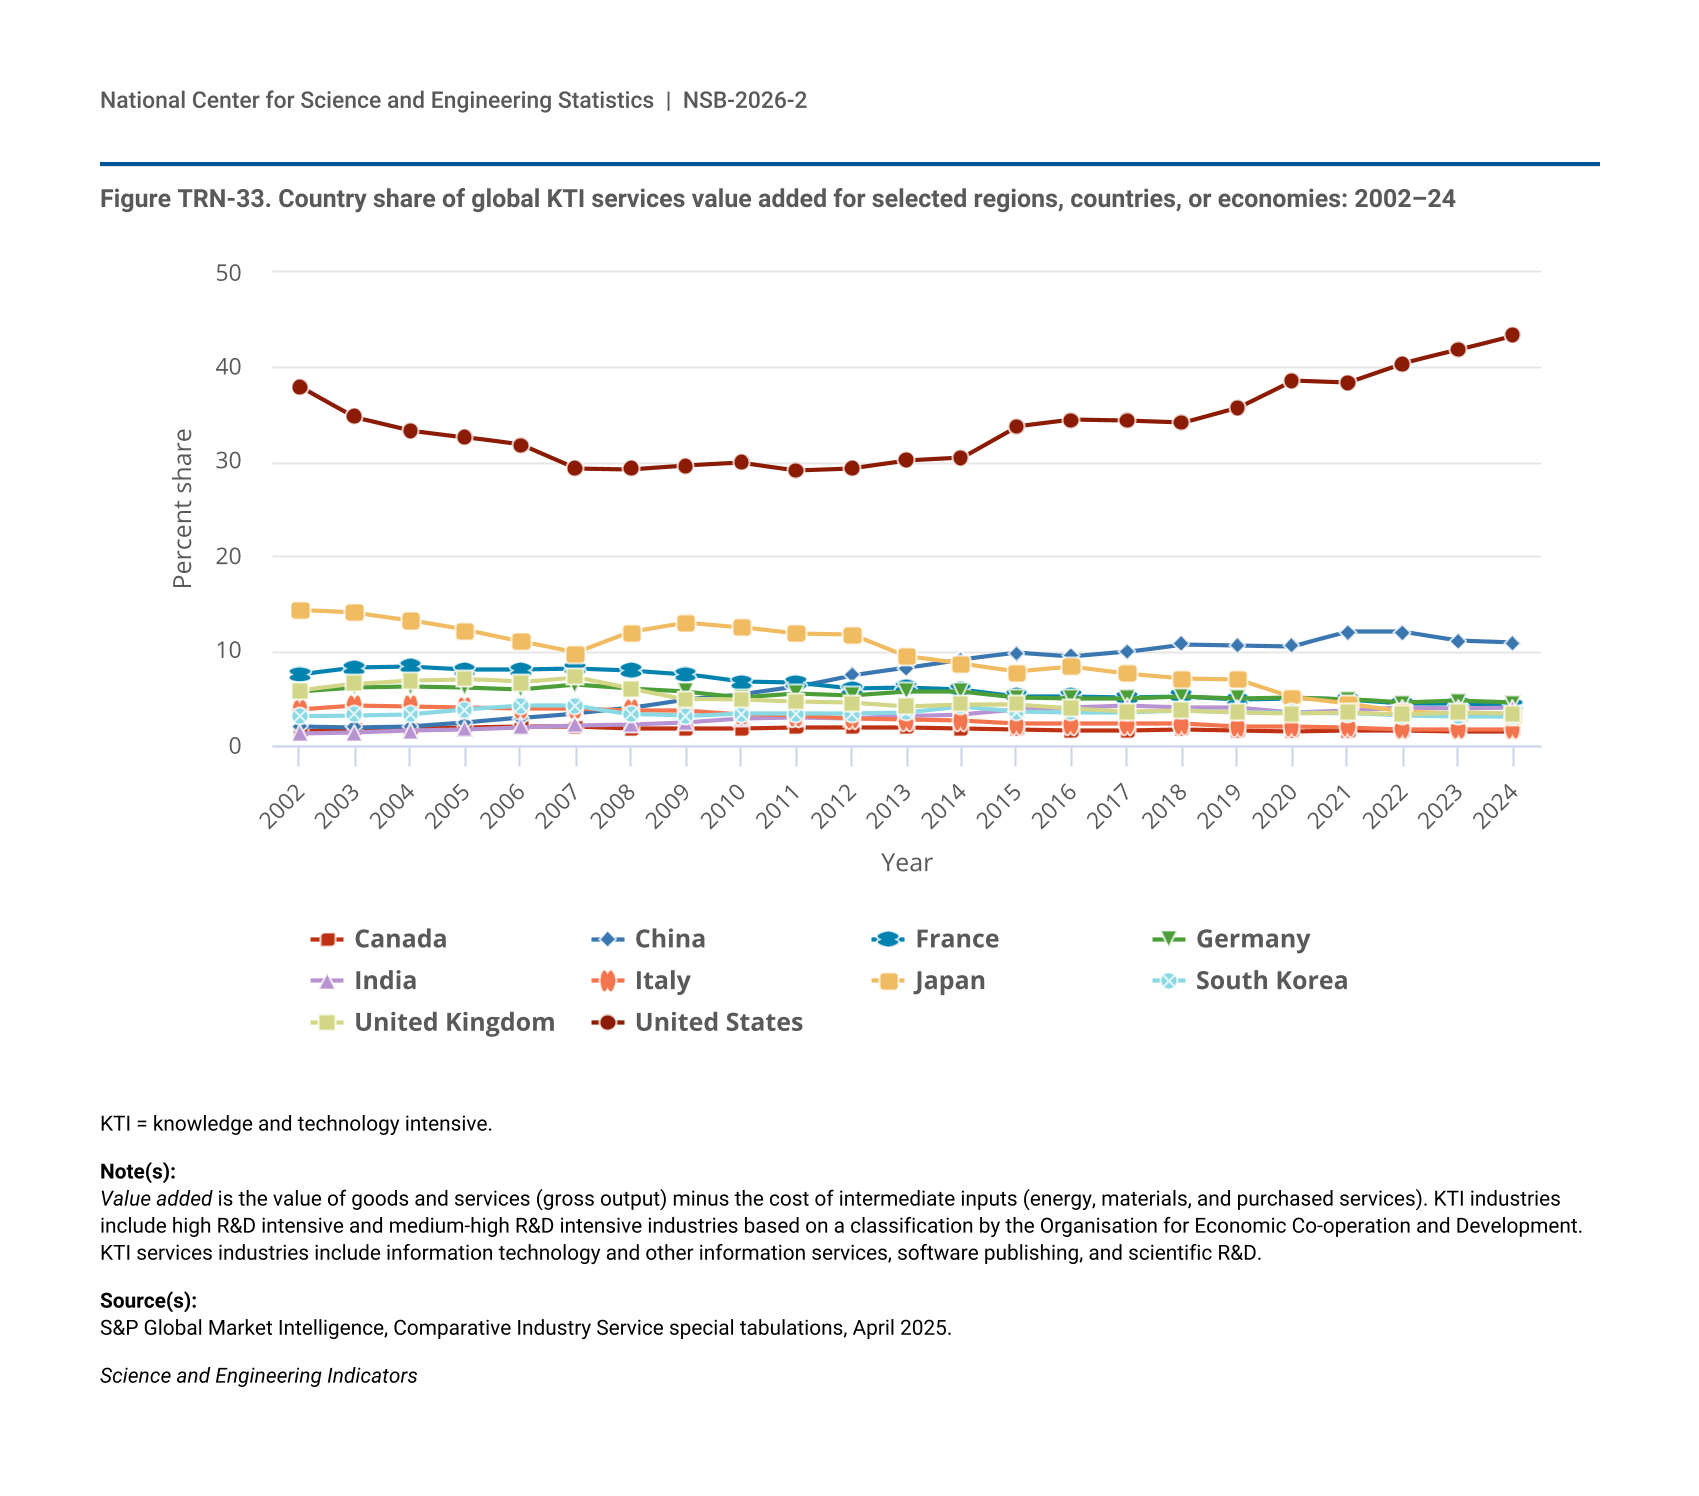
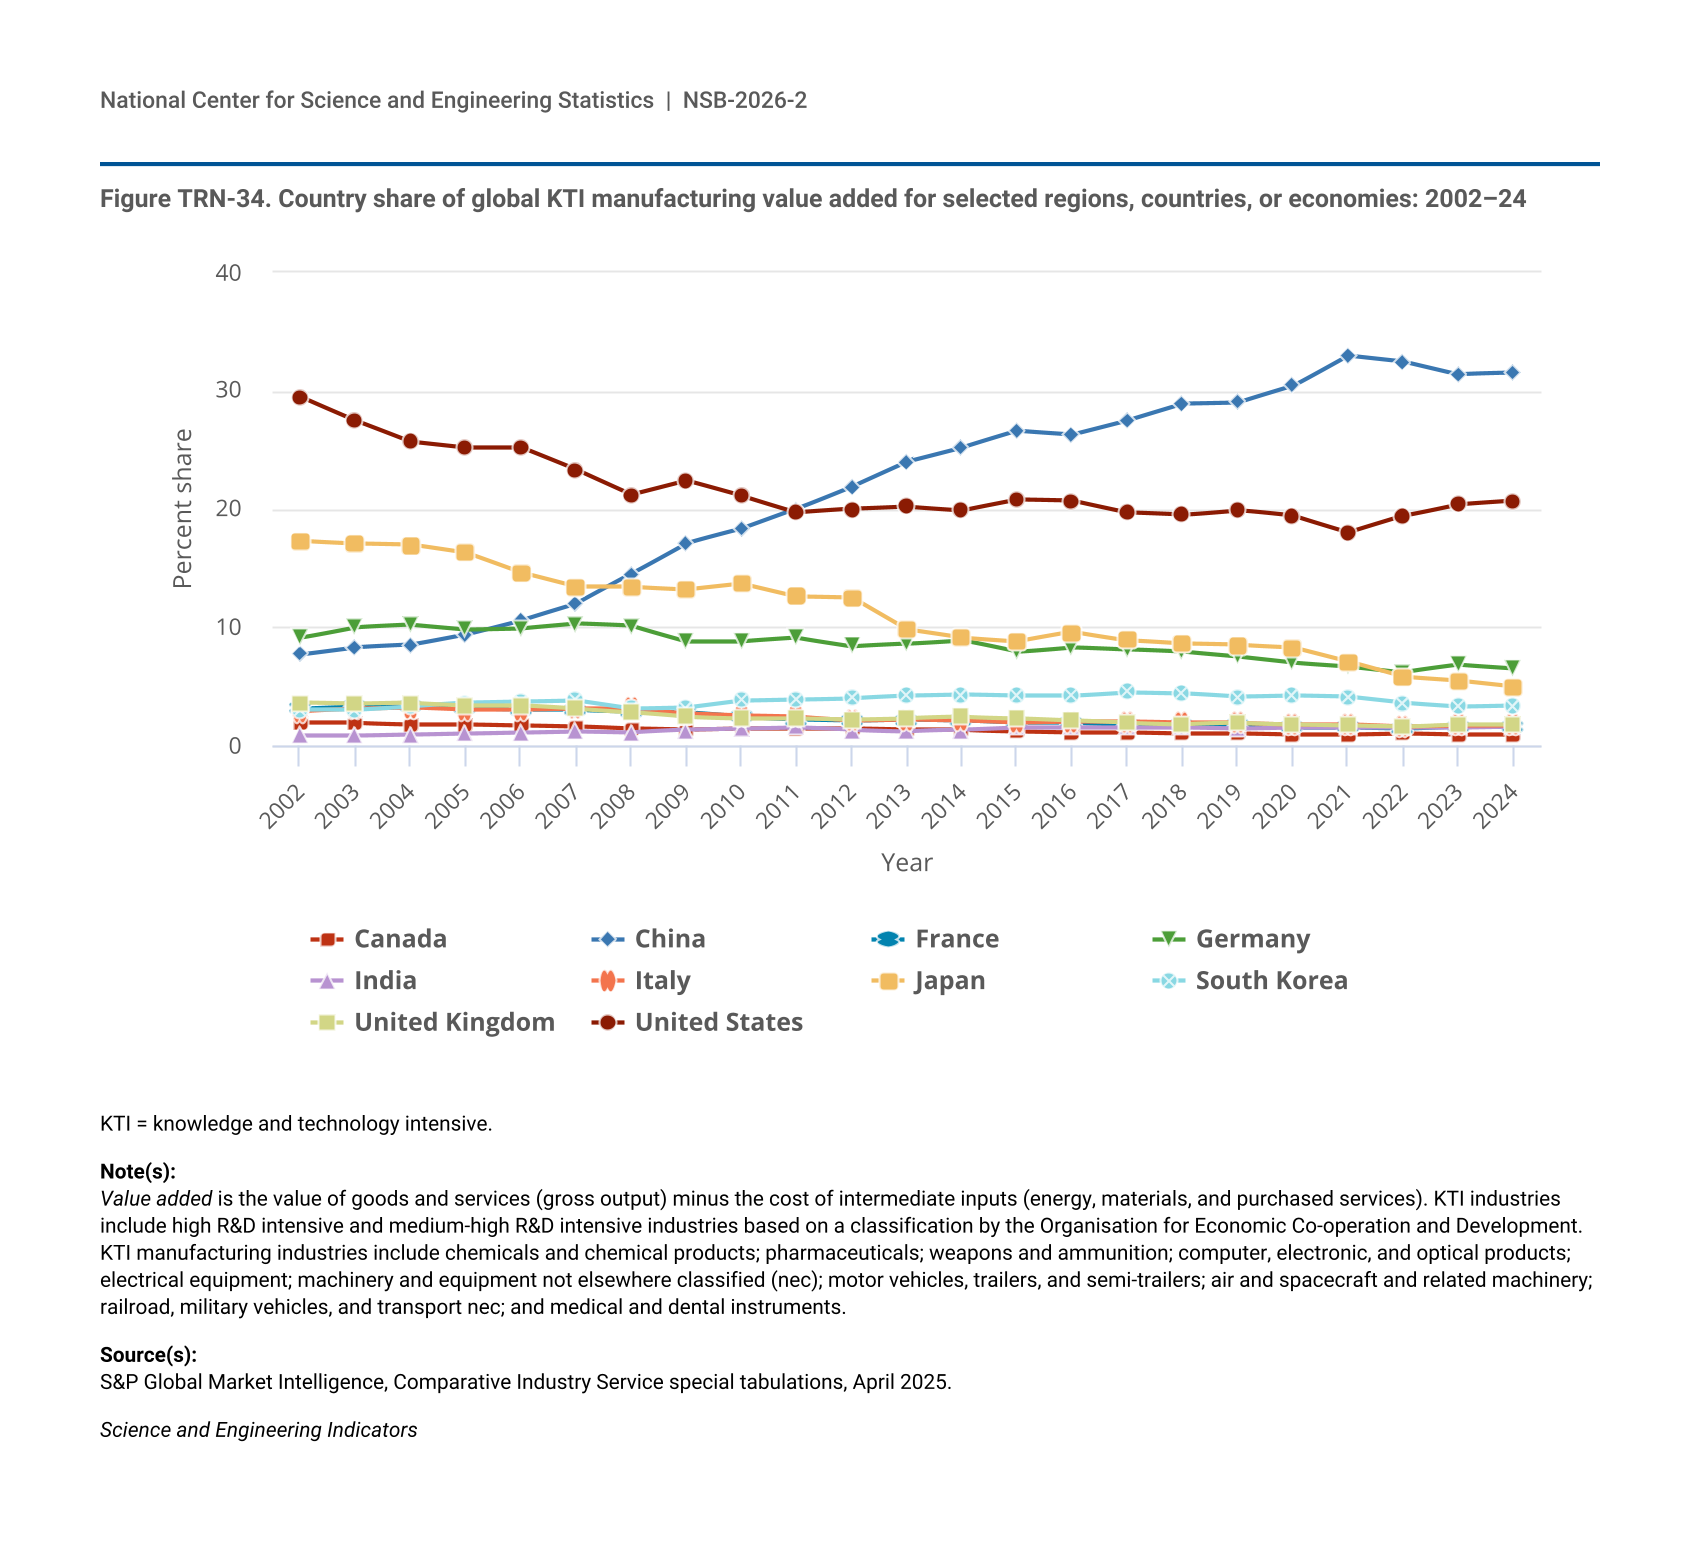
- The United States, China, the European Union (EU-27), Japan, and South Korea accounted for about 80% of global KTI value added in 2024. The United States and China were the top two overall producers of KTI output in 2024, with $3.3 trillion (or 28%) and $2.9 trillion (or 25%), respectively.
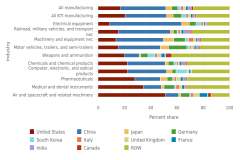
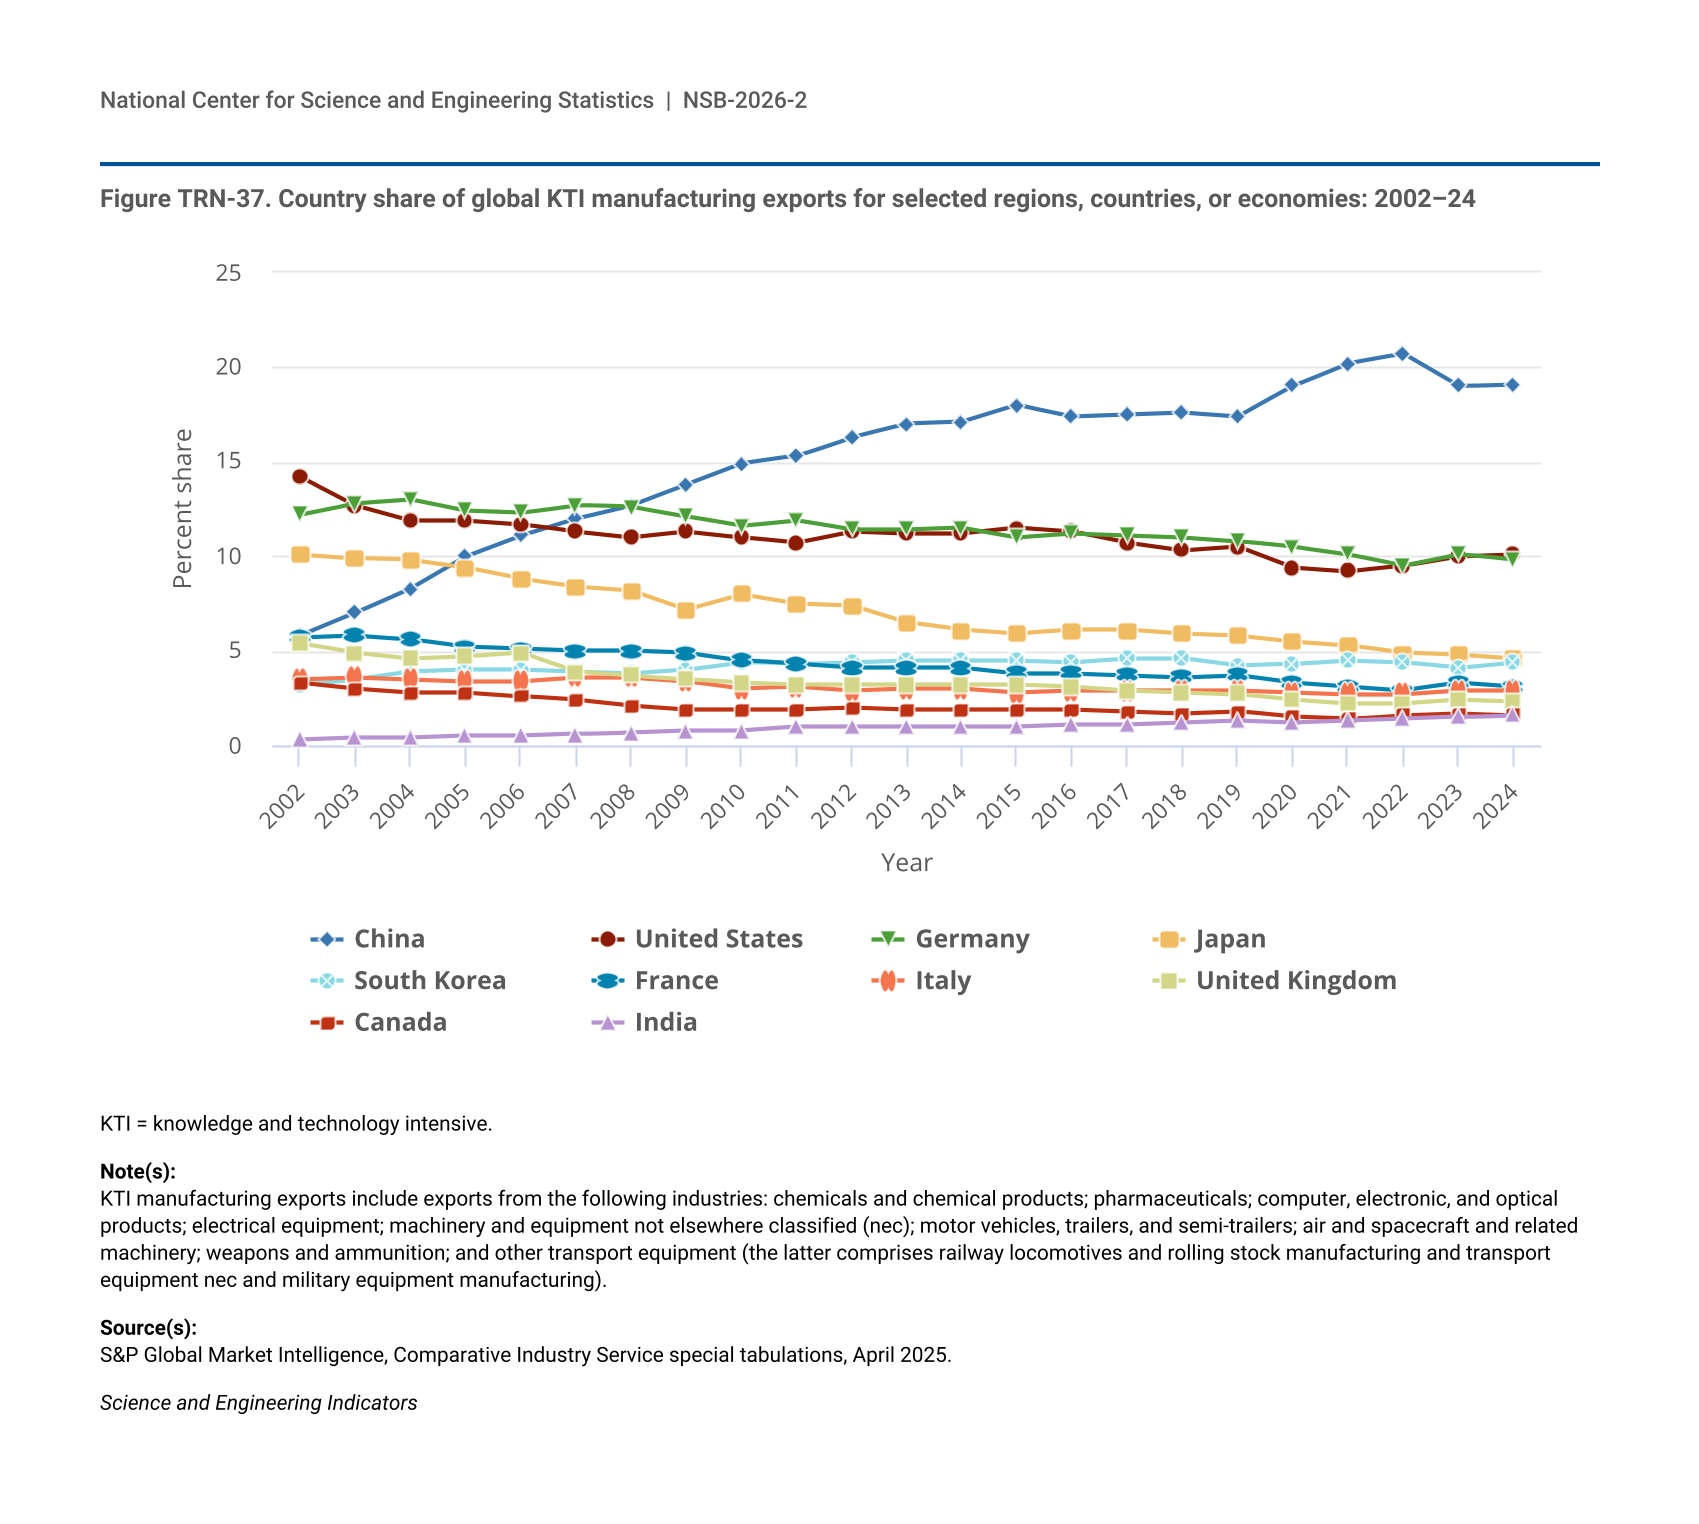
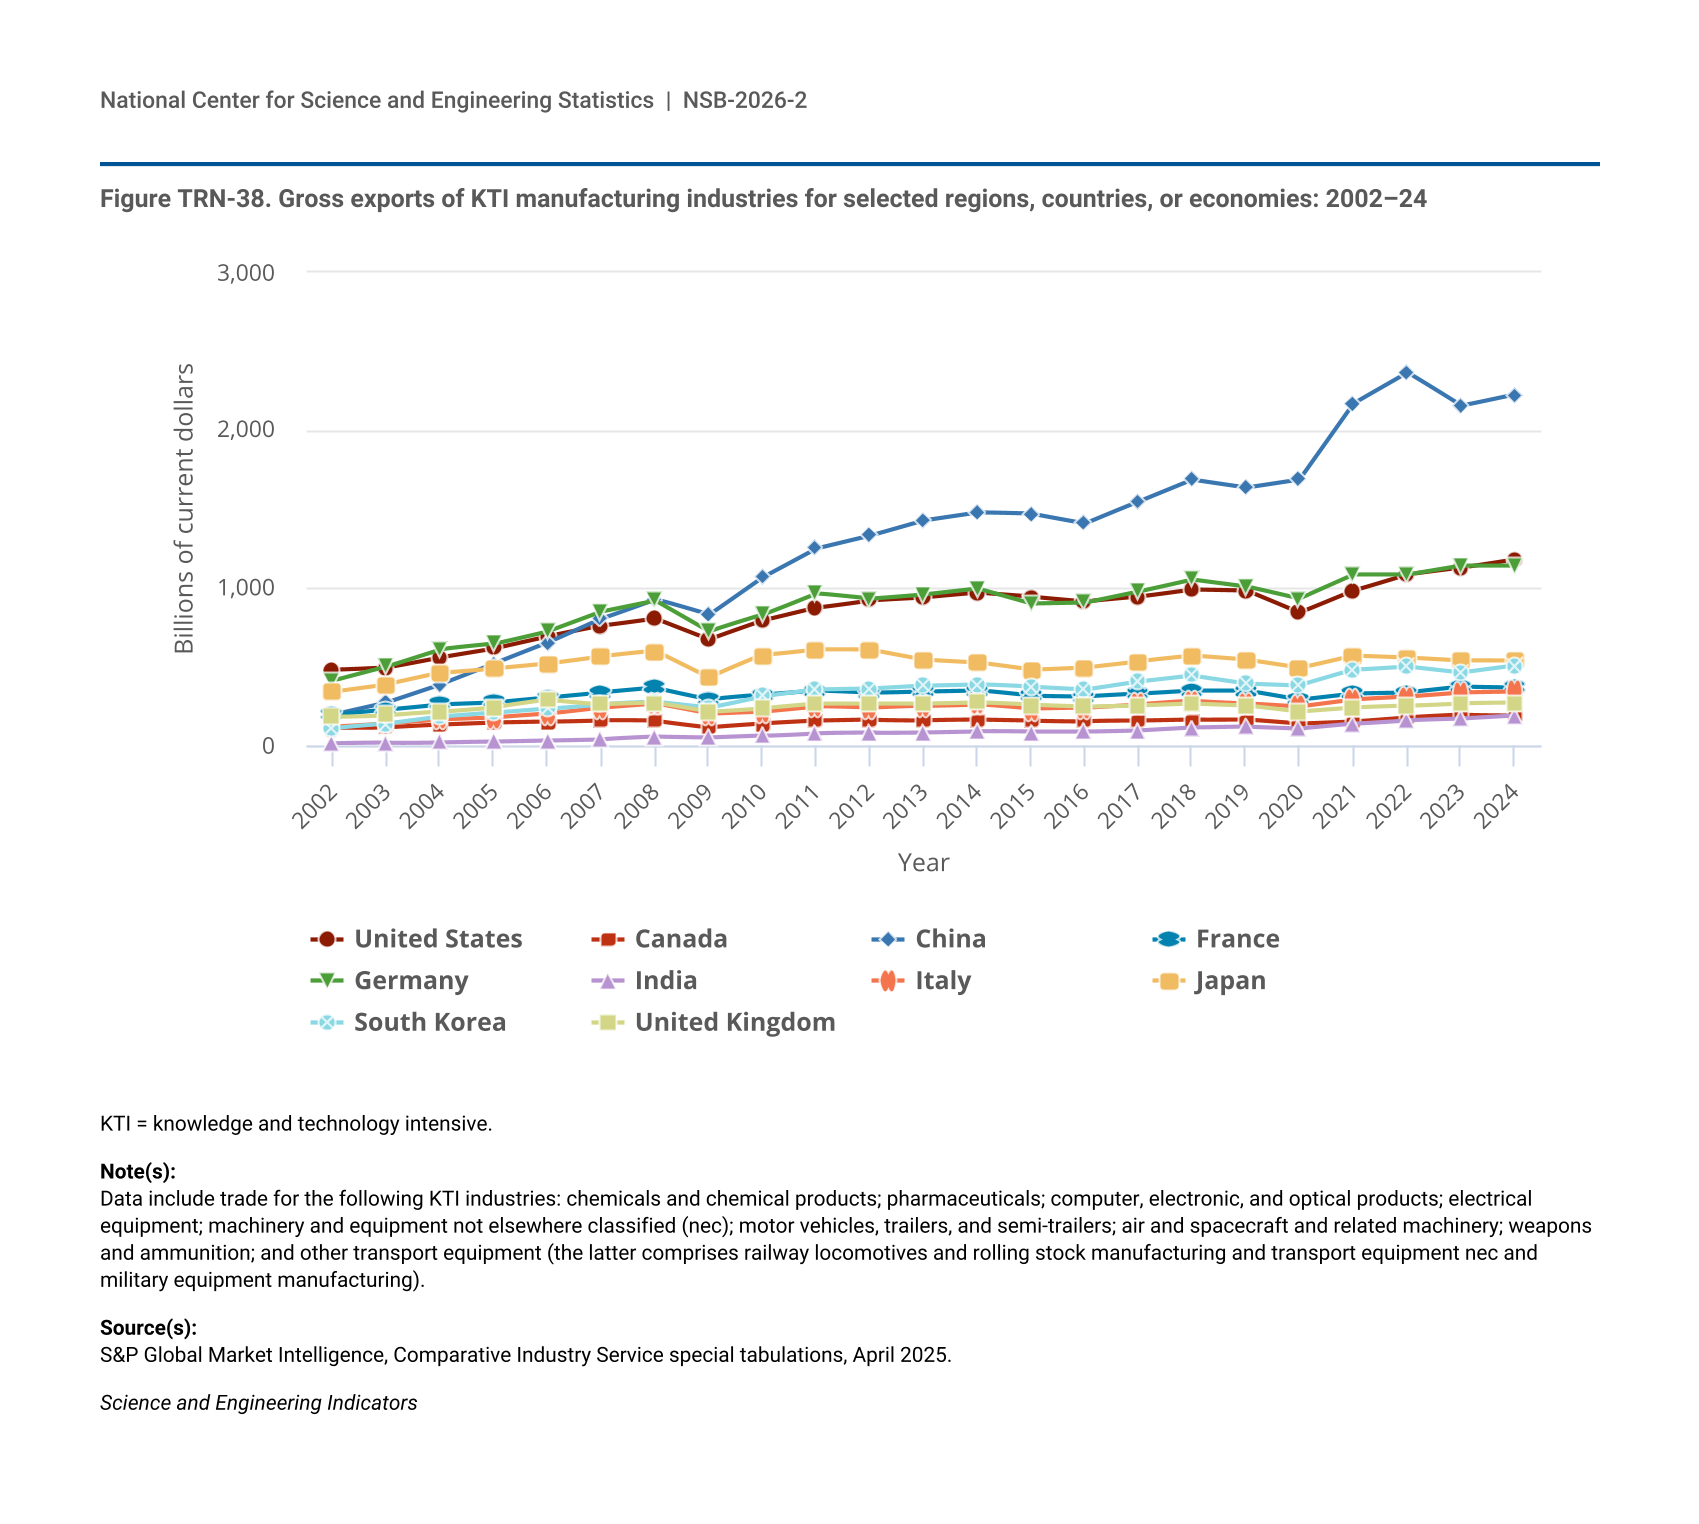
- China was the largest KTI manufacturing producer in 2024, with a 31% global share, followed by the United States, with a 21% share.
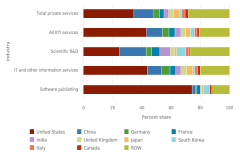
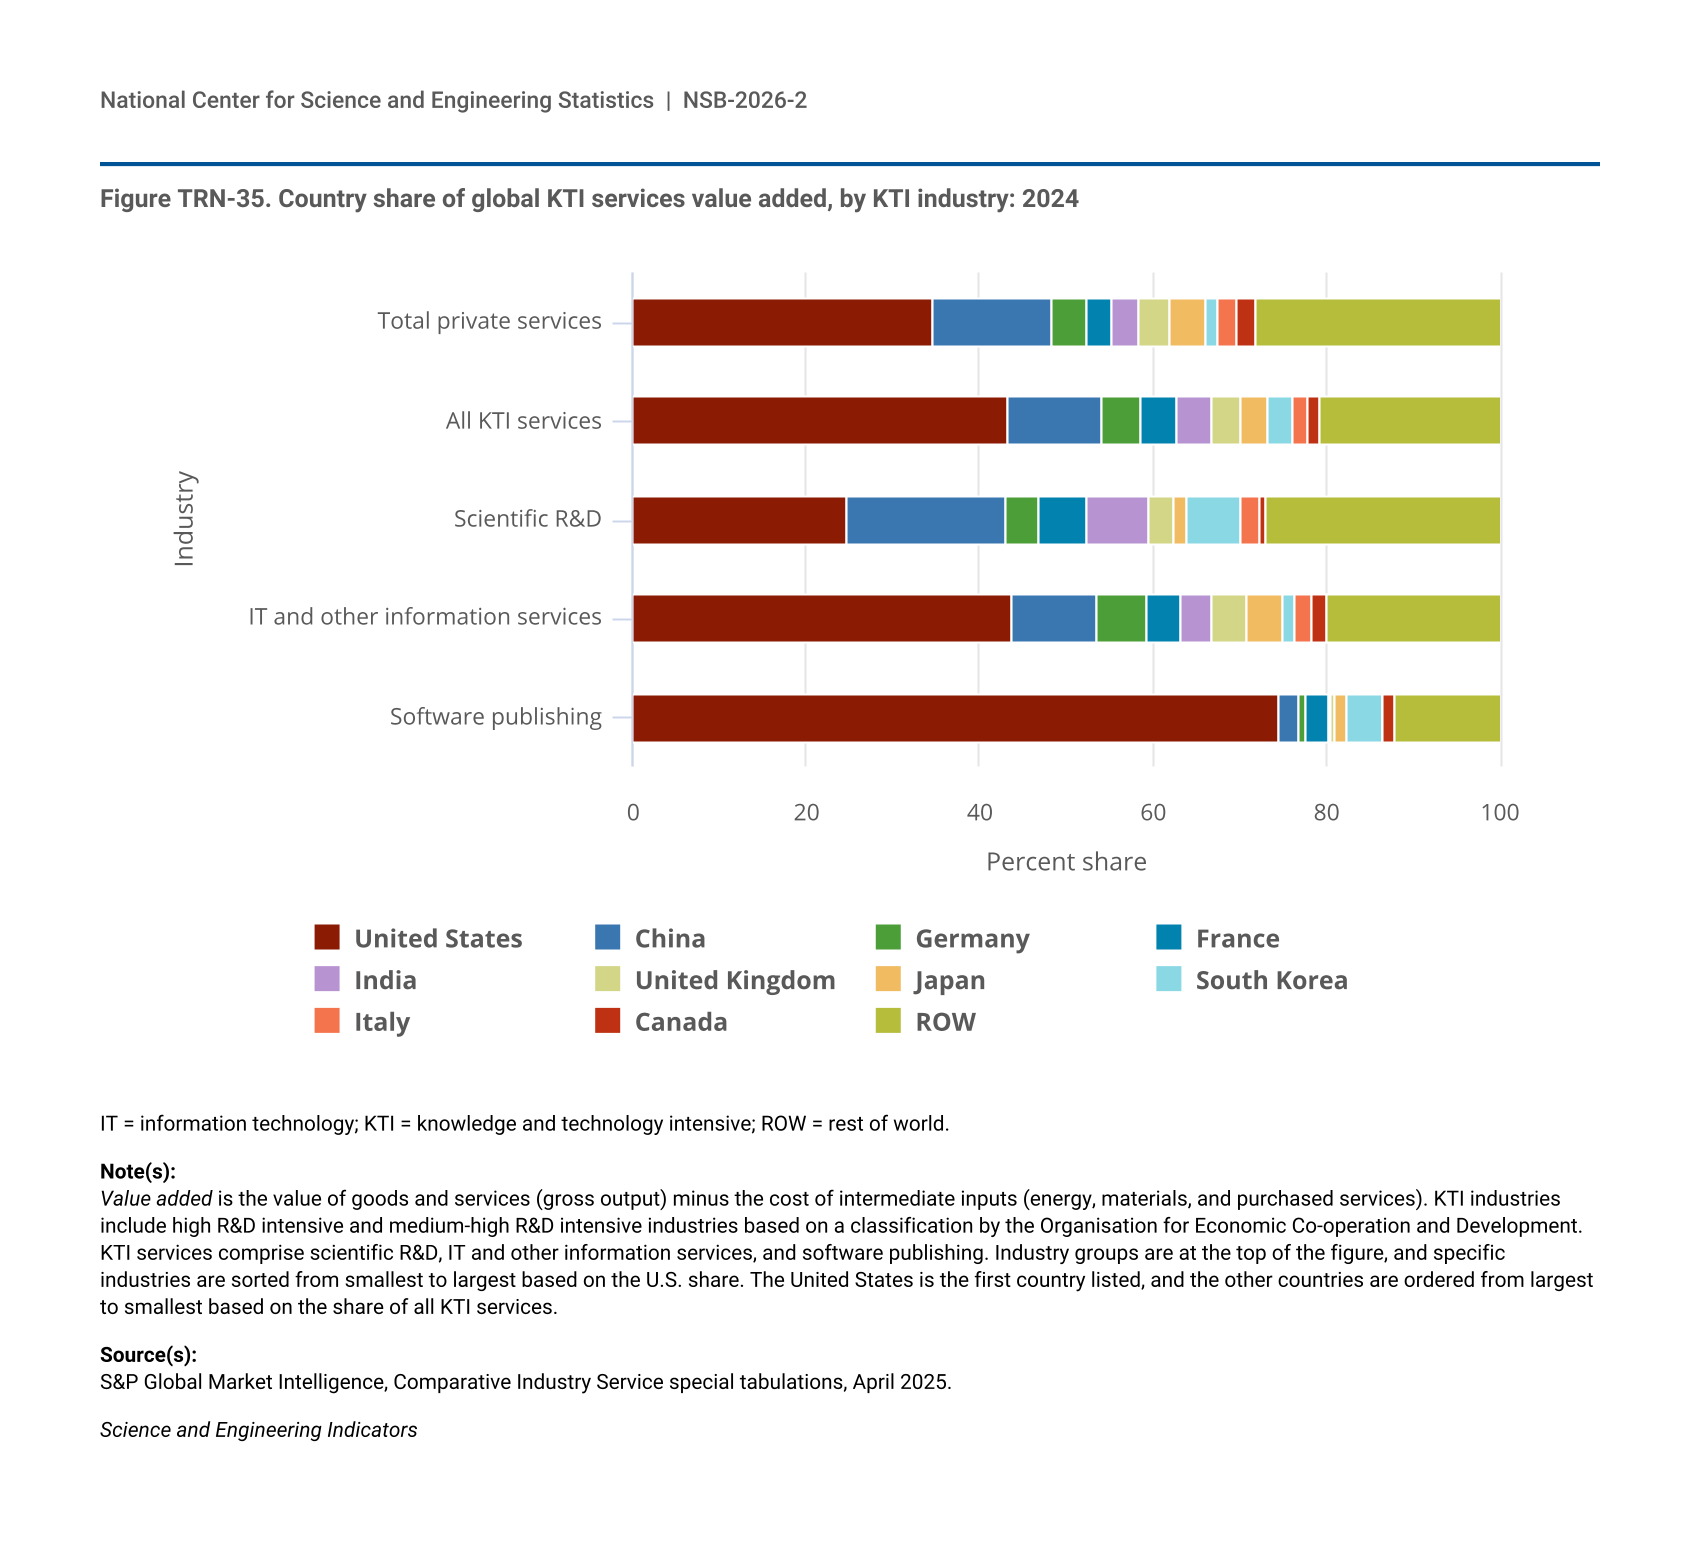
- The United States was the top KTI services producer in 2024, with a 43% global share, followed by China at 11%. Within KTI services industries, the U.S. global share was largest for software publishing (75%).
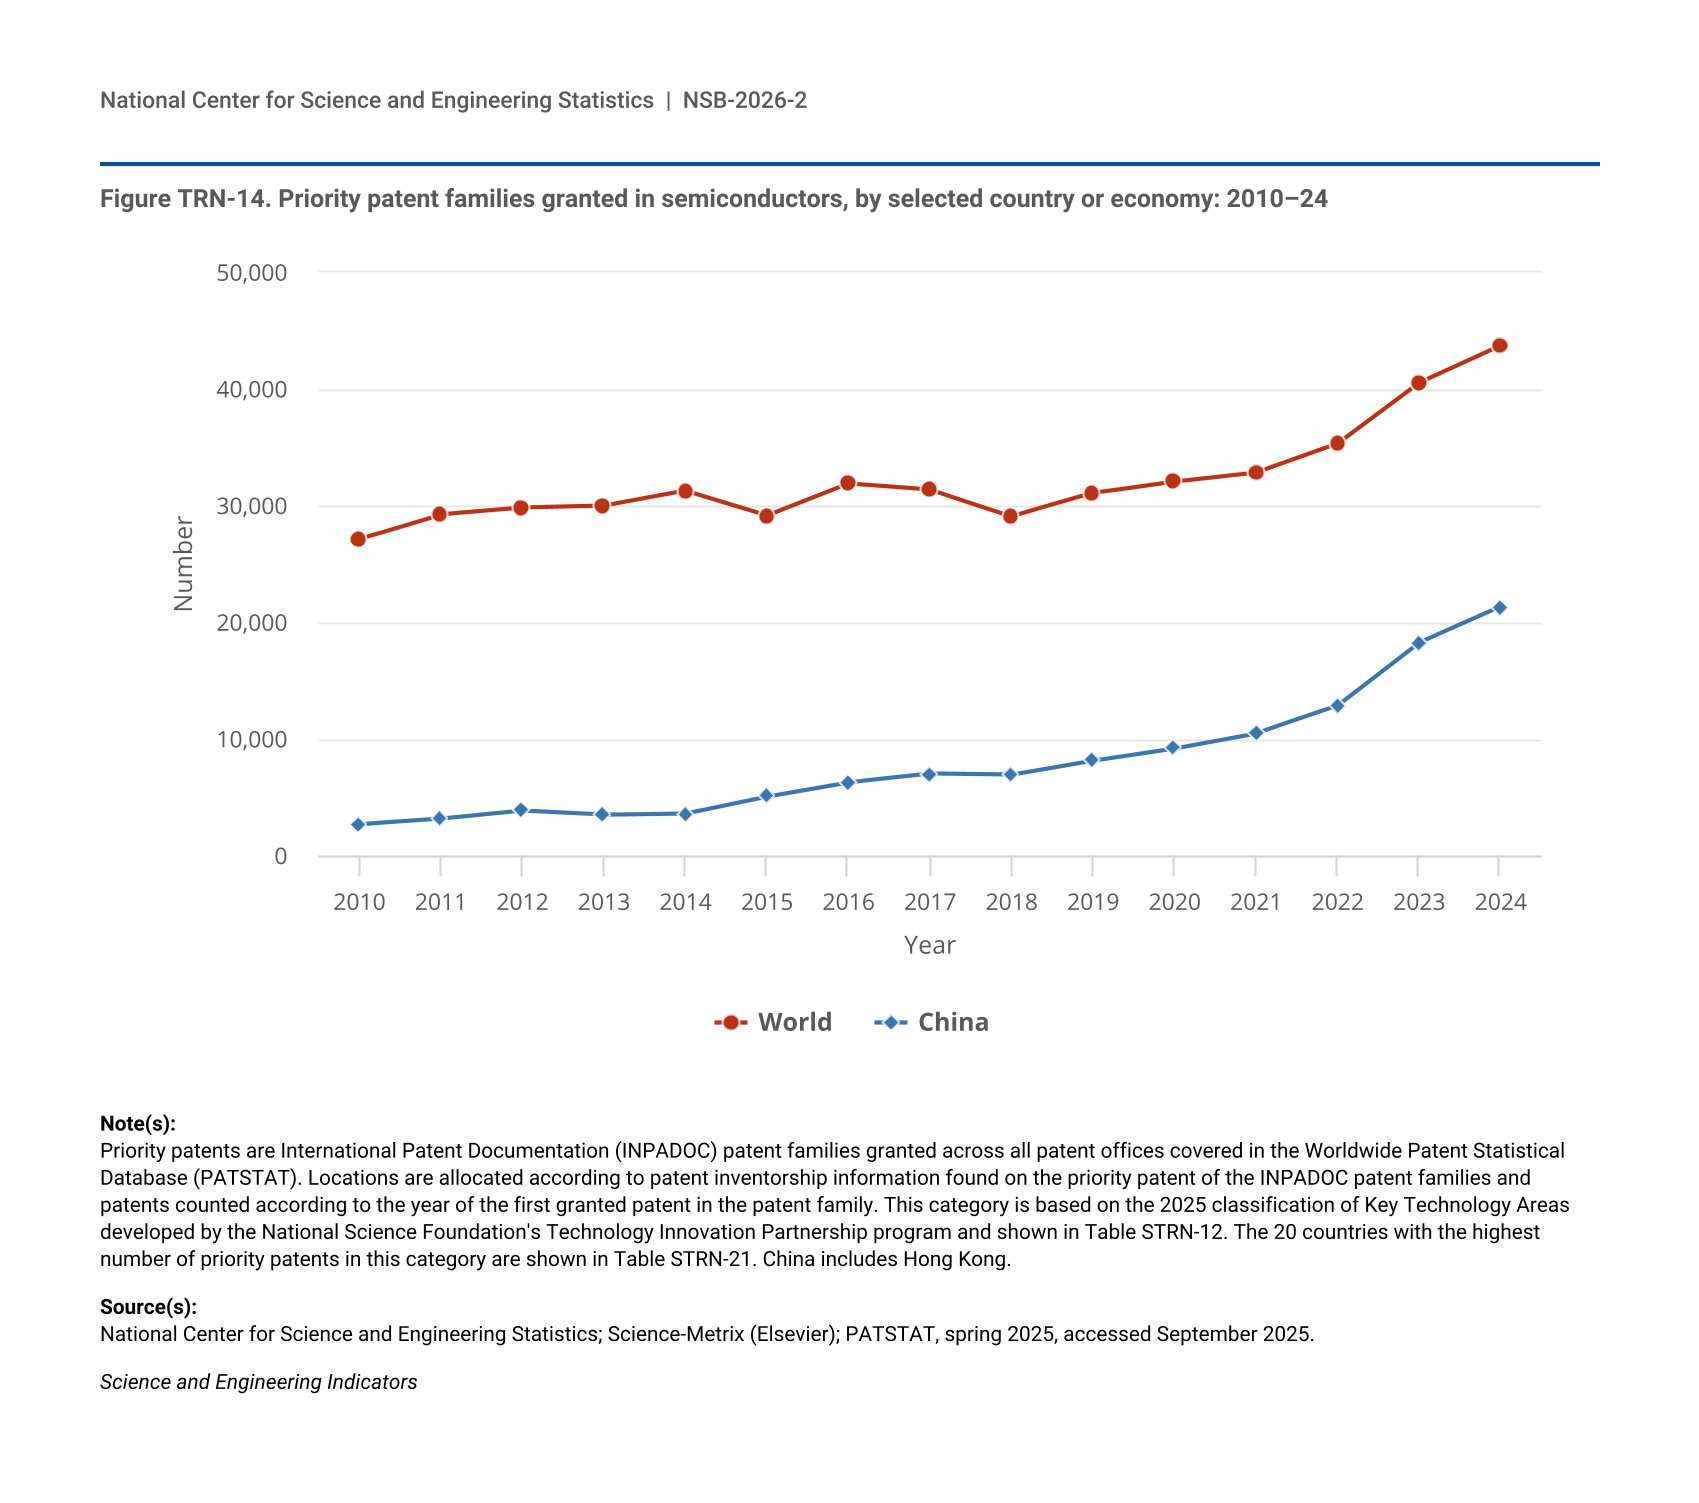
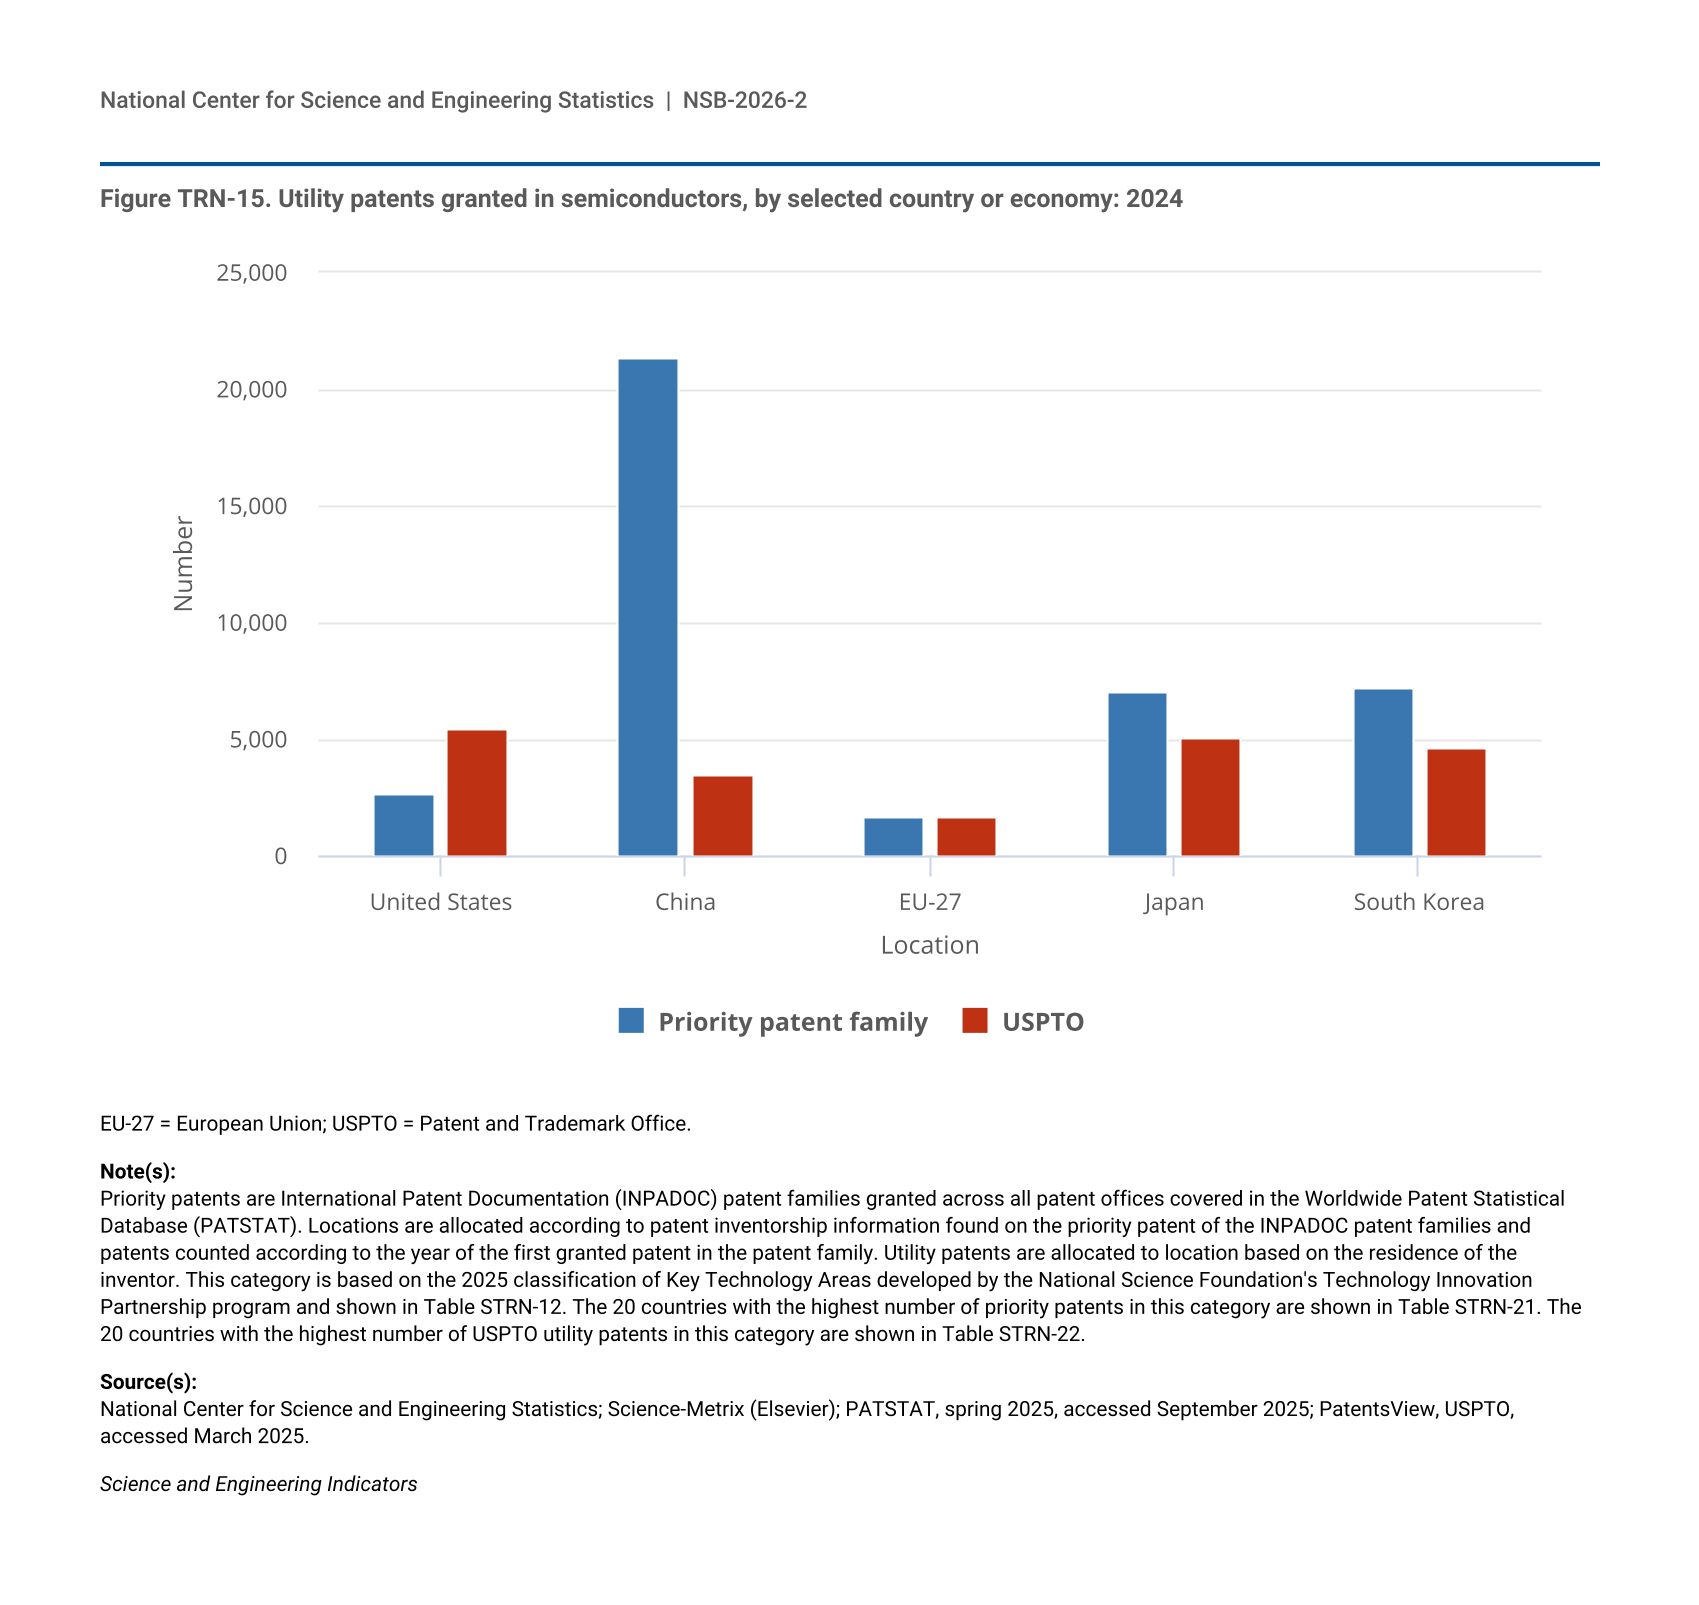
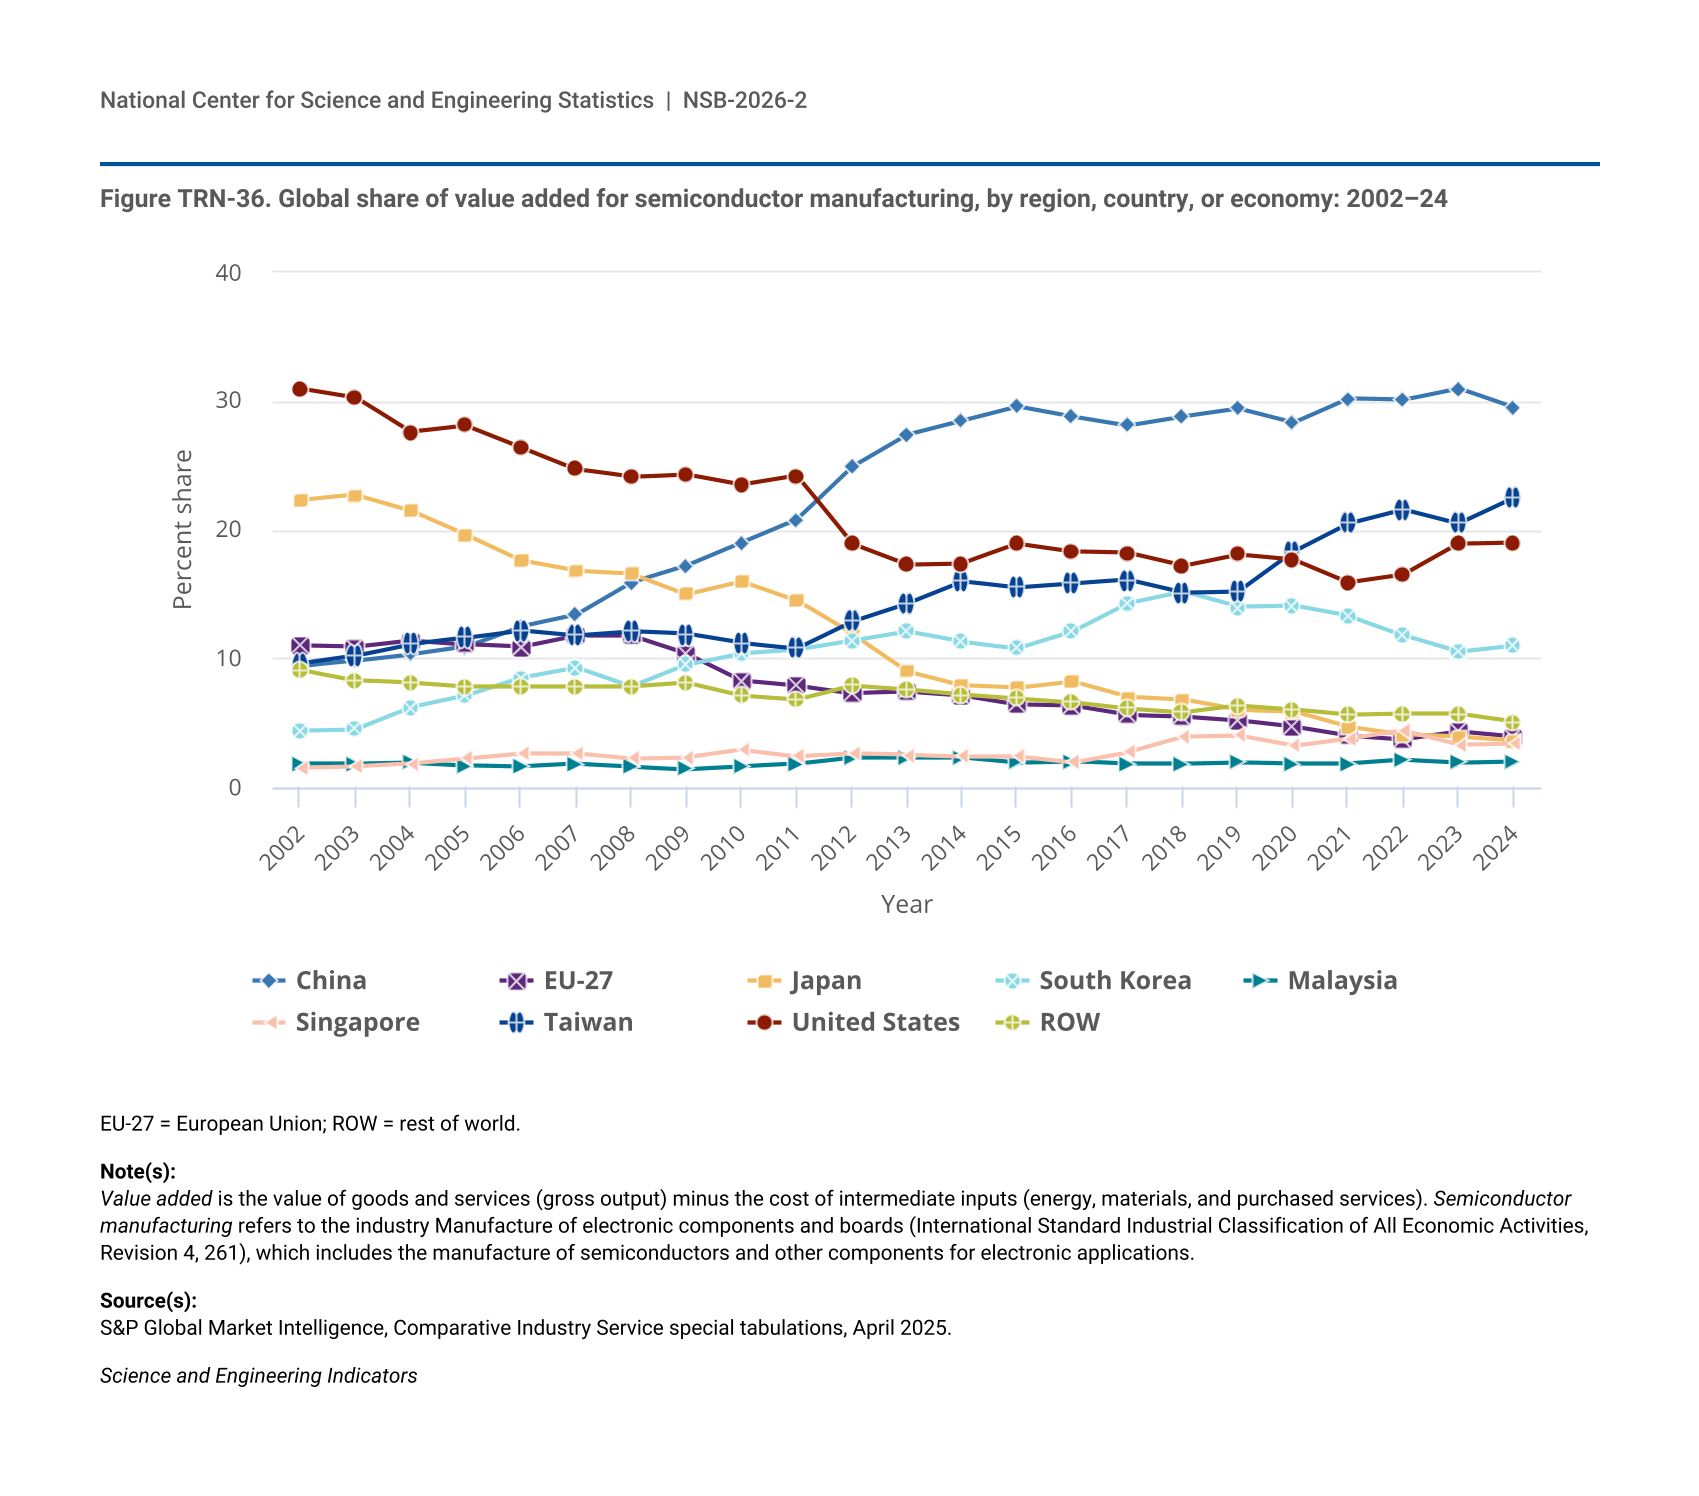
- In 2024, just over half (52%) of global semiconductor production, measured as value added, occurred in China (30%) and Taiwan (22%). The United States (19%) and South Korea (11%) completed the top four locations.
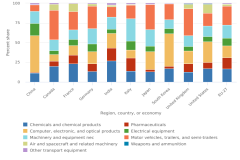
- Global KTI goods exports were more resilient than overall goods exports in 2023, declining by less than 1% that year and increasing by 3% in 2024 to $11.7 trillion in current U.S. dollars. All manufactured goods declined 4% in 2023 and increased 2% in 2024.
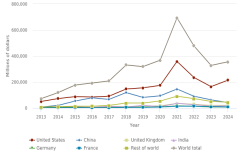
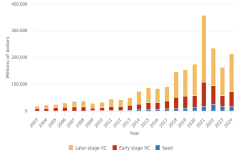
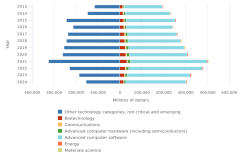
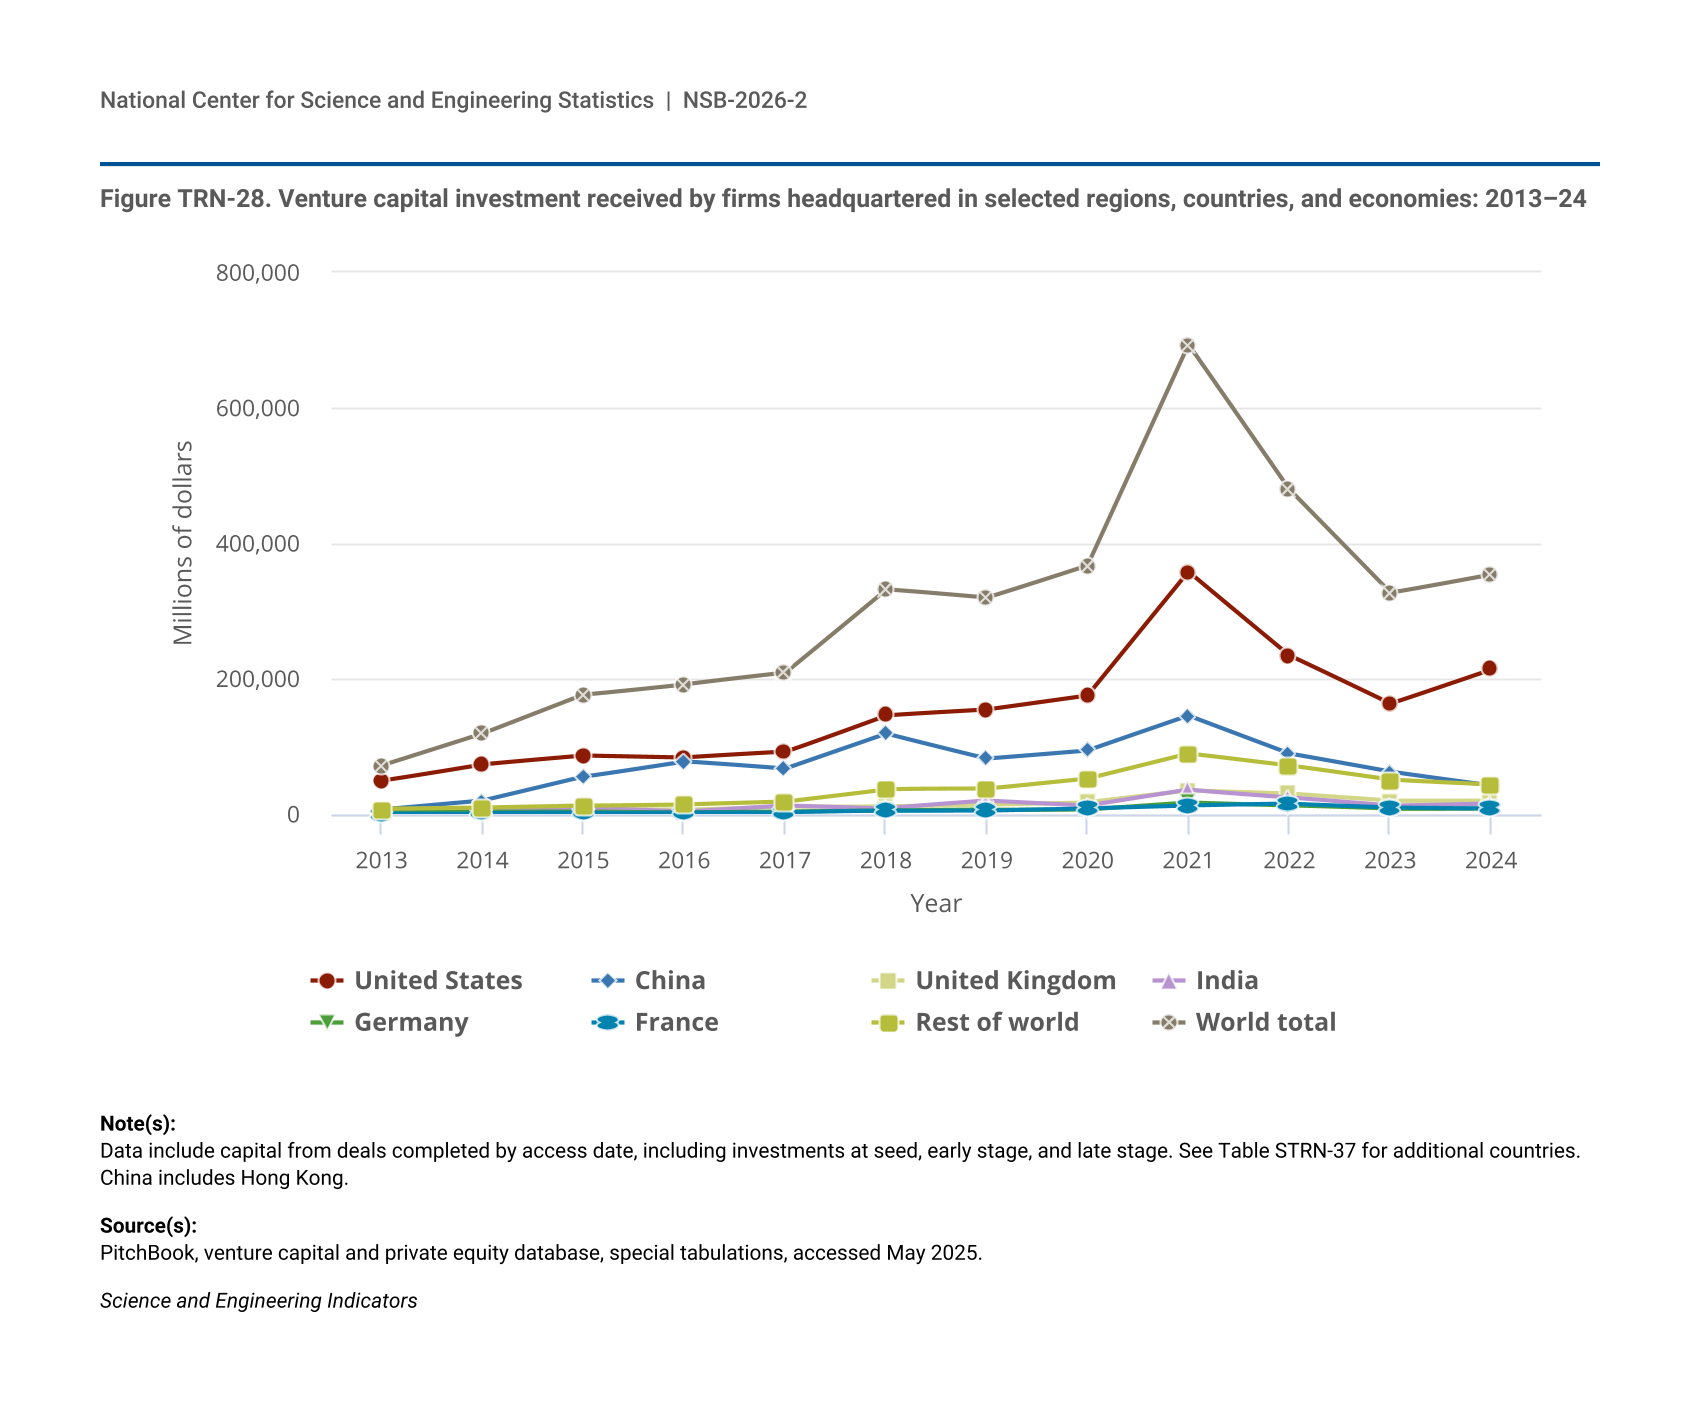
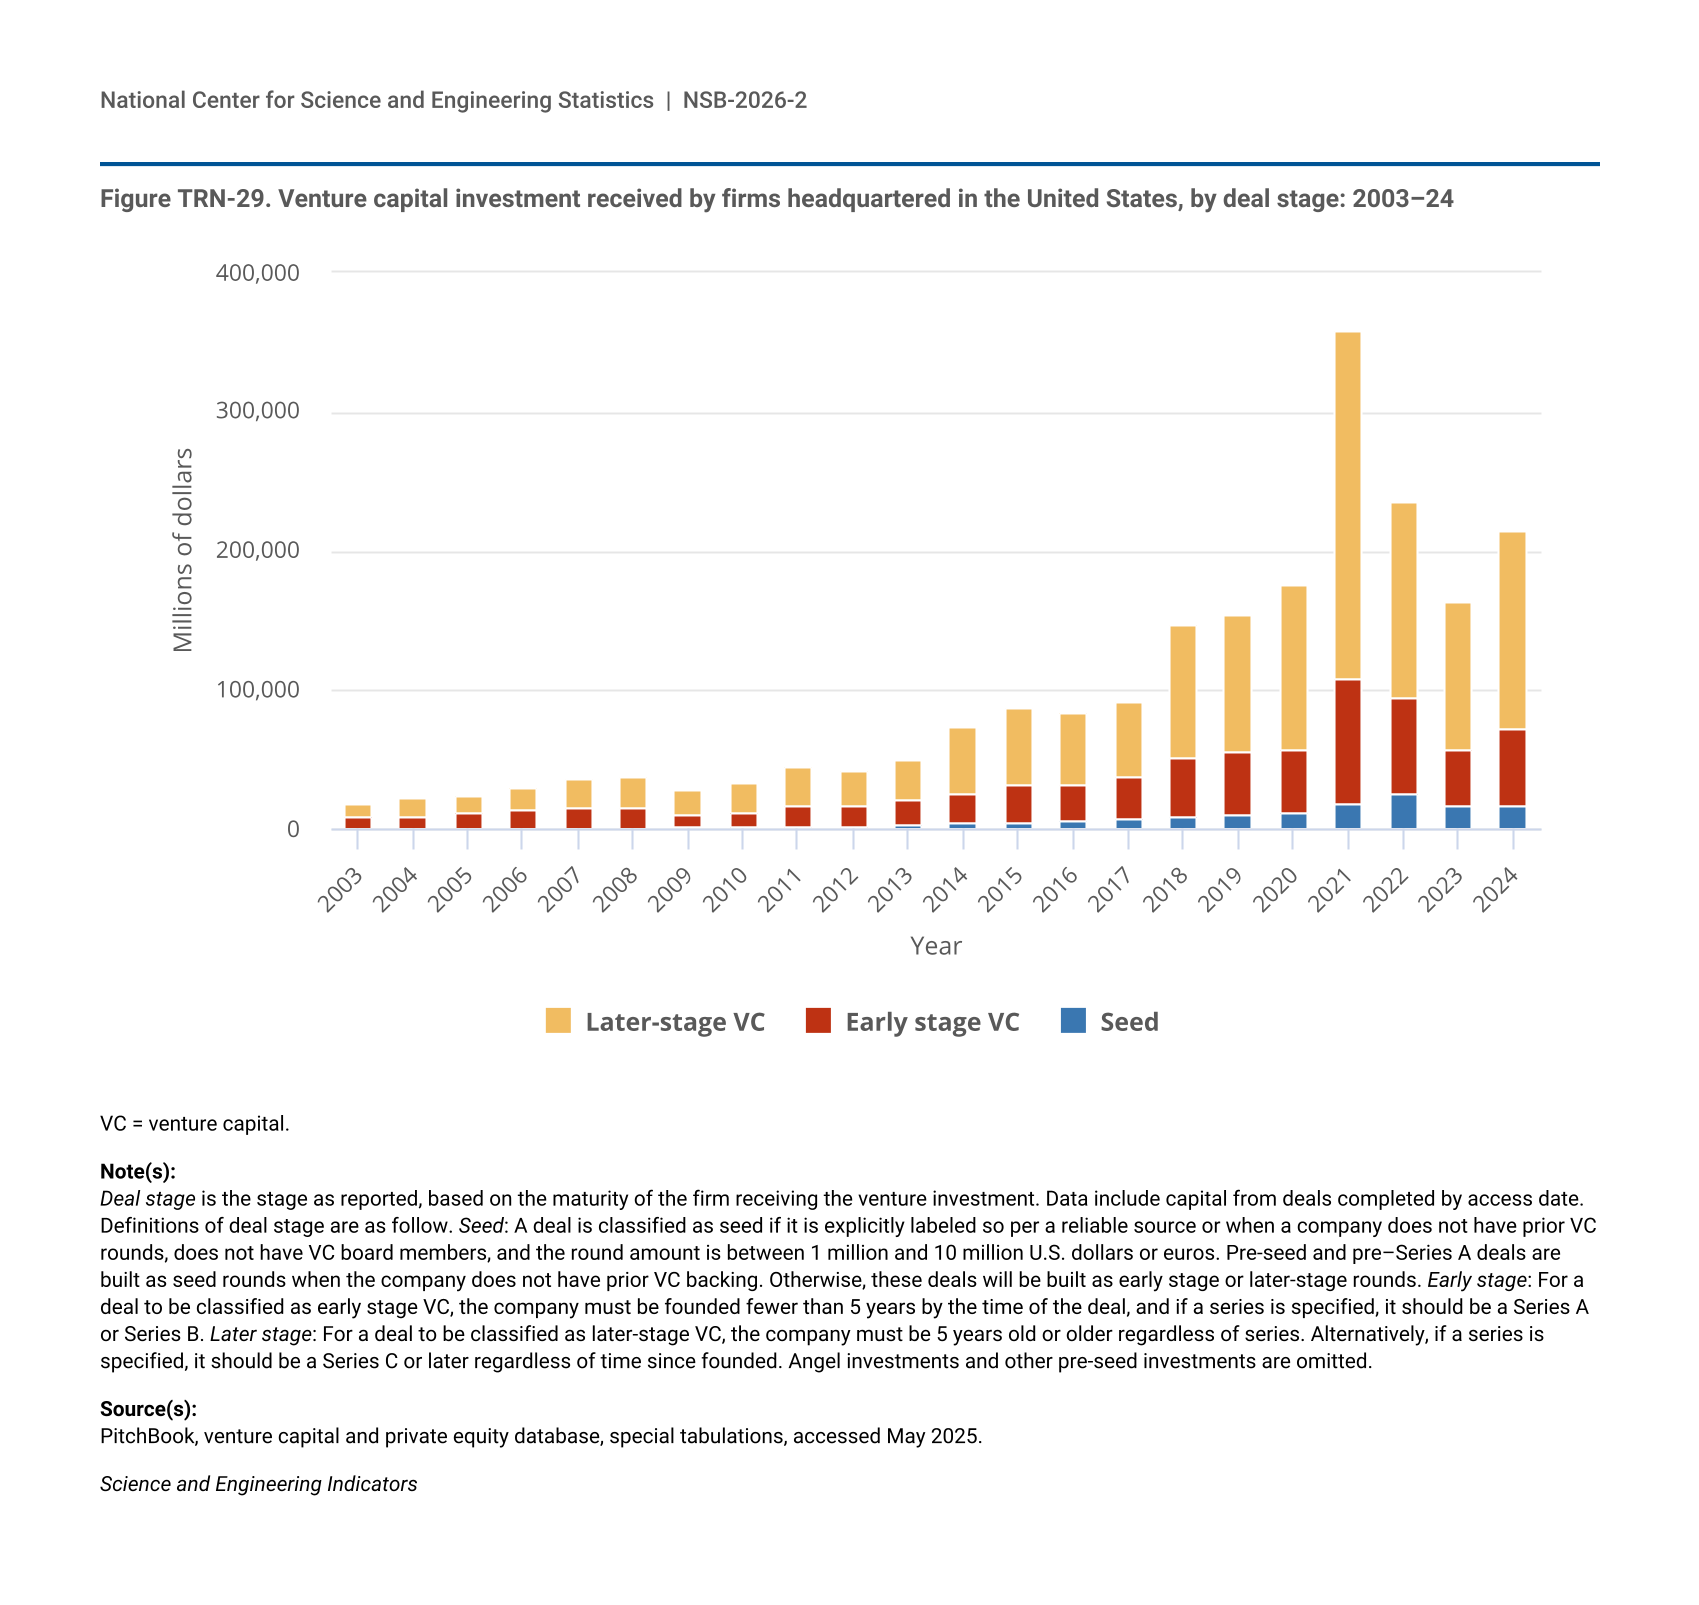
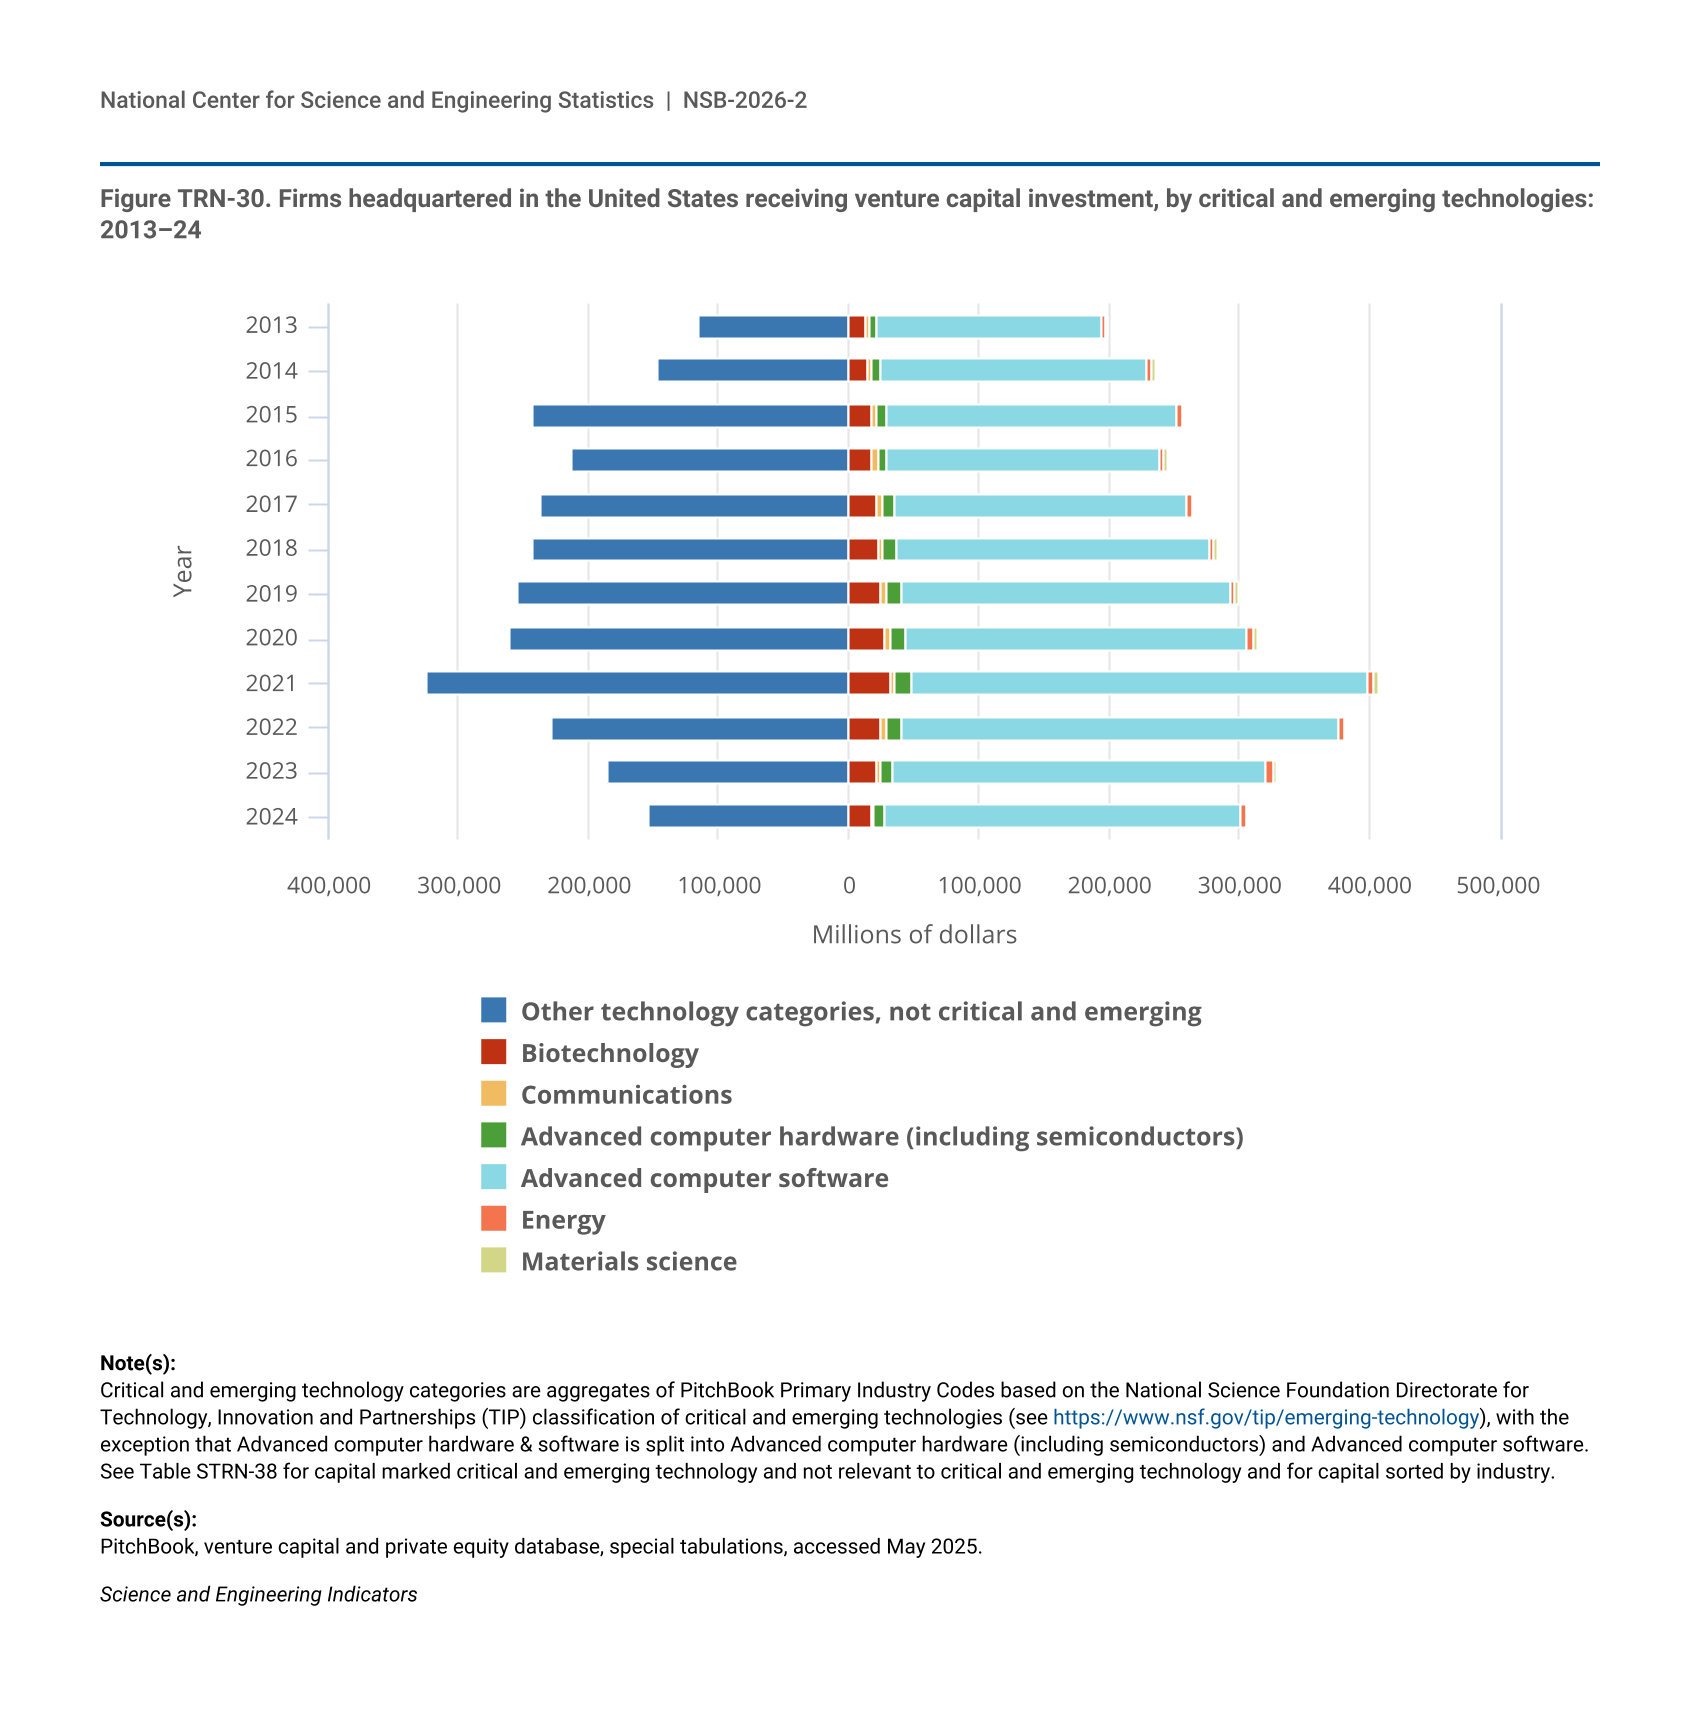
- In 2024, the United States, China, the United Kingdom, India, and Germany reported the highest volume of venture capital (VC) deals globally. Investments in software consistently comprised the largest share of U.S. VC funding in critical and emerging technology areas (classification by the U.S. National Science Foundation Directorate for Technology, Innovation and Partnerships), representing over 80% each year between 2013 and 2024.
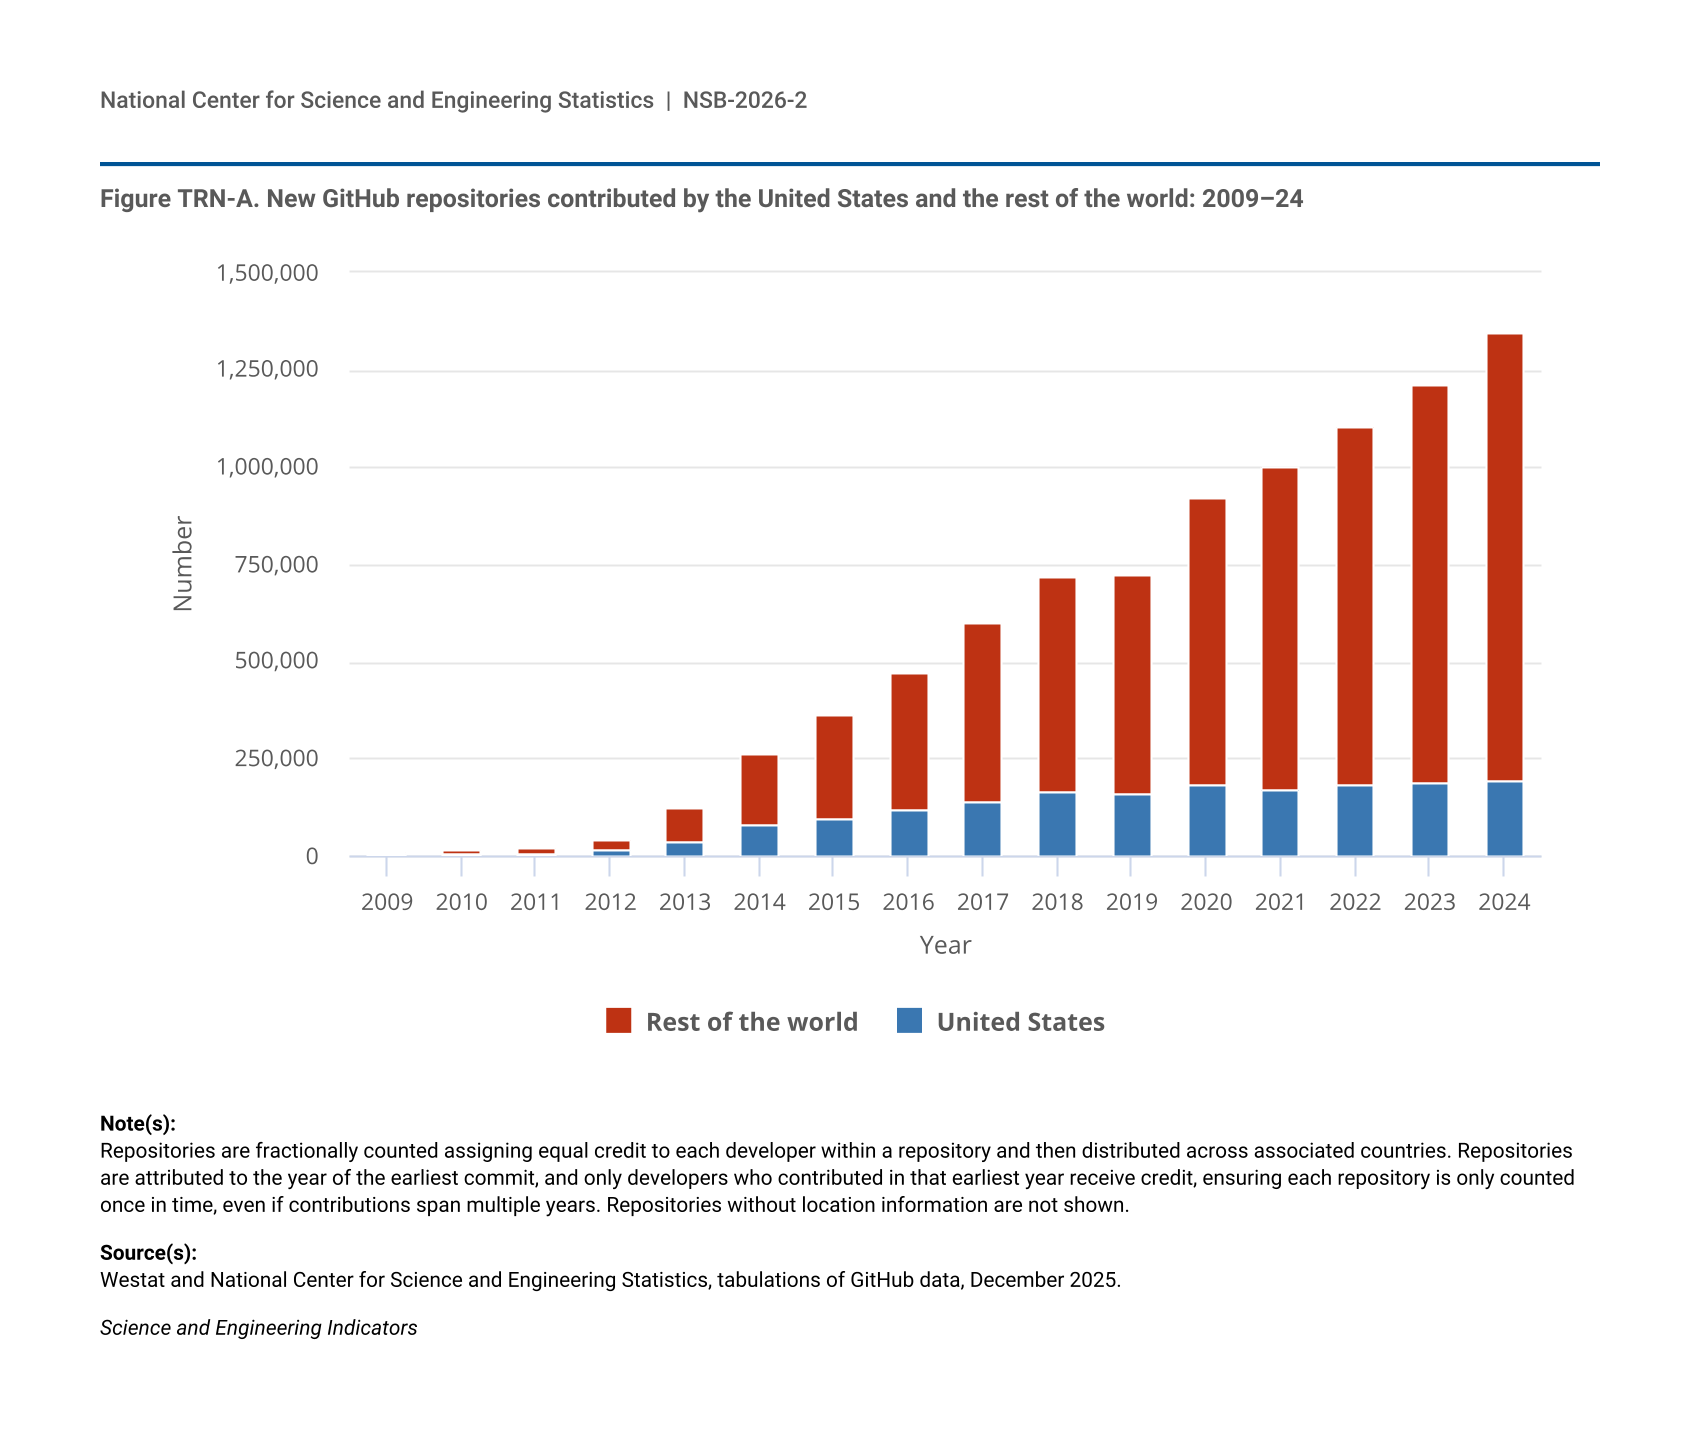
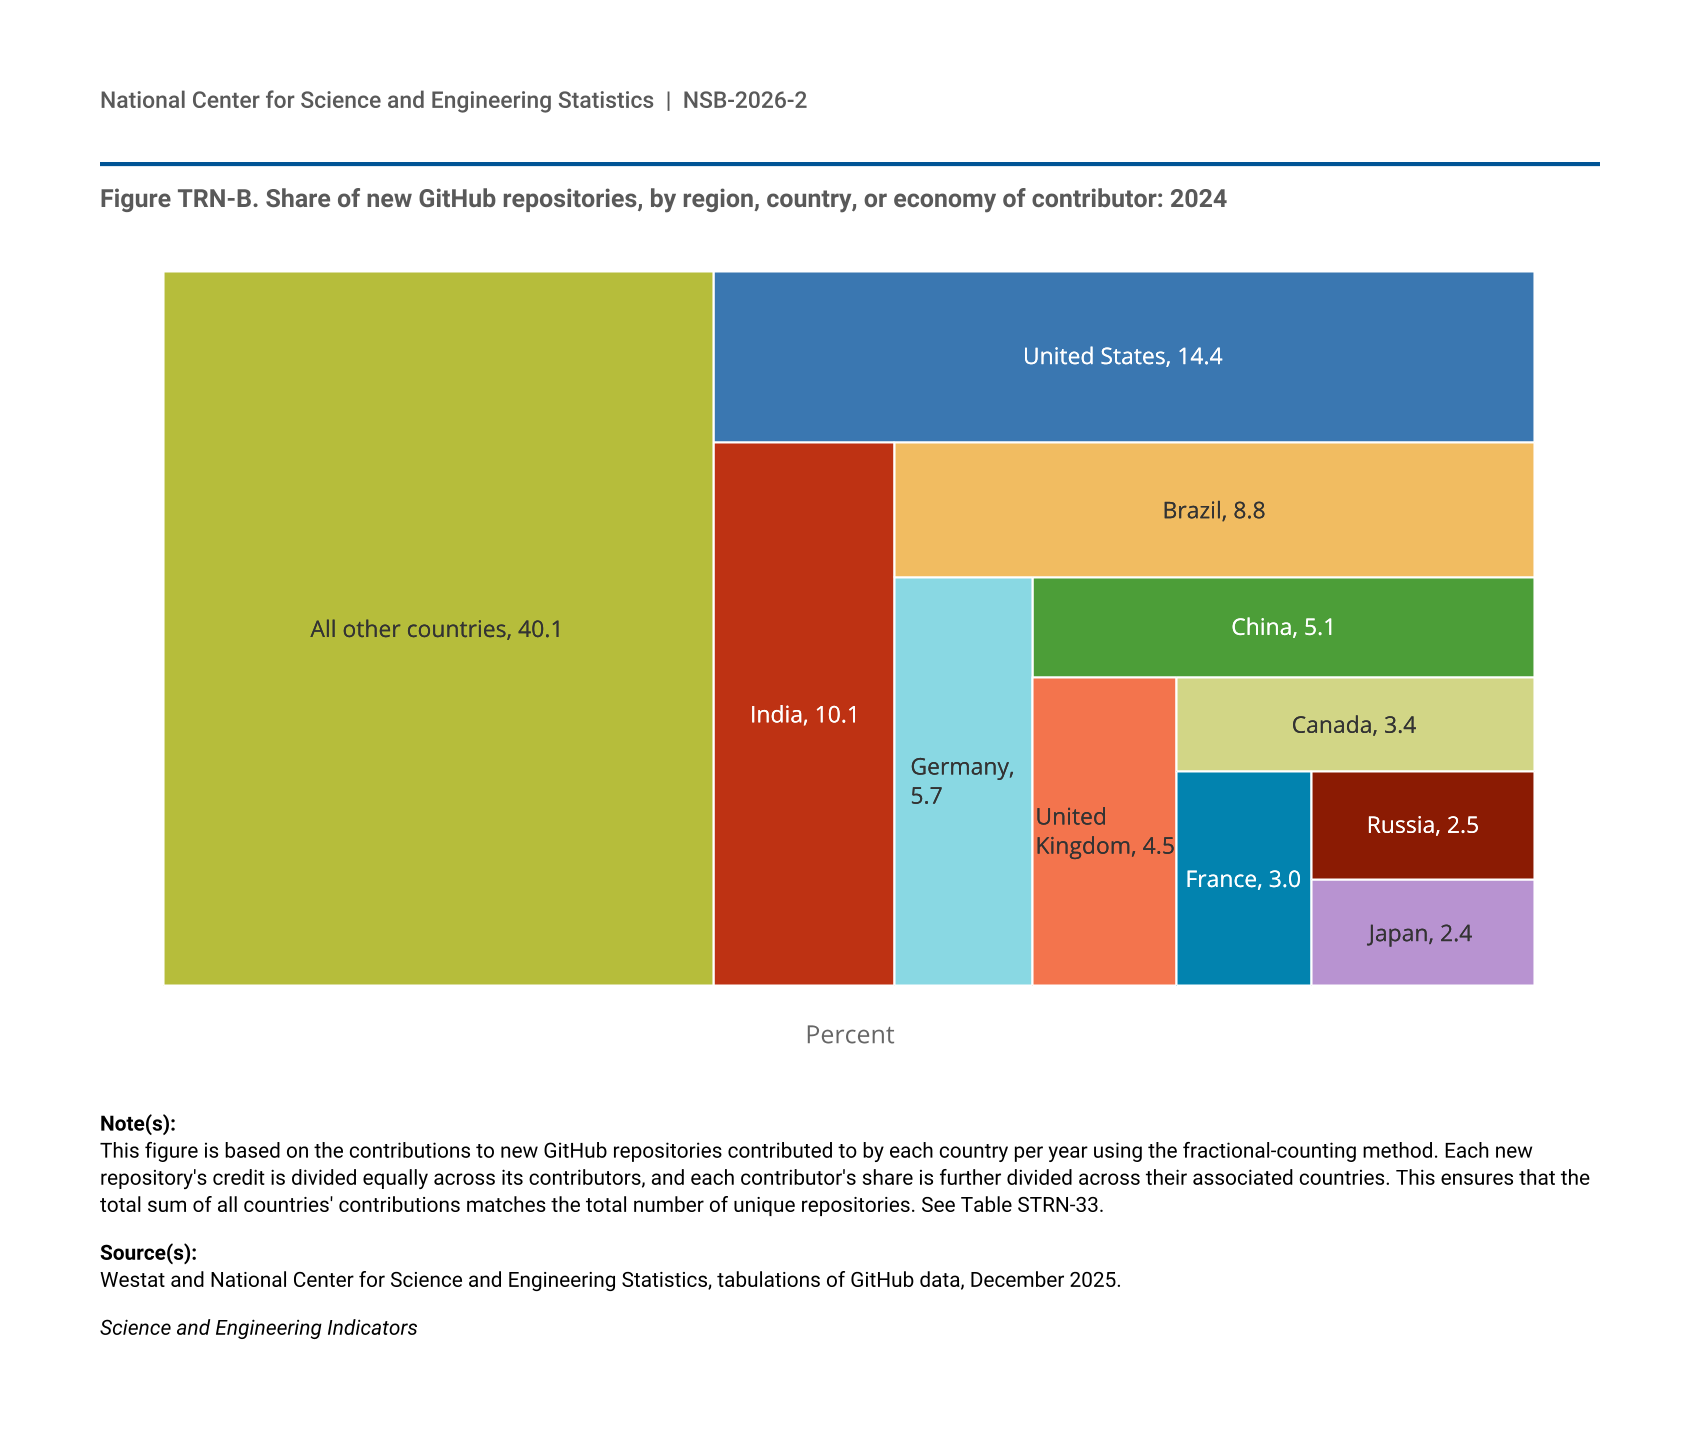
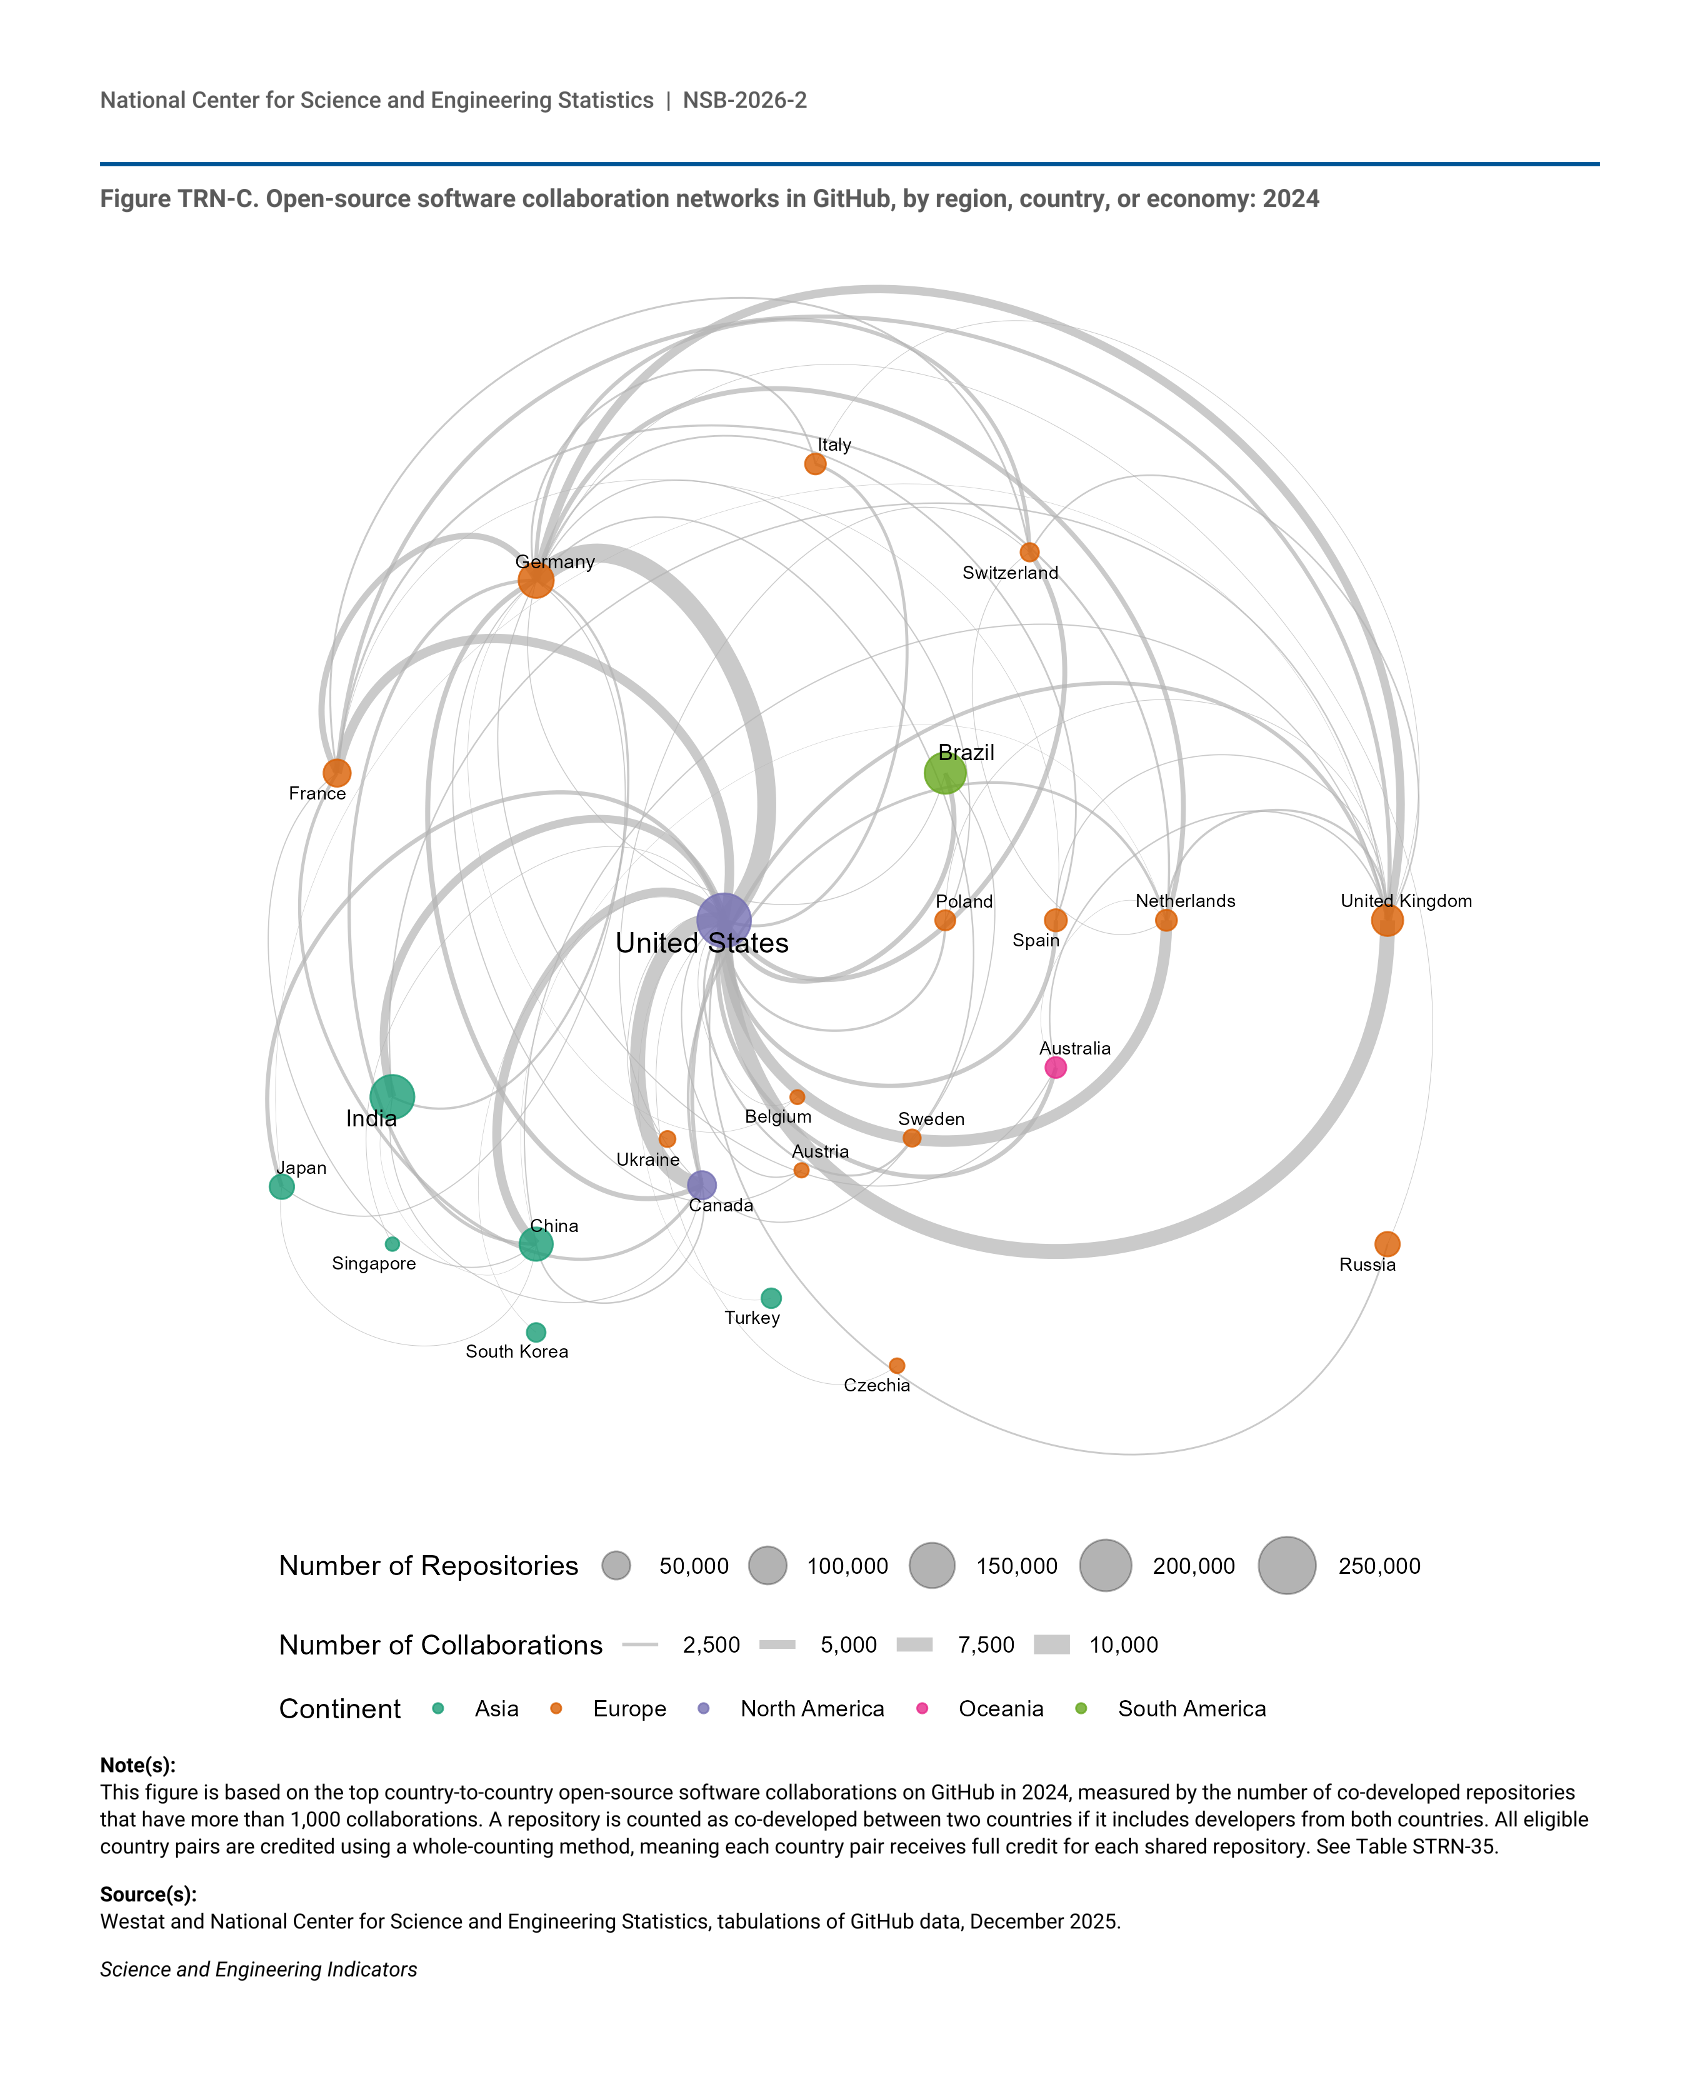
- Though freely distributed, open-source software contributes considerable value to innovation by providing critical tools for modern software and analysis. At the end of 2024, almost 140 million developers globally were contributing to open-source computer code on the GitHub platform, increasing from 45 million developers at the beginning of 2020.