 An official website of the United States government
 Production Patterns of Knowledge- and Technology-Intensive Industries
KTI industries are defined as those with high and medium-high R&D intensities based on an internationally comparable taxonomy developed by the OECD (2016) using the International Standard Industrial Classification of All Economic Activities (ISIC) (see the Glossary section for definitions). KTI industries include 10 industries in manufacturing and 3 industries in services (for a list of industries, see Table STRN-39). KTI industries compete globally, often in sectors characterized by technological disruption and complex supplier networks and supply chains, including those for critical minerals and materials, energy, technology, and labor (Baldwin and Freeman 2021; Bontadini et al. 2024; Cerdeiro et al. 2021; CRS 2022; Goldberg and Reed 2023; IMF 2025). KTI industries are important funders and performers of R&D, produce high-value products and services and intangible assets, and contribute to national economic competitiveness in global markets shaped by the macroeconomic and foreign affairs policies of national governments. Multinational enterprises and other firms in these industries participate in trade, investment, and other global value chain (GVC) activities that support and are influenced by national economic growth and innovation. This section covers trends in output and international trade by KTI industries. KTI output is measured as the value of goods and services (gross output) minus the cost of intermediate inputs (energy, materials, and purchased services)—henceforth, value added. KTI output and trade patterns illustrate some of the impacts of technology activities and related investments discussed earlier in this report and in other Indicators 2026 reports.
U.S. Industries
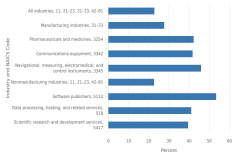
The U.S. economy is service intensive; manufacturing makes up a relatively small share of GDP when compared to many international economies. Partly because of this, and because most KTI industries are in the manufacturing sector given their high R&D intensity, U.S. KTI manufacturing comprises a relatively small share of its GDP. In 2024, value added to goods and services within U.S. KTI industries totaled $3.3 trillion in current U.S. dollars and accounted for 11% of U.S. GDP, a share little changed since 2002 (BEA 2025a) (see Table STRN-40, Table STRN-41).
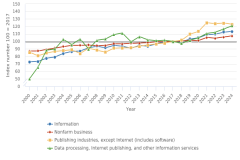
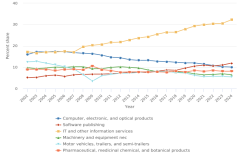
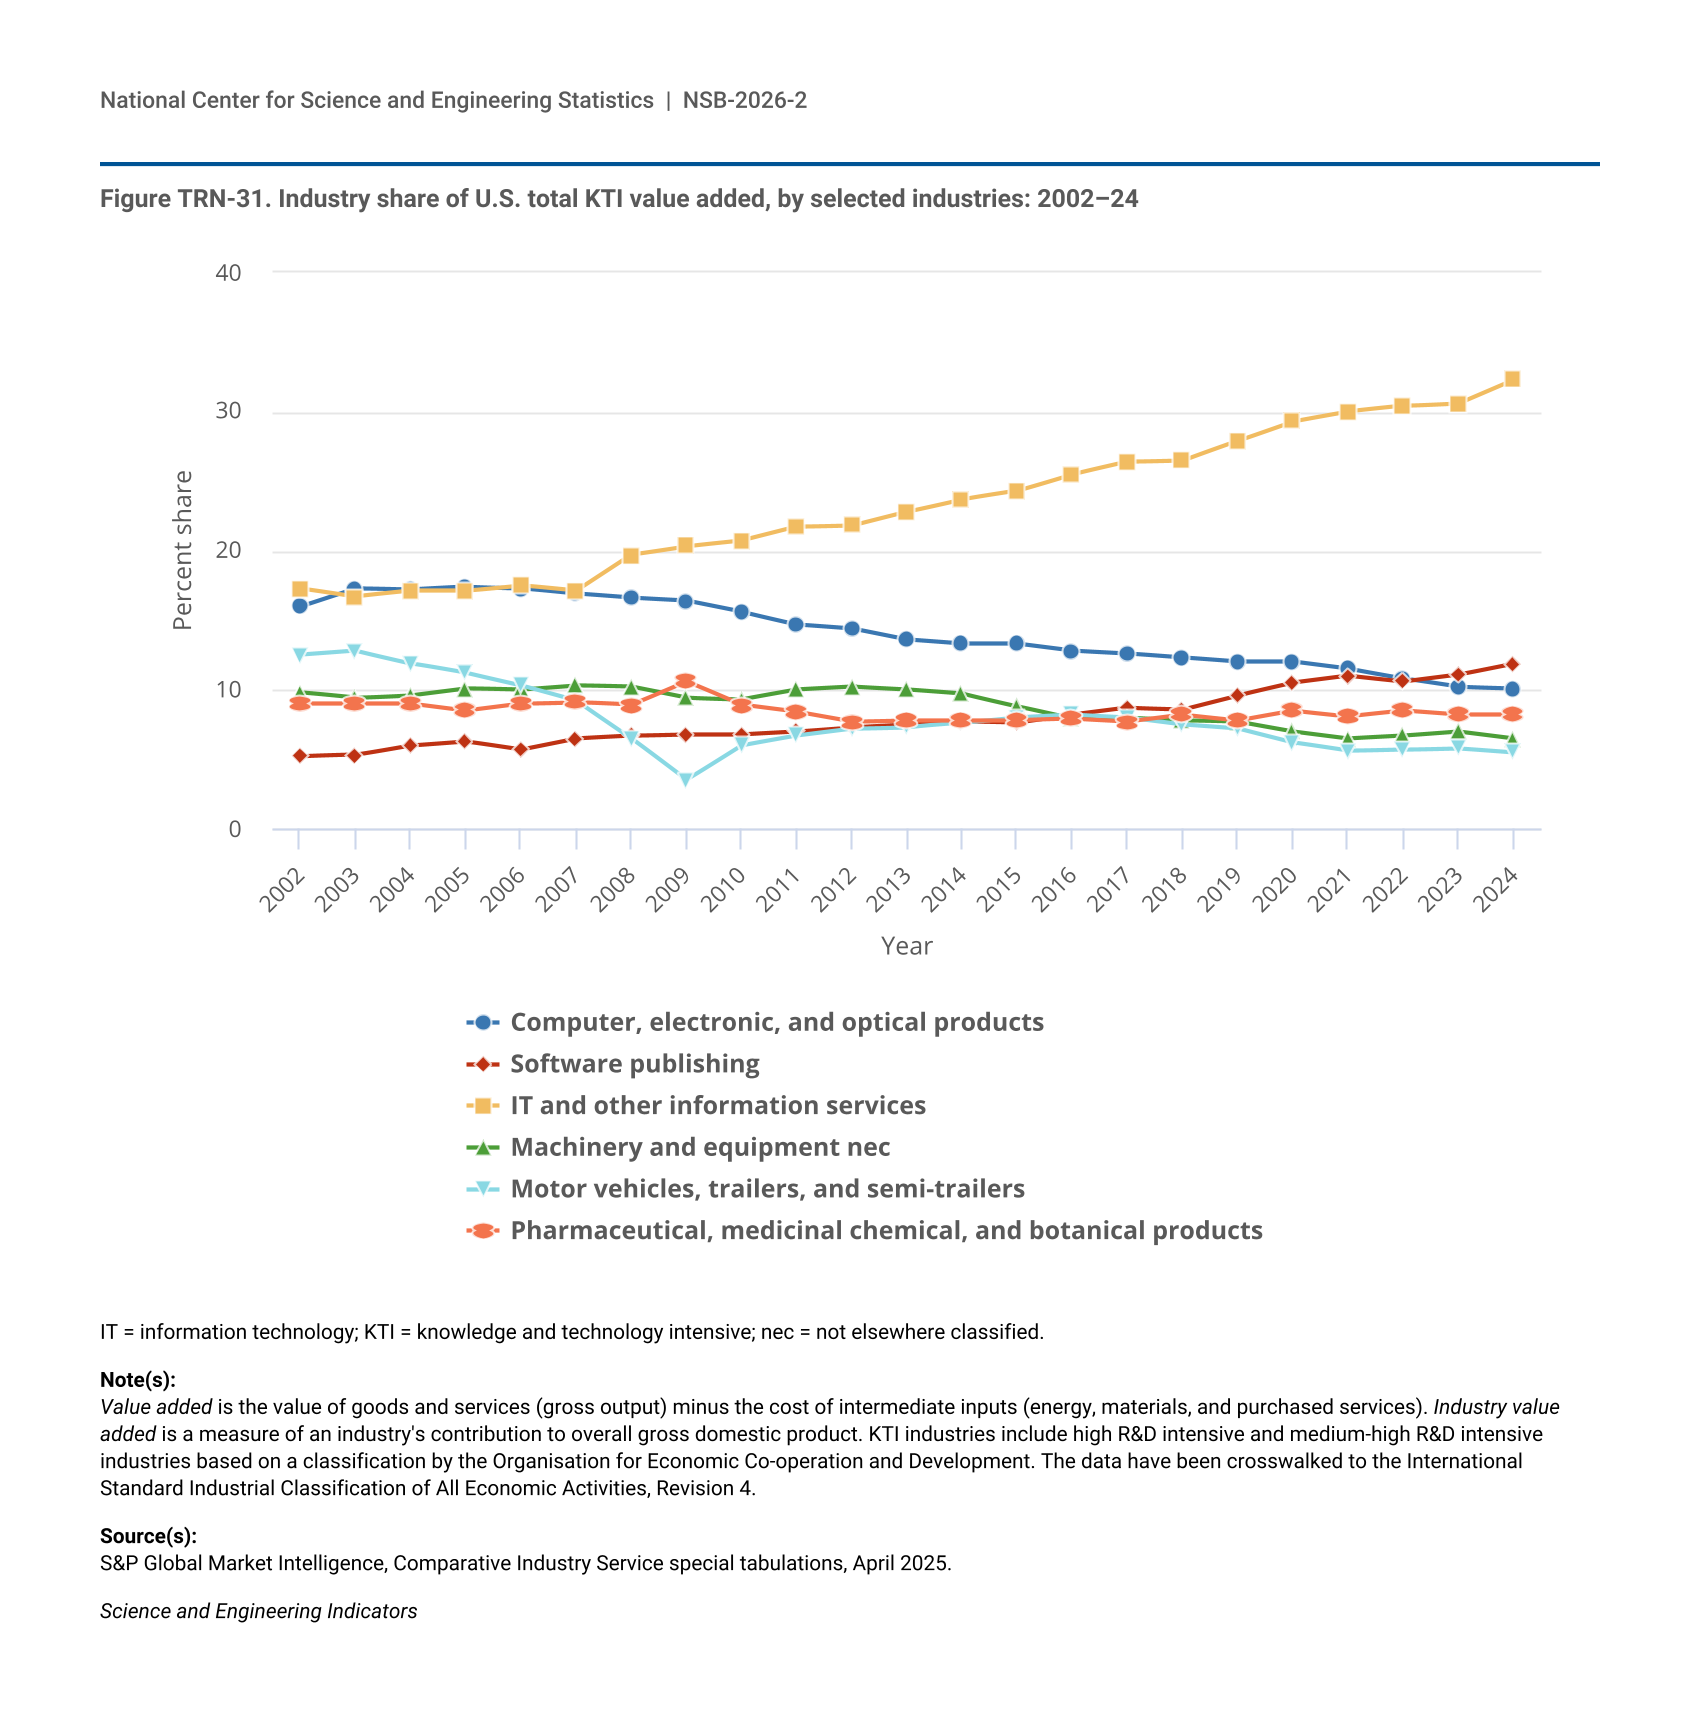
Notably, the share of KTI services industries that contribute to total U.S. KTI value added increased, from about 30% in 2002 to just over half in 2024, led by increases in information technology (IT) and other information services and in software publishing production (Figure TRN-31; Table STRN-40). The IT and other information services industry has been the largest U.S. KTI industry by value added in current dollars since 2006, growing from 17% in that year to 32% in 2024 (Figure TRN-31). Pharmaceutical, medicinal chemical, and botanical product manufacturing (including pharmaceutical biotechnology) has accounted for between 8% and 11% of total KTI value added, whereas motor vehicles, trailers, and semi-trailers manufacturing has steadily decreased as a share from 13% in 2002 to 5% in 2024. Computer and components manufacturing in a global context and trends in semiconductor production are discussed in the section Sectoral and Industry Distributions and the section Global Semiconductor Production.
| Year | Computer, electronic, and optical products | Software publishing | IT and other information services | Machinery and equipment nec | Motor vehicles, trailers, and semi-trailers | Pharmaceutical, medicinal chemical, and botanical products |
|---|---|---|---|---|---|---|
| 2002 | 16.0 | 5.2 | 17.3 | 9.8 | 12.5 | 9.0 |
| 2003 | 17.3 | 5.3 | 16.7 | 9.4 | 12.8 | 9.0 |
| 2004 | 17.2 | 6.0 | 17.1 | 9.6 | 11.9 | 9.0 |
| 2005 | 17.4 | 6.3 | 17.1 | 10.1 | 11.2 | 8.5 |
| 2006 | 17.3 | 5.7 | 17.5 | 10.0 | 10.3 | 9.0 |
| 2007 | 16.9 | 6.5 | 17.1 | 10.3 | 9.2 | 9.1 |
| 2008 | 16.6 | 6.7 | 19.7 | 10.2 | 6.5 | 8.9 |
| 2009 | 16.4 | 6.8 | 20.3 | 9.4 | 3.5 | 10.6 |
| 2010 | 15.6 | 6.8 | 20.7 | 9.3 | 6.0 | 8.9 |
| 2011 | 14.7 | 7.0 | 21.7 | 10.0 | 6.7 | 8.4 |
| 2012 | 14.4 | 7.3 | 21.8 | 10.2 | 7.2 | 7.7 |
| 2013 | 13.6 | 7.5 | 22.8 | 10.0 | 7.3 | 7.8 |
| 2014 | 13.3 | 7.7 | 23.7 | 9.7 | 7.6 | 7.8 |
| 2015 | 13.3 | 7.6 | 24.3 | 8.8 | 8.0 | 7.8 |
| 2016 | 12.8 | 8.2 | 25.5 | 7.9 | 8.2 | 7.9 |
| 2017 | 12.6 | 8.7 | 26.4 | 8.0 | 8.0 | 7.7 |
| 2018 | 12.3 | 8.6 | 26.5 | 7.8 | 7.5 | 8.2 |
| 2019 | 12.0 | 9.6 | 27.9 | 7.7 | 7.2 | 7.8 |
| 2020 | 12.0 | 10.5 | 29.3 | 7.0 | 6.2 | 8.5 |
| 2021 | 11.5 | 11.0 | 30.0 | 6.5 | 5.6 | 8.1 |
| 2022 | 10.8 | 10.6 | 30.4 | 6.7 | 5.7 | 8.5 |
| 2023 | 10.2 | 11.1 | 30.6 | 7.0 | 5.8 | 8.2 |
| 2024 | 10.1 | 11.9 | 32.3 | 6.5 | 5.5 | 8.2 |
IT = information technology; KTI = knowledge and technology intensive; nec = not elsewhere classified.
Value added is the value of goods and services (gross output) minus the cost of intermediate inputs (energy, materials, and purchased services). Industry value added is a measure of an industry's contribution to overall gross domestic product. KTI industries include high R&D intensive and medium-high R&D intensive industries based on a classification by the Organisation for Economic Co-operation and Development. The data have been crosswalked to the International Standard Industrial Classification of All Economic Activities, Revision 4.
S&P Global Market Intelligence, Comparative Industry Service special tabulations, April 2025.
Science and Engineering Indicators
Industries in the Global Economy
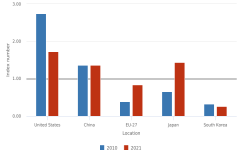
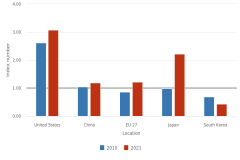
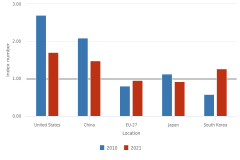
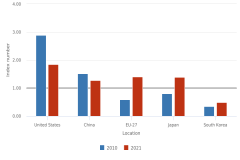
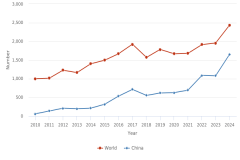
In 2024, KTI value-added manufacturing and services industries worldwide totaled $11.7 trillion in current dollars, a 4.2% increase from 2023 (Table TRN-6); this change is similar to the 4.1% in current-dollar global GDP (IMF 2025). The country share of KTI value added to GDP (or KTI production intensity) has remained relatively stable for large global economies (Table STRN-42). Among these economies, South Korea has the highest KTI production intensity, about 20% of GDP since at least 2011, followed by China (between 15% and 16% since 2002), Germany (between 14% and 16% since 2010), and the United States (about 10% from 2002 to 2019; 11% since 2020). Globally, KTI value added has accounted for between 10% and 11% of GDP, with 3%–4% from KTI services industries and 7%–8% from KTI manufacturing industries (Table TRN-6). Overall, services represent a larger share of global GDP compared with manufacturing; within KTI industries globally, however, services value added has a smaller share compared with manufacturing.
GDP = gross domestic product; ISIC, Rev.4 = International Standard Industrial Classification of All Economic Activities, Revision 4; IT = information technology; KTI = knowledge and technology intensive; nec = not elsewhere classified.
Value added is the value of goods and services (gross output) minus the cost of intermediate inputs (energy, materials, and purchased services). KTI industries include high R&D intensive and medium-high R&D intensive industries based on a classification by the Organisation for Economic Co-operation and Development. Total private services corresponds to main services in ISIC, Rev.4.
Value added data are from S&P Global Market Intelligence, Comparative Industry Service special tabulations, April 2025; GDP data are from International Monetary Fund World Economic Outlook, accessed April 2025 (available at https://www.imf.org/en/Publications/WEO/weo-database/2023/October), and Bureau of Economic Analysis, Industry Economic Accounts, accessed April 2025 (available at https://www.bea.gov/itable/national-gdp-and-personal-income).
Science and Engineering Indicators
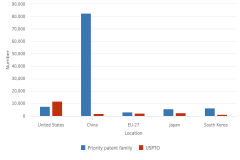
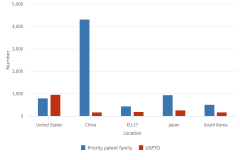
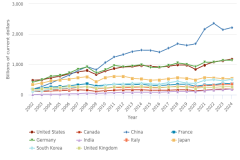
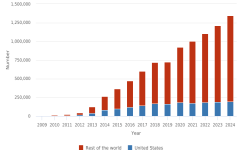
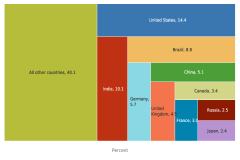
The United States, China, the EU-27, Japan, and South Korea accounted for about 80% of global KTI value added in 2024 in current dollars (Table STRN-41, Table STRN-42). The United States and China were the top two producers of KTI output globally in 2024, with $3.3 trillion (28%) and $2.9 trillion (25%), respectively, followed by the EU-27, with $2.1 trillion (18%). The EU-27 includes Germany, which accounted for about a third of the EU-27 share and 6% of global value added in 2024.
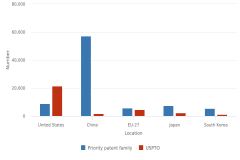
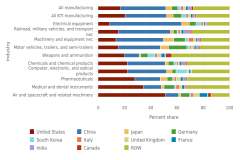
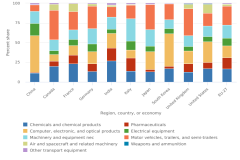
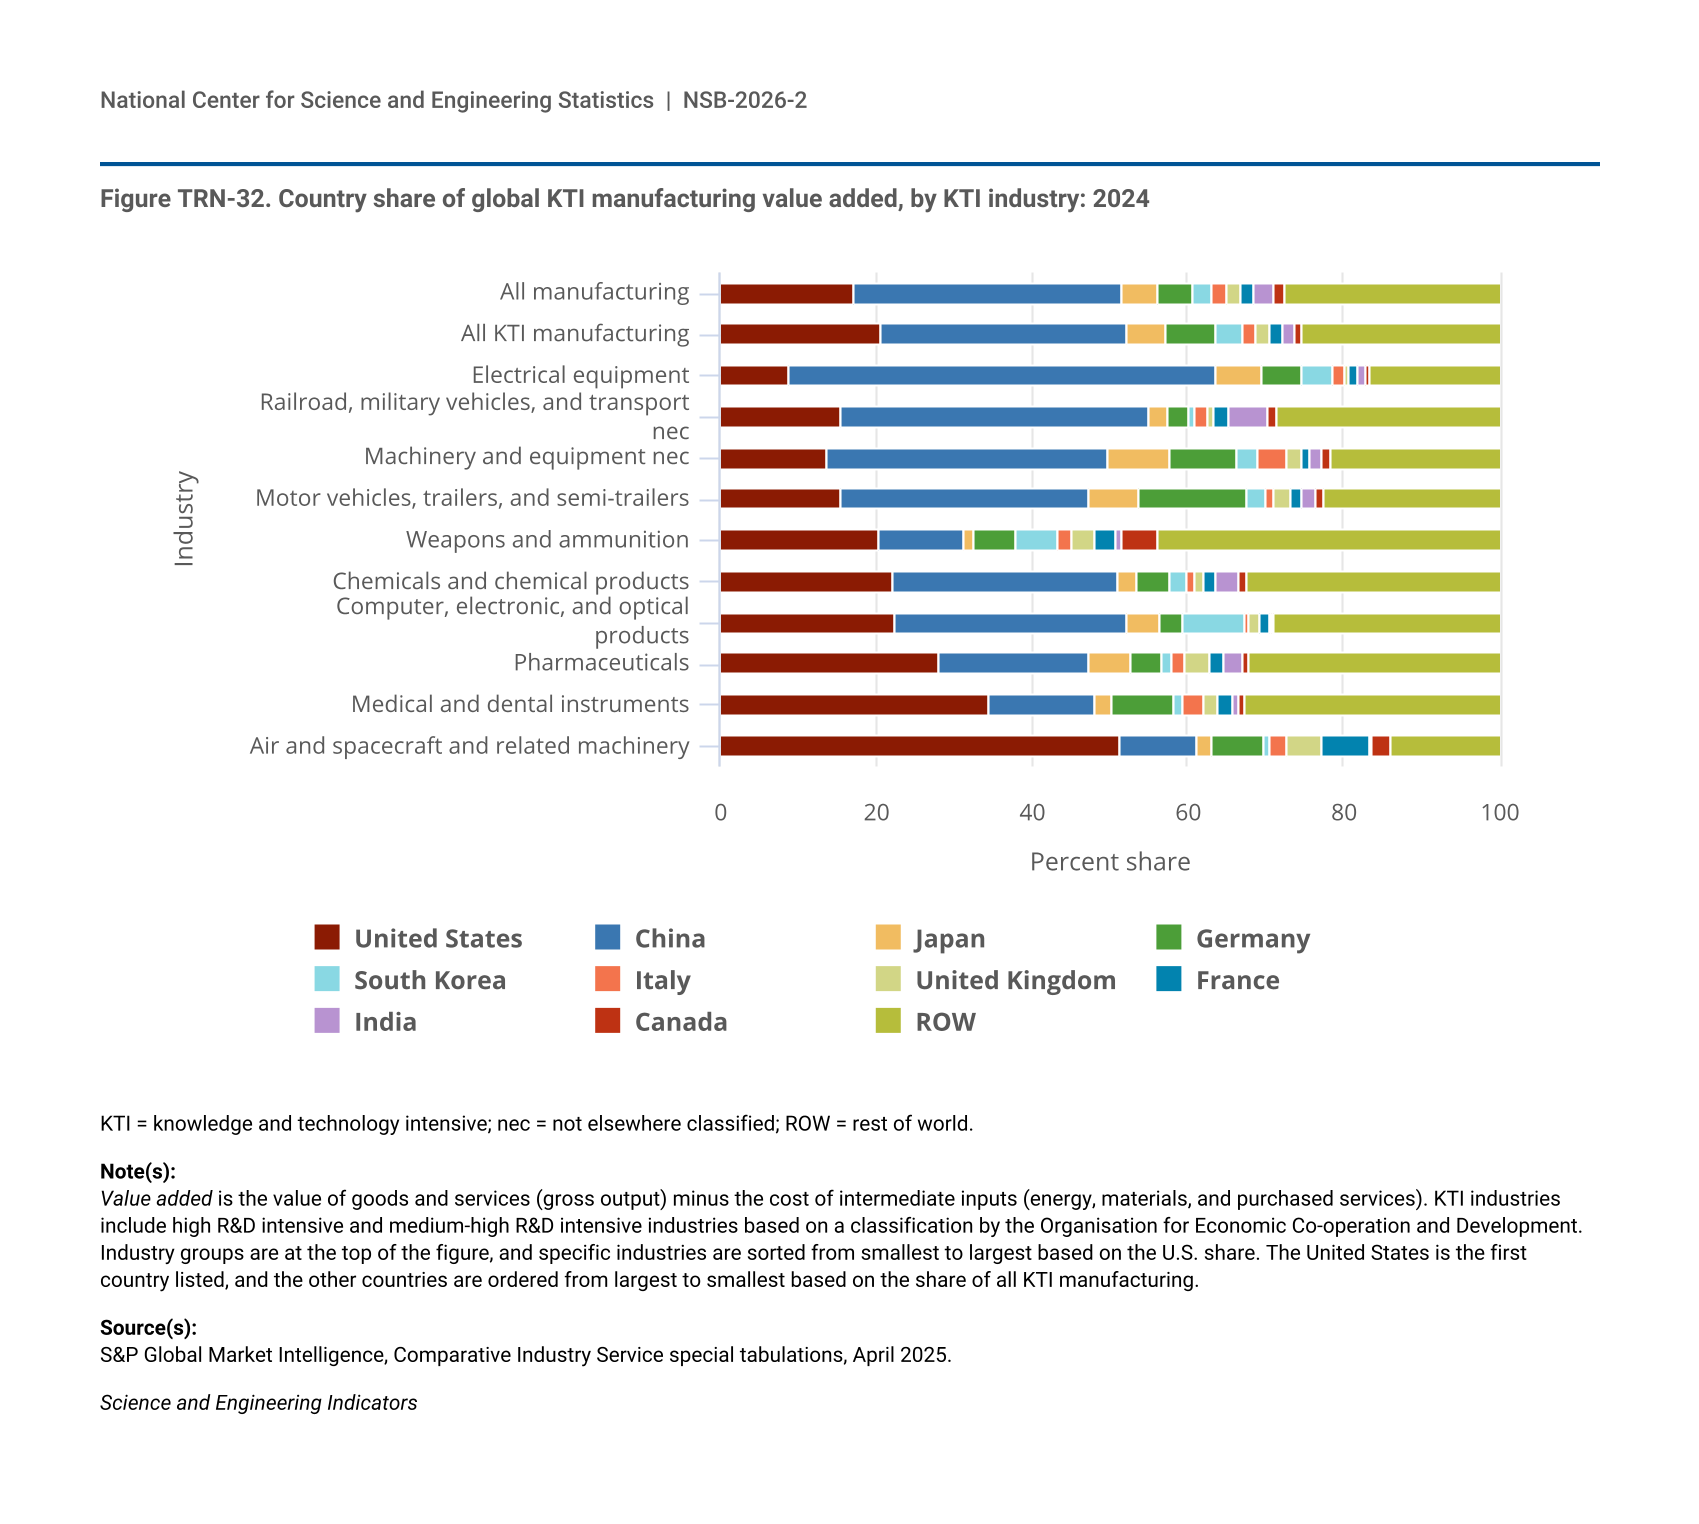
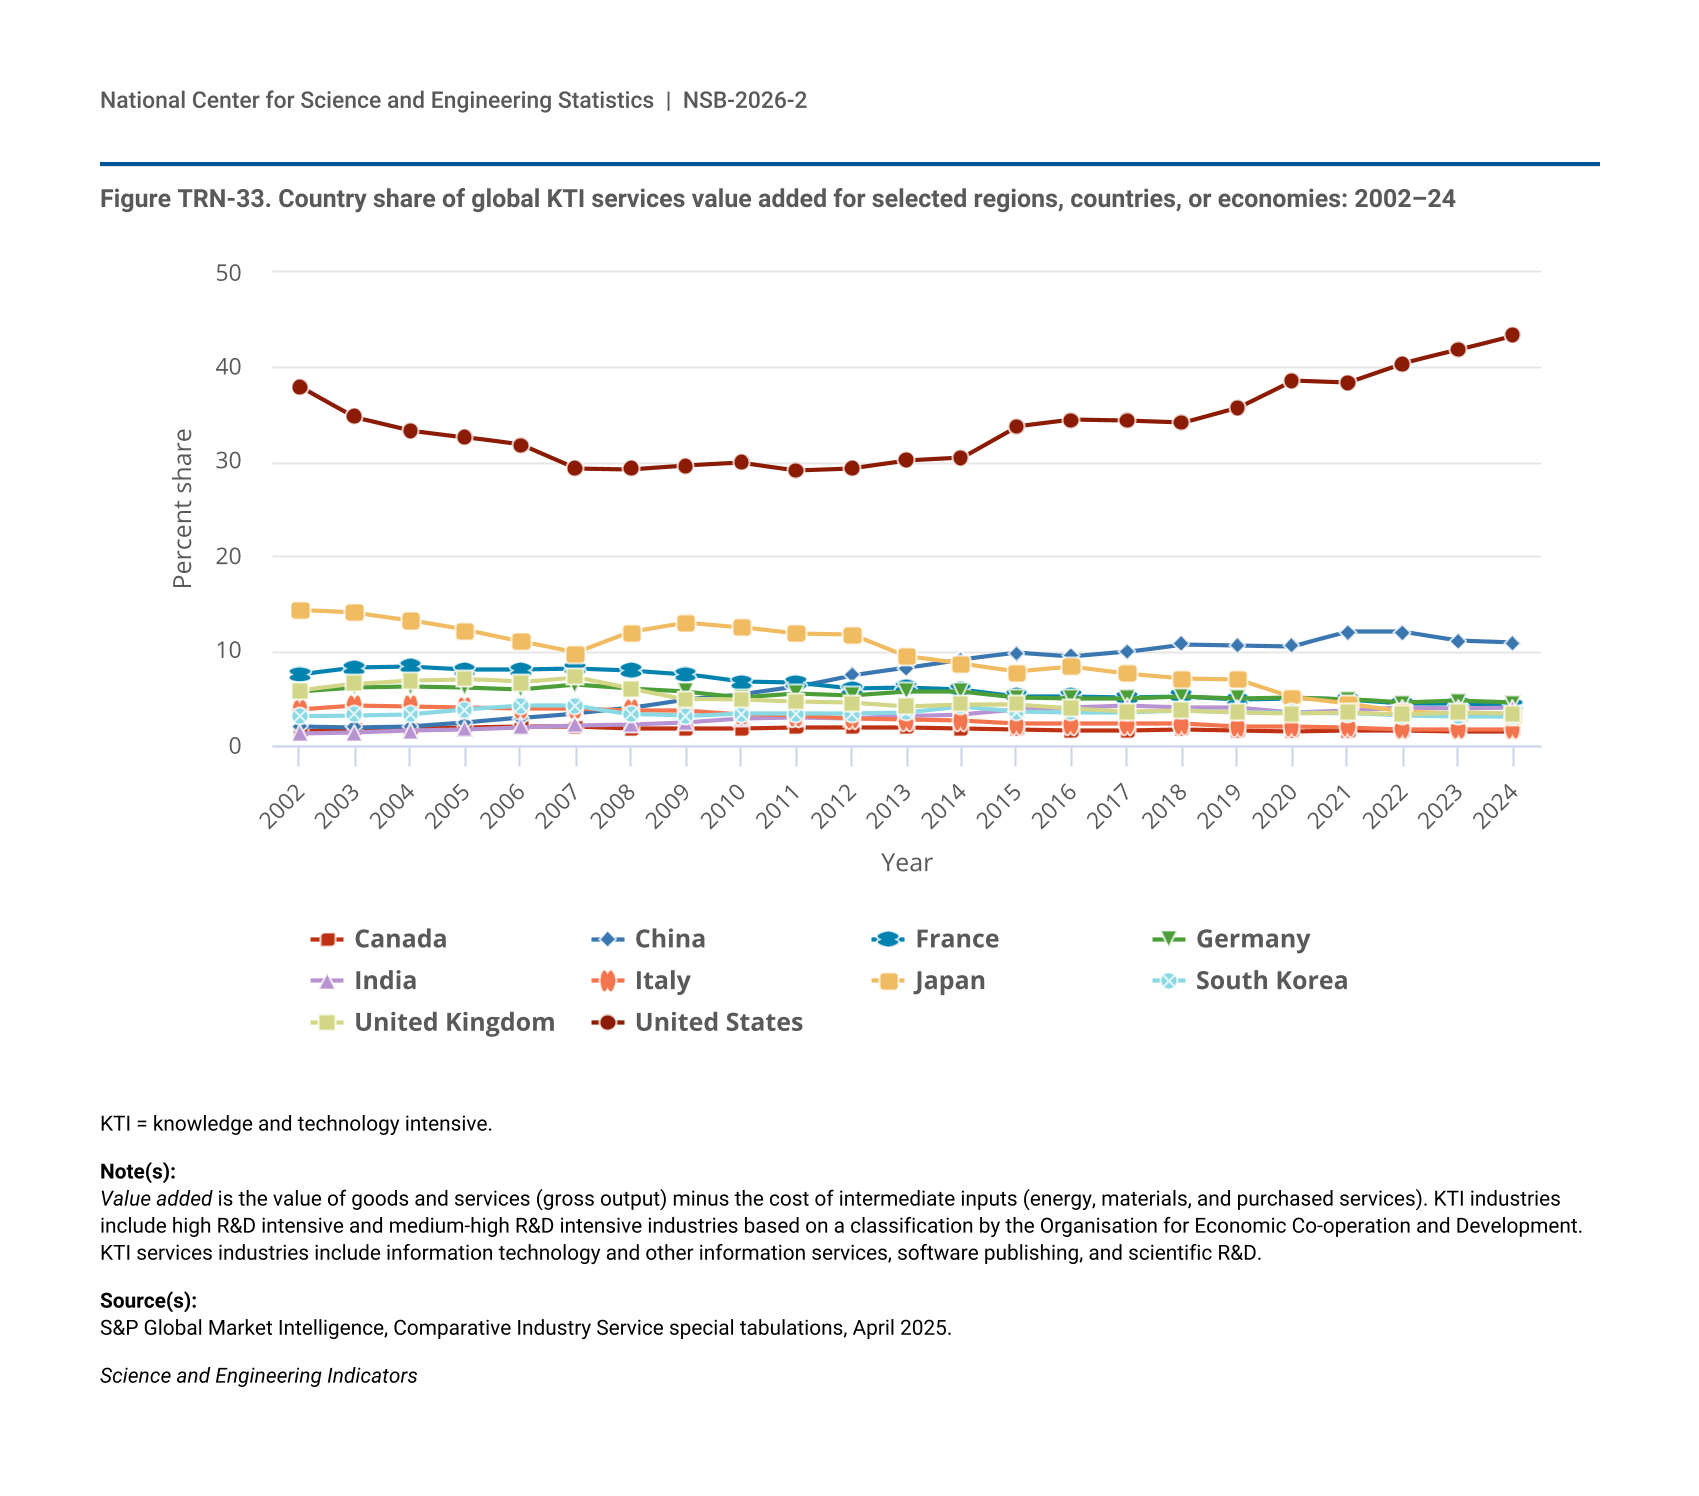
Global shares vary further by sector. China and the United States accounted for 31% and 21% of worldwide manufacturing KTI output in 2024, respectively (Figure TRN-32). These relative shares are consistent with the larger role of overall manufacturing in China’s value-added output compared with that of the United States. For KTI services output, the United States alone accounted for almost half (43%), followed by China (11%) (Figure TRN-33). South Korea had the highest KTI value added as a share of GDP in 2024 (21%).
| Industry | United States | China | Japan | Germany | South Korea | Italy | United Kingdom | France | India | Canada | ROW |
|---|---|---|---|---|---|---|---|---|---|---|---|
| All manufacturing | 17.2 | 34.4 | 4.4 | 4.7 | 2.4 | 1.8 | 1.8 | 1.7 | 2.7 | 1.2 | 27.6 |
| All KTI manufacturing | 20.7 | 31.5 | 5.0 | 6.5 | 3.4 | 1.7 | 1.8 | 1.6 | 1.6 | 0.9 | 25.4 |
| Electrical equipment | 8.8 | 55.0 | 5.9 | 4.9 | 4.1 | 1.5 | 0.7 | 1.1 | 1.0 | 0.4 | 16.7 |
| Railroad, military vehicles, and transport nec | 15.5 | 39.6 | 2.3 | 2.8 | 0.7 | 1.7 | 0.6 | 2.0 | 5.0 | 1.0 | 28.7 |
| Machinery and equipment nec | 13.6 | 36.2 | 7.9 | 8.6 | 2.7 | 3.7 | 1.8 | 1.3 | 1.4 | 1.2 | 21.6 |
| Motor vehicles, trailers, and semi-trailers | 15.4 | 32.0 | 6.2 | 13.9 | 2.4 | 1.2 | 2.1 | 1.3 | 2.0 | 1.0 | 22.4 |
| Weapons and ammunition | 20.4 | 10.8 | 1.3 | 5.4 | 5.5 | 1.7 | 2.9 | 2.7 | 0.8 | 4.6 | 43.9 |
| Chemicals and chemical products | 22.3 | 28.7 | 2.4 | 4.2 | 2.2 | 1.1 | 1.2 | 1.6 | 2.7 | 1.1 | 32.4 |
| Computer, electronic, and optical products | 22.5 | 29.6 | 4.2 | 3.1 | 7.9 | 0.6 | 1.4 | 1.1 | 0.3 | 0.4 | 28.8 |
| Pharmaceuticals | 28.0 | 19.3 | 5.3 | 4.1 | 1.5 | 1.6 | 3.2 | 1.9 | 2.4 | 0.7 | 32.1 |
| Medical and dental instruments | 34.6 | 13.6 | 2.0 | 8.1 | 1.1 | 2.6 | 1.8 | 1.9 | 1.0 | 0.6 | 32.7 |
| Air and spacecraft and related machinery | 51.4 | 9.8 | 2.0 | 6.7 | 0.6 | 2.3 | 4.4 | 6.3 | 0.3 | 2.4 | 13.8 |
KTI = knowledge and technology intensive; nec = not elsewhere classified; ROW = rest of world.
Value added is the value of goods and services (gross output) minus the cost of intermediate inputs (energy, materials, and purchased services). KTI industries include high R&D intensive and medium-high R&D intensive industries based on a classification by the Organisation for Economic Co-operation and Development. Industry groups are at the top of the figure, and specific industries are sorted from smallest to largest based on the U.S. share. The United States is the first country listed, and the other countries are ordered from largest to smallest based on the share of all KTI manufacturing.
S&P Global Market Intelligence, Comparative Industry Service special tabulations, April 2025.
Science and Engineering Indicators
| Year | Canada | China | France | Germany | India | Italy | Japan | South Korea | United Kingdom | United States |
|---|---|---|---|---|---|---|---|---|---|---|
| 2002 | 1.5 | 2.0 | 7.5 | 5.7 | 1.3 | 3.8 | 14.3 | 3.1 | 5.8 | 37.9 |
| 2003 | 1.7 | 1.9 | 8.2 | 6.1 | 1.4 | 4.2 | 14.0 | 3.2 | 6.5 | 34.7 |
| 2004 | 1.8 | 2.0 | 8.3 | 6.2 | 1.6 | 4.1 | 13.2 | 3.3 | 6.9 | 33.3 |
| 2005 | 1.9 | 2.4 | 8.0 | 6.1 | 1.7 | 4.0 | 12.2 | 3.8 | 7.0 | 32.6 |
| 2006 | 2.0 | 2.9 | 8.0 | 5.9 | 1.9 | 3.9 | 11.0 | 4.2 | 6.7 | 31.8 |
| 2007 | 2.0 | 3.4 | 8.1 | 6.4 | 2.1 | 3.9 | 9.8 | 4.2 | 7.2 | 29.3 |
| 2008 | 1.8 | 4.0 | 7.9 | 6.0 | 2.2 | 3.7 | 12.0 | 3.3 | 6.0 | 29.2 |
| 2009 | 1.8 | 4.9 | 7.5 | 5.7 | 2.4 | 3.7 | 13.0 | 3.1 | 4.9 | 29.6 |
| 2010 | 1.8 | 5.4 | 6.7 | 5.1 | 2.8 | 3.3 | 12.5 | 3.4 | 4.8 | 29.9 |
| 2011 | 1.9 | 6.2 | 6.6 | 5.5 | 2.9 | 3.1 | 11.8 | 3.4 | 4.6 | 29.1 |
| 2012 | 1.9 | 7.4 | 6.0 | 5.3 | 2.8 | 2.8 | 11.7 | 3.4 | 4.5 | 29.3 |
| 2013 | 1.9 | 8.2 | 6.1 | 5.7 | 3.1 | 2.7 | 9.4 | 3.5 | 4.1 | 30.1 |
| 2014 | 1.8 | 9.1 | 5.9 | 5.7 | 3.3 | 2.6 | 8.6 | 4.1 | 4.3 | 30.4 |
| 2015 | 1.7 | 9.8 | 5.2 | 5.1 | 3.8 | 2.3 | 7.8 | 3.6 | 4.3 | 33.7 |
| 2016 | 1.6 | 9.4 | 5.2 | 5.0 | 4.0 | 2.3 | 8.3 | 3.5 | 3.9 | 34.4 |
| 2017 | 1.6 | 9.9 | 5.1 | 5.0 | 4.2 | 2.3 | 7.6 | 3.5 | 3.6 | 34.3 |
| 2018 | 1.7 | 10.7 | 5.2 | 5.2 | 4.0 | 2.3 | 7.1 | 3.7 | 3.7 | 34.1 |
| 2019 | 1.6 | 10.6 | 4.9 | 5.0 | 4.0 | 2.0 | 7.0 | 3.5 | 3.5 | 35.7 |
| 2020 | 1.5 | 10.5 | 5.0 | 5.1 | 3.5 | 2.0 | 5.1 | 3.5 | 3.4 | 38.6 |
| 2021 | 1.6 | 12.0 | 4.8 | 4.9 | 3.7 | 1.9 | 4.4 | 3.4 | 3.5 | 38.4 |
| 2022 | 1.6 | 12.0 | 4.4 | 4.5 | 4.0 | 1.7 | 3.6 | 3.1 | 3.3 | 40.4 |
| 2023 | 1.5 | 11.1 | 4.4 | 4.7 | 3.9 | 1.7 | 3.4 | 3.0 | 3.5 | 41.8 |
| 2024 | 1.5 | 10.9 | 4.2 | 4.5 | 4.0 | 1.7 | 3.0 | 3.0 | 3.4 | 43.3 |
KTI = knowledge and technology intensive.
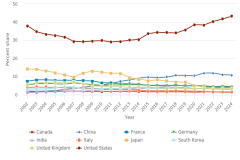
Value added is the value of goods and services (gross output) minus the cost of intermediate inputs (energy, materials, and purchased services). KTI industries include high R&D intensive and medium-high R&D intensive industries based on a classification by the Organisation for Economic Co-operation and Development. KTI services industries include information technology and other information services, software publishing, and scientific R&D.
S&P Global Market Intelligence, Comparative Industry Service special tabulations, April 2025.
Science and Engineering Indicators
Sectoral and Industry Distributions
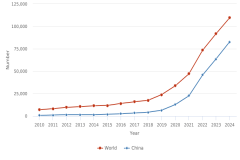
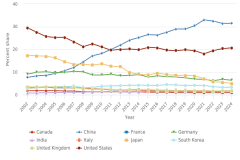
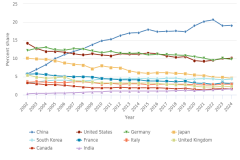
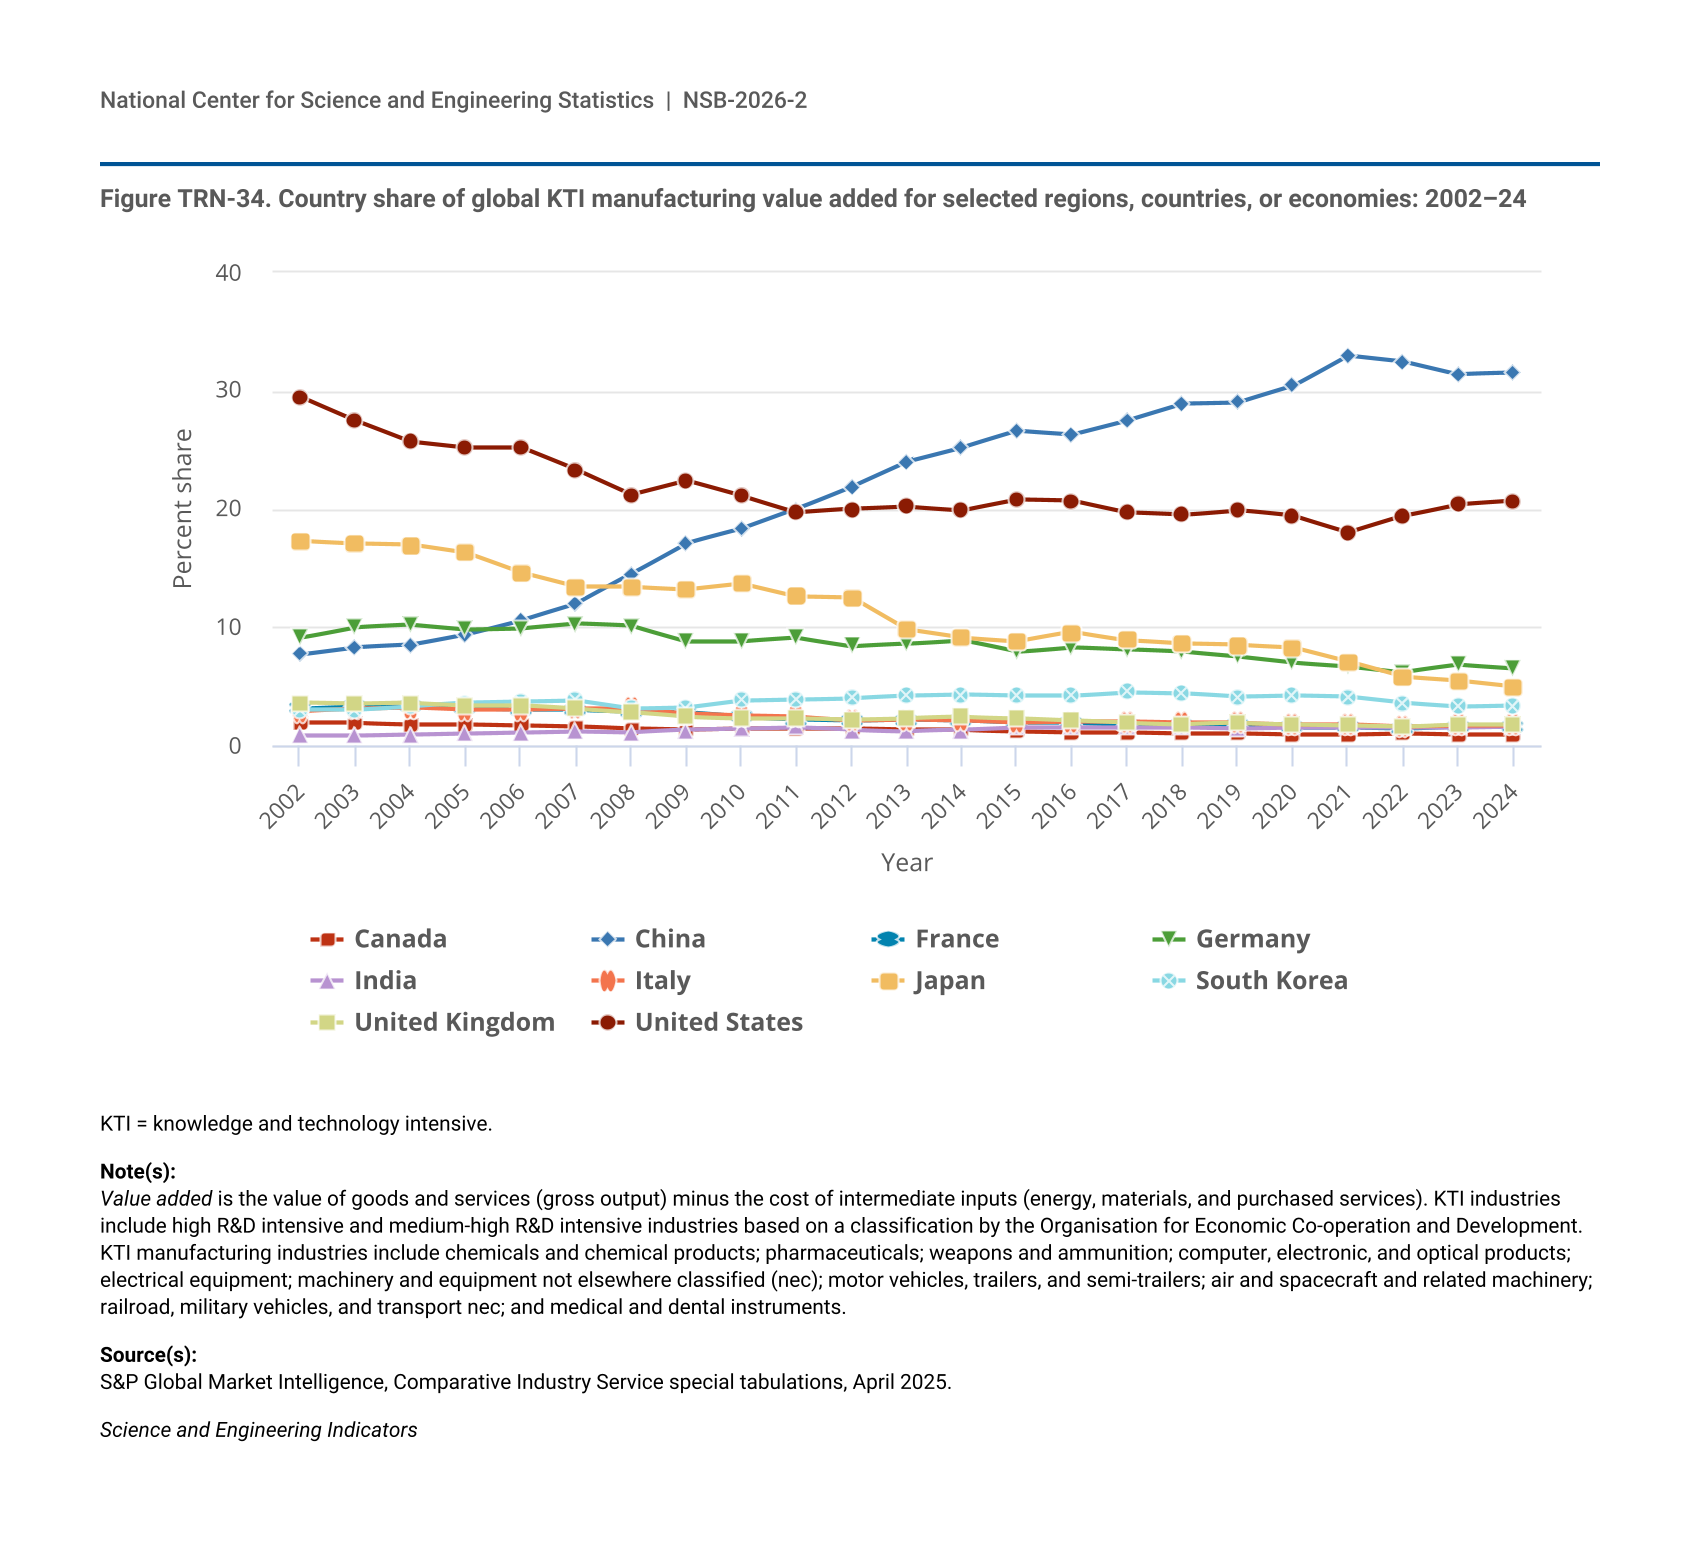
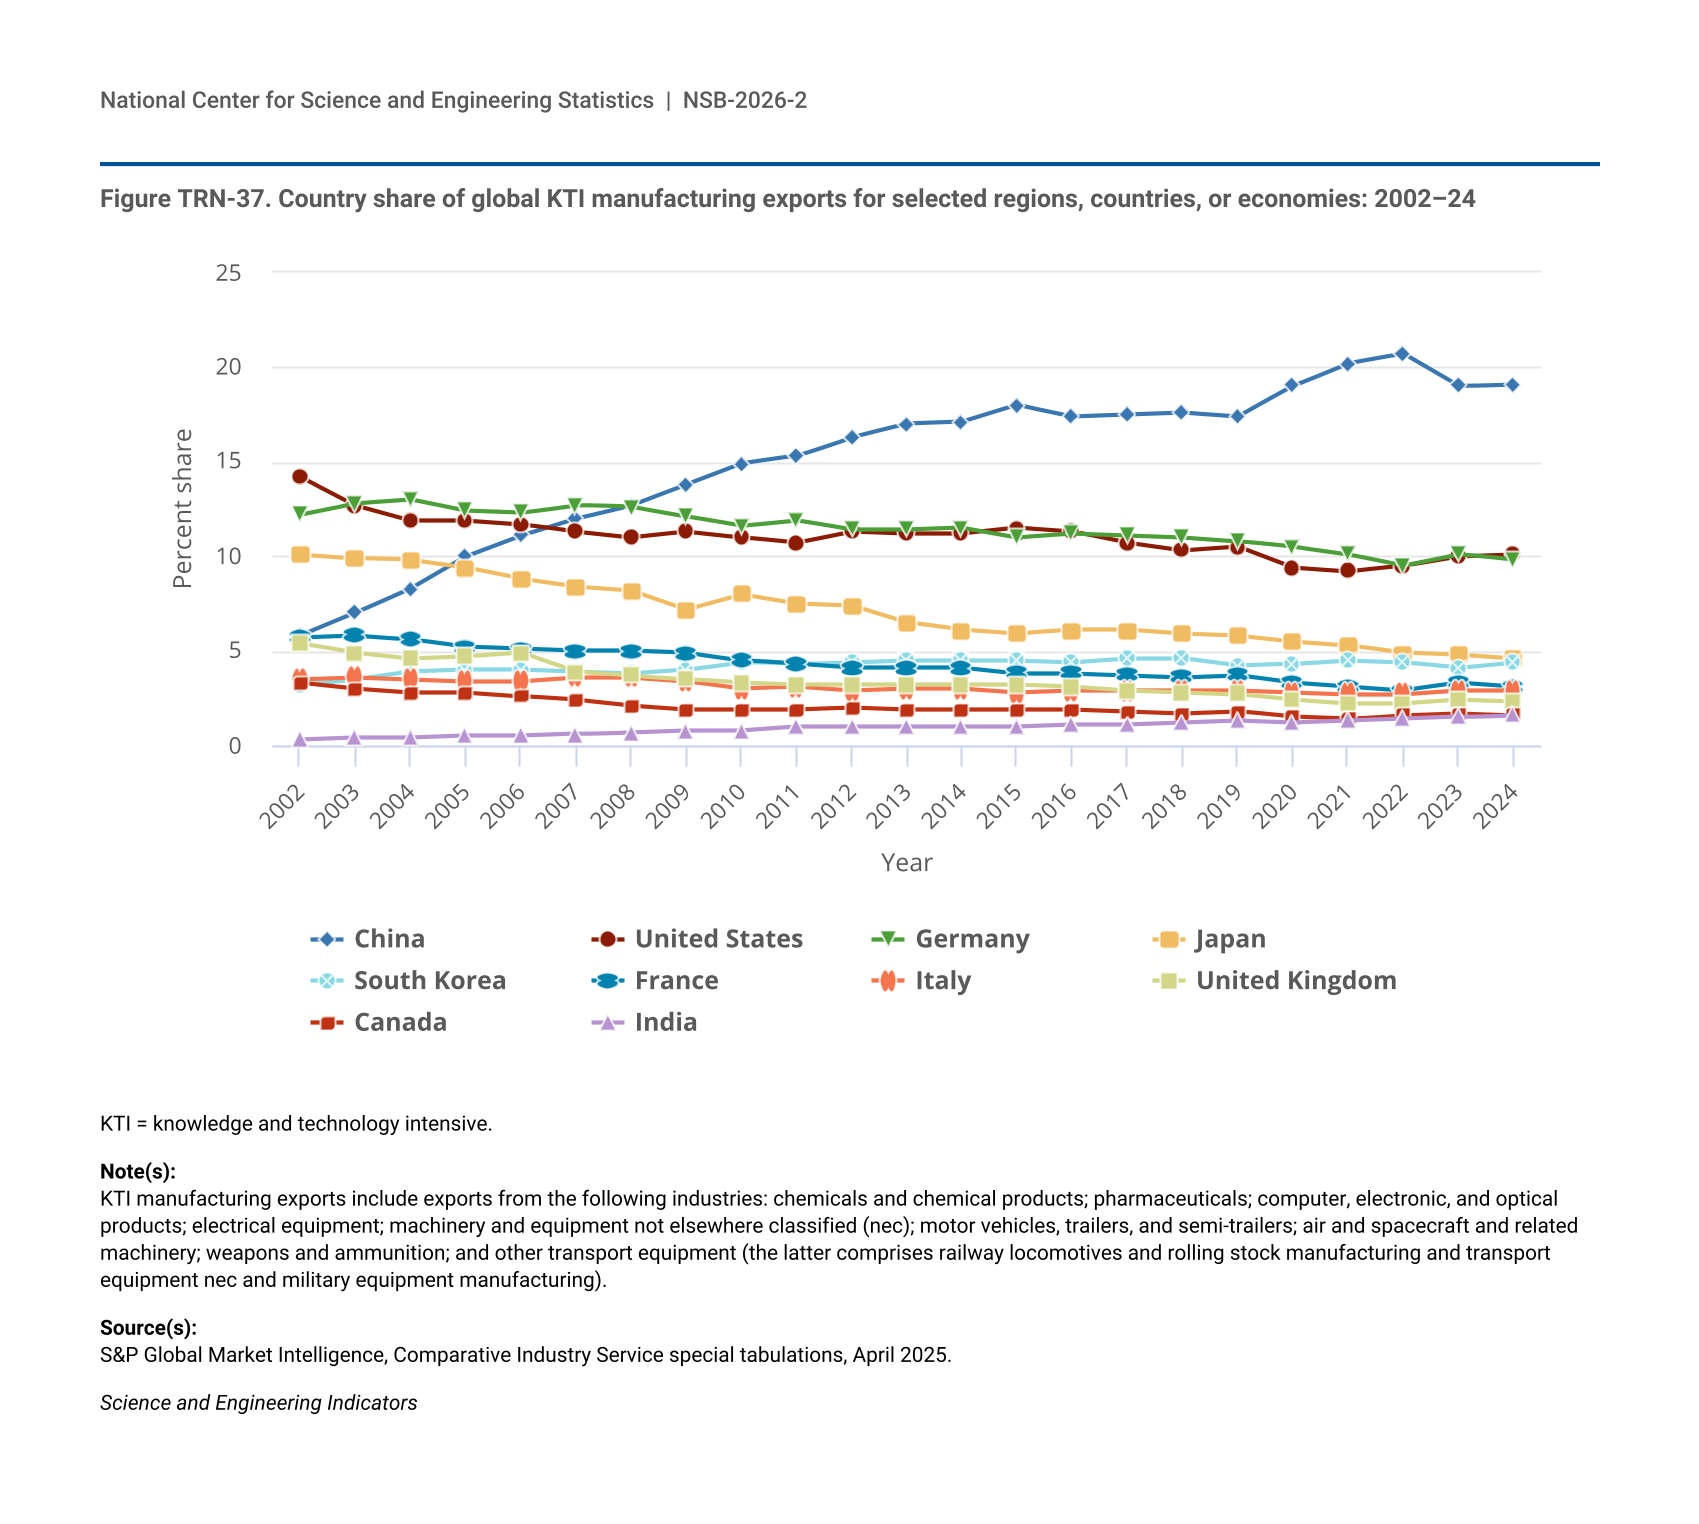
China has been the largest KTI manufacturer measured by value-added production since 2011 (31% share of the worldwide total in 2024) (Figure TRN-34), despite recent geopolitical and pandemic-related disruptions and ongoing global restructuring in trade and production supply chains (Alfaro and Chor 2023; IMF 2025:3–4, 8, 15, 18, 21). The long-term increase in China’s KTI manufacturing share was accompanied by declines in KTI manufacturing shares of the United States, Japan, and Germany (Figure TRN-34); see also Branstetter and Li (2022). Since 2011, the United States has accounted for around 20% of global manufacturing KTI value added (21% in 2024), compared with 25% in 2006 and about 30% in 2002. The shares of global manufacturing KTI value added for Japan and Germany also declined over this period; see also Baily, Bosworth, and Doshi (2020) and Baldwin (2024).
| Year | Canada | China | France | Germany | India | Italy | Japan | South Korea | United Kingdom | United States |
|---|---|---|---|---|---|---|---|---|---|---|
| 2002 | 1.9 | 7.7 | 3.1 | 9.1 | 0.8 | 2.9 | 17.3 | 3.0 | 3.6 | 29.5 |
| 2003 | 1.9 | 8.3 | 3.3 | 10.0 | 0.8 | 3.1 | 17.1 | 3.0 | 3.5 | 27.5 |
| 2004 | 1.8 | 8.5 | 3.3 | 10.2 | 0.9 | 3.2 | 17.0 | 3.3 | 3.6 | 25.7 |
| 2005 | 1.8 | 9.4 | 3.1 | 9.8 | 1.0 | 3.0 | 16.3 | 3.6 | 3.4 | 25.2 |
| 2006 | 1.7 | 10.6 | 3.0 | 9.9 | 1.1 | 3.0 | 14.6 | 3.7 | 3.4 | 25.2 |
| 2007 | 1.6 | 12.0 | 3.0 | 10.3 | 1.2 | 3.1 | 13.4 | 3.8 | 3.1 | 23.3 |
| 2008 | 1.4 | 14.5 | 2.9 | 10.1 | 1.1 | 3.1 | 13.4 | 3.1 | 2.8 | 21.2 |
| 2009 | 1.3 | 17.1 | 2.8 | 8.8 | 1.3 | 2.7 | 13.2 | 3.2 | 2.4 | 22.4 |
| 2010 | 1.4 | 18.3 | 2.4 | 8.8 | 1.4 | 2.5 | 13.7 | 3.8 | 2.3 | 21.1 |
| 2011 | 1.4 | 20.0 | 2.2 | 9.1 | 1.5 | 2.4 | 12.6 | 3.9 | 2.3 | 19.7 |
| 2012 | 1.4 | 21.9 | 2.1 | 8.4 | 1.3 | 2.1 | 12.5 | 4.0 | 2.2 | 20.0 |
| 2013 | 1.3 | 24.0 | 2.2 | 8.6 | 1.2 | 2.2 | 9.8 | 4.2 | 2.3 | 20.2 |
| 2014 | 1.3 | 25.2 | 2.1 | 8.9 | 1.3 | 2.1 | 9.1 | 4.3 | 2.4 | 19.9 |
| 2015 | 1.2 | 26.6 | 1.9 | 7.9 | 1.5 | 1.9 | 8.8 | 4.2 | 2.3 | 20.8 |
| 2016 | 1.1 | 26.3 | 1.9 | 8.3 | 1.5 | 2.0 | 9.6 | 4.2 | 2.1 | 20.7 |
| 2017 | 1.1 | 27.5 | 1.8 | 8.1 | 1.5 | 2.0 | 8.9 | 4.5 | 1.9 | 19.7 |
| 2018 | 1.0 | 28.9 | 1.7 | 7.9 | 1.5 | 1.9 | 8.6 | 4.4 | 1.8 | 19.5 |
| 2019 | 1.0 | 29.0 | 1.8 | 7.5 | 1.4 | 1.9 | 8.5 | 4.1 | 1.9 | 19.9 |
| 2020 | 0.9 | 30.4 | 1.5 | 7.0 | 1.5 | 1.8 | 8.3 | 4.2 | 1.8 | 19.4 |
| 2021 | 0.9 | 33.0 | 1.5 | 6.7 | 1.5 | 1.8 | 7.1 | 4.1 | 1.7 | 18.0 |
| 2022 | 1.0 | 32.5 | 1.4 | 6.2 | 1.5 | 1.6 | 5.8 | 3.6 | 1.6 | 19.4 |
| 2023 | 0.9 | 31.4 | 1.6 | 6.8 | 1.5 | 1.7 | 5.5 | 3.3 | 1.8 | 20.4 |
| 2024 | 0.9 | 31.5 | 1.6 | 6.5 | 1.6 | 1.7 | 5.0 | 3.4 | 1.8 | 20.7 |
KTI = knowledge and technology intensive.
Value added is the value of goods and services (gross output) minus the cost of intermediate inputs (energy, materials, and purchased services). KTI industries include high R&D intensive and medium-high R&D intensive industries based on a classification by the Organisation for Economic Co-operation and Development. KTI manufacturing industries include chemicals and chemical products; pharmaceuticals; weapons and ammunition; computer, electronic, and optical products; electrical equipment; machinery and equipment not elsewhere classified (nec); motor vehicles, trailers, and semi-trailers; air and spacecraft and related machinery; railroad, military vehicles, and transport nec; and medical and dental instruments.
S&P Global Market Intelligence, Comparative Industry Service special tabulations, April 2025.
Science and Engineering Indicators
Even though China had the largest global share in total manufacturing and KTI manufacturing value added in 2024, the United States had the largest share in four KTI industries: air and spacecraft and related machinery (51%), medical and dental instruments (35%), pharmaceuticals (including pharmaceutical biotechnology) (28%), and weapons and ammunitions (20%) (Figure TRN-32). China accounted for the second-largest shares for all four industries. China continued to have the largest shares in the other six KTI manufacturing industries in 2024: electrical equipment (55%); railroad, military vehicles, and other transport equipment not elsewhere classified (nec), which includes military fighting vehicles (40%); machinery and equipment nec (36%); motor vehicles, trailers, and semi-trailers (which includes electric vehicles [EVs]) (32%); chemicals and chemical products (excluding pharmaceuticals) (29%); and computer, electronic, and optical products (including semiconductors) (30%).
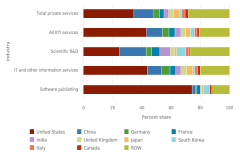
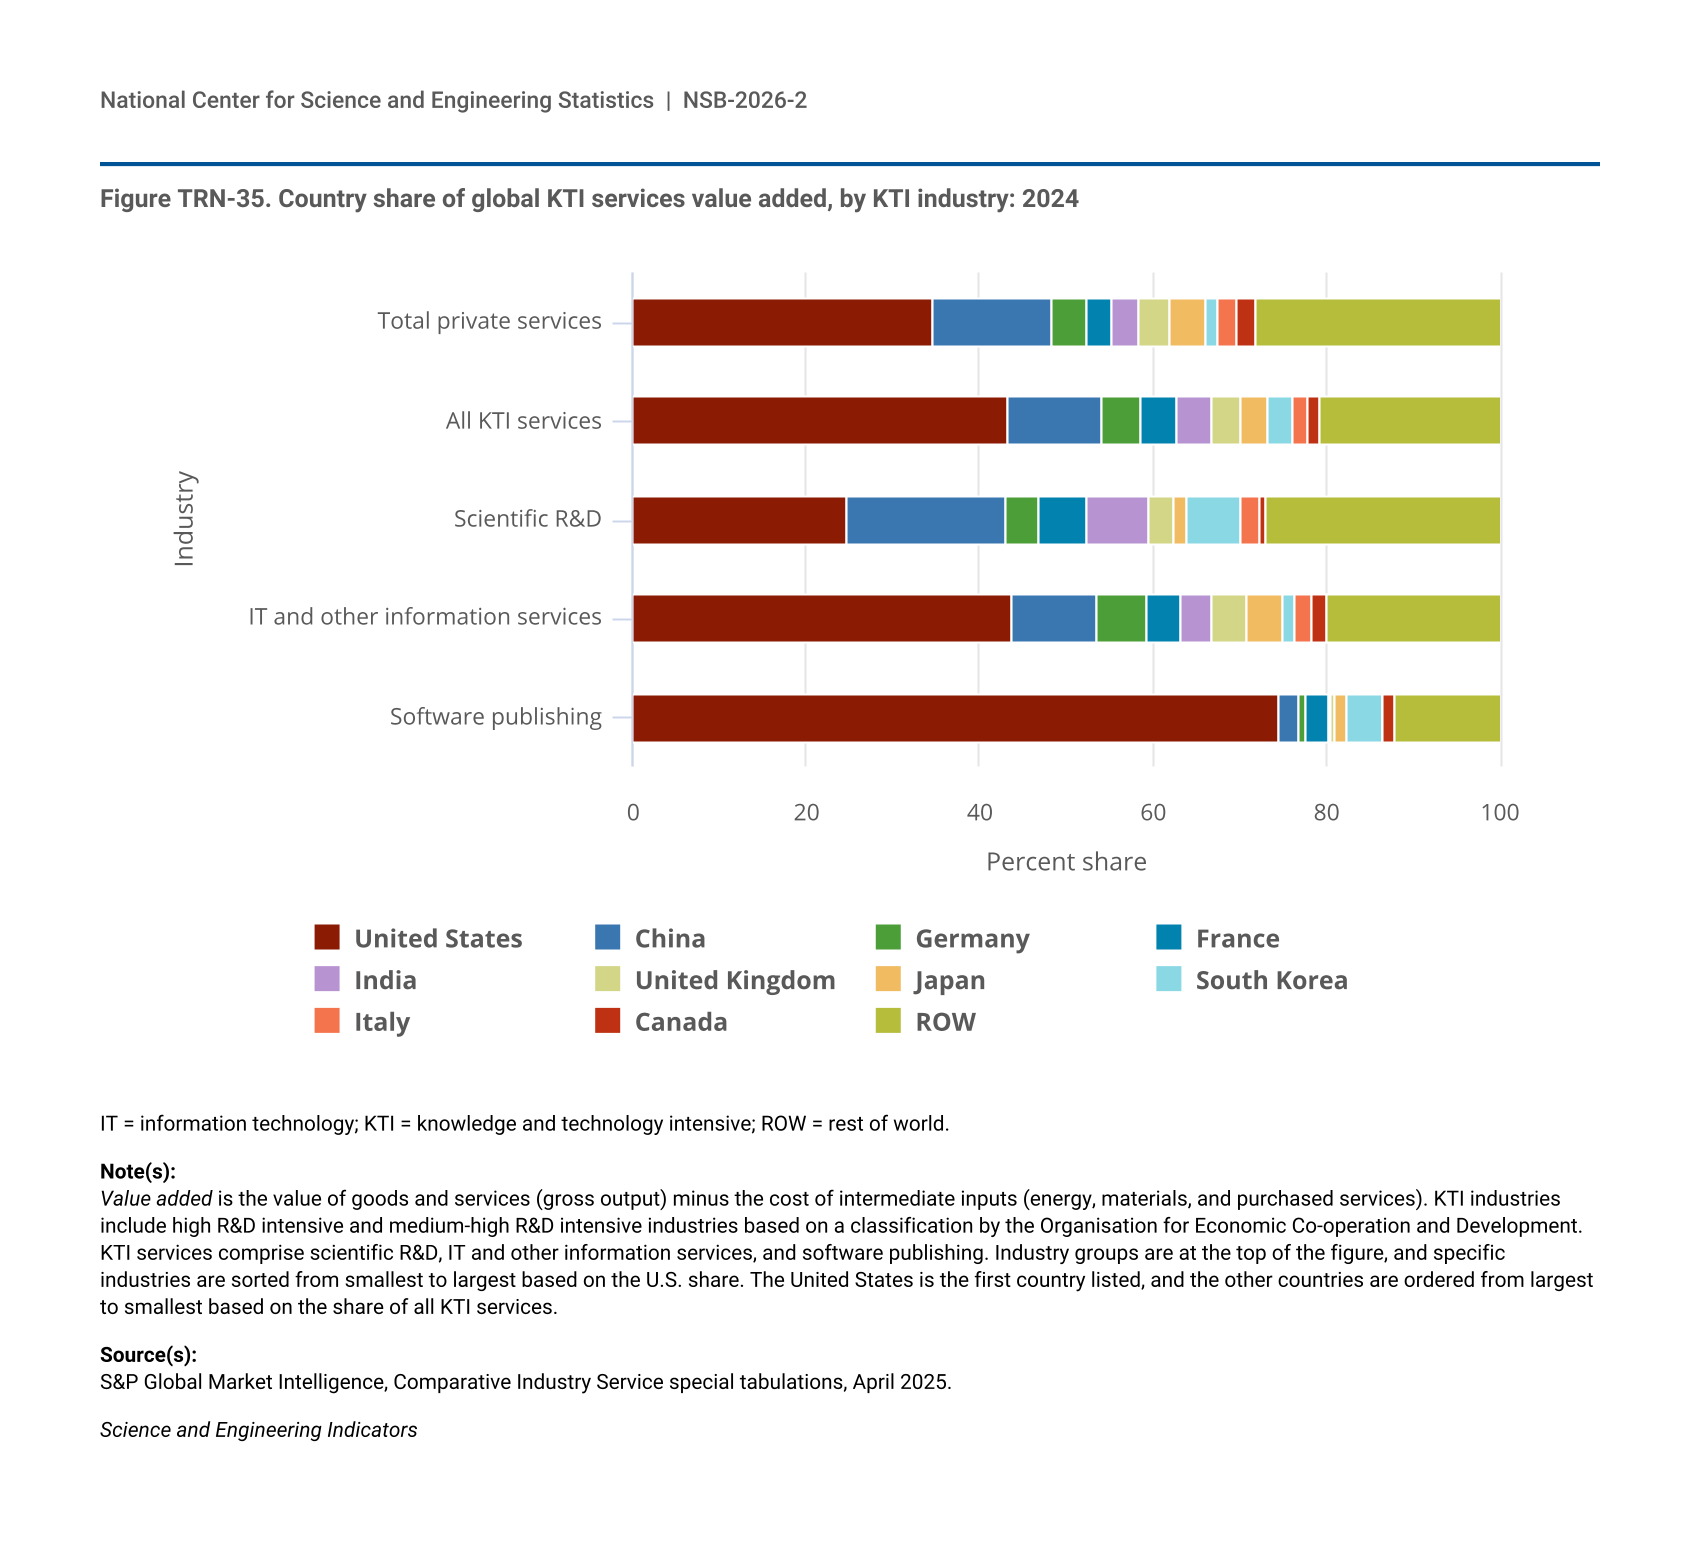
The United States continues to be the top KTI services industries producer in 2024, with a 43% global share, with China second at 11% (Figure TRN-33). Within KTI services industries, the U.S. global share was largest for software publishing (75%), followed by IT and information services (44%) and then by scientific R&D services (25%) in 2024. For China, India, South Korea, and France, the largest global KTI services share was in scientific R&D services (18%, 7%, 6%, and 6%, respectively) (Figure TRN-35).
| Industry | United States | China | Germany | France | India | United Kingdom | Japan | South Korea | Italy | Canada | ROW |
|---|---|---|---|---|---|---|---|---|---|---|---|
| Total private services | 34.5 | 13.8 | 4.0 | 3.1 | 2.9 | 3.8 | 4.0 | 1.5 | 2.2 | 2.1 | 28.1 |
| All KTI services | 43.3 | 10.9 | 4.5 | 4.2 | 4.0 | 3.4 | 3.0 | 3.0 | 1.7 | 1.5 | 20.6 |
| Scientific R&D | 24.9 | 18.2 | 3.8 | 5.6 | 7.1 | 2.9 | 1.5 | 6.2 | 2.2 | 0.7 | 27.0 |
| IT and other information services | 43.7 | 9.9 | 5.6 | 4.0 | 3.5 | 4.2 | 4.0 | 1.5 | 1.8 | 1.8 | 19.9 |
| Software publishing | 74.6 | 2.3 | 0.8 | 2.6 | 0.4 | 0.5 | 1.3 | 4.1 | 0.0 | 1.5 | 12.0 |
IT = information technology; KTI = knowledge and technology intensive; ROW = rest of world.
Value added is the value of goods and services (gross output) minus the cost of intermediate inputs (energy, materials, and purchased services). KTI industries include high R&D intensive and medium-high R&D intensive industries based on a classification by the Organisation for Economic Co-operation and Development. KTI services comprise scientific R&D, IT and other information services, and software publishing. Industry groups are at the top of the figure, and specific industries are sorted from smallest to largest based on the U.S. share. The United States is the first country listed, and the other countries are ordered from largest to smallest based on the share of all KTI services.
S&P Global Market Intelligence, Comparative Industry Service special tabulations, April 2025.
Science and Engineering Indicators
Global Semiconductor Production
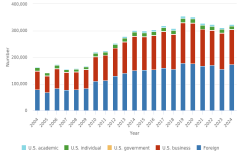
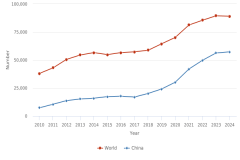
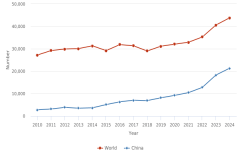
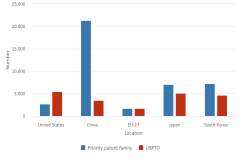
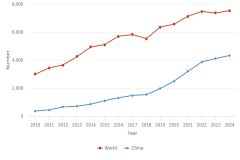
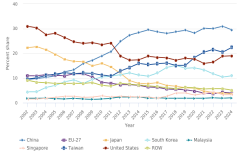
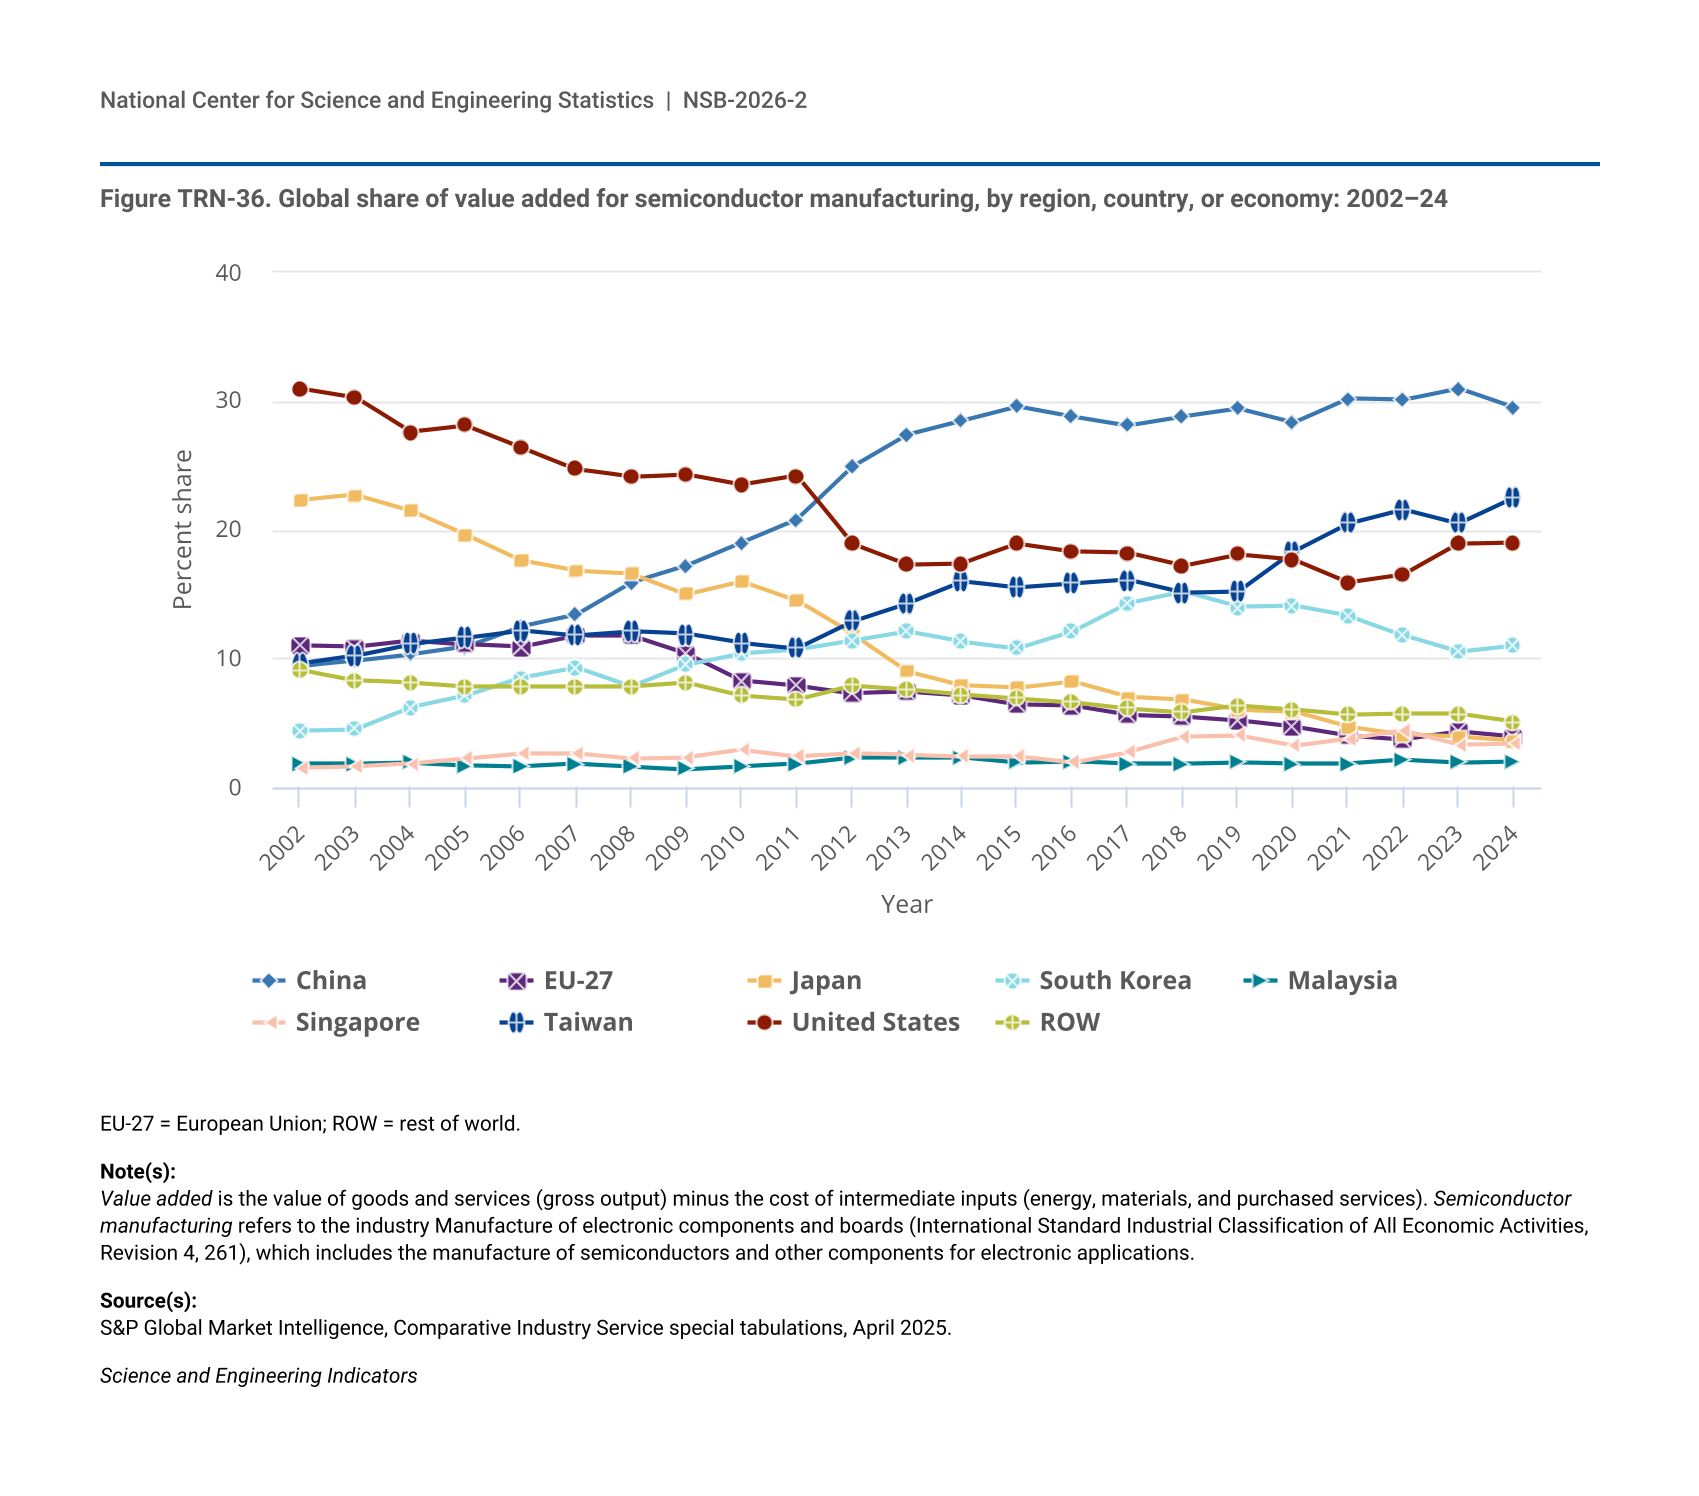
Semiconductors (also called computer chips or microchips) are key enabling components of many CETs, such as AI, QIST, EVs, autonomous systems, robotics, advanced manufacturing, and defense and aerospace technologies, contributing to national and economic security (CRS 2020, 2023a; VerWey 2019). The CHIPS and Science Act of 2022 (NSTC 2025) appropriated $52.7 billion to strengthen the U.S. semiconductor industry (CRS 2023a). Semiconductor production occurs along GVCs that include R&D, engineering, and design; fabrication; and assembly, testing, and packing stages (CRS 2023b). Modular production and cost advantages in Asia facilitated the separation of R&D and design and production stages starting in the late 1970s and early 1980s, with the emergence of semiconductor foundries in Taiwan and other Asian locations that had been established with foreign direct investment (CRS 2020; Yoffie 1993) or performing contract manufacturing for design-only companies (Kuan and West 2023). In 2002 and 2003, the United States and Japan together accounted for over half (53%) of value-added semiconductor production, with the EU-27 producing another 11% (Figure TRN-36). Since 2002, China, Taiwan, and South Korea have substantially increased their shares of global value-added semiconductor production (Branstetter and Li 2023; CRS 2020; Torsekar and VerWey 2019). In 2024, just over half (52%) of global value-added semiconductor production occurred in China (30%) and Taiwan (22%), followed by the United States (19%) and South Korea (11%) (Figure TRN-36).
| Year | China | EU-27 | Japan | South Korea | Malaysia | Singapore | Taiwan | United States | ROW |
|---|---|---|---|---|---|---|---|---|---|
| 2002 | 9.4 | 11.0 | 22.3 | 4.4 | 1.8 | 1.5 | 9.6 | 31.0 | 9.1 |
| 2003 | 9.8 | 10.9 | 22.7 | 4.5 | 1.8 | 1.6 | 10.2 | 30.3 | 8.3 |
| 2004 | 10.3 | 11.4 | 21.5 | 6.2 | 1.9 | 1.8 | 11.1 | 27.6 | 8.1 |
| 2005 | 10.9 | 11.1 | 19.6 | 7.1 | 1.7 | 2.2 | 11.6 | 28.1 | 7.8 |
| 2006 | 12.5 | 10.9 | 17.6 | 8.5 | 1.6 | 2.6 | 12.2 | 26.4 | 7.8 |
| 2007 | 13.4 | 11.8 | 16.8 | 9.3 | 1.8 | 2.6 | 11.8 | 24.7 | 7.8 |
| 2008 | 15.9 | 11.8 | 16.6 | 7.8 | 1.6 | 2.2 | 12.1 | 24.1 | 7.8 |
| 2009 | 17.2 | 10.4 | 15.0 | 9.5 | 1.4 | 2.3 | 11.9 | 24.3 | 8.1 |
| 2010 | 19.0 | 8.3 | 16.0 | 10.4 | 1.6 | 2.9 | 11.2 | 23.5 | 7.1 |
| 2011 | 20.8 | 7.9 | 14.5 | 10.7 | 1.8 | 2.4 | 10.8 | 24.2 | 6.8 |
| 2012 | 24.9 | 7.3 | 11.9 | 11.4 | 2.3 | 2.6 | 12.9 | 18.9 | 7.9 |
| 2013 | 27.4 | 7.4 | 9.0 | 12.1 | 2.3 | 2.5 | 14.3 | 17.3 | 7.6 |
| 2014 | 28.5 | 7.1 | 7.9 | 11.3 | 2.3 | 2.4 | 16.0 | 17.4 | 7.2 |
| 2015 | 29.6 | 6.4 | 7.7 | 10.8 | 1.9 | 2.4 | 15.5 | 18.9 | 6.9 |
| 2016 | 28.8 | 6.3 | 8.2 | 12.1 | 2.0 | 1.9 | 15.8 | 18.3 | 6.6 |
| 2017 | 28.1 | 5.6 | 7.0 | 14.3 | 1.8 | 2.7 | 16.1 | 18.2 | 6.1 |
| 2018 | 28.8 | 5.5 | 6.8 | 15.2 | 1.8 | 3.9 | 15.1 | 17.2 | 5.8 |
| 2019 | 29.4 | 5.2 | 6.0 | 14.0 | 1.9 | 4.0 | 15.2 | 18.1 | 6.3 |
| 2020 | 28.3 | 4.7 | 5.9 | 14.1 | 1.8 | 3.2 | 18.3 | 17.7 | 6.0 |
| 2021 | 30.2 | 4.0 | 4.7 | 13.3 | 1.8 | 3.8 | 20.5 | 15.9 | 5.6 |
| 2022 | 30.1 | 3.7 | 4.1 | 11.8 | 2.1 | 4.4 | 21.6 | 16.5 | 5.7 |
| 2023 | 31.0 | 4.3 | 3.9 | 10.5 | 1.9 | 3.3 | 20.5 | 18.9 | 5.7 |
| 2024 | 29.5 | 3.9 | 3.6 | 11.0 | 2.0 | 3.4 | 22.5 | 19.0 | 5.1 |
EU-27 = European Union; ROW = rest of world.
Value added is the value of goods and services (gross output) minus the cost of intermediate inputs (energy, materials, and purchased services). Semiconductor manufacturing refers to the industry Manufacture of electronic components and boards (International Standard Industrial Classification of All Economic Activities, Revision 4, 261), which includes the manufacture of semiconductors and other components for electronic applications.
S&P Global Market Intelligence, Comparative Industry Service special tabulations, April 2025.
Science and Engineering Indicators