 An official website of the United States government
 Introduction
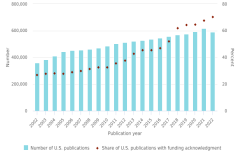
Science, technology, and innovation activities expand the frontiers of fundamental and technical knowledge. Research and development (R&D) activities, as well as organized science and engineering (S&E) activities, often lead to new outputs, such as research publications (see the Science and Engineering Indicators 2026 report “Discovery: R&D Activity and Research Publications” [NSB 2025]), new products and services, licensed technologies, and companies, which in turn impact economic output, productivity, and global trade. These outputs, along with the scientists, engineers, and skilled workers (see the Indicators 2026 report “STEM Talent: Education, Training, and Workforce” [NSB 2026]) that enable them, contribute to the economic competitiveness and national security of the United States. Economic competitiveness, national security, and geopolitical considerations influence the science, technology, trade, and defense policies of national governments globally, as they attempt to shape innovation ecosystems and control supply chains for critical and emerging technologies (CETs) (Chatterji and Murray 2025). These policies affect the direction and location of global R&D activity, innovation, and knowledge- and technology-intensive (KTI) industrial production (based on Organisation for Economic Co-operation and Development [OECD] measures of R&D intensity; see the Glossary section for KTI definition).
This report focuses on indicators that provide insight into the science, technology, and innovation activities of businesses, governments, and academia. Innovation activities include all the steps taken to develop, deploy, or bring new processes, products, and services to market. In addition to R&D activities (described in the Indicators 2026 report “Discovery: R&D Activity and Research Publications” [NSB 2025]), these may be technological, organizational, financial, or commercial (OECD/Eurostat 2018). This report also identifies trends in output and international trade by KTI industries to provide context for R&D and innovation trends across economic sectors. The report addresses R&D and other innovation activities in CET areas, such as artificial intelligence (AI), biotechnology, semiconductors, quantum information science and technology (QIST), and nuclear energy, overlapping with the priorities of the current administration (Vought and Kratsios 2025). The original taxonomy used for critical technologies was introduced in the Indicators 2024 report “Invention, Knowledge Transfer, and Innovation” (NSB 2024) and has been expanded for this report. The U.S. National Science Foundation’s (NSF’s) Directorate for Technology, Innovation and Partnerships (TIP) developed and refined this taxonomy, which is used to link critical technologies to patent classes (NSF/TIP 2025). Data in the report cover U.S. and international indicators on production, trade, innovation, technology transfer, and related activities of businesses, governments, and academia.
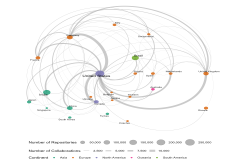
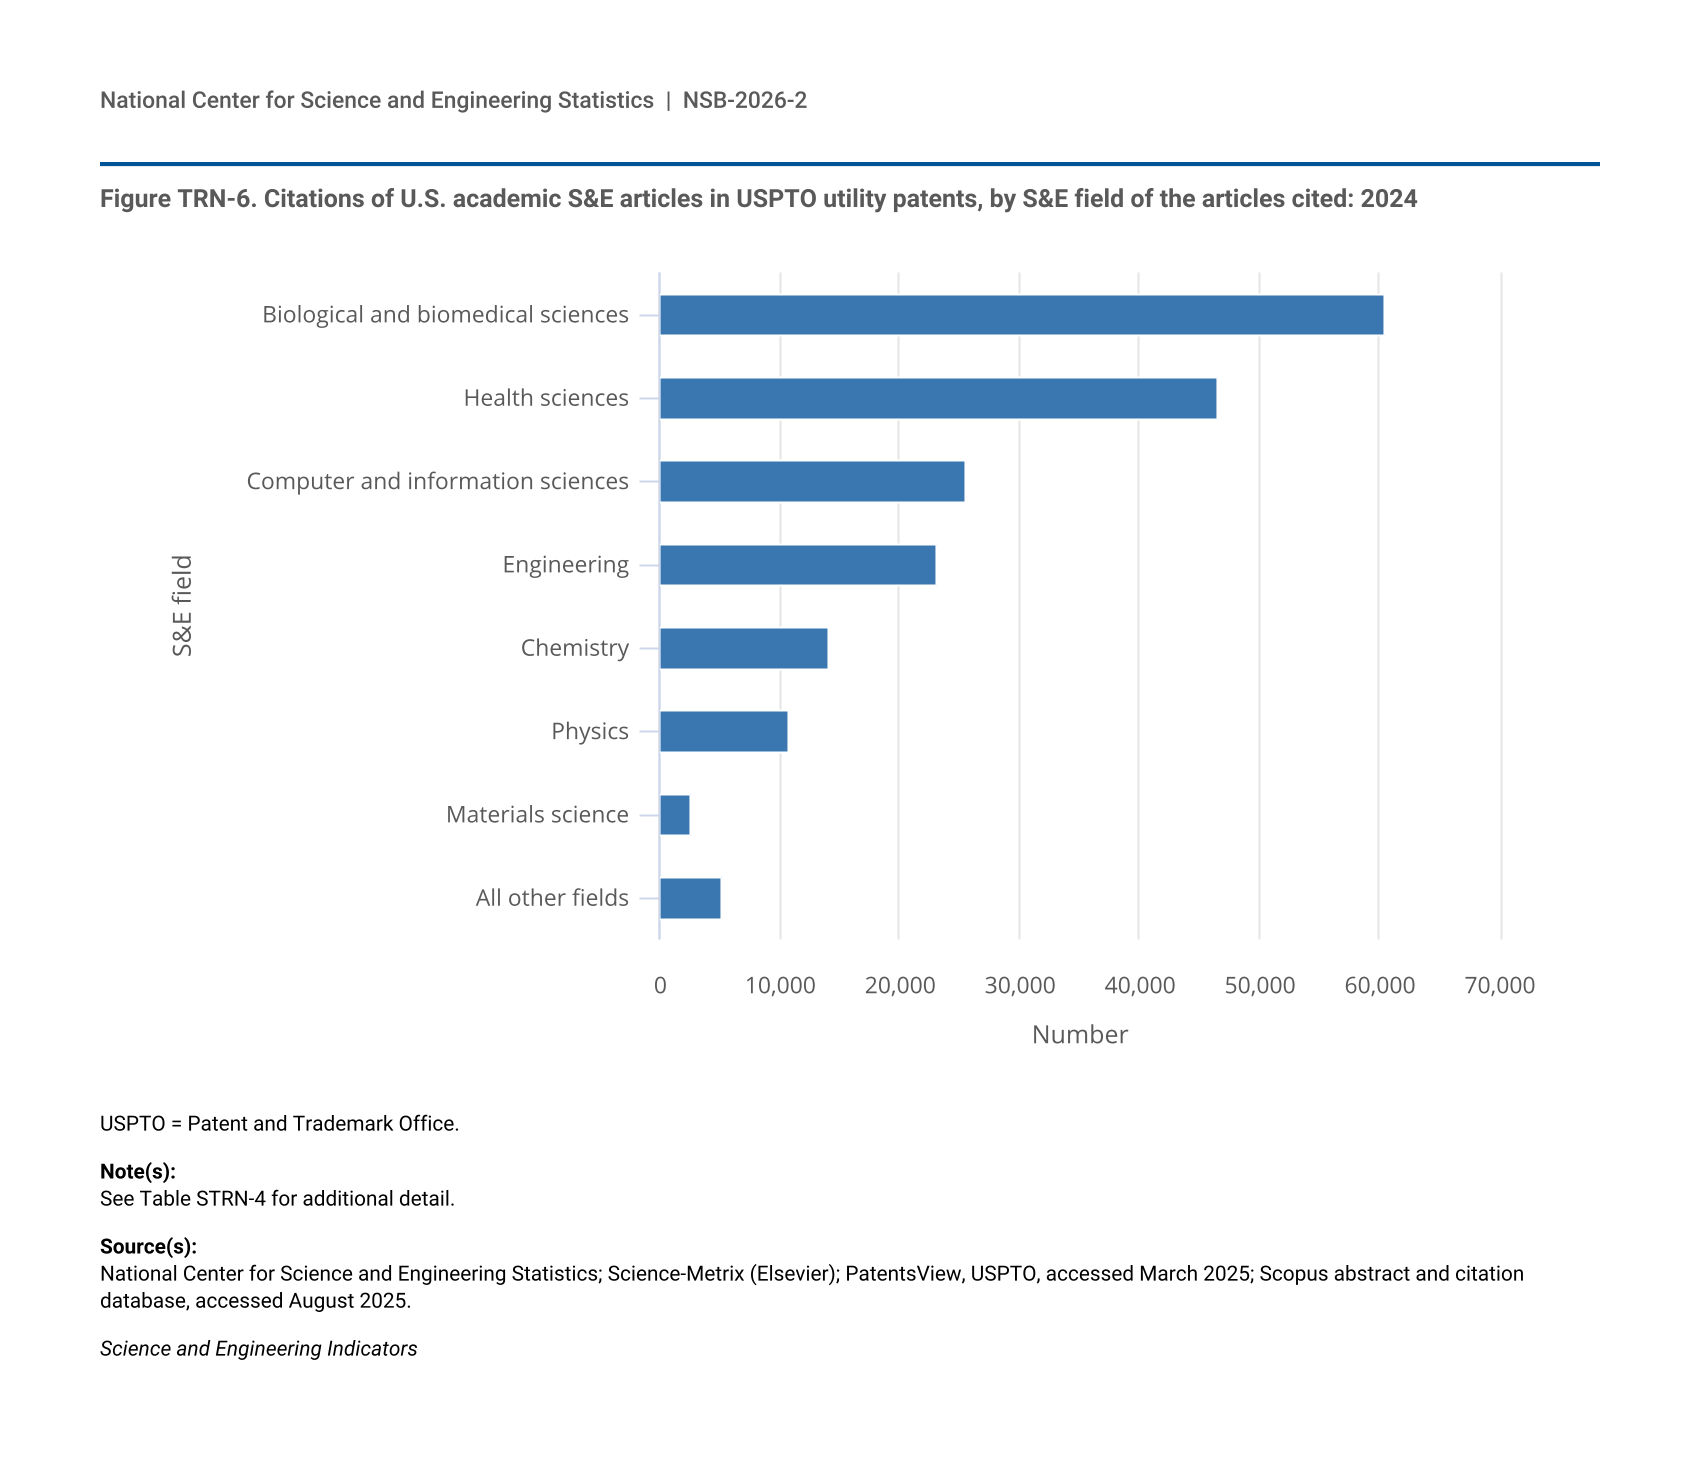
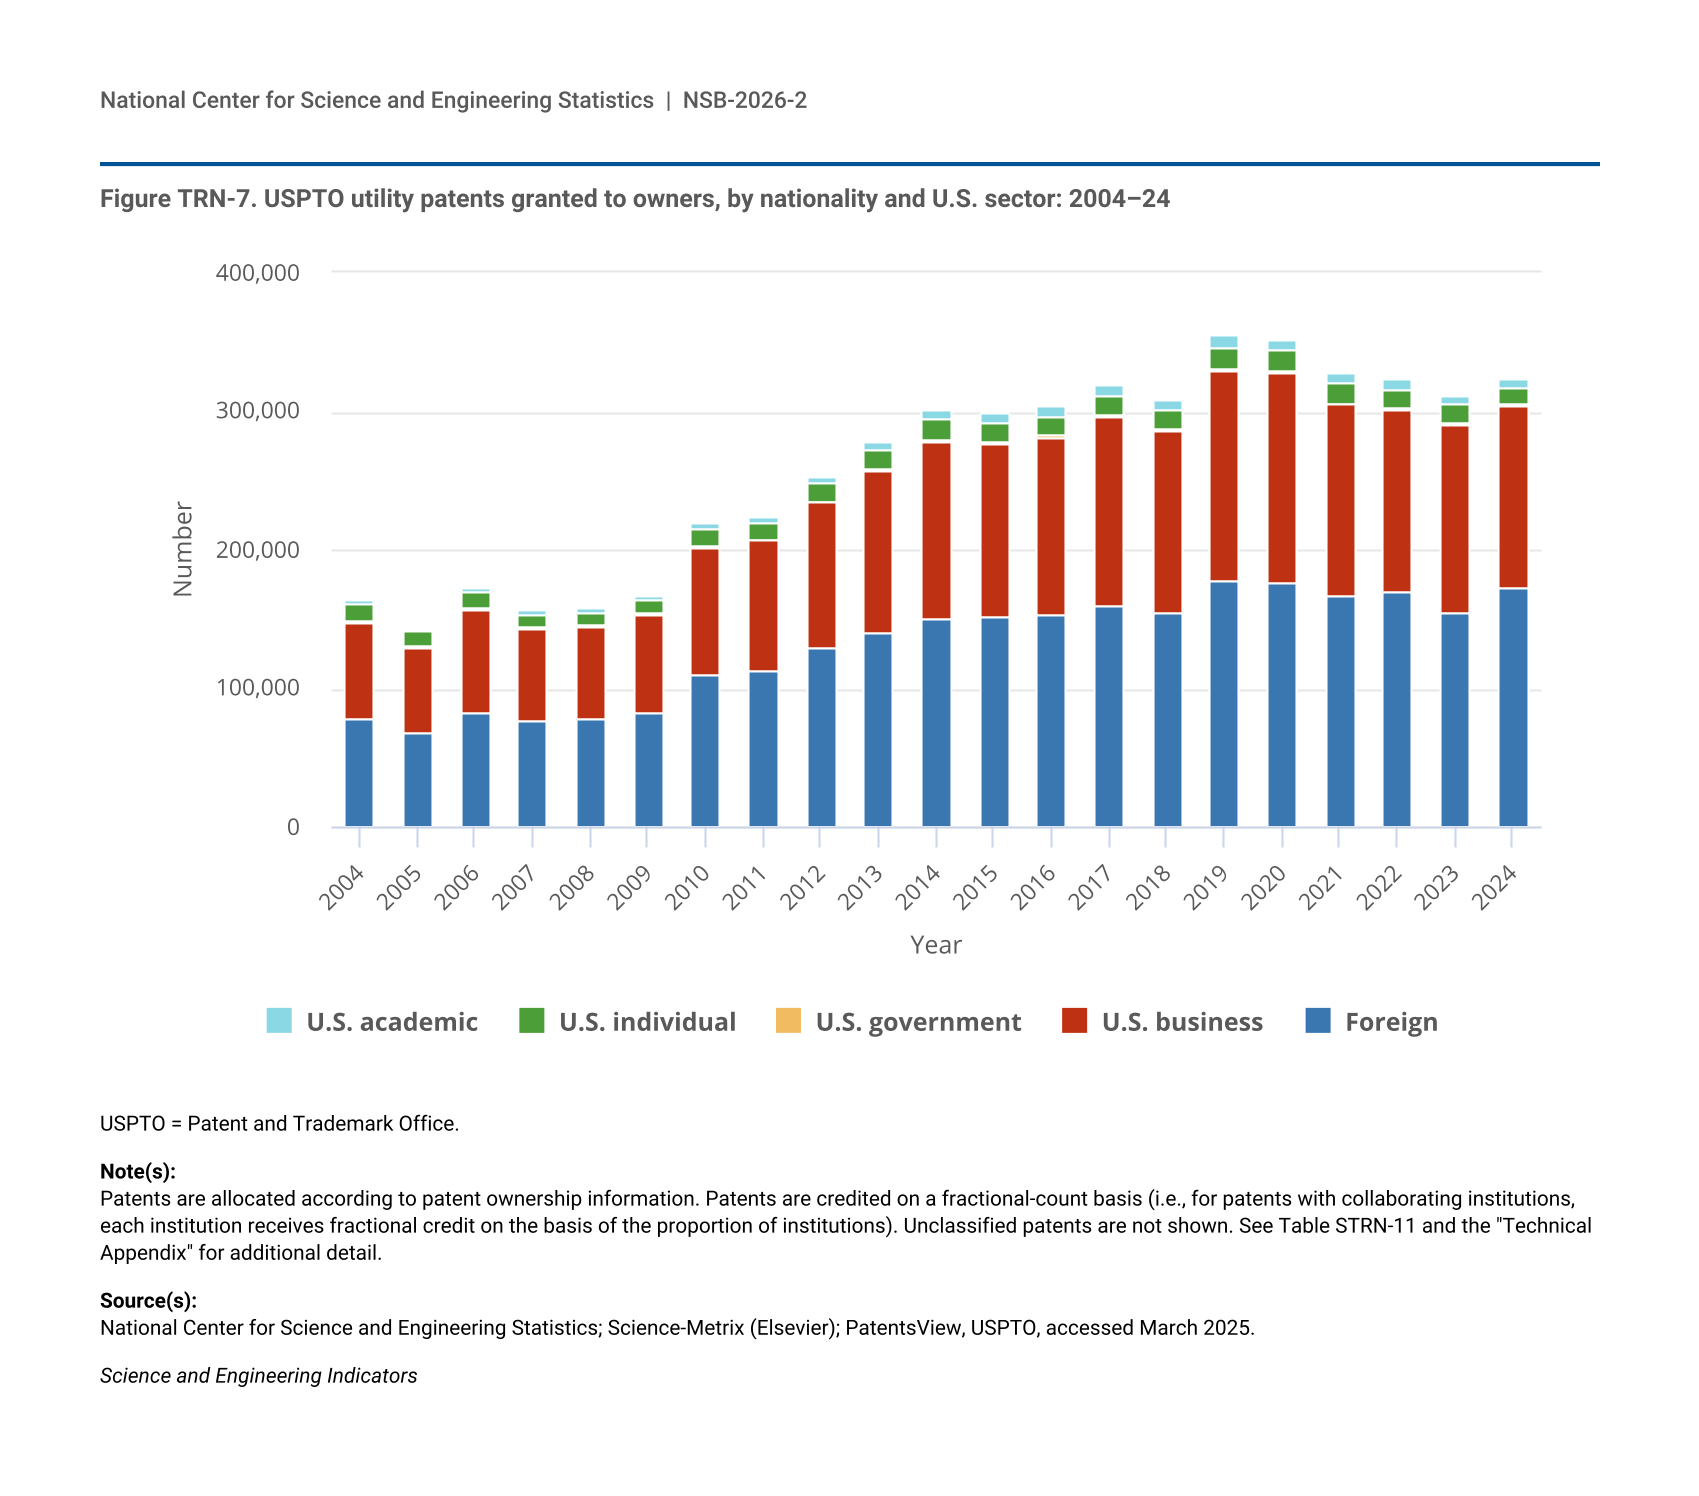
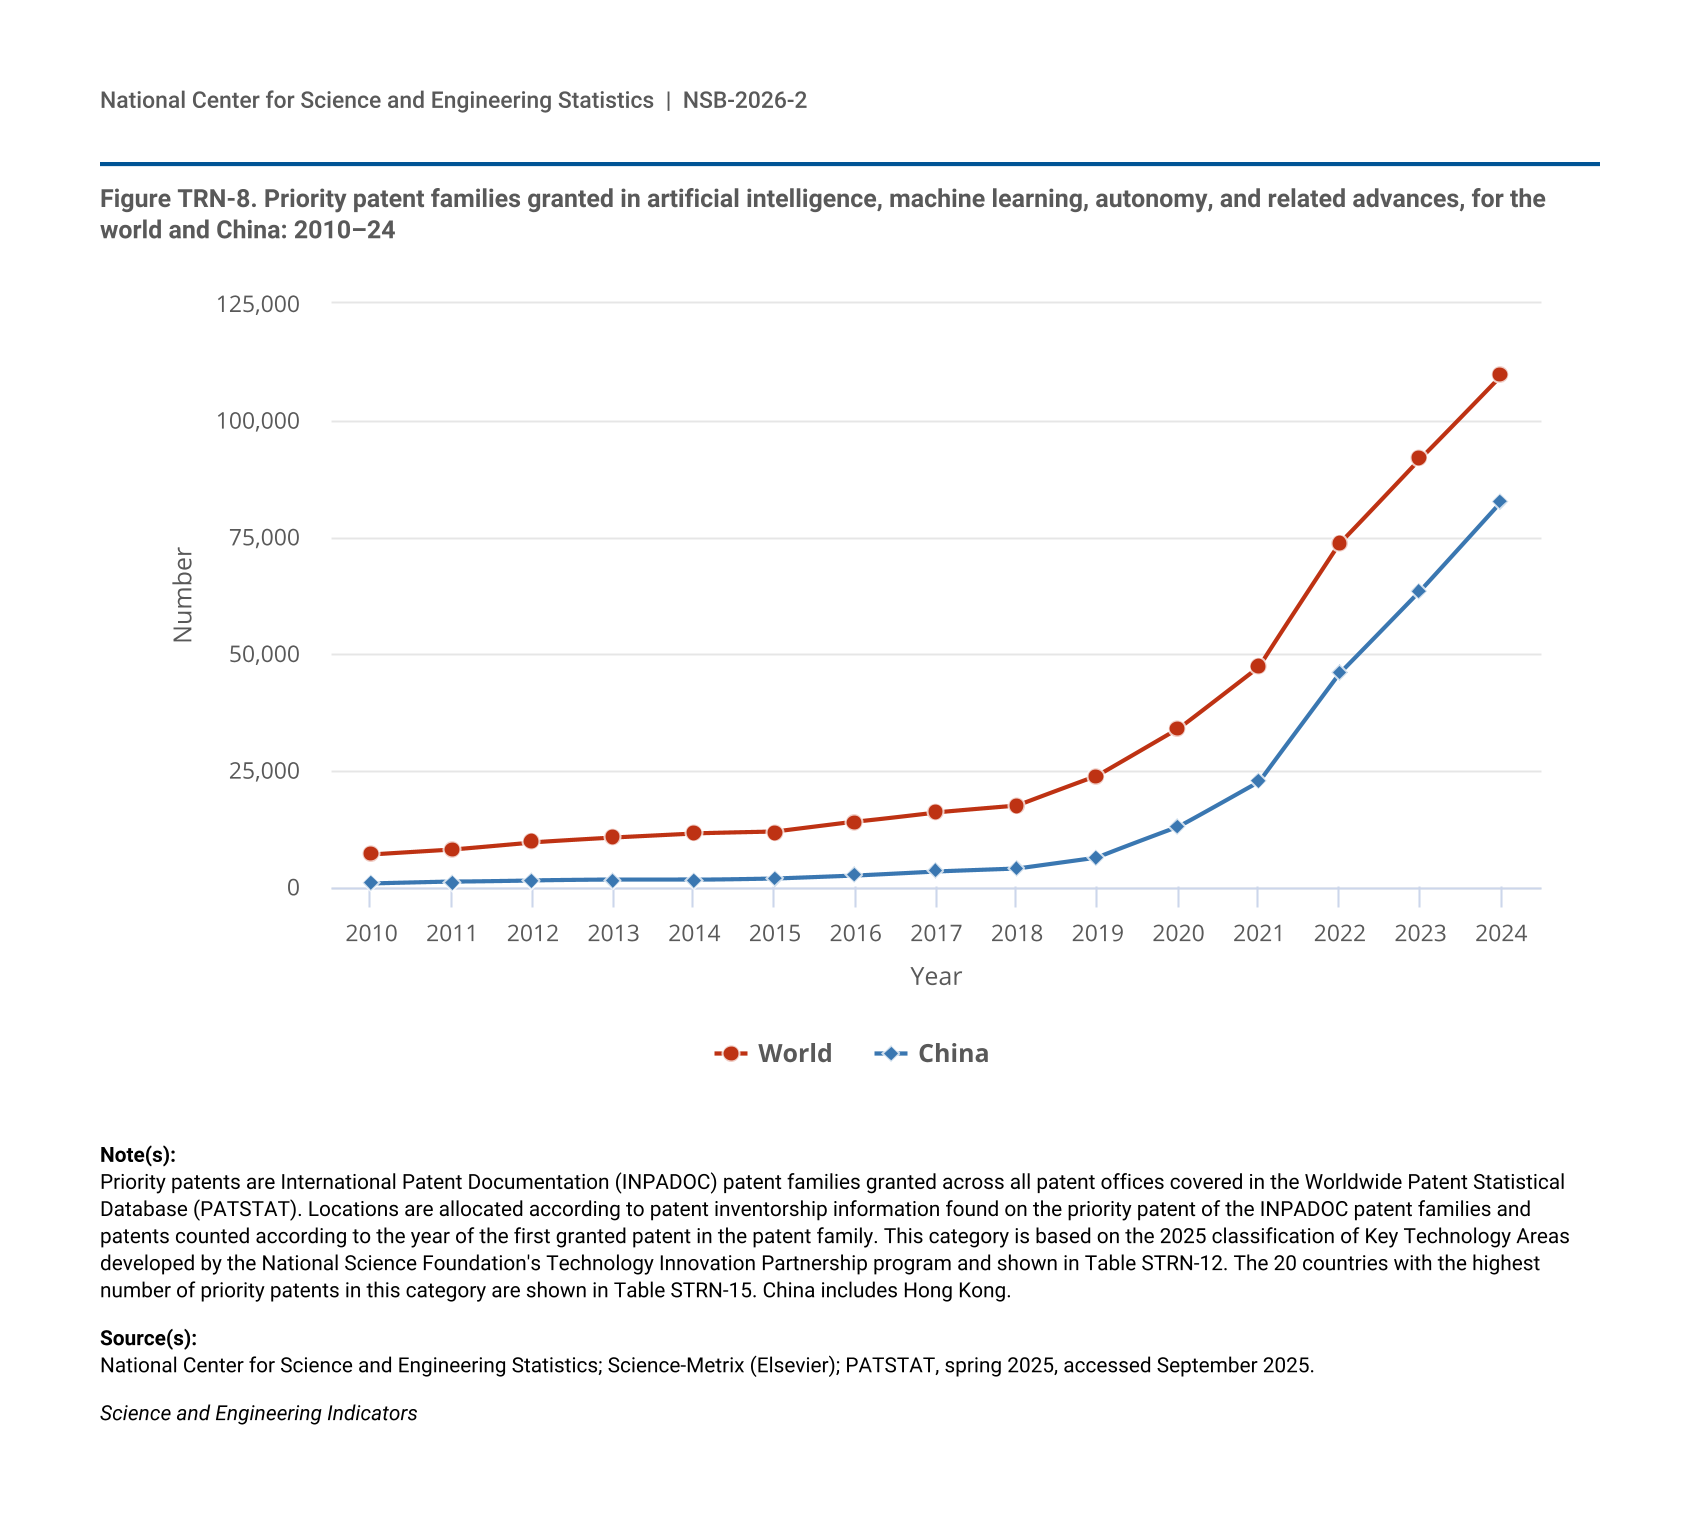
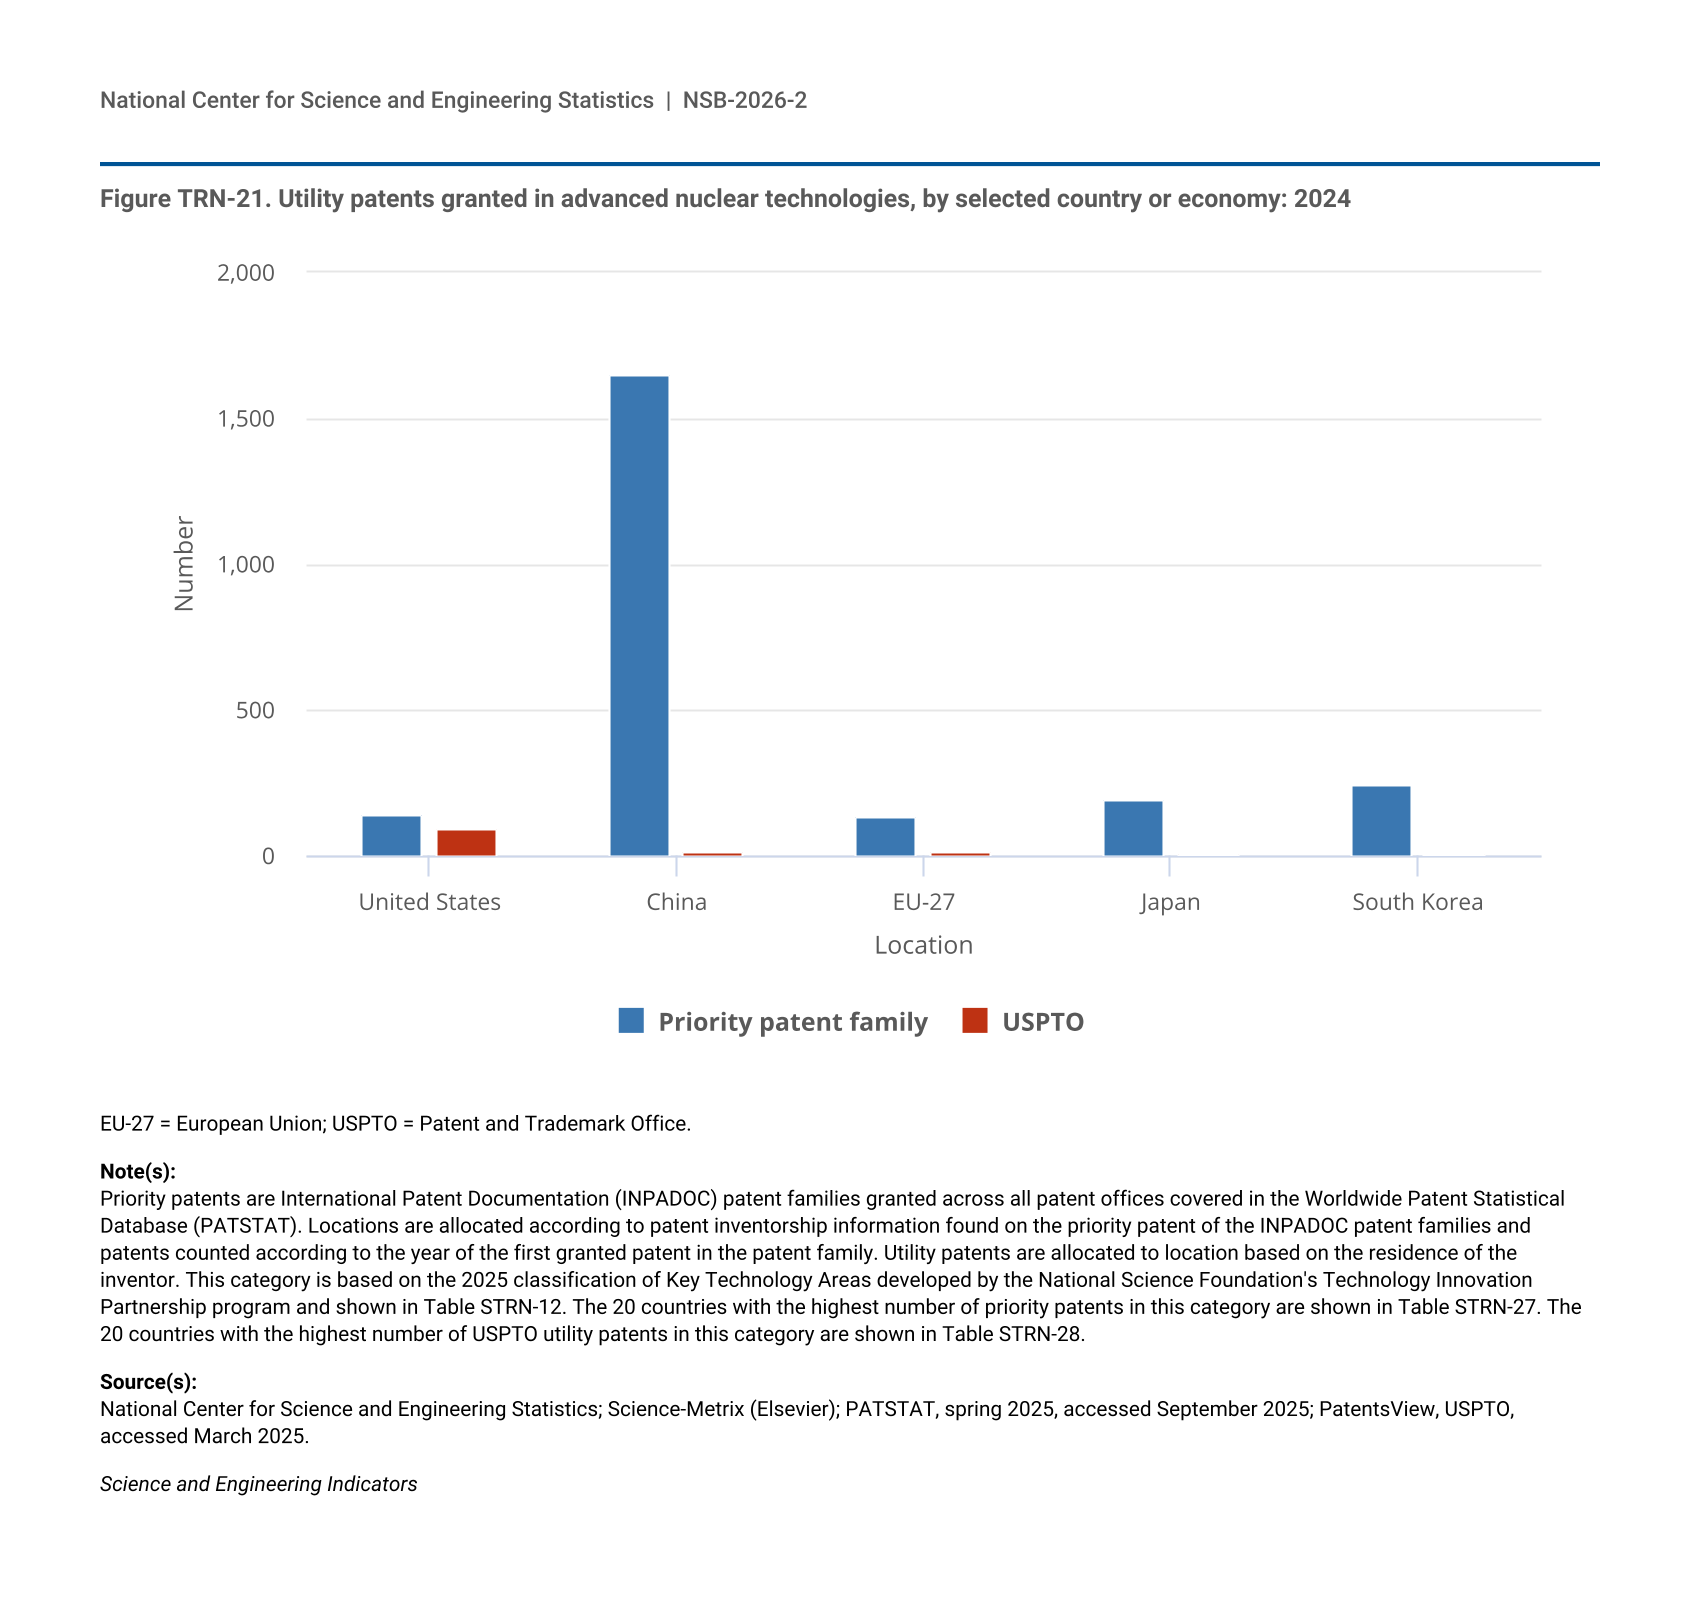
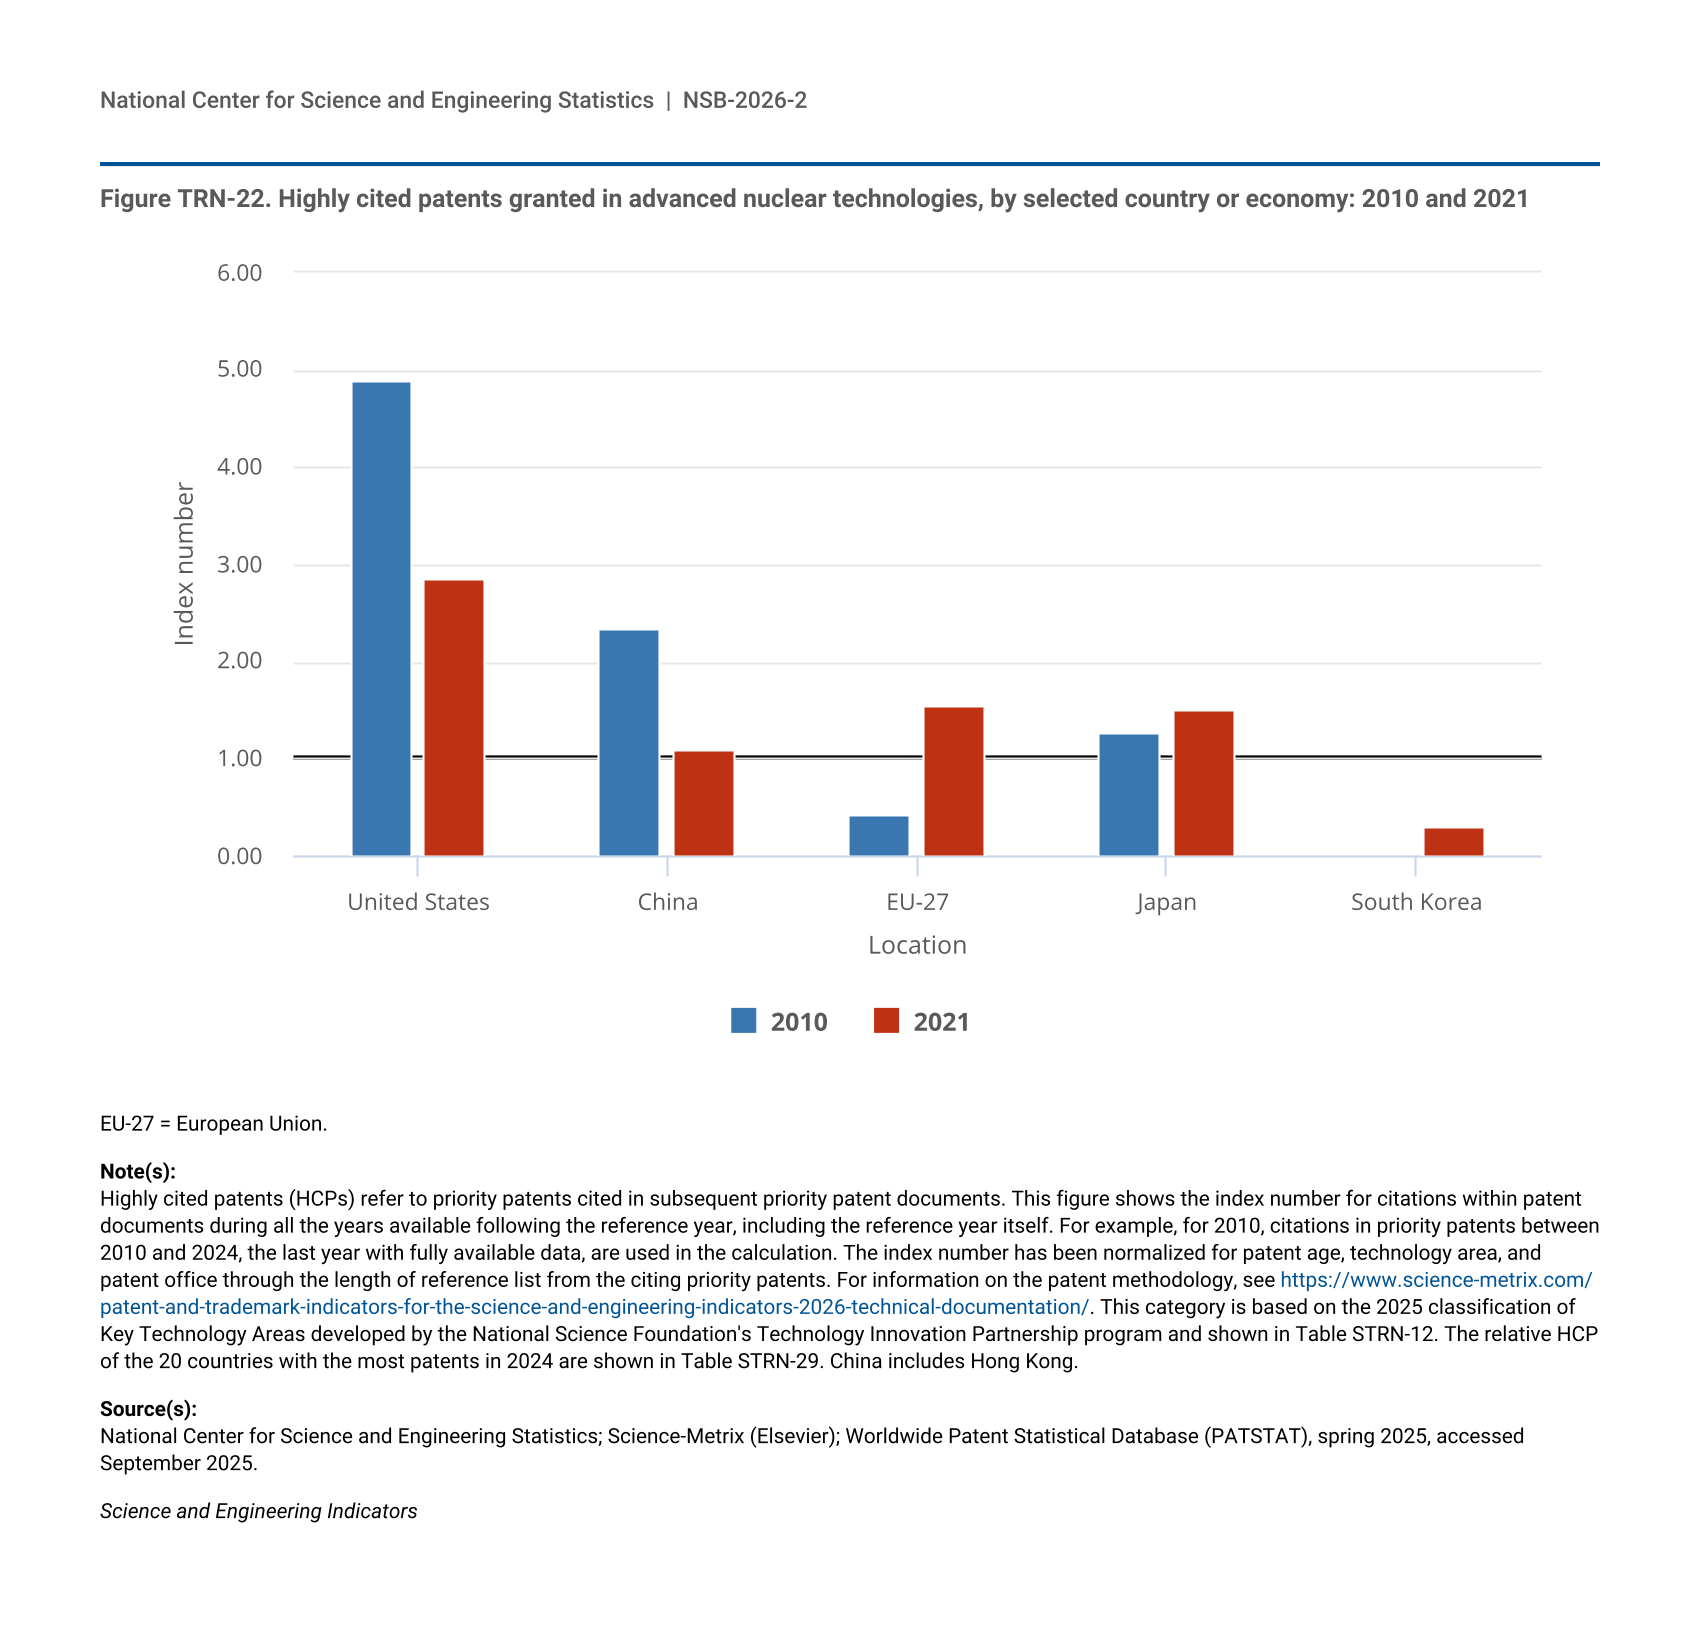
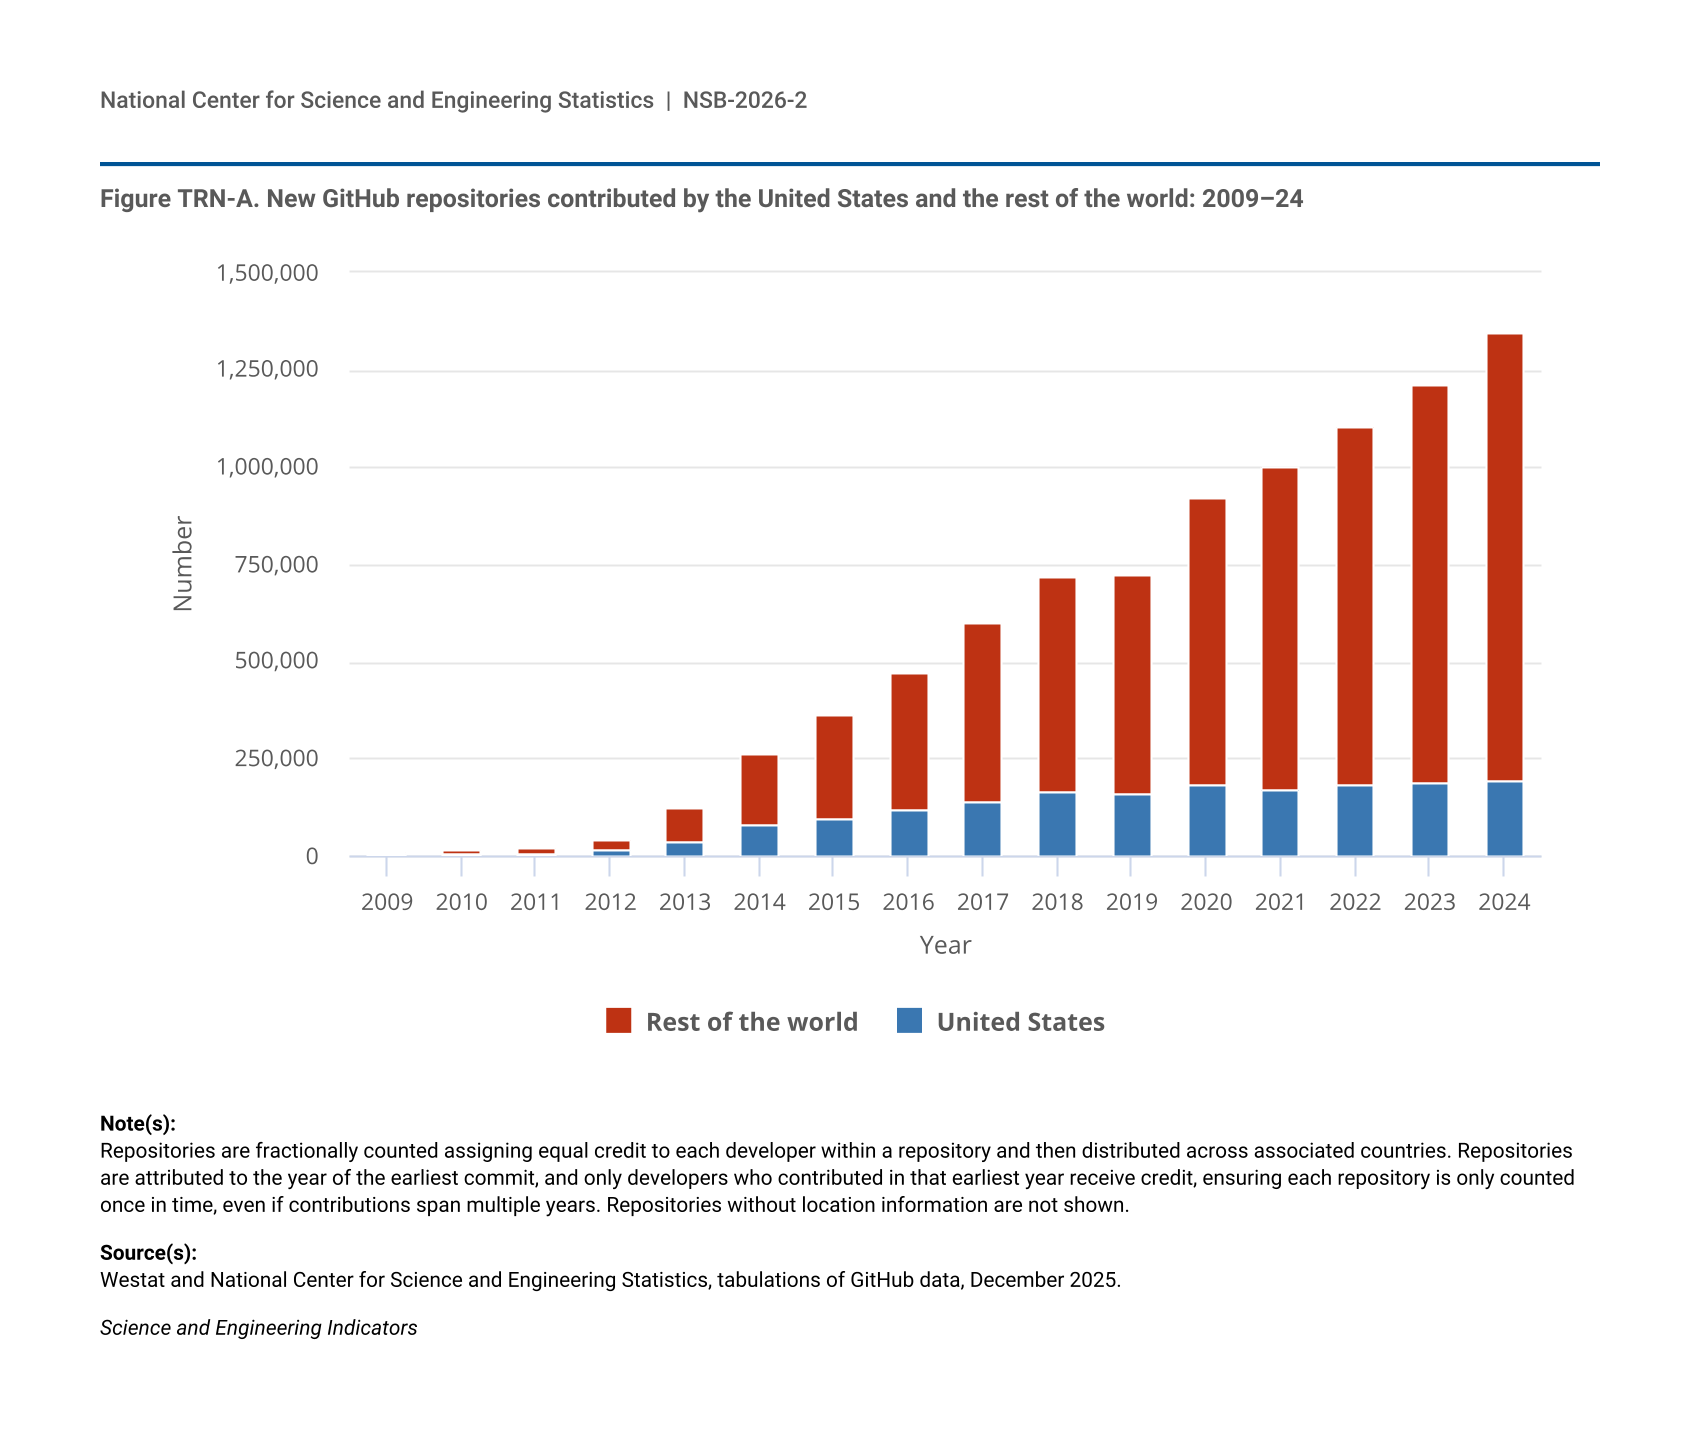
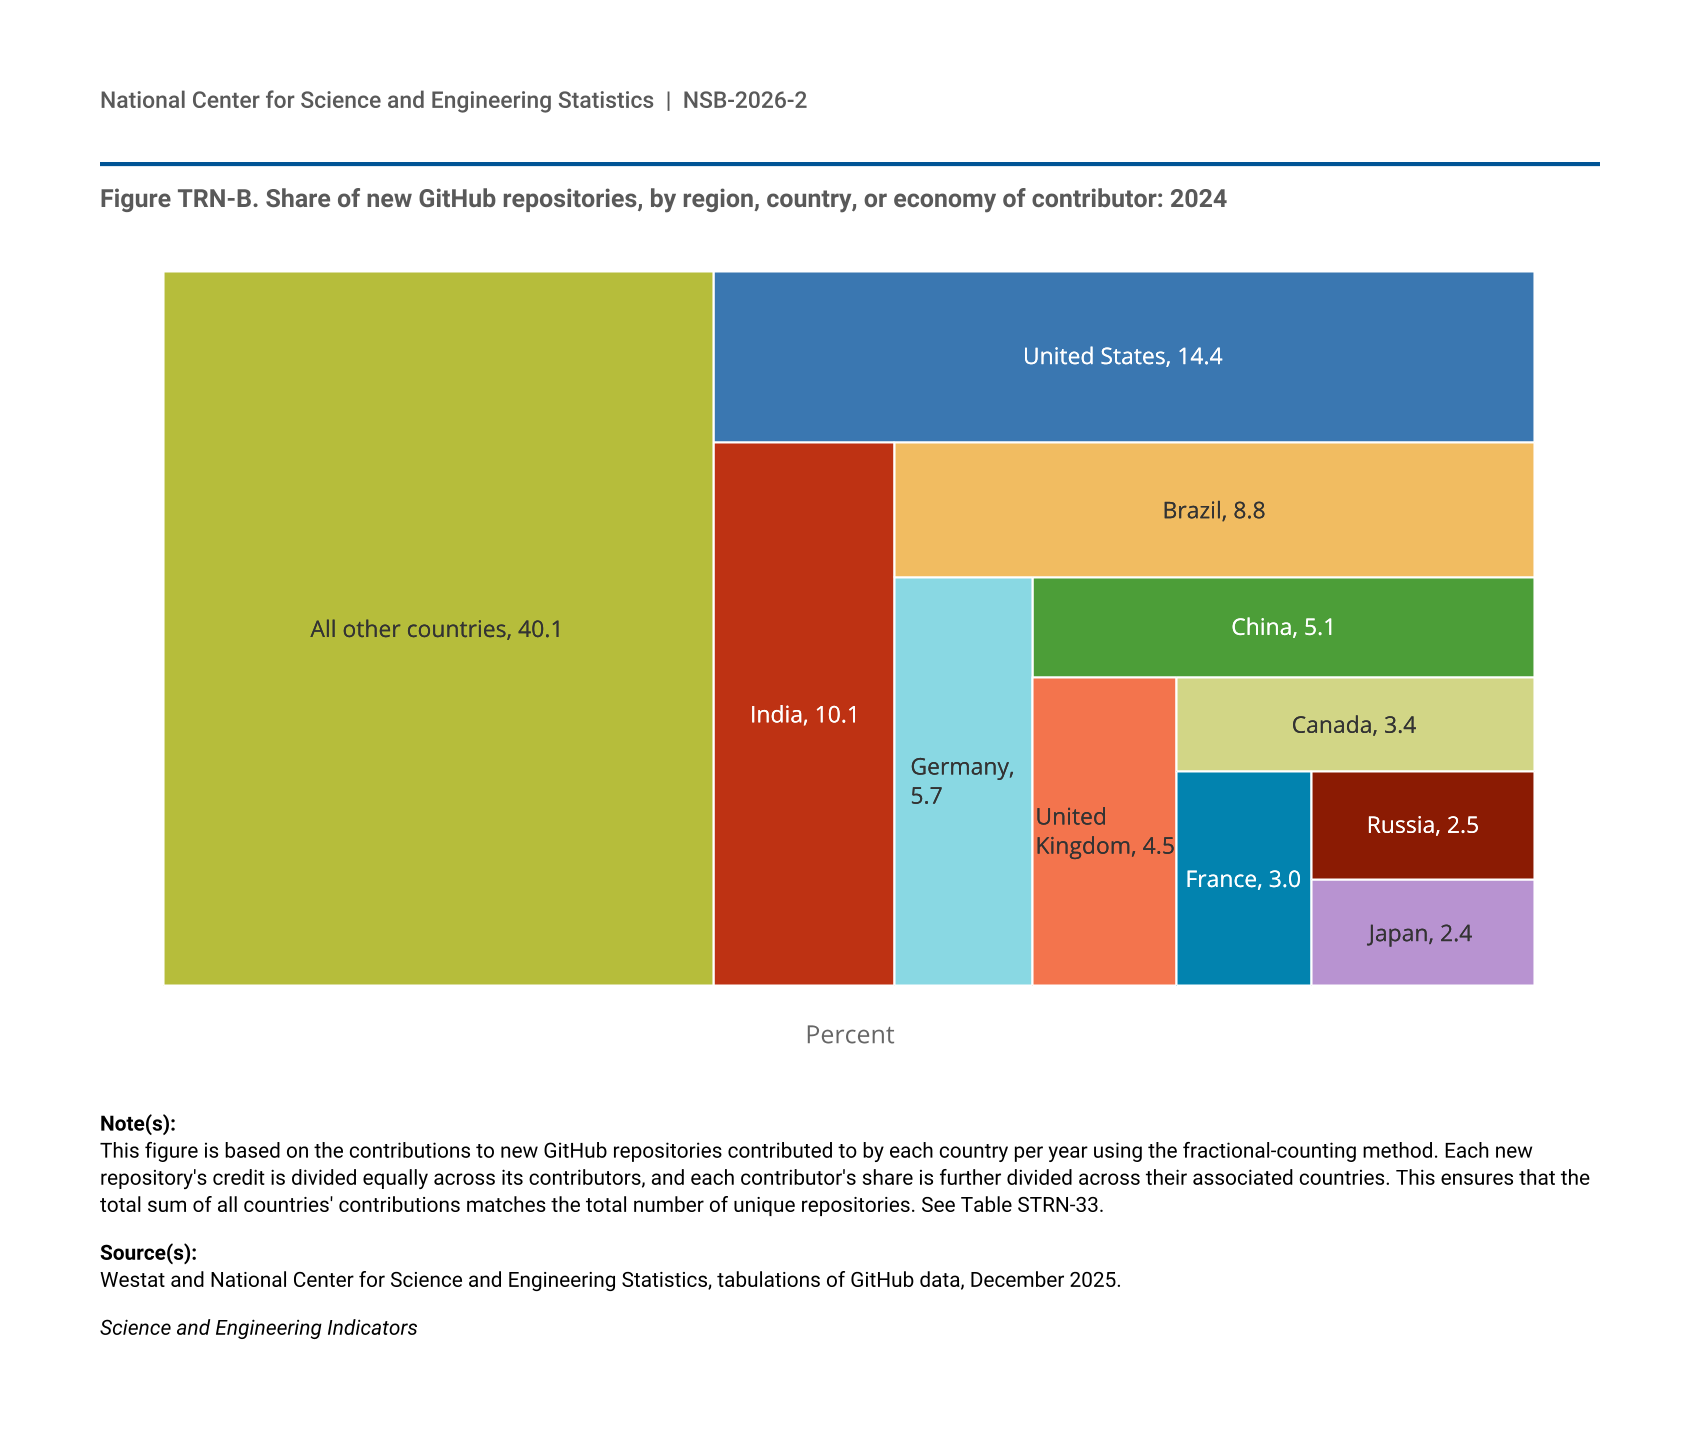
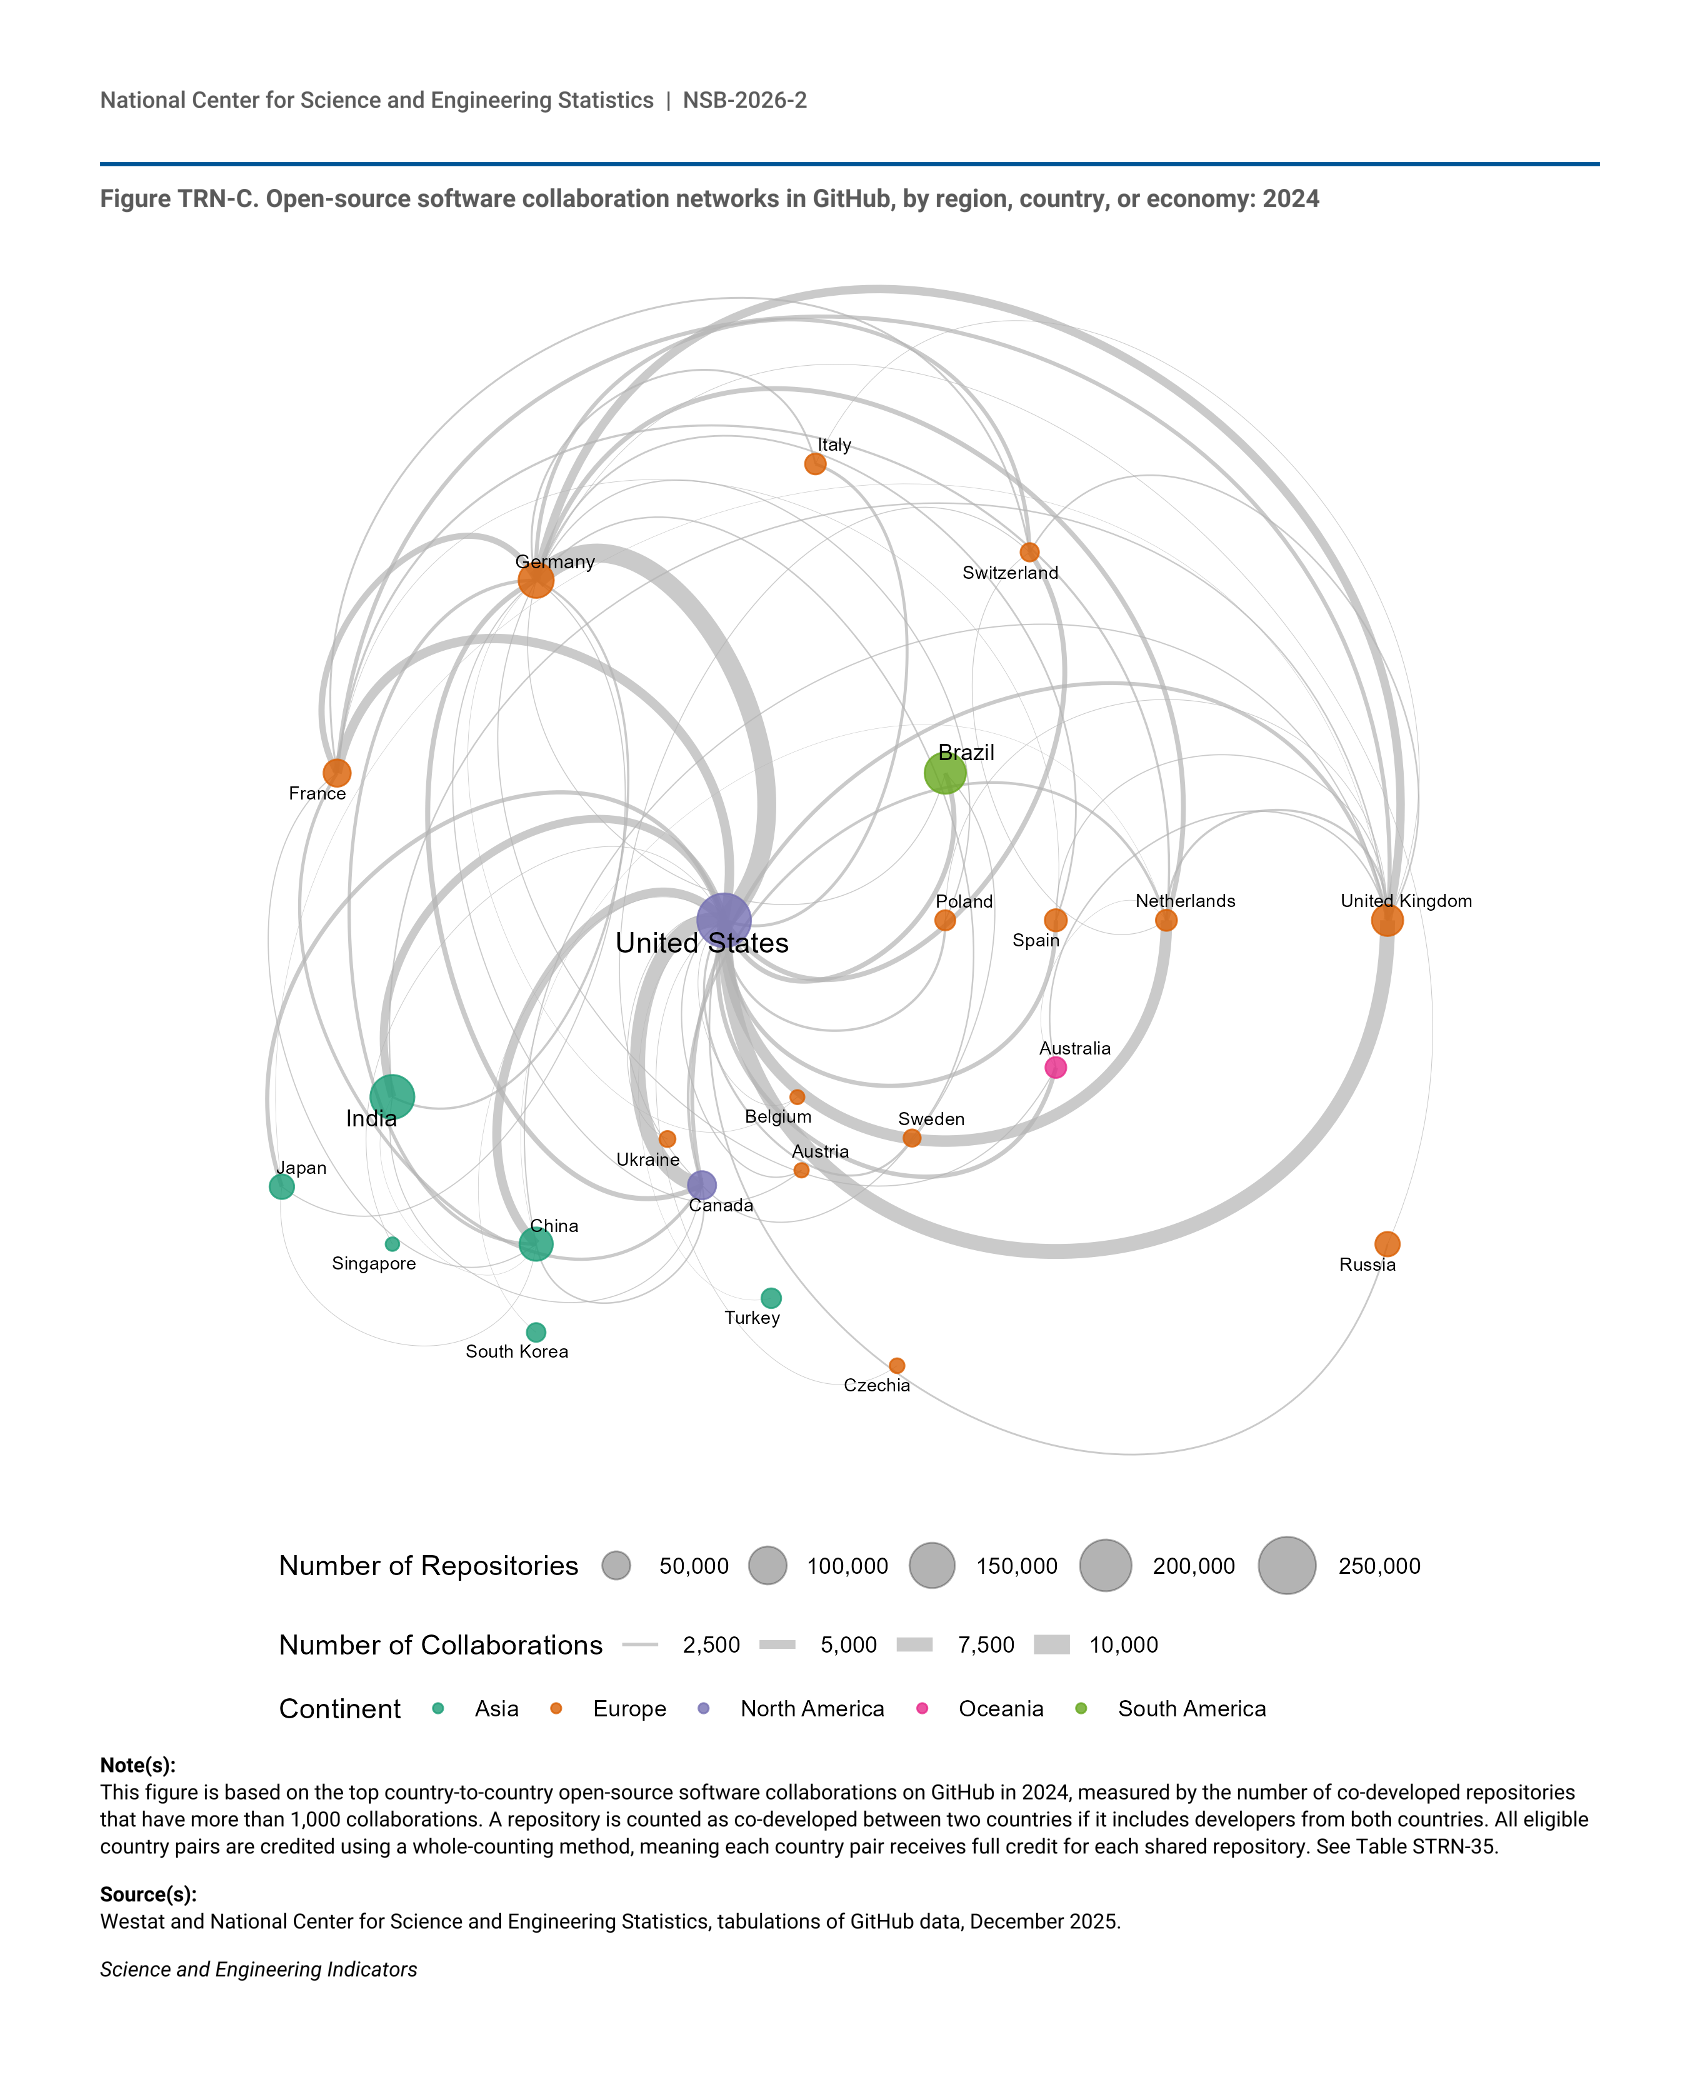
The first section of the report focuses on knowledge and technology transfer activities—the collaborative process through which research, technology, and intellectual property (IP) generated by fundamental research flow from laboratories, universities, or other research institutions to private or public users, where they can be developed into commercial products or services (USPTO 2025b; WIPO n.d.). Citations in research publications to federally supported R&D activities are an indicator of the flow of public knowledge into useful inventions. Open-source software (OSS), such as Linux or Apache, is estimated to support much of the corporate software currently in use, saving companies billions in software development costs, with savings estimated to be $8.8 trillion for 2020 (Hoffman, Nagle, and Zhou 2024). However, because much of it is not produced for sale, it is difficult to estimate the value of OSS. Analysis of major OSS repositories, however, allows tracking of the broad growth in OSS development and collaboration patterns between developers, which can help identify the aggregate impacts of OSS. IP protections for the rights of inventors, such as patents and trademarks, can be used to track innovative capacity. The technology transfer section of the report addresses patents registered in the United States, including patents granted to individuals and foreign entities, as well as international patent data. The section highlights invention activities for five CET areas identified by policymakers because of their role in national and economic security.
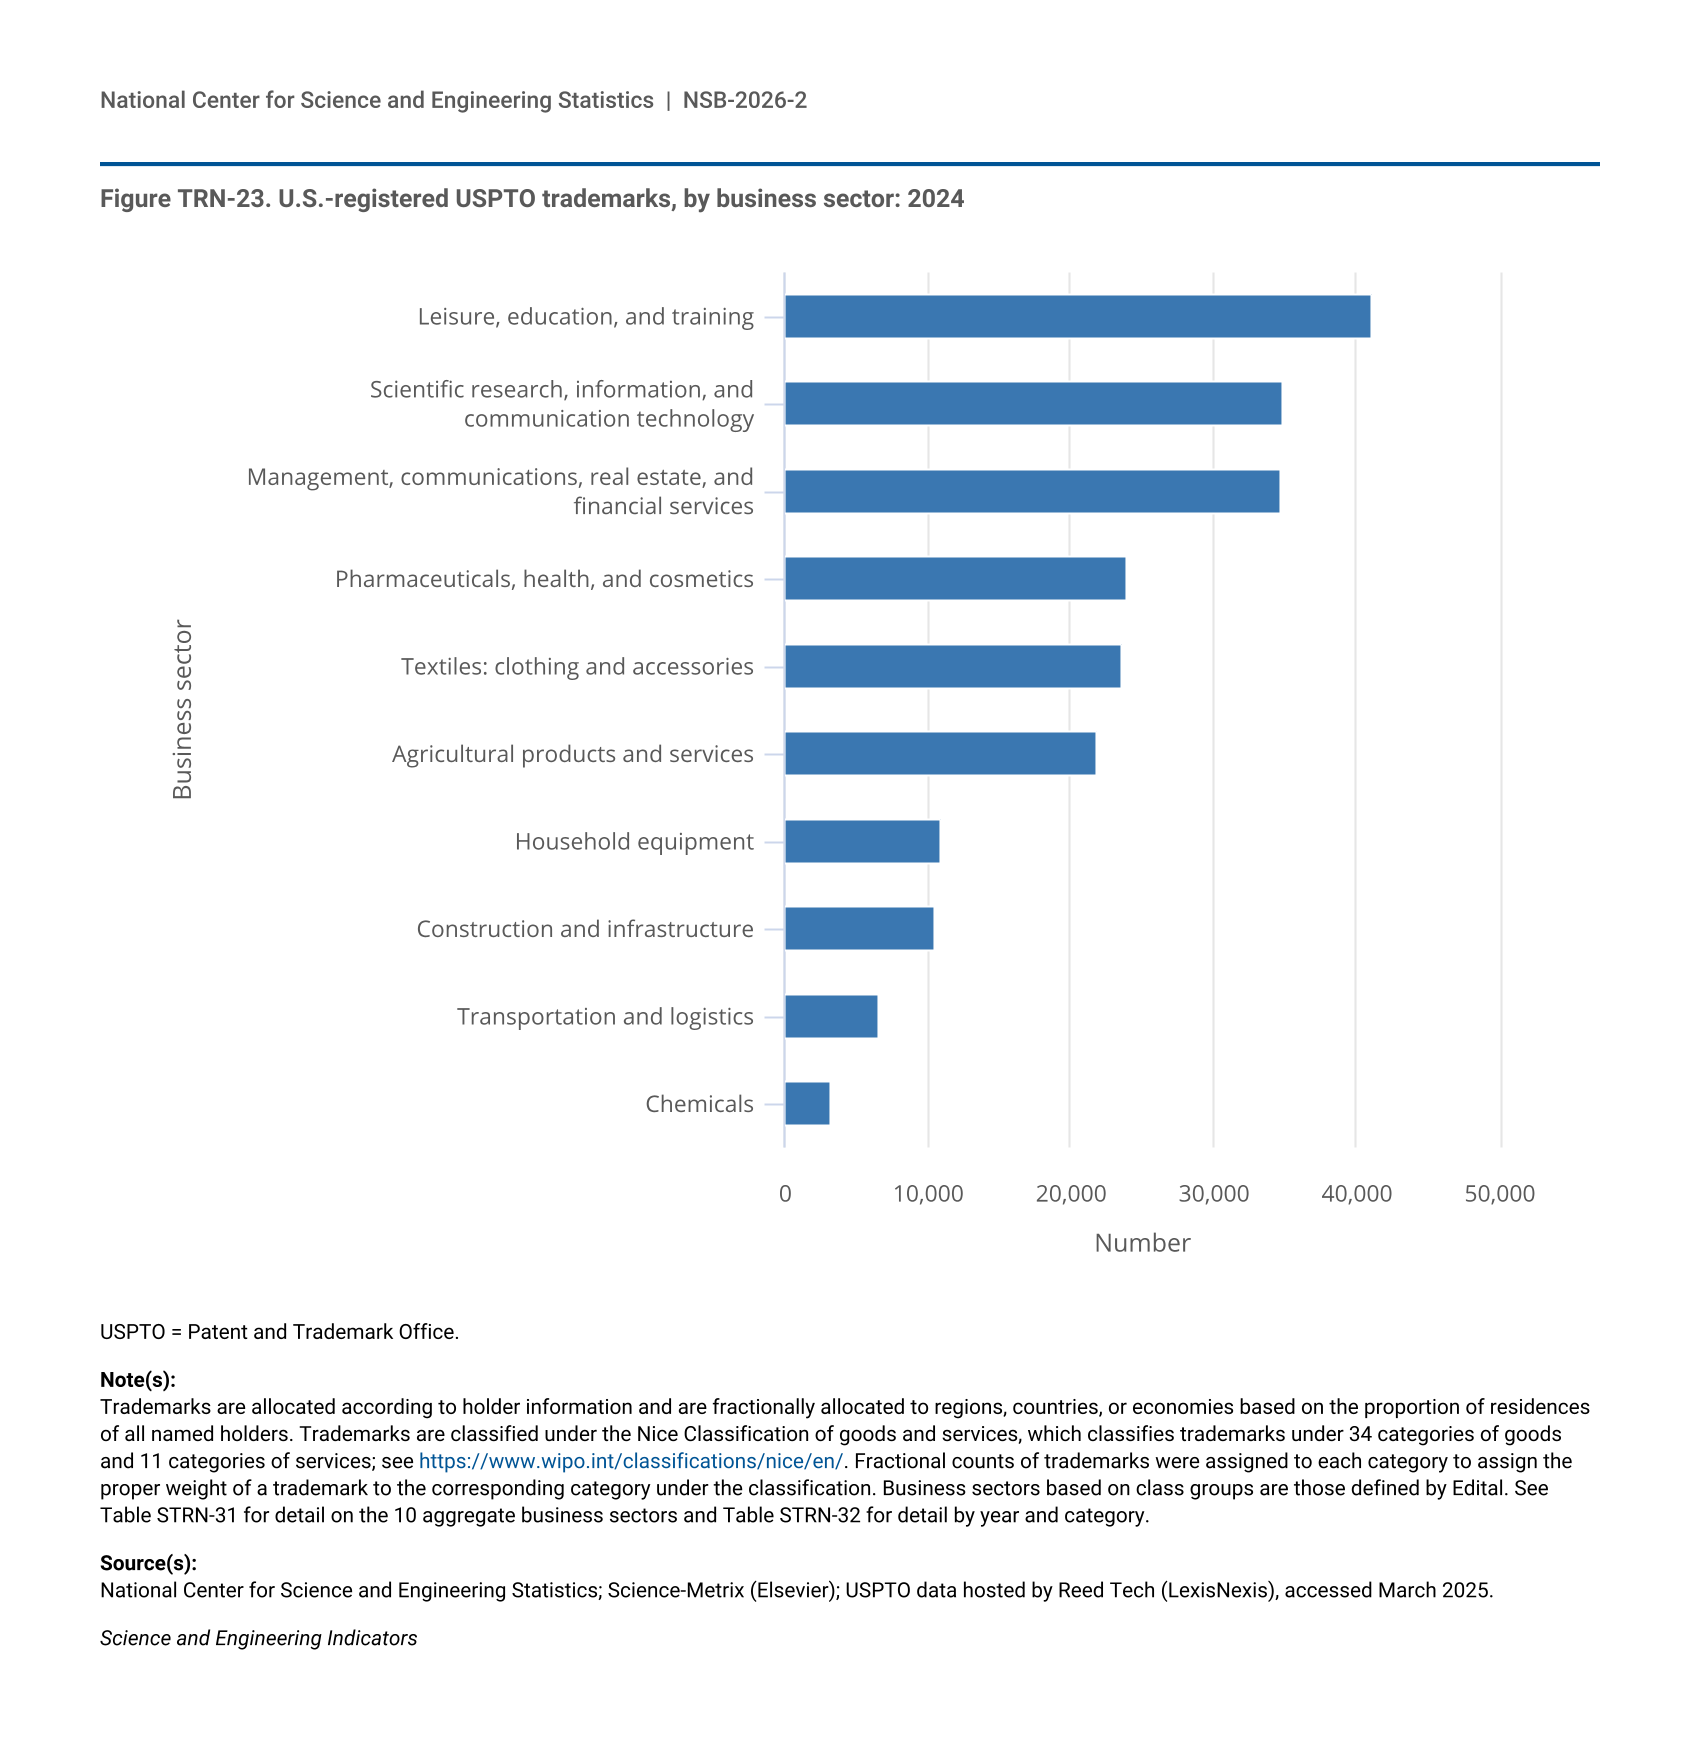
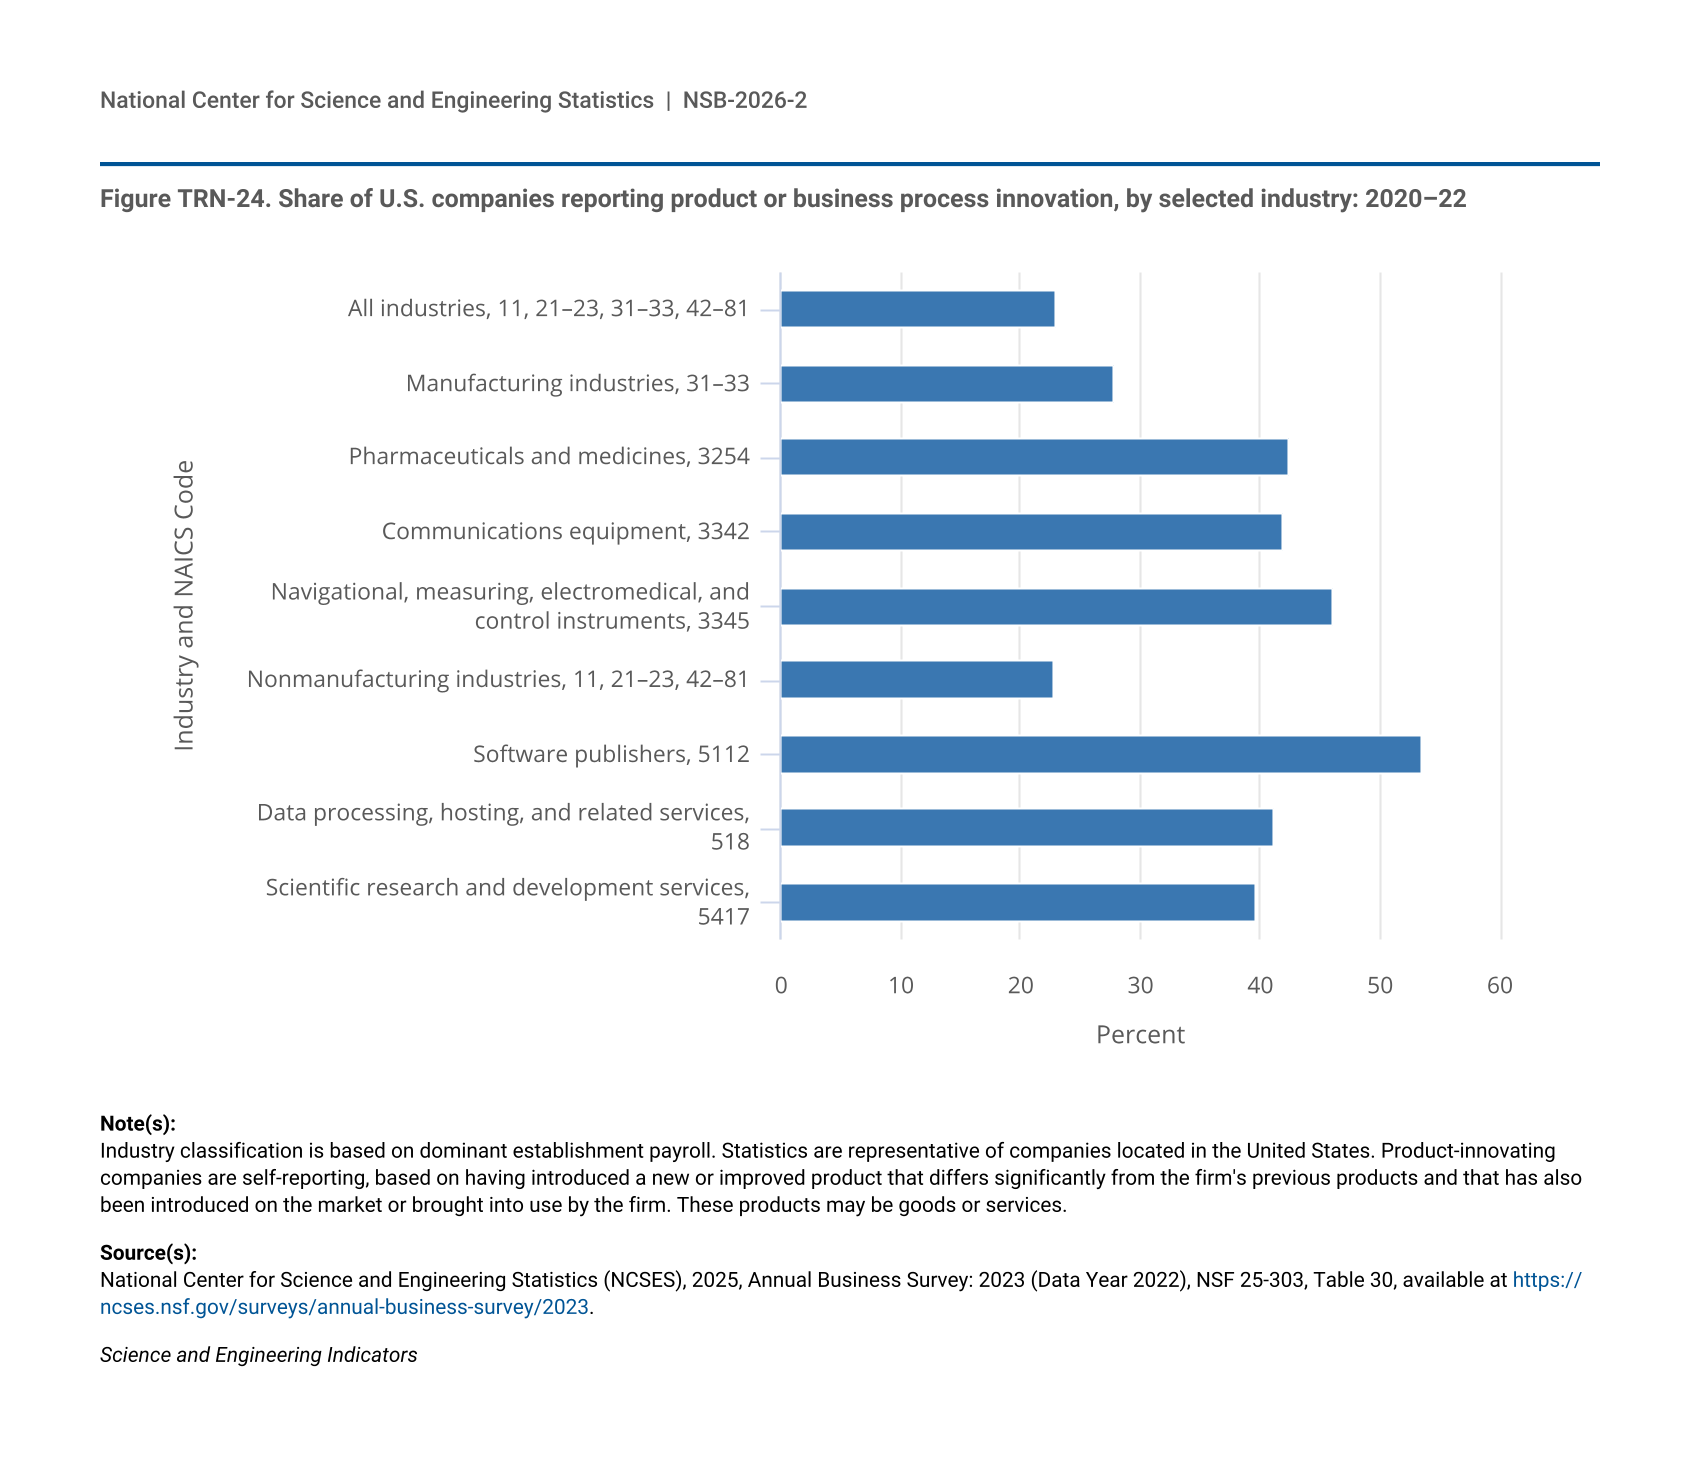
Innovation is the translation of knowledge arising from R&D activities into new or improved products, processes, or services with real-world applications. The innovation section of the report includes three additional indicators of the incidence of innovation to complement the patent data presented previously: newly registered trademarks, contributions to OSS repositories, and business survey data on the introduction of new products and processes. As an indicator of innovation activity, trademarks complement patenting, and academic studies have consistently found trademarking to be correlated with innovation, especially for firms in R&D-intensive industries. OSS is accessed, modified, and distributed freely, with the intent of being widely shared and expanded. Increasingly, private-sector employees play an active role in OSS development, as it has become a critical part of many industries’ software R&D processes. Although OSS is distributed freely, many technology companies, including those providing cloud services, have incorporated it into their business models (Lifshitz-Assaf and Nagle 2021). A key indicator of business-sector innovation is the proportion of companies within a given industry that report introducing new or significantly improved products and processes within a specific time frame. New and existing companies solicit investment to support the translation of R&D activities into commercial products and services. Access to financing is an essential component of the translation of new knowledge into innovations.
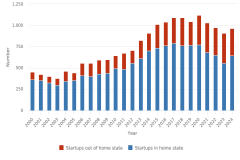
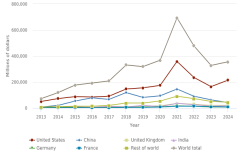
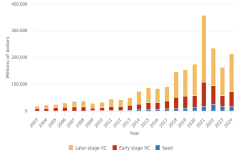
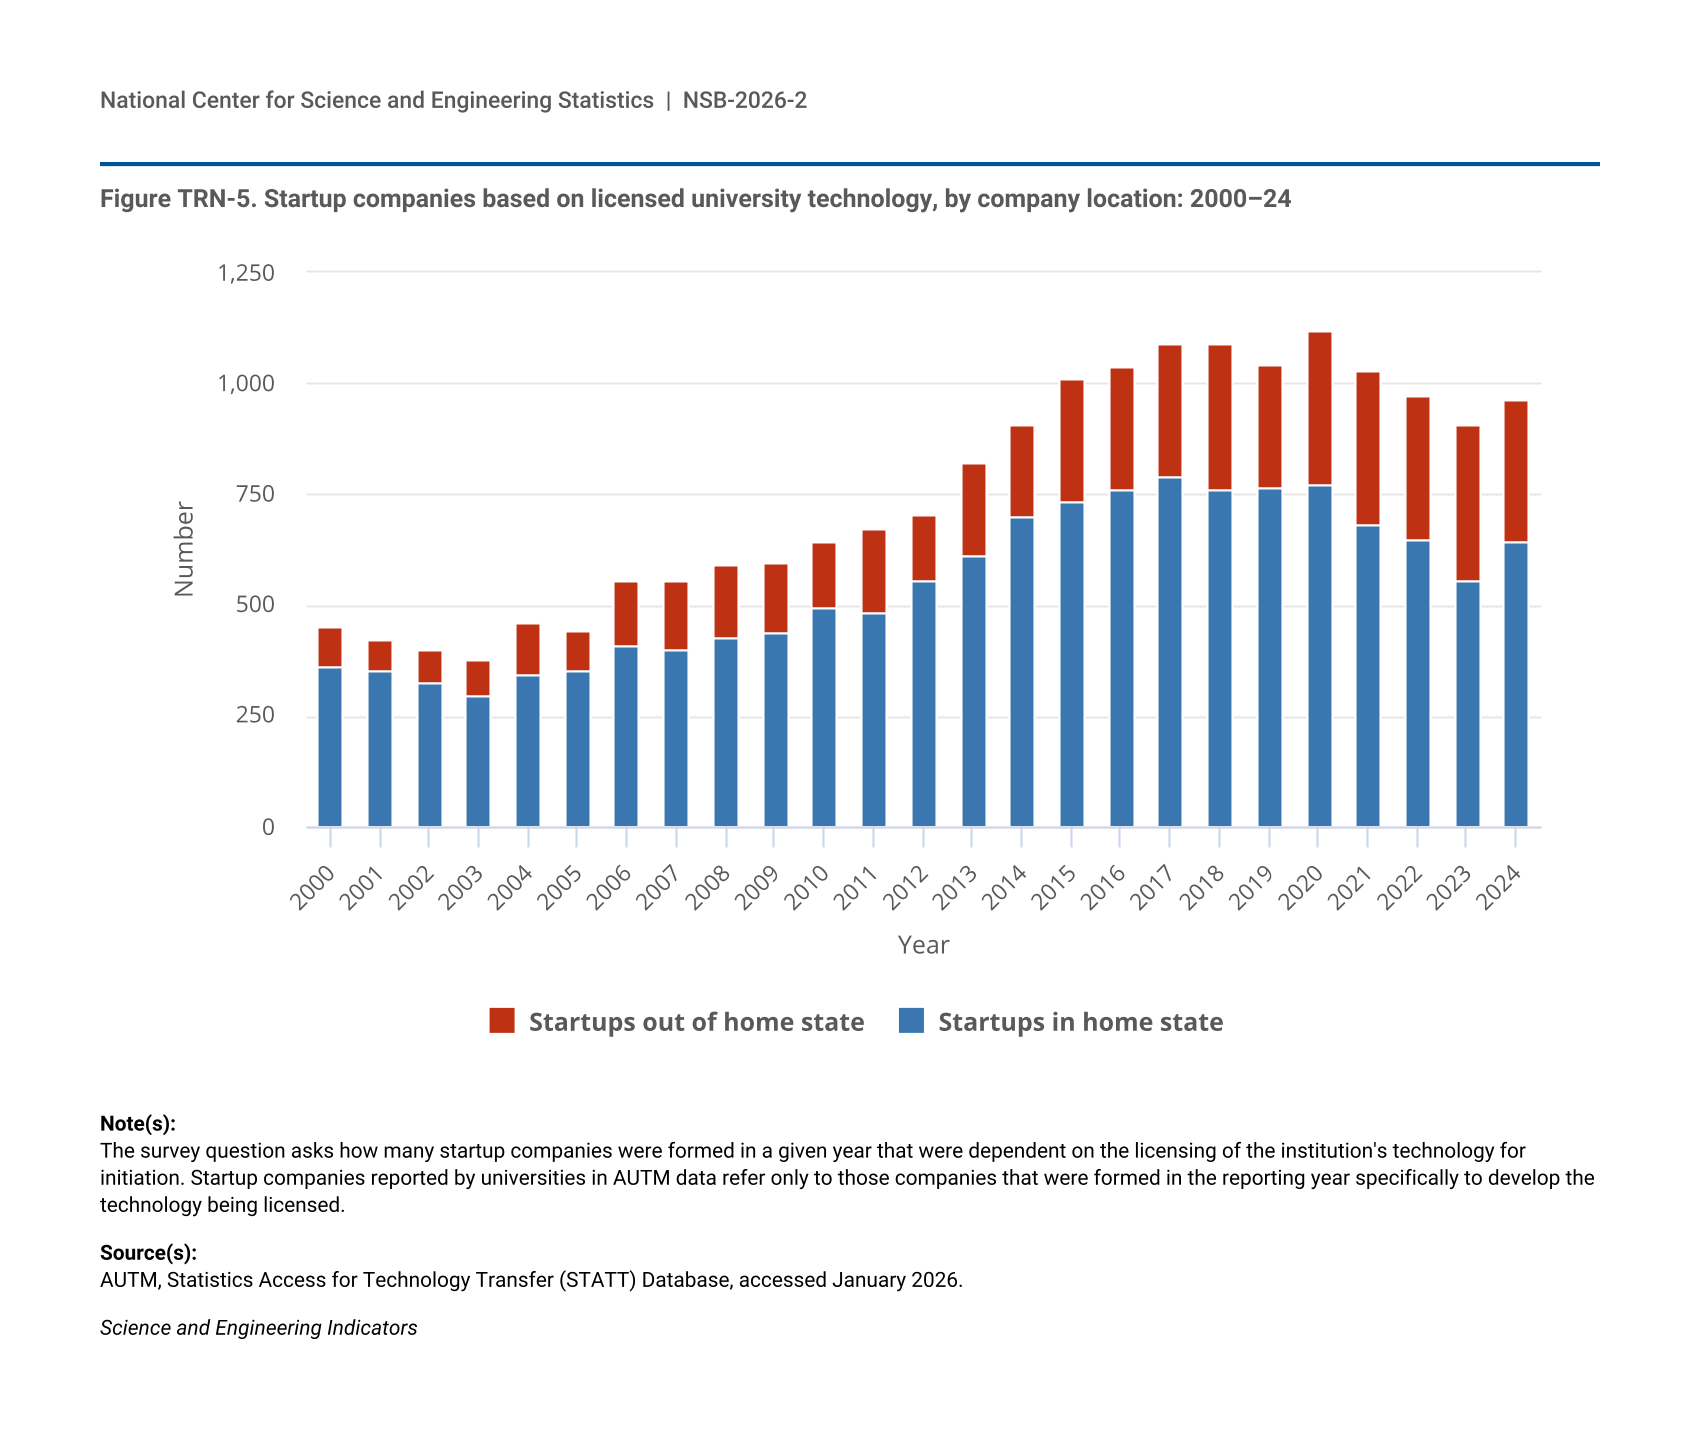
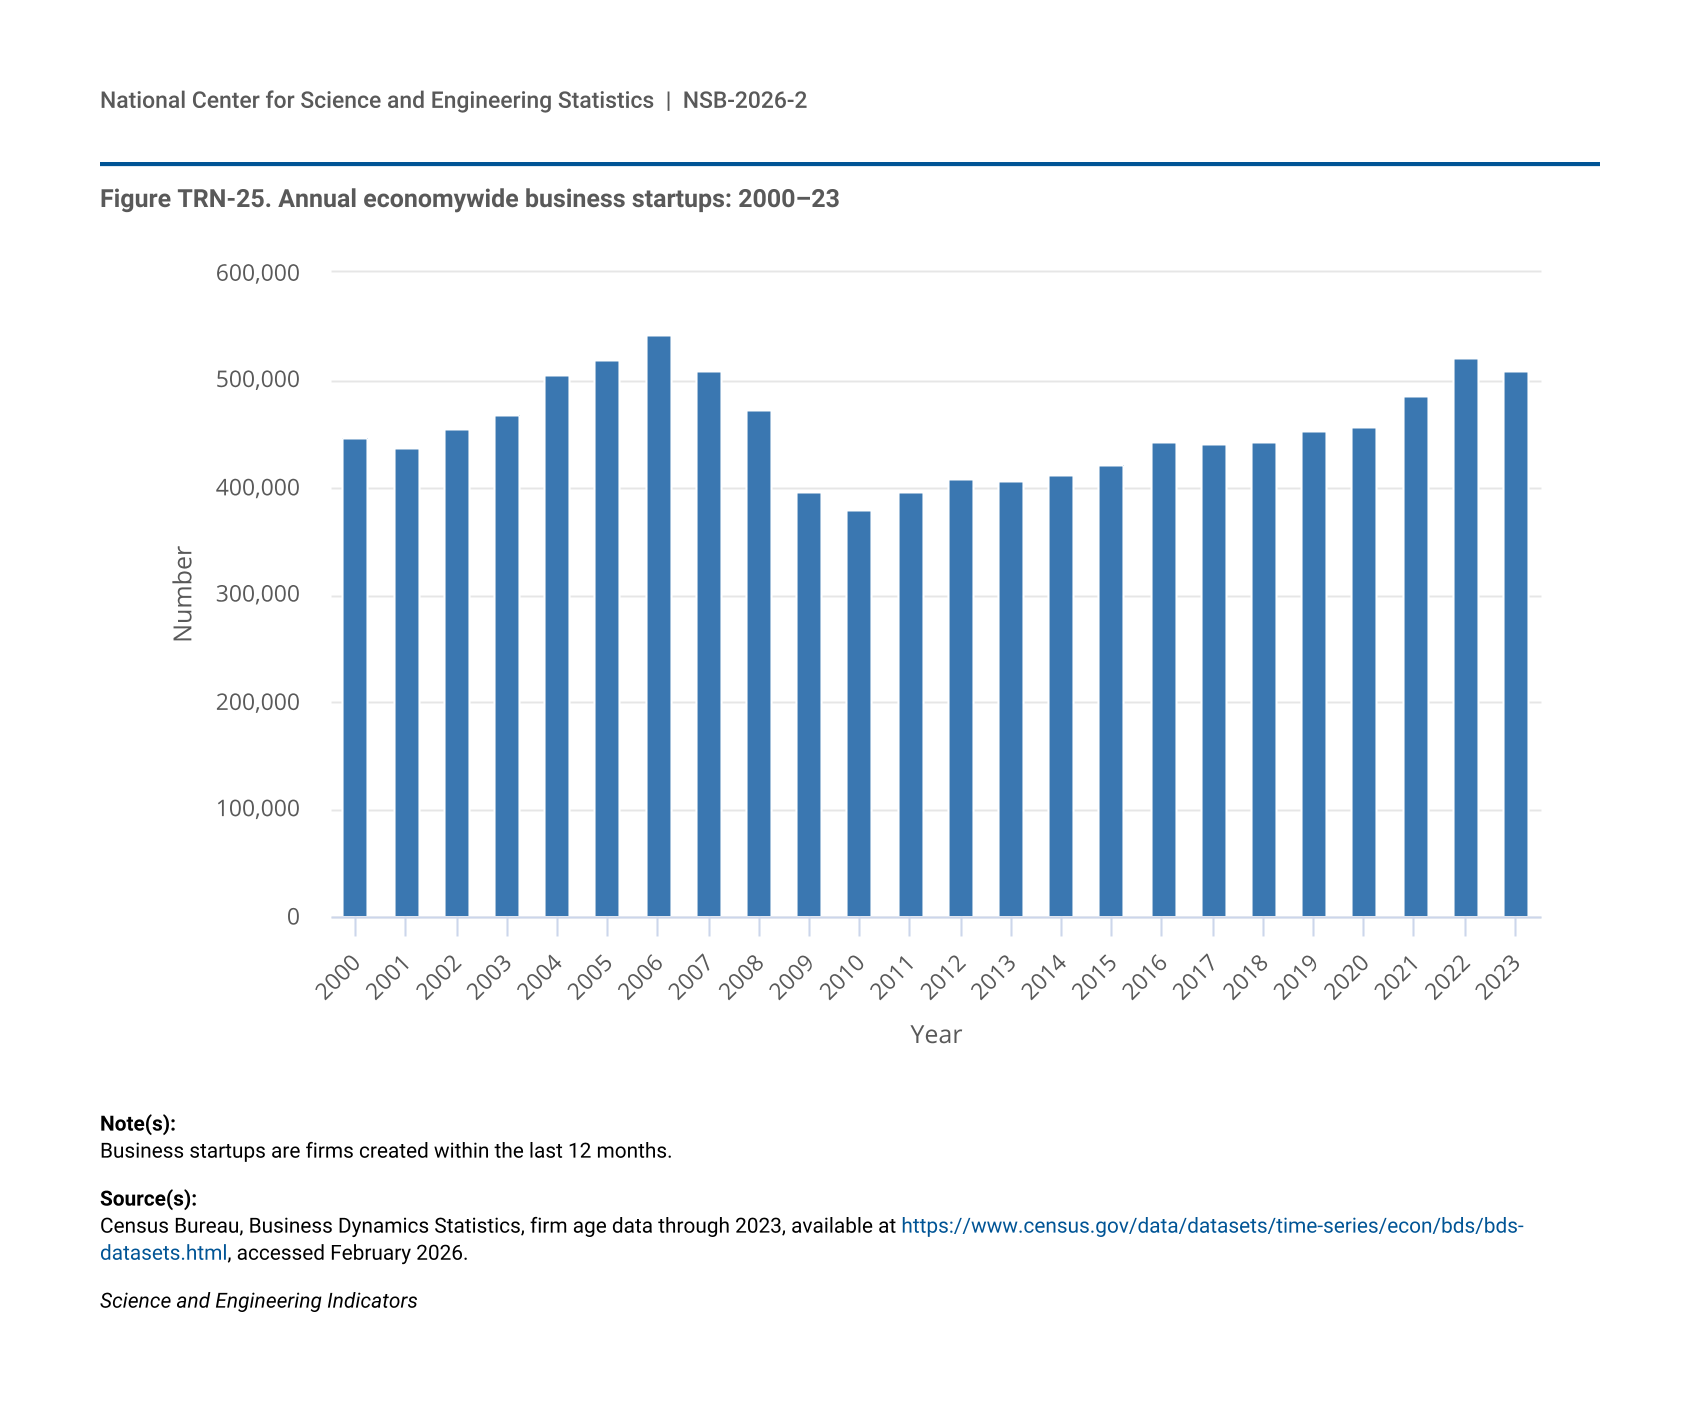
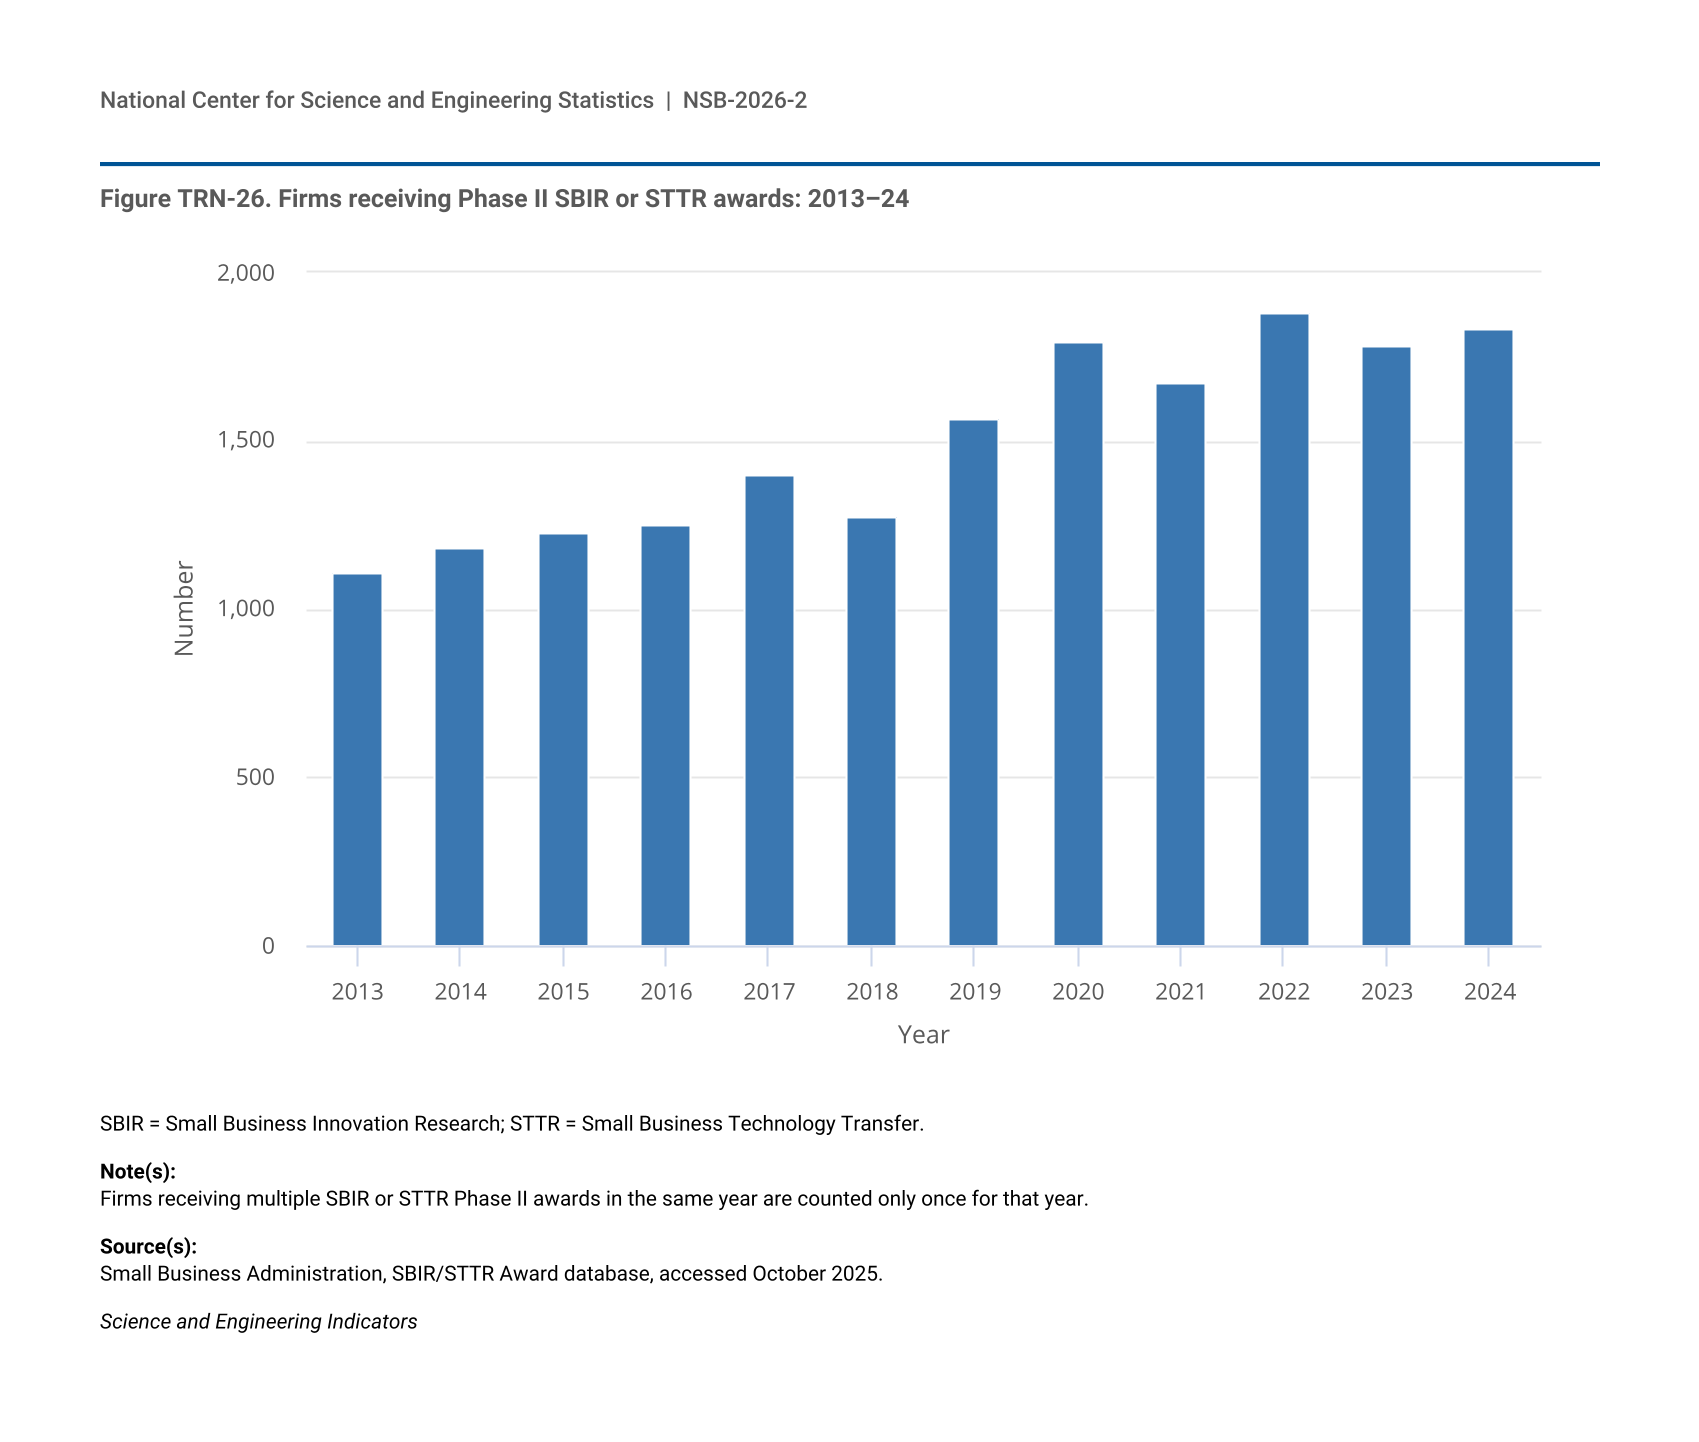
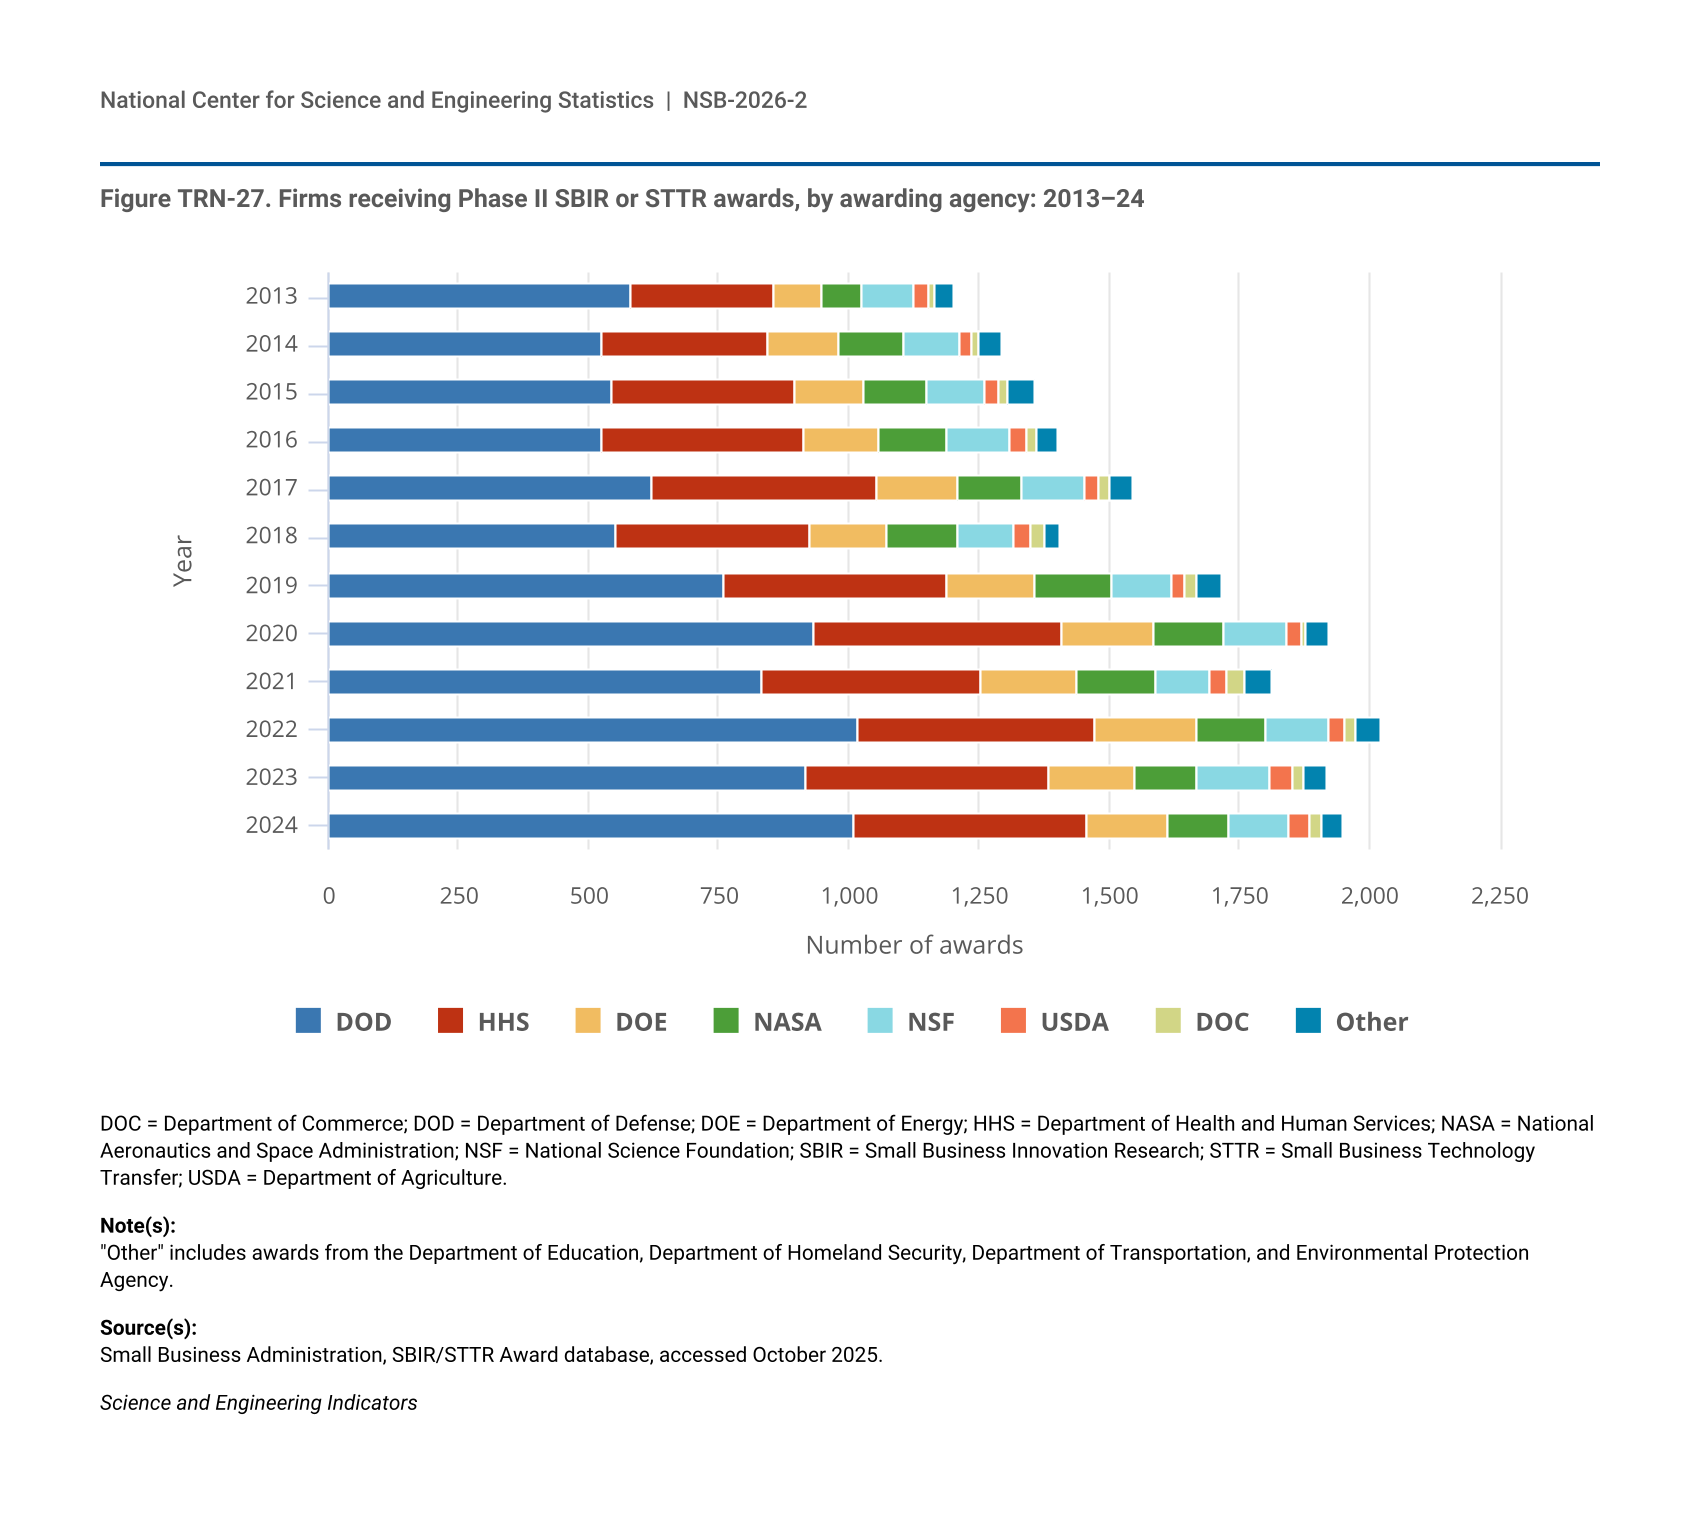
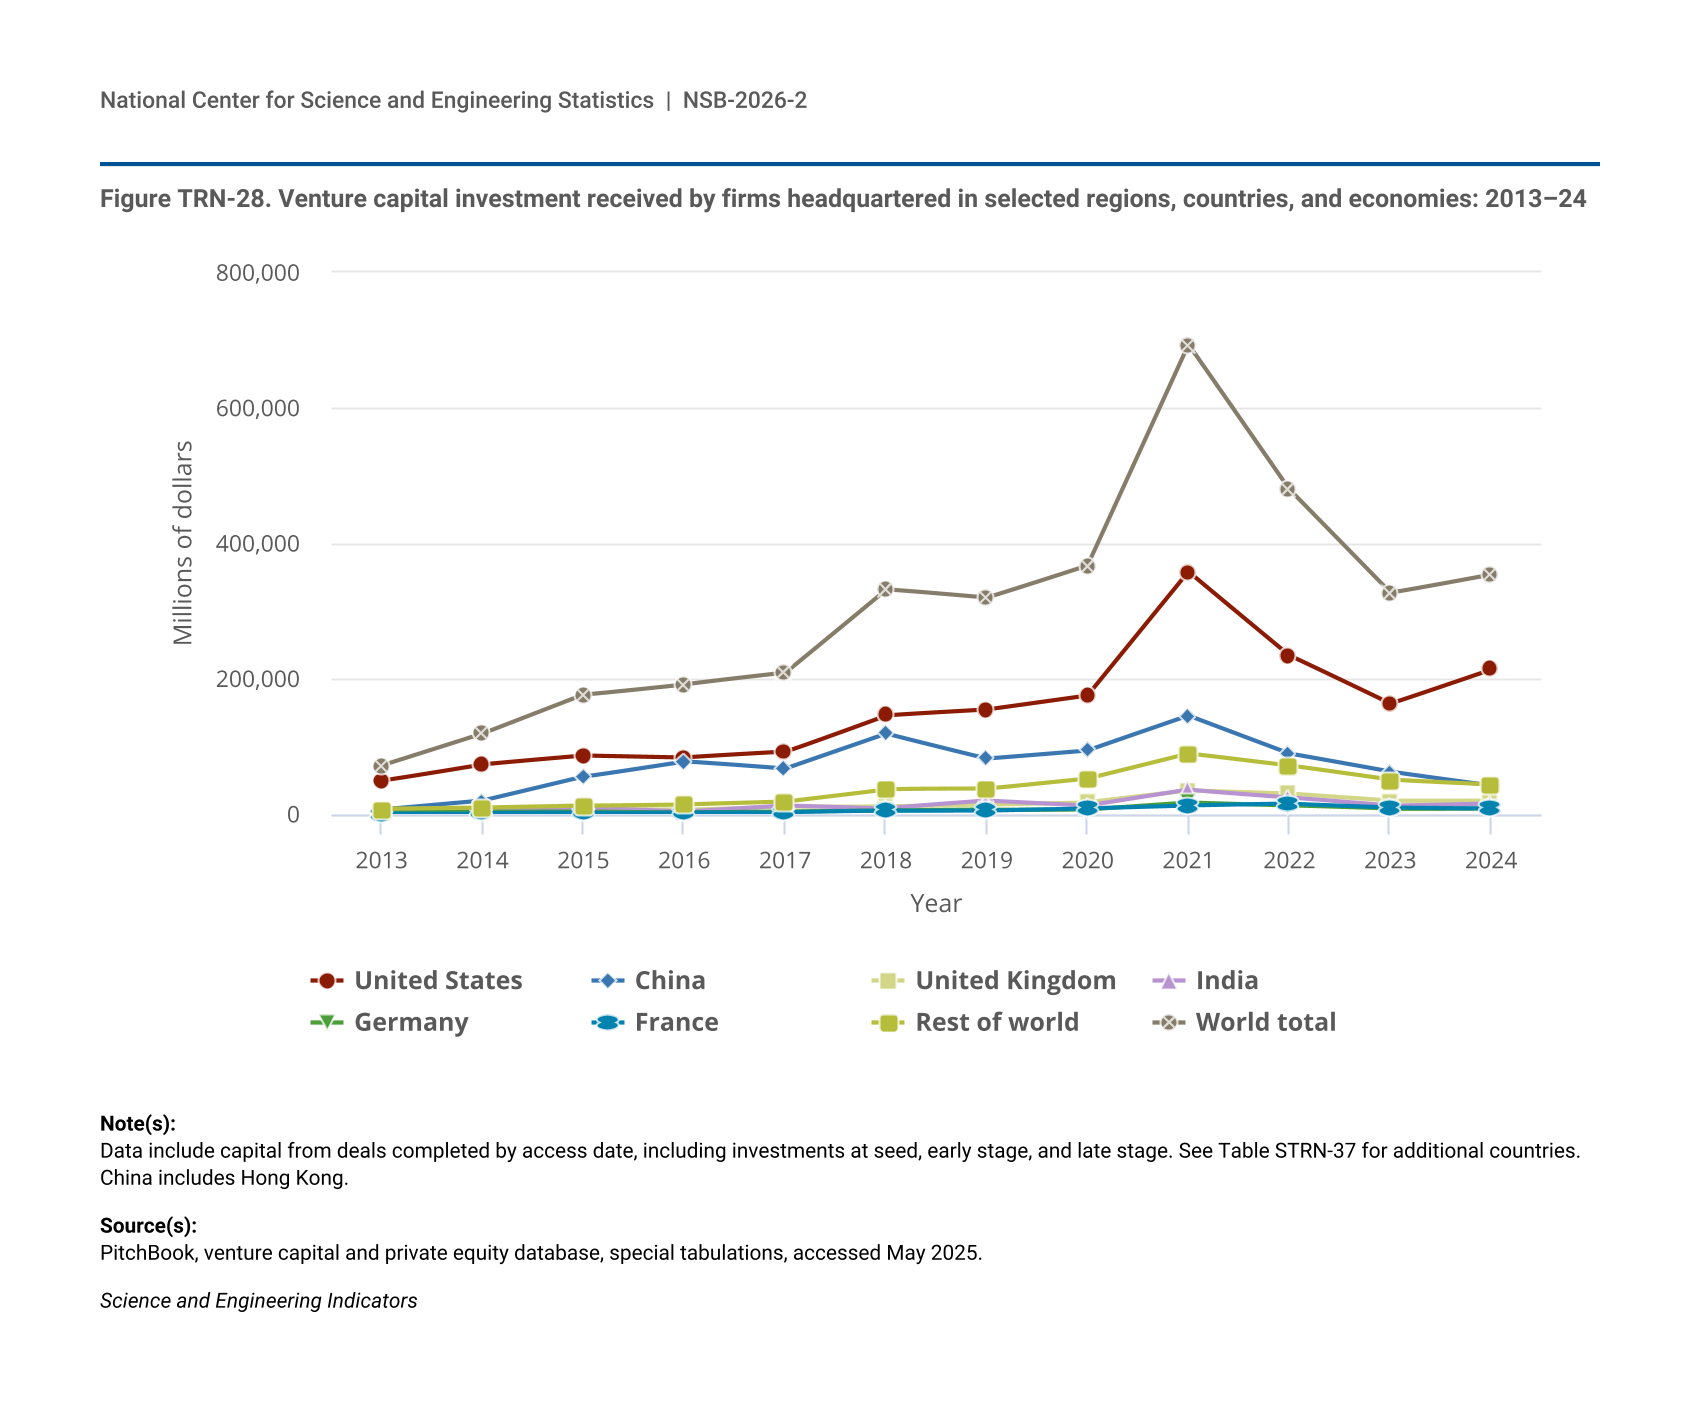
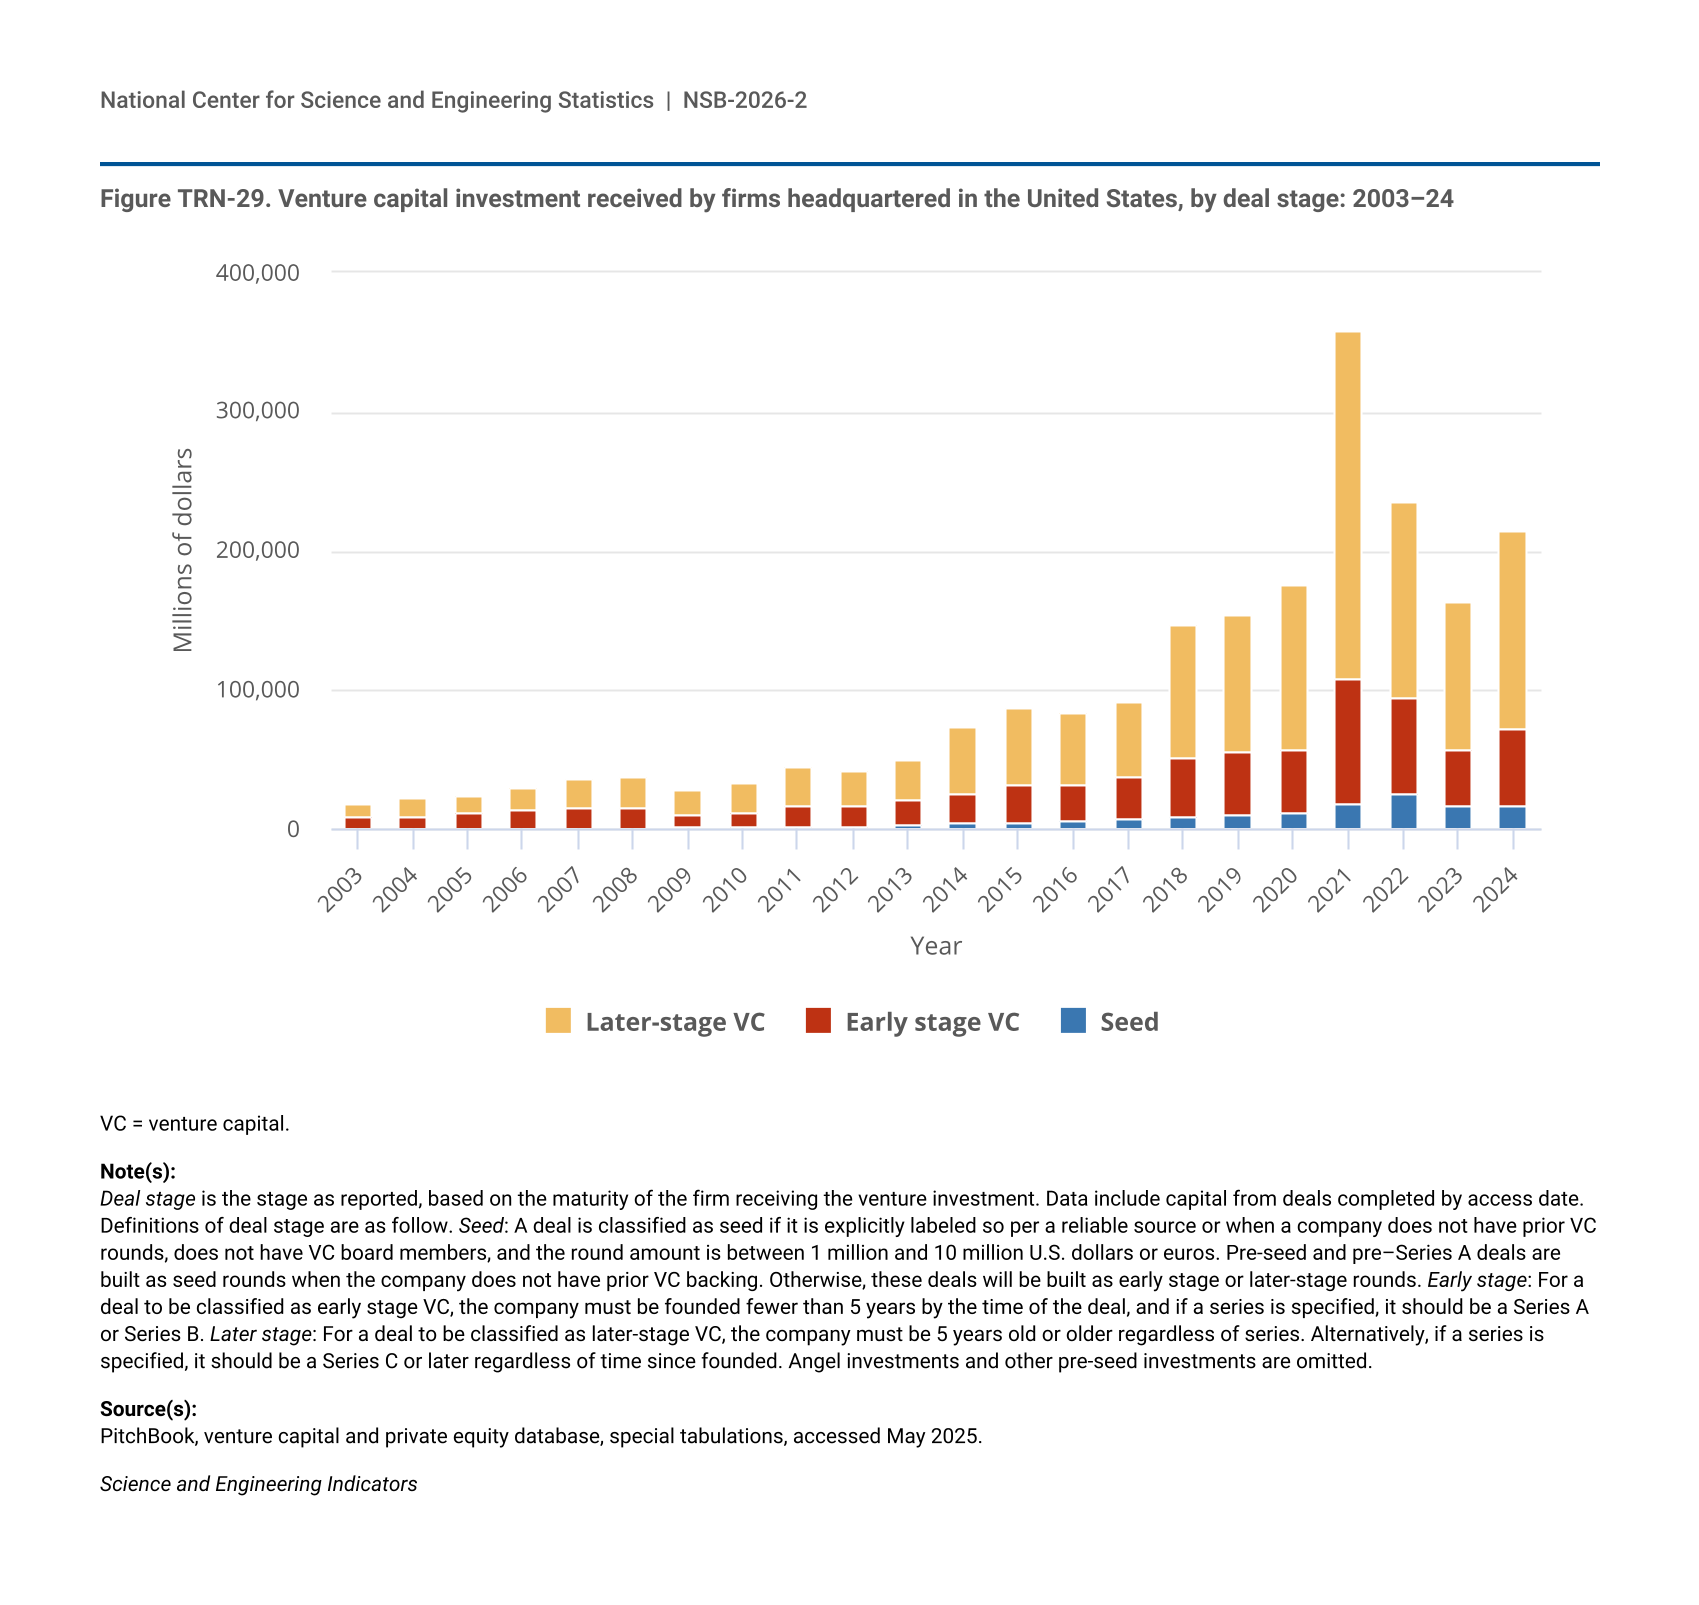
The business dynamics and investment section presents a range of indicators of innovation activities, starting with data on the funding of innovation through federal programs and through private venture capital (VC). Often, these two kinds of funding work together, with federal funding providing the earliest, highest-risk stage of financial capital. This section of the report presents the number of business firms created in a given year (startup firms), an indicator of job growth. It also highlights U.S. and international VC funding, which often supports startups and pre-revenue firms. VC funding is an indicator of innovation activity, as a disproportionate number of companies that ultimately make public offerings and have high rates of recorded R&D expenditures are backed by VC.
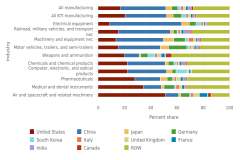
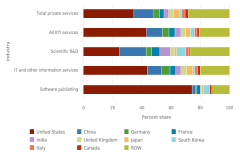
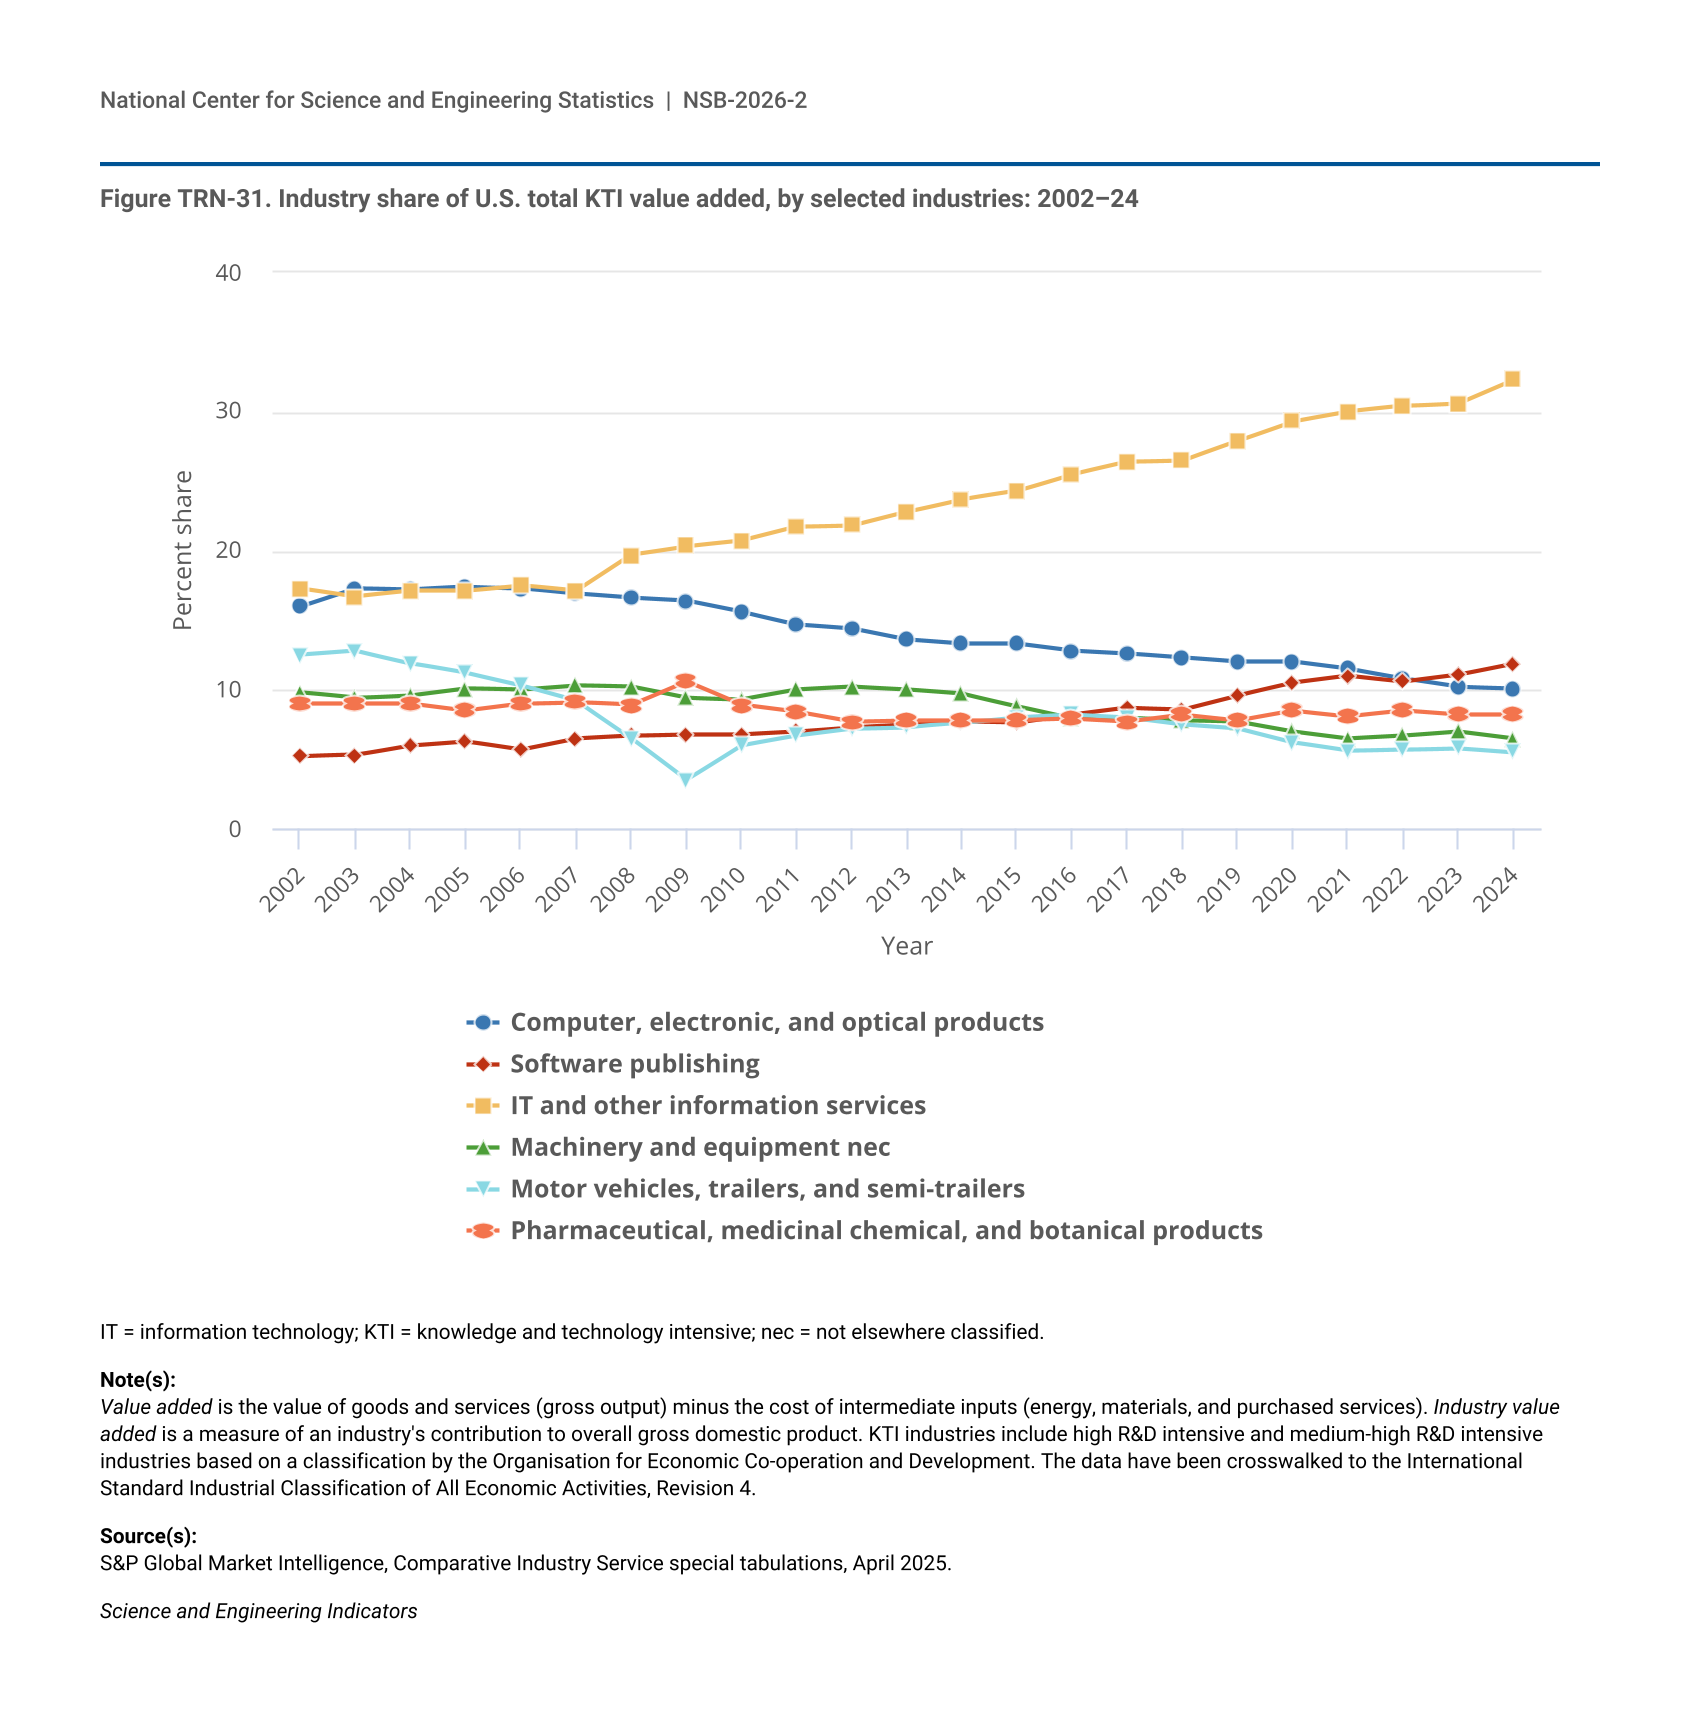
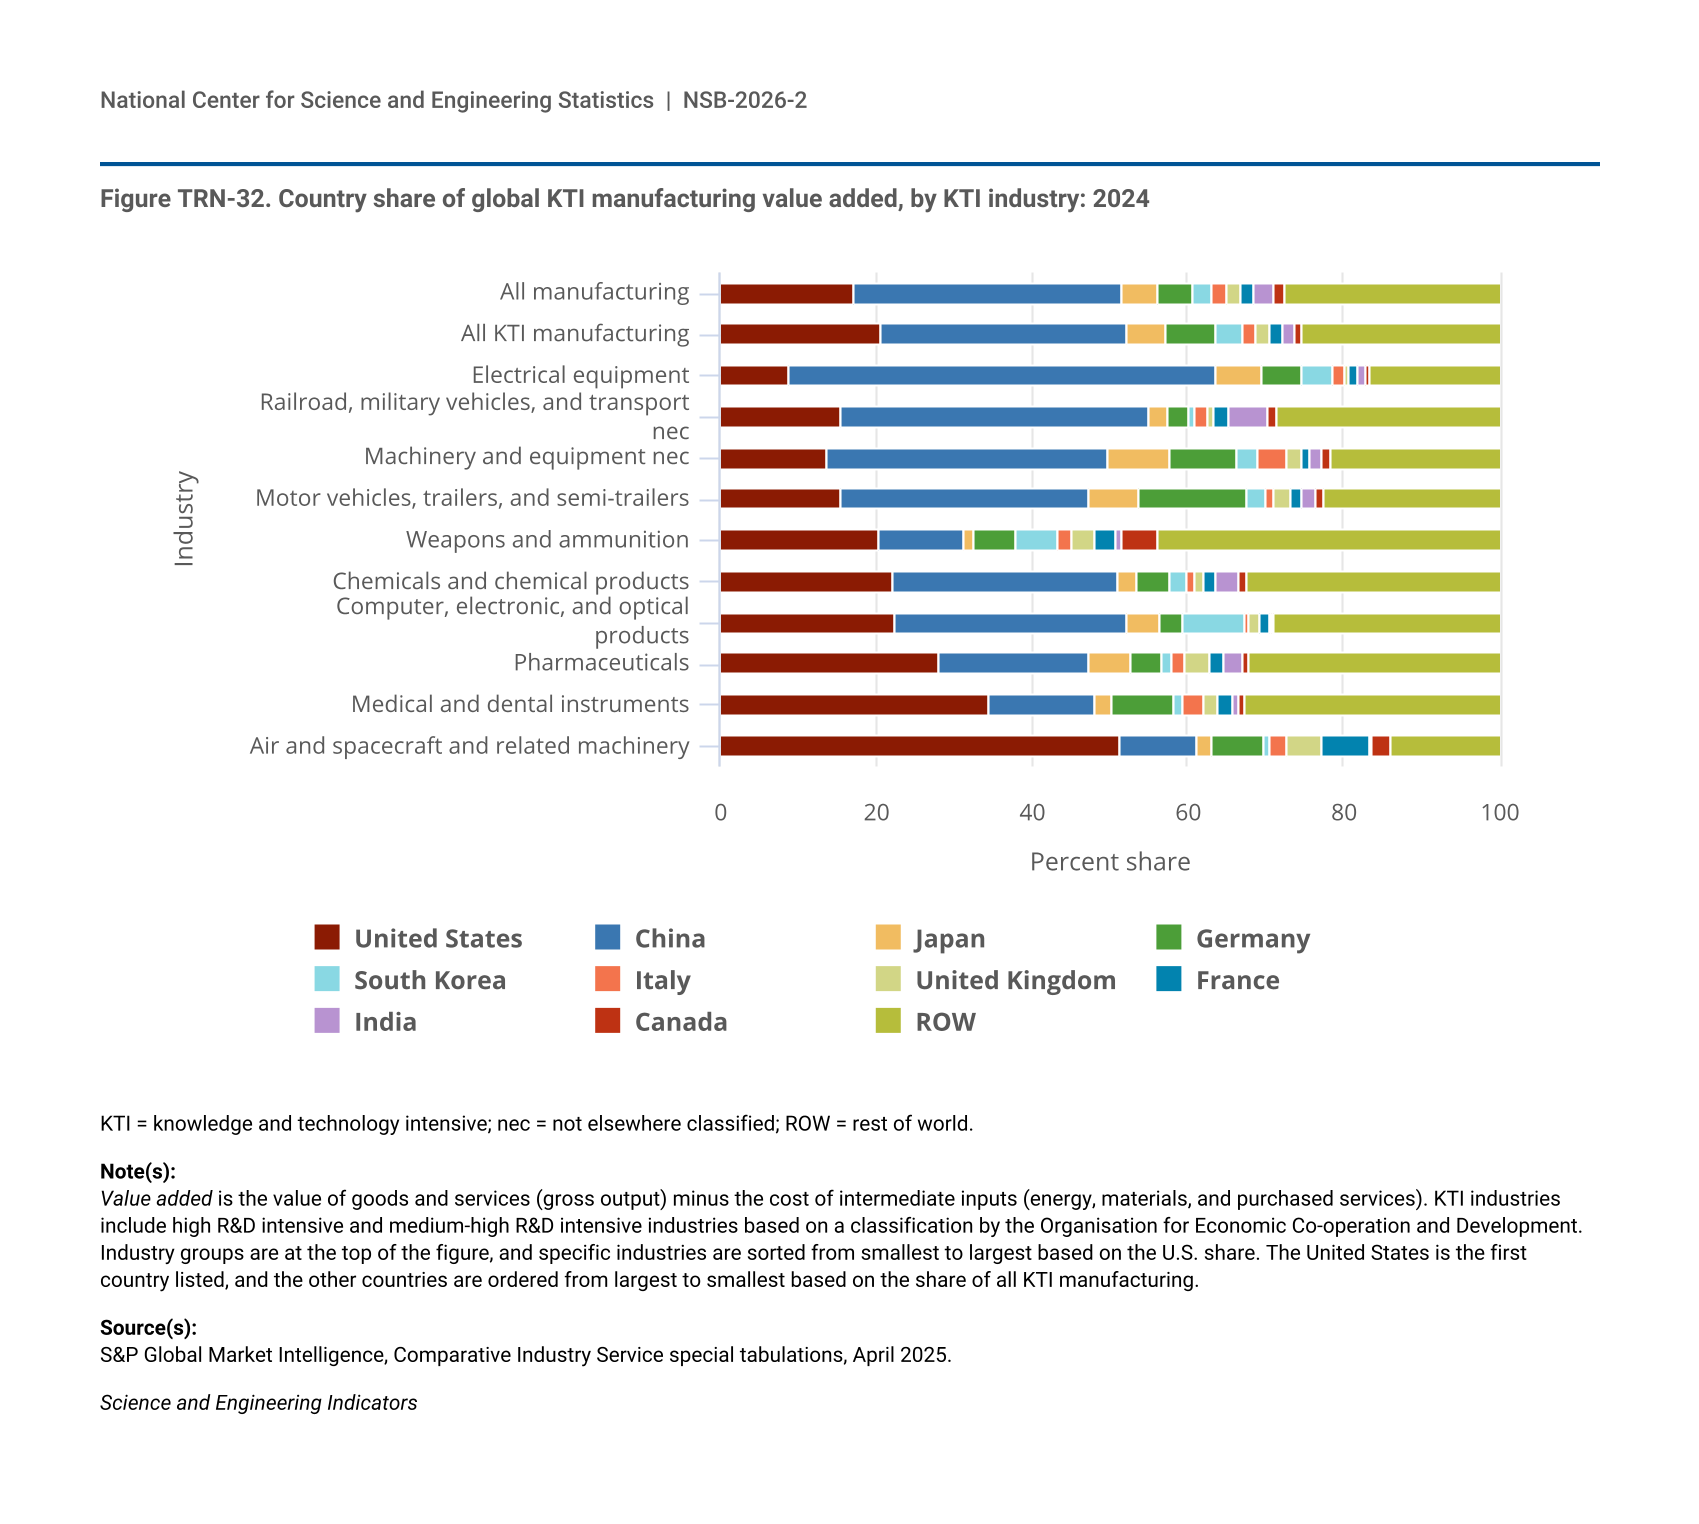
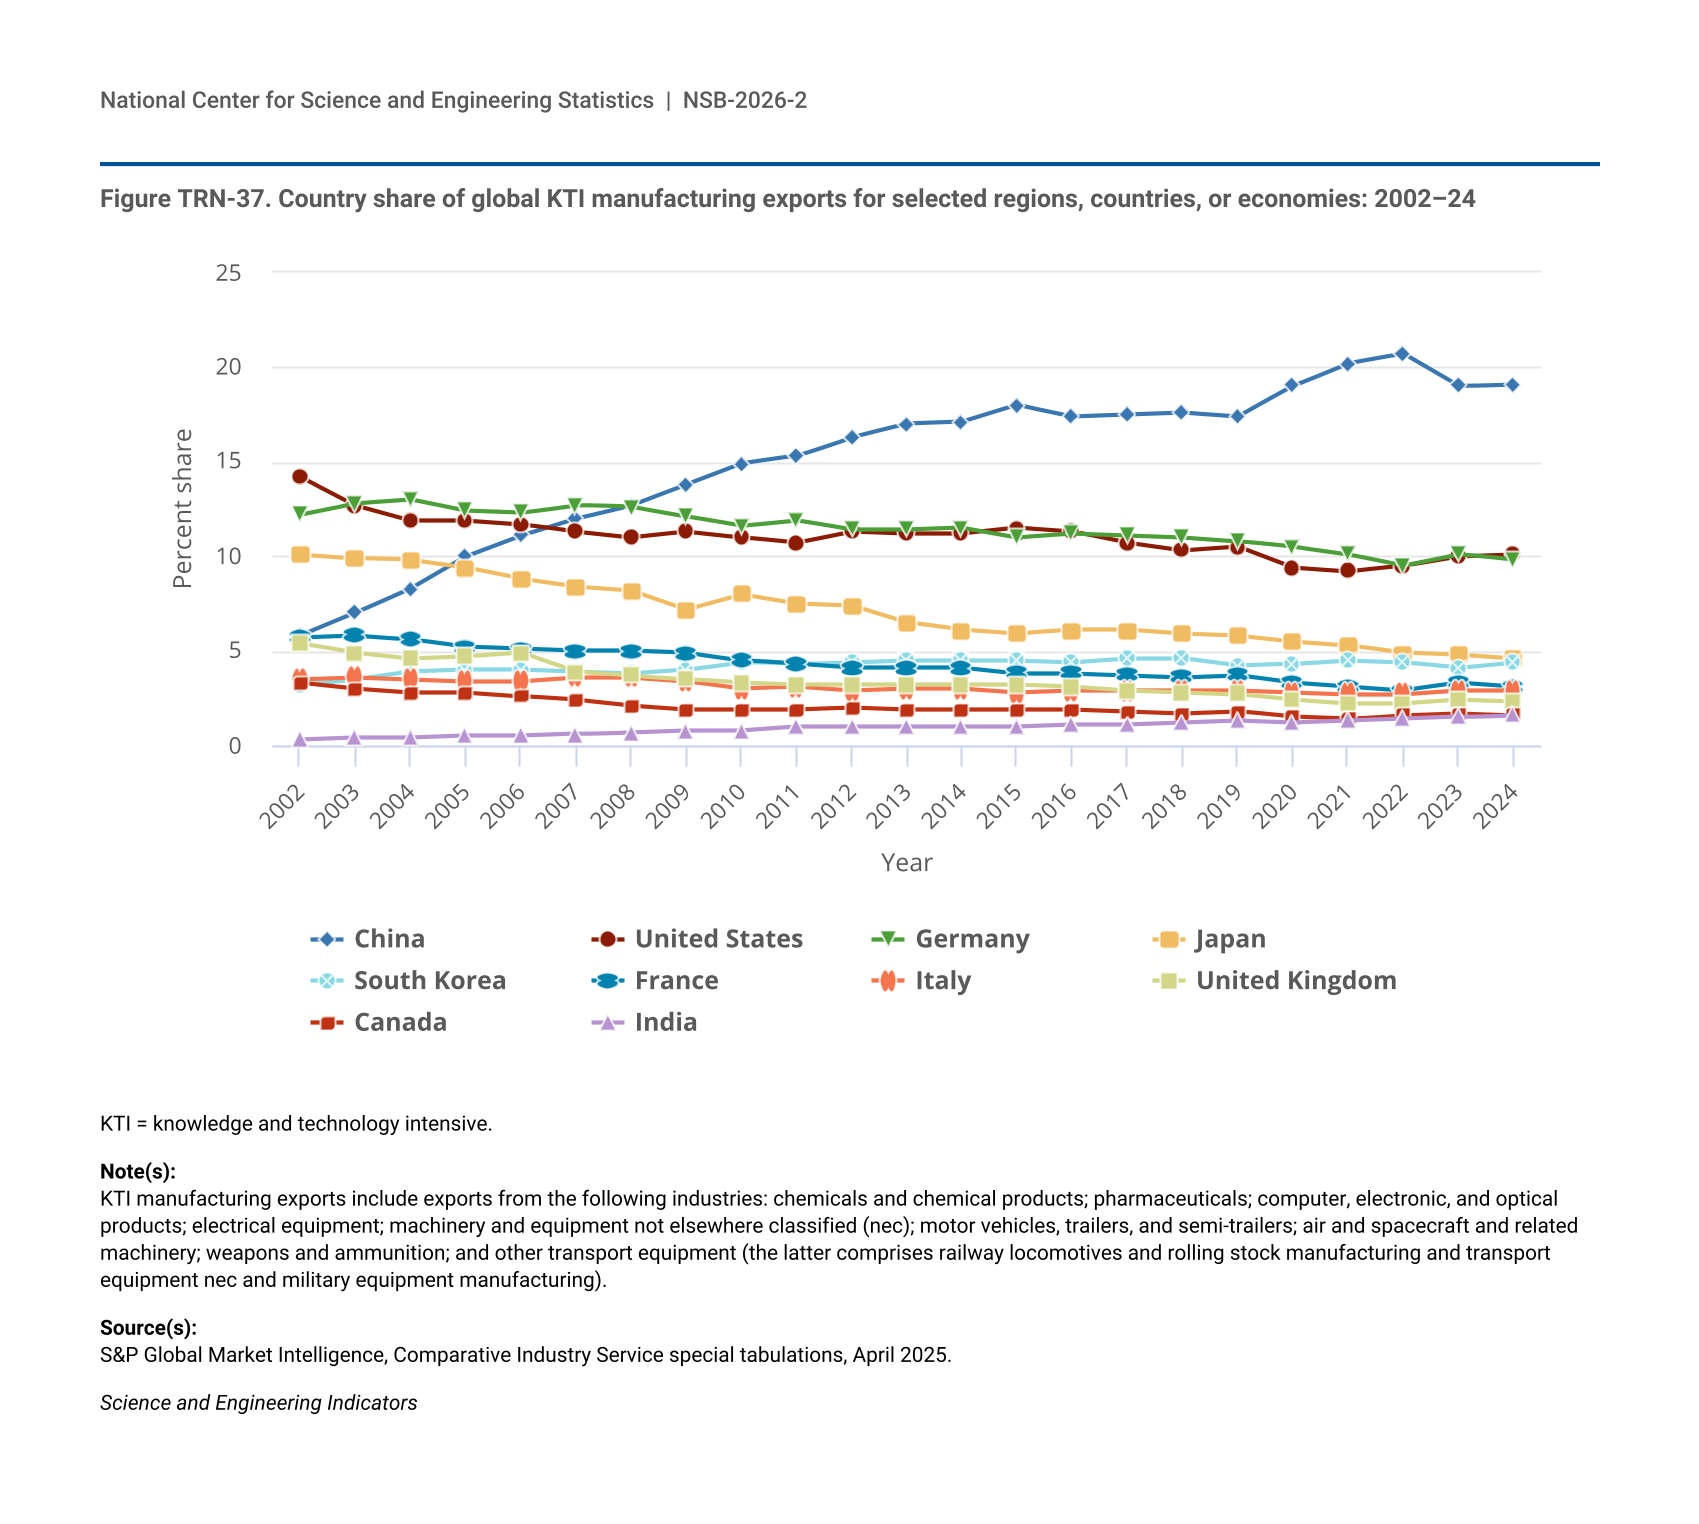
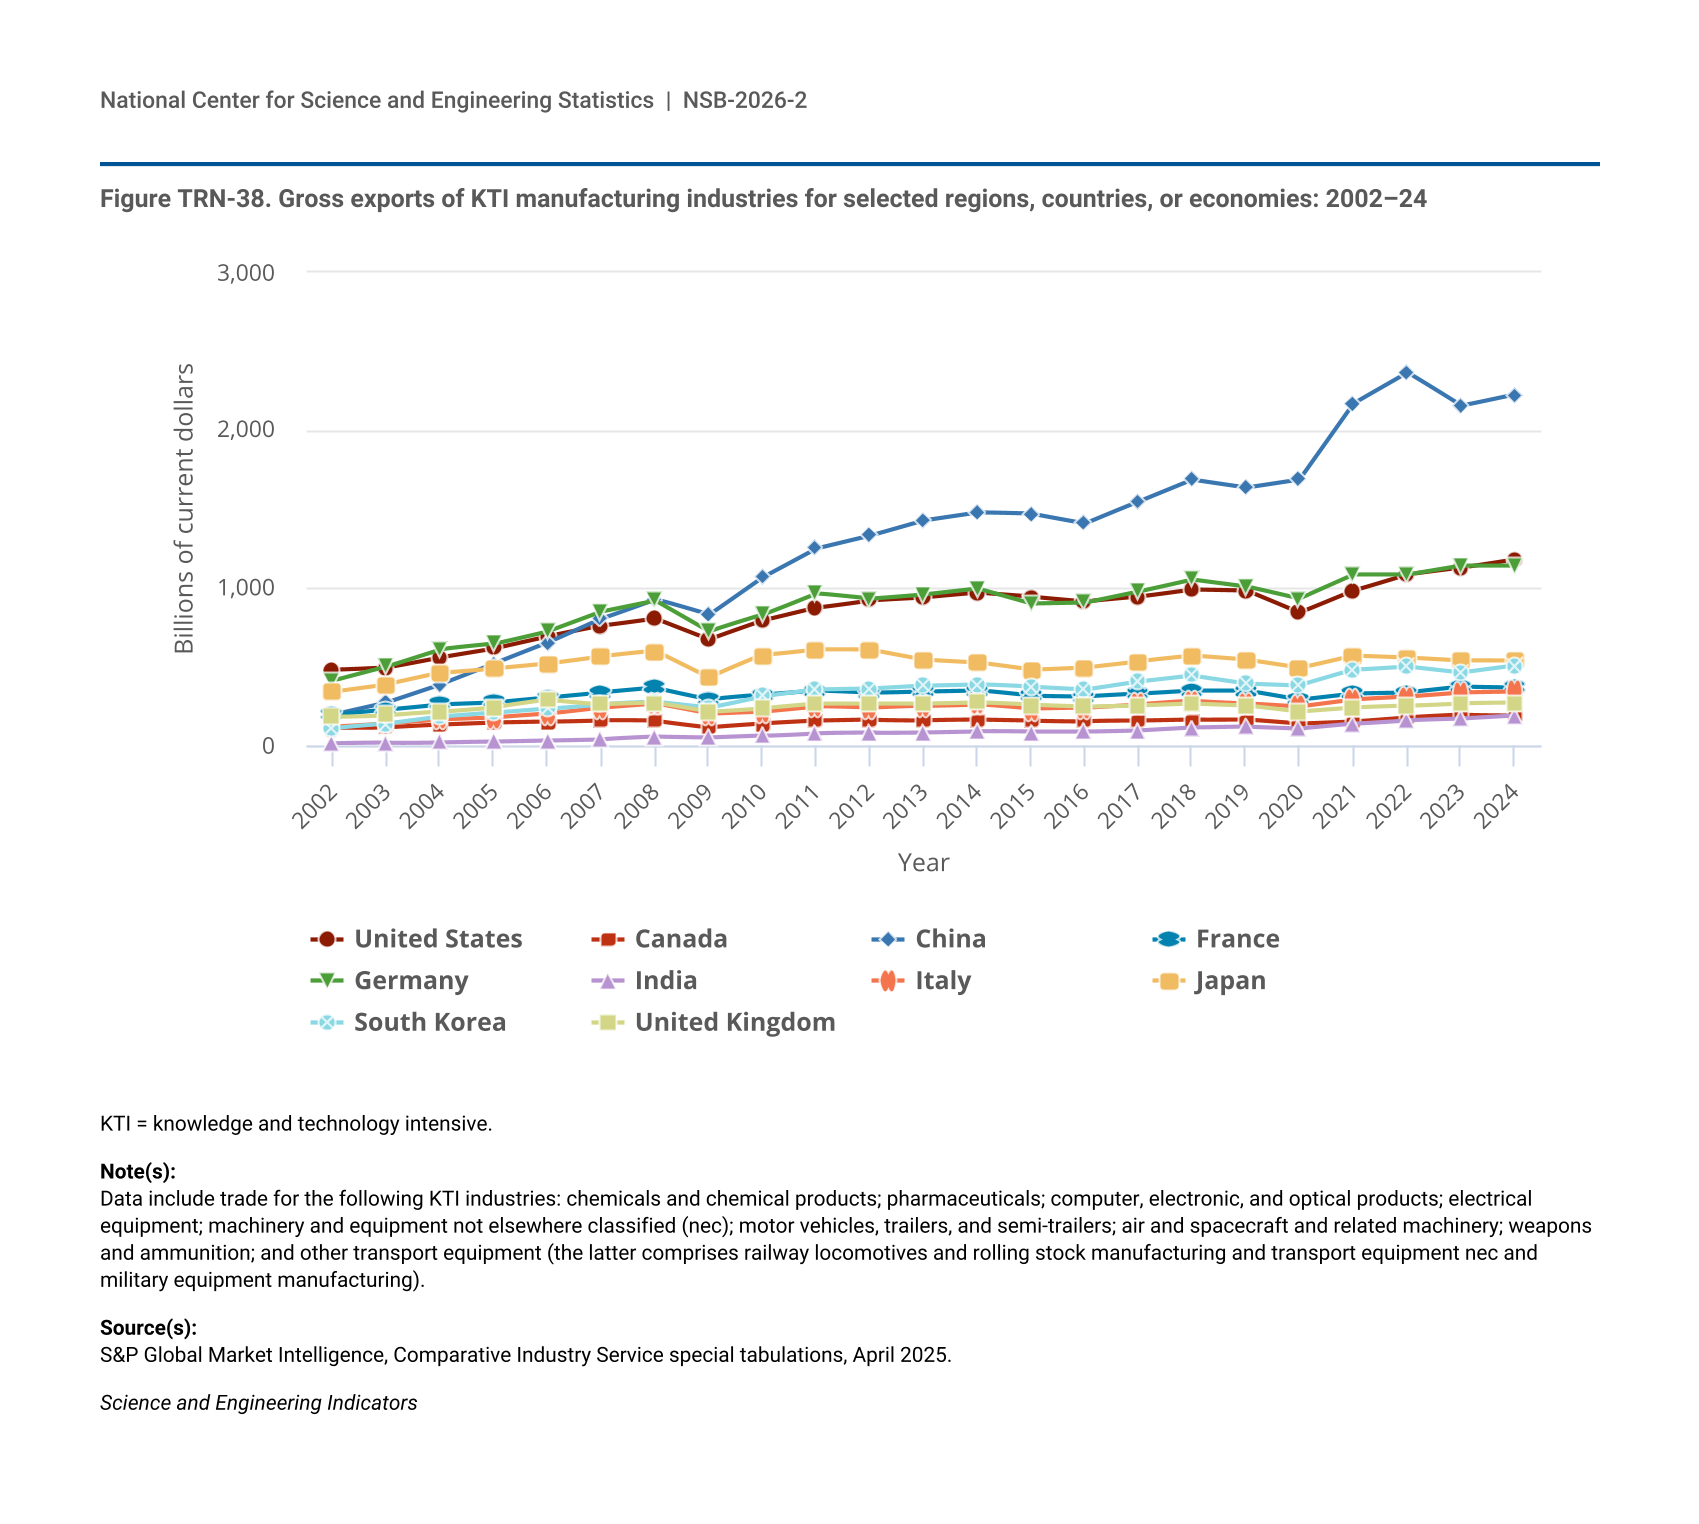
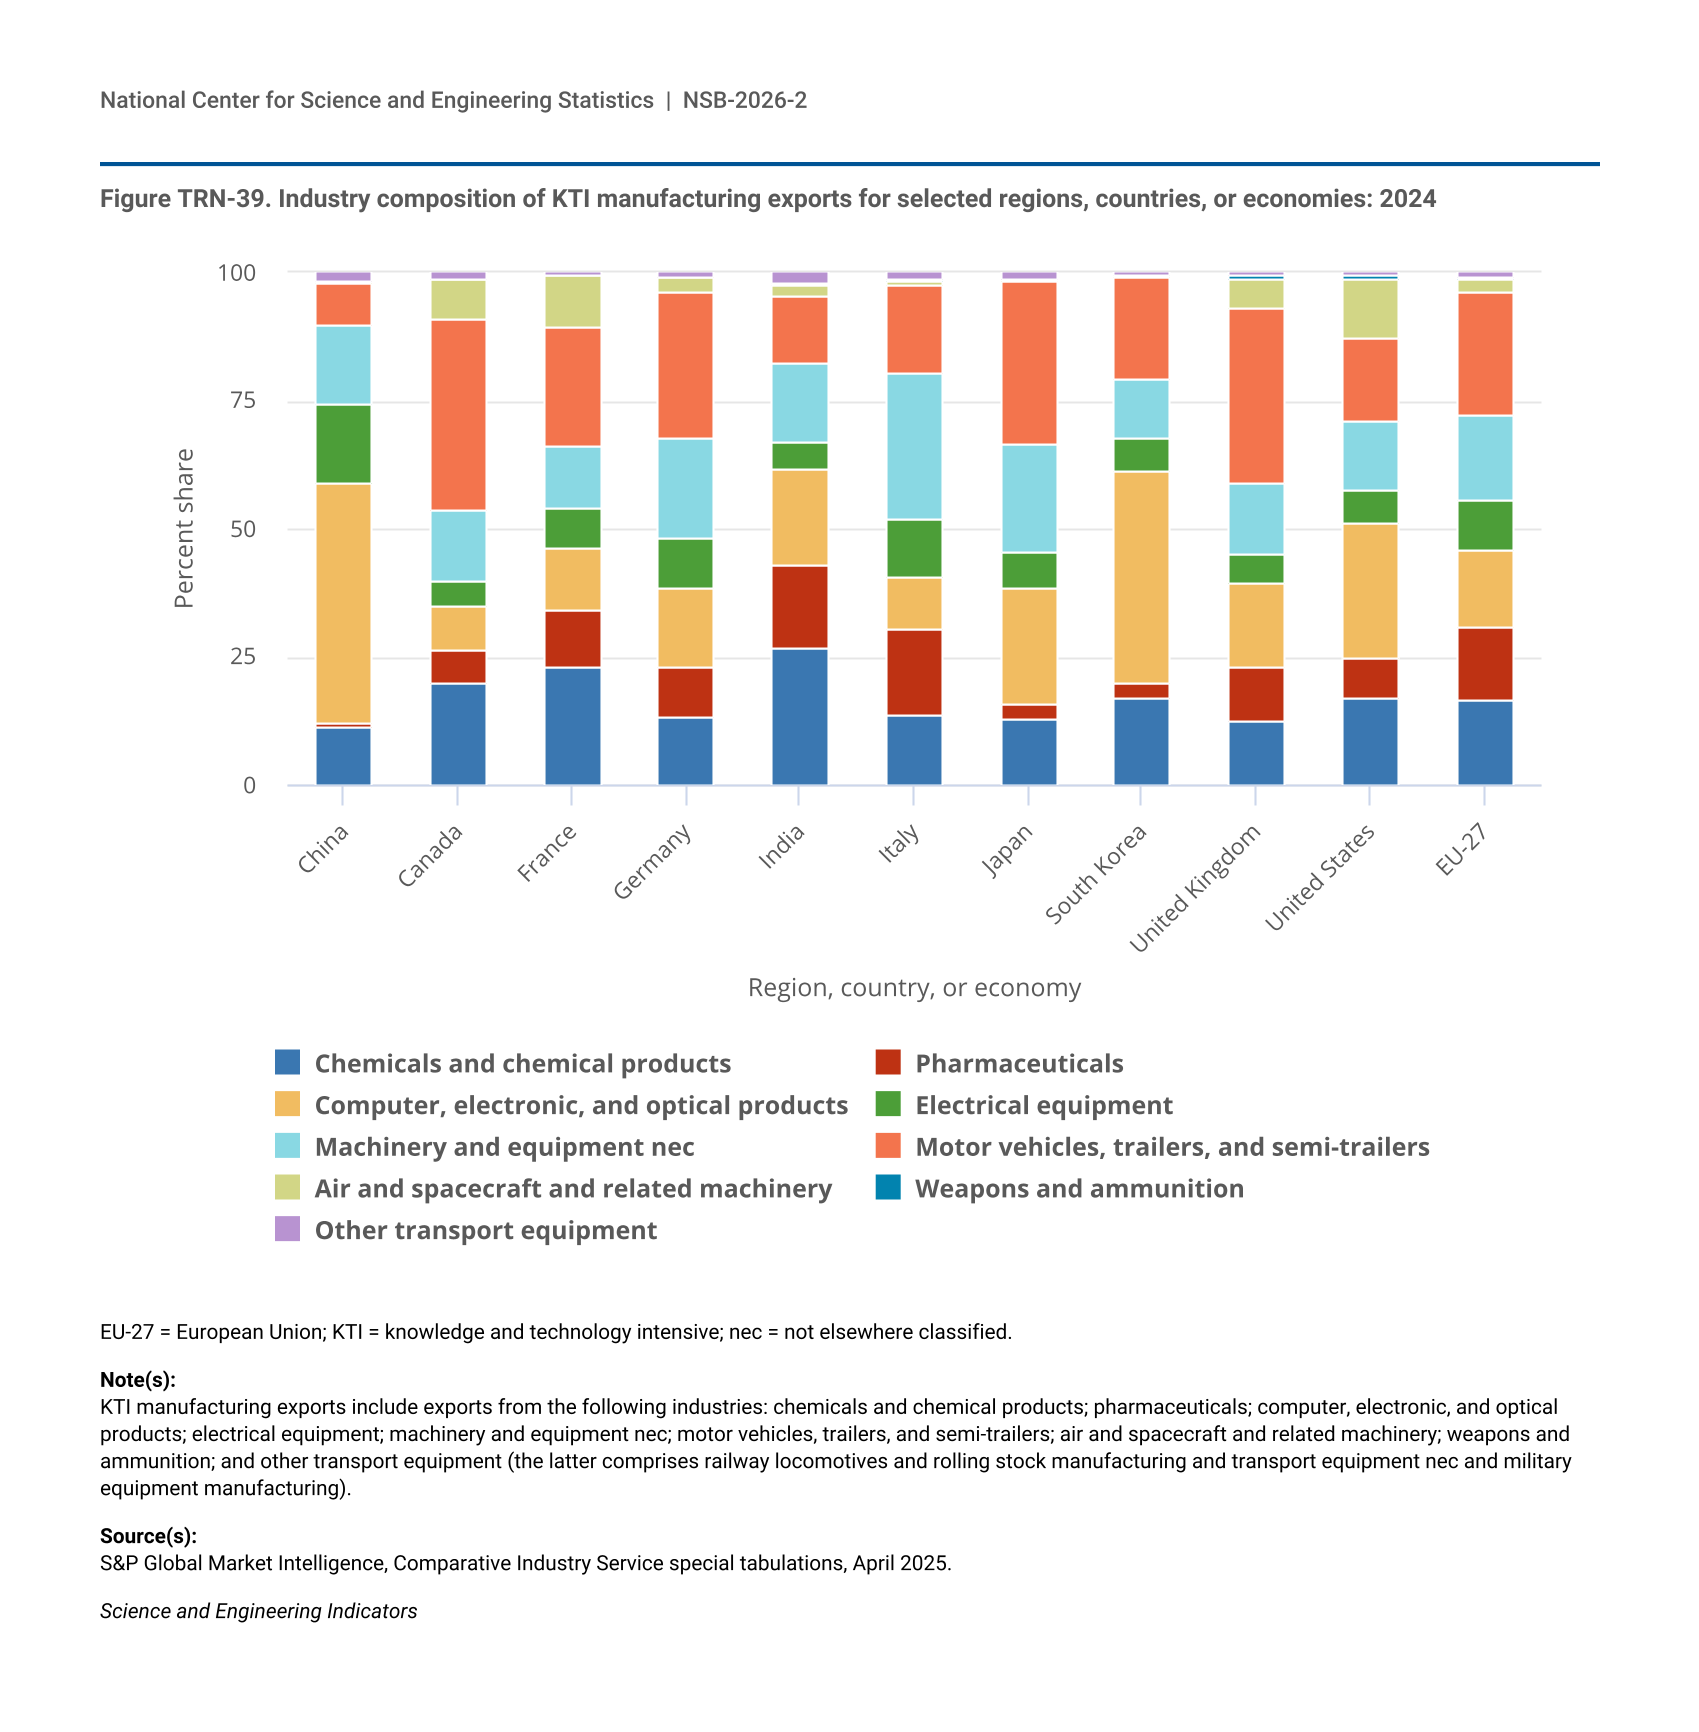
The final two sections of the report examine production and trade patterns of firms in KTI industries. Firms in KTI industries are important funders and performers of R&D, produce high-value products and services and intangible assets, and contribute to the national economic competitiveness in global markets. They often operate in global markets characterized by complex supply chains and rapid technological change that result in the introduction of disruptive products and services, such as AI, and new production practices, such as increased automation. These sections examine patterns of production associated with KTI industries, measured as value-added output, and international trade of KTI goods.
The rest of the introduction of the report discusses the economic concepts that link economic output and growth to R&D and innovation activities through productivity impacts and general-purpose technologies (GPTs). GPTs—that is, new technologies that are widely adopted through the economy—can have particularly large economic impacts. Business survey data presented in this section describe the early adoption of AI by industry and company size. A sidebar provides a discussion of the ways that economic impacts of research are measured in the short term and in the longer term.
Productivity Impacts and General-Purpose Technologies
Although the data and indicators in this report provide a multidimensional picture of translation activities, total factor productivity (TFP) is an internationally comparable indicator of the impact of innovation and technological change on growth within an economic sector. TFP is calculated by dividing output measures by input measures. Any excess output isolated in this calculation is commonly used in economics to interpret how efficiently labor and capital are used to produce goods and services (Acemoglu and Johnson 2023). This excess output is also often used to gauge the effect of R&D activity on technological change (Hall 2011).
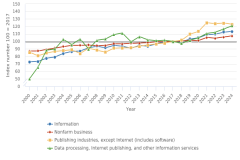
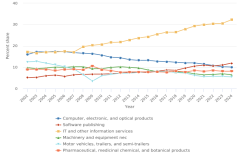
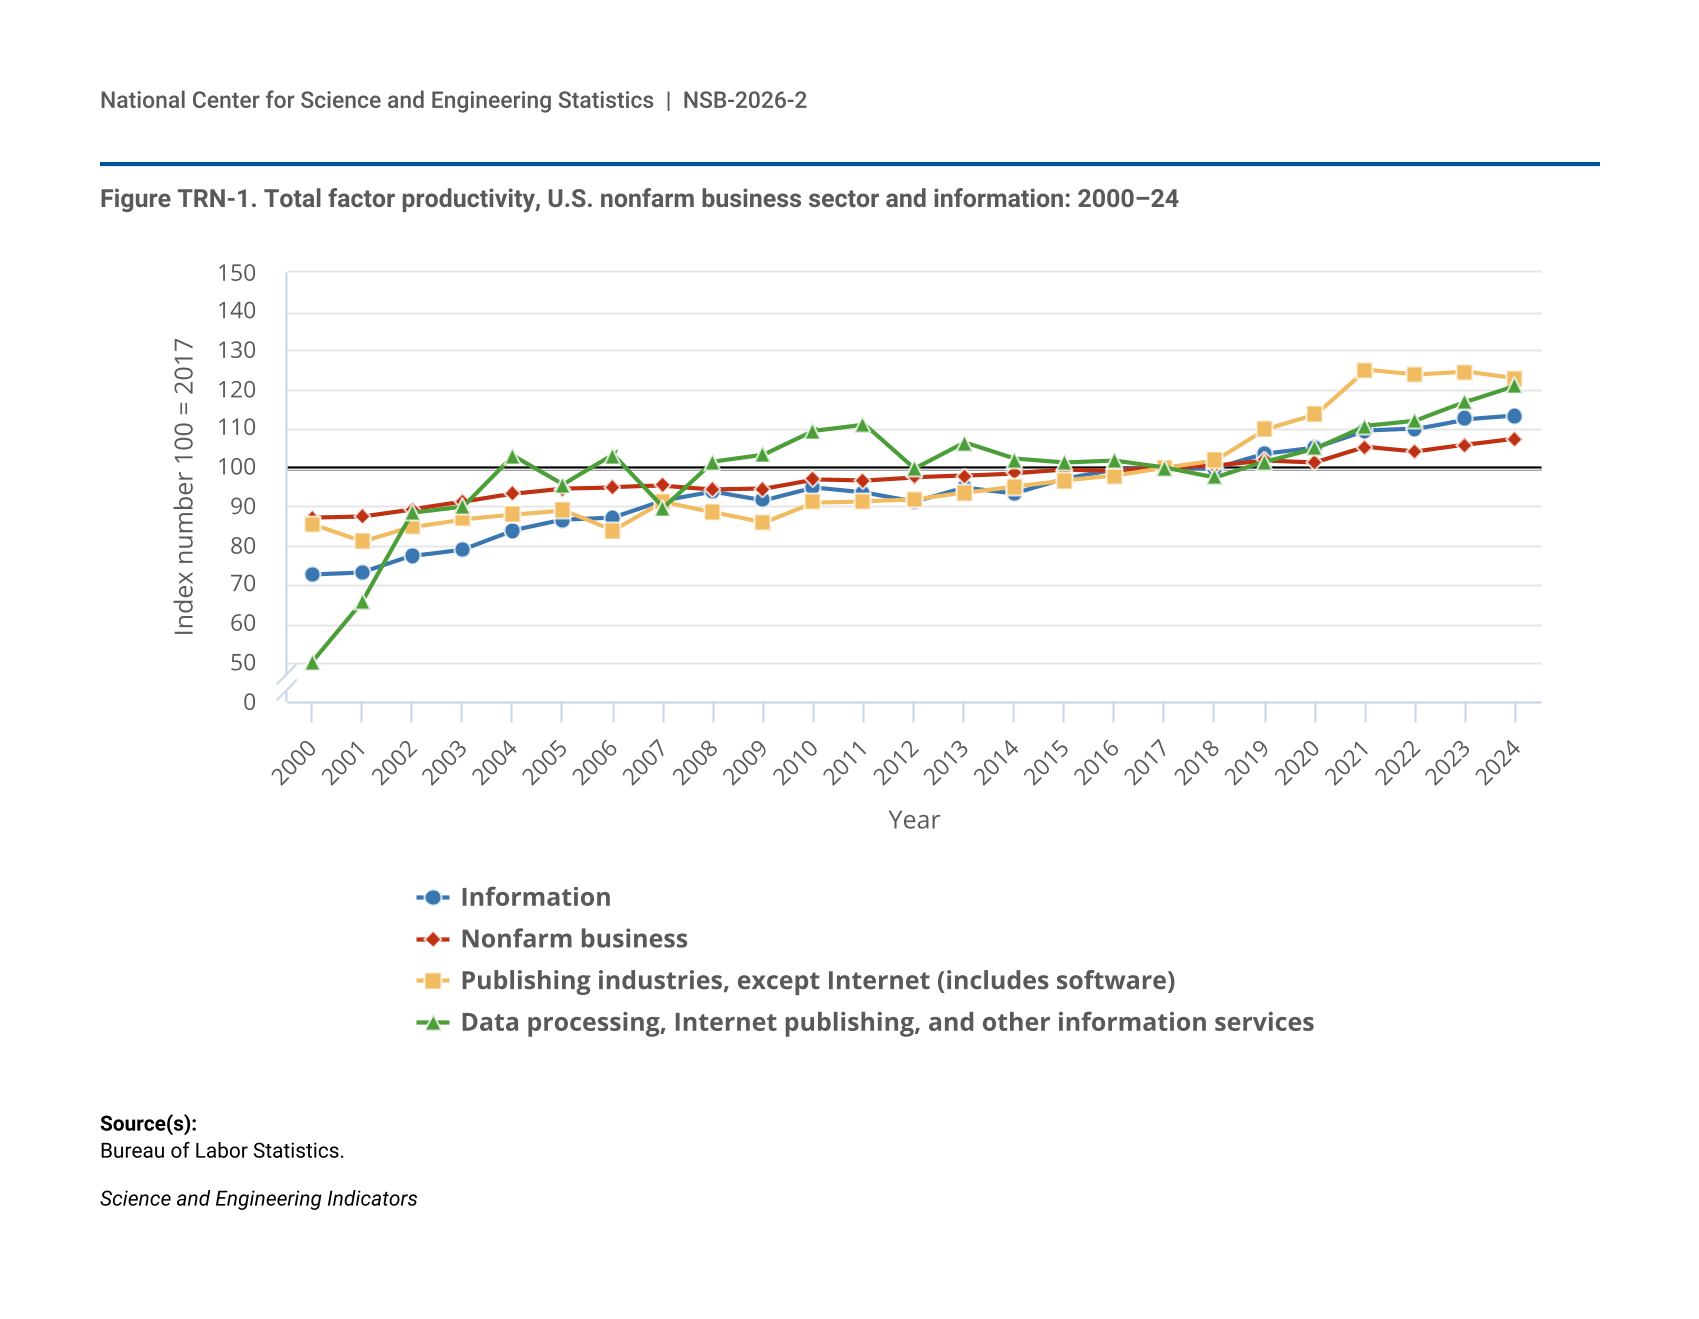
TFP can fluctuate over time, along with the pace of technological advances and their applications to the economy (Gordon 2017). Recently, businesses in the information sector of the economy have seen faster TFP growth than the broader economy. As measured by the Bureau of Labor Statistics, information sector TFP grew 13% between 2017 and 2024, compared with nearly 8% for the nonfarm business sector overall. Components of this sector that are heavily reliant on the use of semiconductors and Internet technology have experienced particularly rapid growth in TFP. Within the information sector, TFP for the publishing industry increased 23% between 2017 and 2024. For data processing, Internet publishing, and other information services, the increase since 2017 has been 21% (Figure TRN-1).
| Year | Information | Nonfarm business | Publishing industries, except Internet (includes software) | Data processing, Internet publishing, and other information services |
|---|---|---|---|---|
| 2000 | 72.7 | 87.2 | 85.4 | 50.3 |
| 2001 | 73.2 | 87.5 | 80.9 | 65.7 |
| 2002 | 77.4 | 89.3 | 84.8 | 88.4 |
| 2003 | 79.1 | 91.2 | 86.8 | 90.0 |
| 2004 | 83.9 | 93.3 | 88.0 | 103.0 |
| 2005 | 86.6 | 94.7 | 89.1 | 95.7 |
| 2006 | 87.2 | 95.0 | 83.8 | 103.2 |
| 2007 | 91.5 | 95.3 | 91.2 | 89.7 |
| 2008 | 93.8 | 94.4 | 88.5 | 101.6 |
| 2009 | 91.6 | 94.6 | 85.9 | 103.4 |
| 2010 | 94.8 | 97.0 | 91.0 | 109.4 |
| 2011 | 93.5 | 96.7 | 91.3 | 111.1 |
| 2012 | 91.2 | 97.5 | 91.7 | 99.7 |
| 2013 | 94.9 | 97.9 | 93.5 | 106.4 |
| 2014 | 93.4 | 98.5 | 95.2 | 102.2 |
| 2015 | 97.1 | 99.4 | 96.7 | 101.2 |
| 2016 | 99.4 | 99.3 | 97.9 | 101.7 |
| 2017 | 100.0 | 100.0 | 100.0 | 100.0 |
| 2018 | 99.8 | 100.6 | 101.8 | 97.5 |
| 2019 | 103.5 | 101.9 | 109.7 | 101.5 |
| 2020 | 105.1 | 101.4 | 113.5 | 104.9 |
| 2021 | 109.4 | 105.3 | 125.0 | 110.7 |
| 2022 | 109.9 | 104.2 | 123.8 | 112.1 |
| 2023 | 112.4 | 105.9 | 124.6 | 116.8 |
| 2024 | 113.3 | 107.5 | 122.8 | 121.0 |
Bureau of Labor Statistics.
Science and Engineering Indicators
Semiconductors and the Internet are examples of technologies that are widely used, continually improved, and used to enable applications in other sectors. As such, they are referred often to as general-purpose technologies (GPTs). Other historical examples of GPTs include electricity and computers. By complementing advances in other technologies, GPTs are often widely adopted across industries and may lead to productivity growth (NASEM 2025). Their impact on economic growth and productivity is influenced by factors like application across sectors, the deployment of capital, and workforce effects (Bresnahan 2010).
As an example, semiconductors enable other technologies and have experienced increasing returns over time as they are used in new applications, like semiconductors originally optimized for graphics being used for AI applications. In the mid-20th century, as technology for creating electronic circuits led to miniaturization, the uses of semiconductors expanded. Early applications included hearing aids and televisions (Bresnahan and Trajtenberg 1992). The widely cited “Moore’s Law,” attributed to Intel co-founder Gordon Moore, predicted that semiconductor processing power would double roughly every 2 years as prices declined (Moore 1965). Improvements in processing power have been accompanied by a decades-long decline in semiconductor prices, leading to broad applications in computing, communications, and other products (Jorgenson 2001).
Artificial Intelligence as a GPT
Built on the foundation of semiconductor and Internet technologies, AI has more recently been identified as a rapidly growing GPT with implications for productivity and employment (Brynjolfsson and McAfee 2016; NASEM 2025; Trajtenberg 2018). In November 2022, ChatGPT, the first widely available AI software tool, was released to the public (Heaven 2023). The number of computer and information science degrees at the bachelor’s and master’s levels awarded by U.S. universities has increased concurrently with the growth in information and communications industries that have given rise to AI technology. Between 2013 and 2023, the numbers of these degrees awarded have more than doubled (see the Indicators 2026 report “STEM Talent: Education, Training, and Workforce” [NSB 2026: Figure TAL-23, Figure TAL-24]). Although reliable data on AI’s impact on the workforce as a whole are scarce thus far, questions likely relevant to consider when addressing AI’s potential impact on the workforce include the following:
- To what extent will specific skills within occupations become obsolete?
- Which specific skills within occupations may be enhanced?
- What skills will employers recruit for with the implementation of AI within their industry?
- What is the likely feasibility of workers within certain occupations to upgrade their implicated skills (NASEM 2025)?
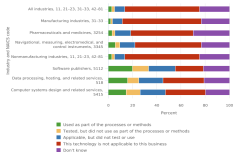
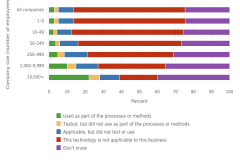
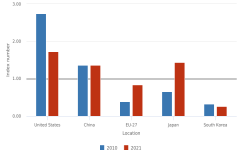
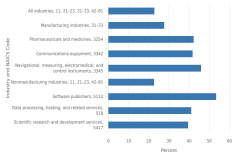
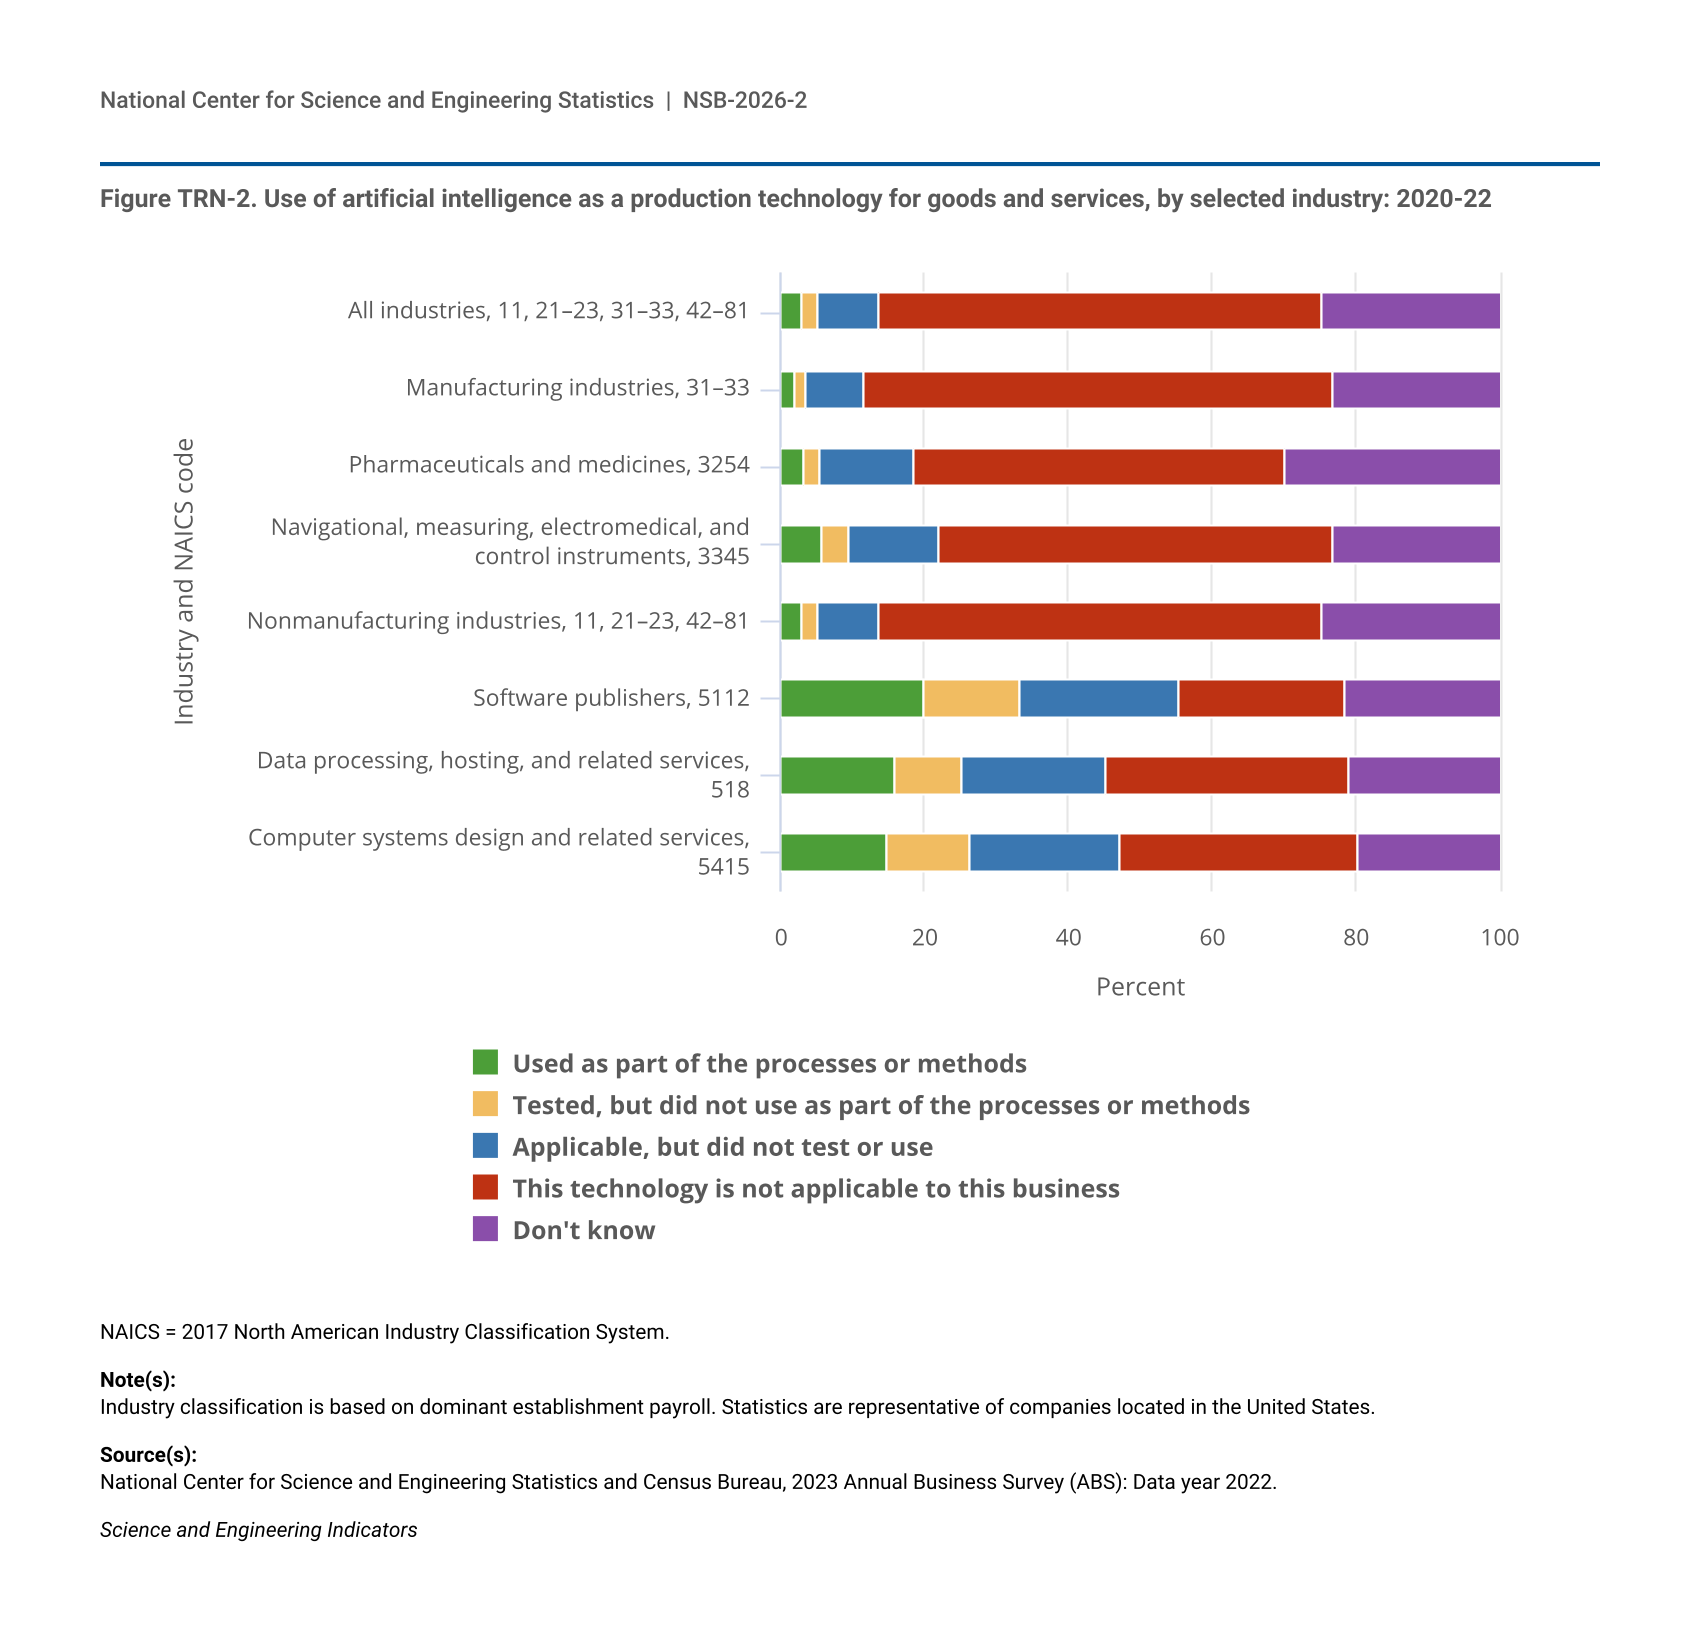
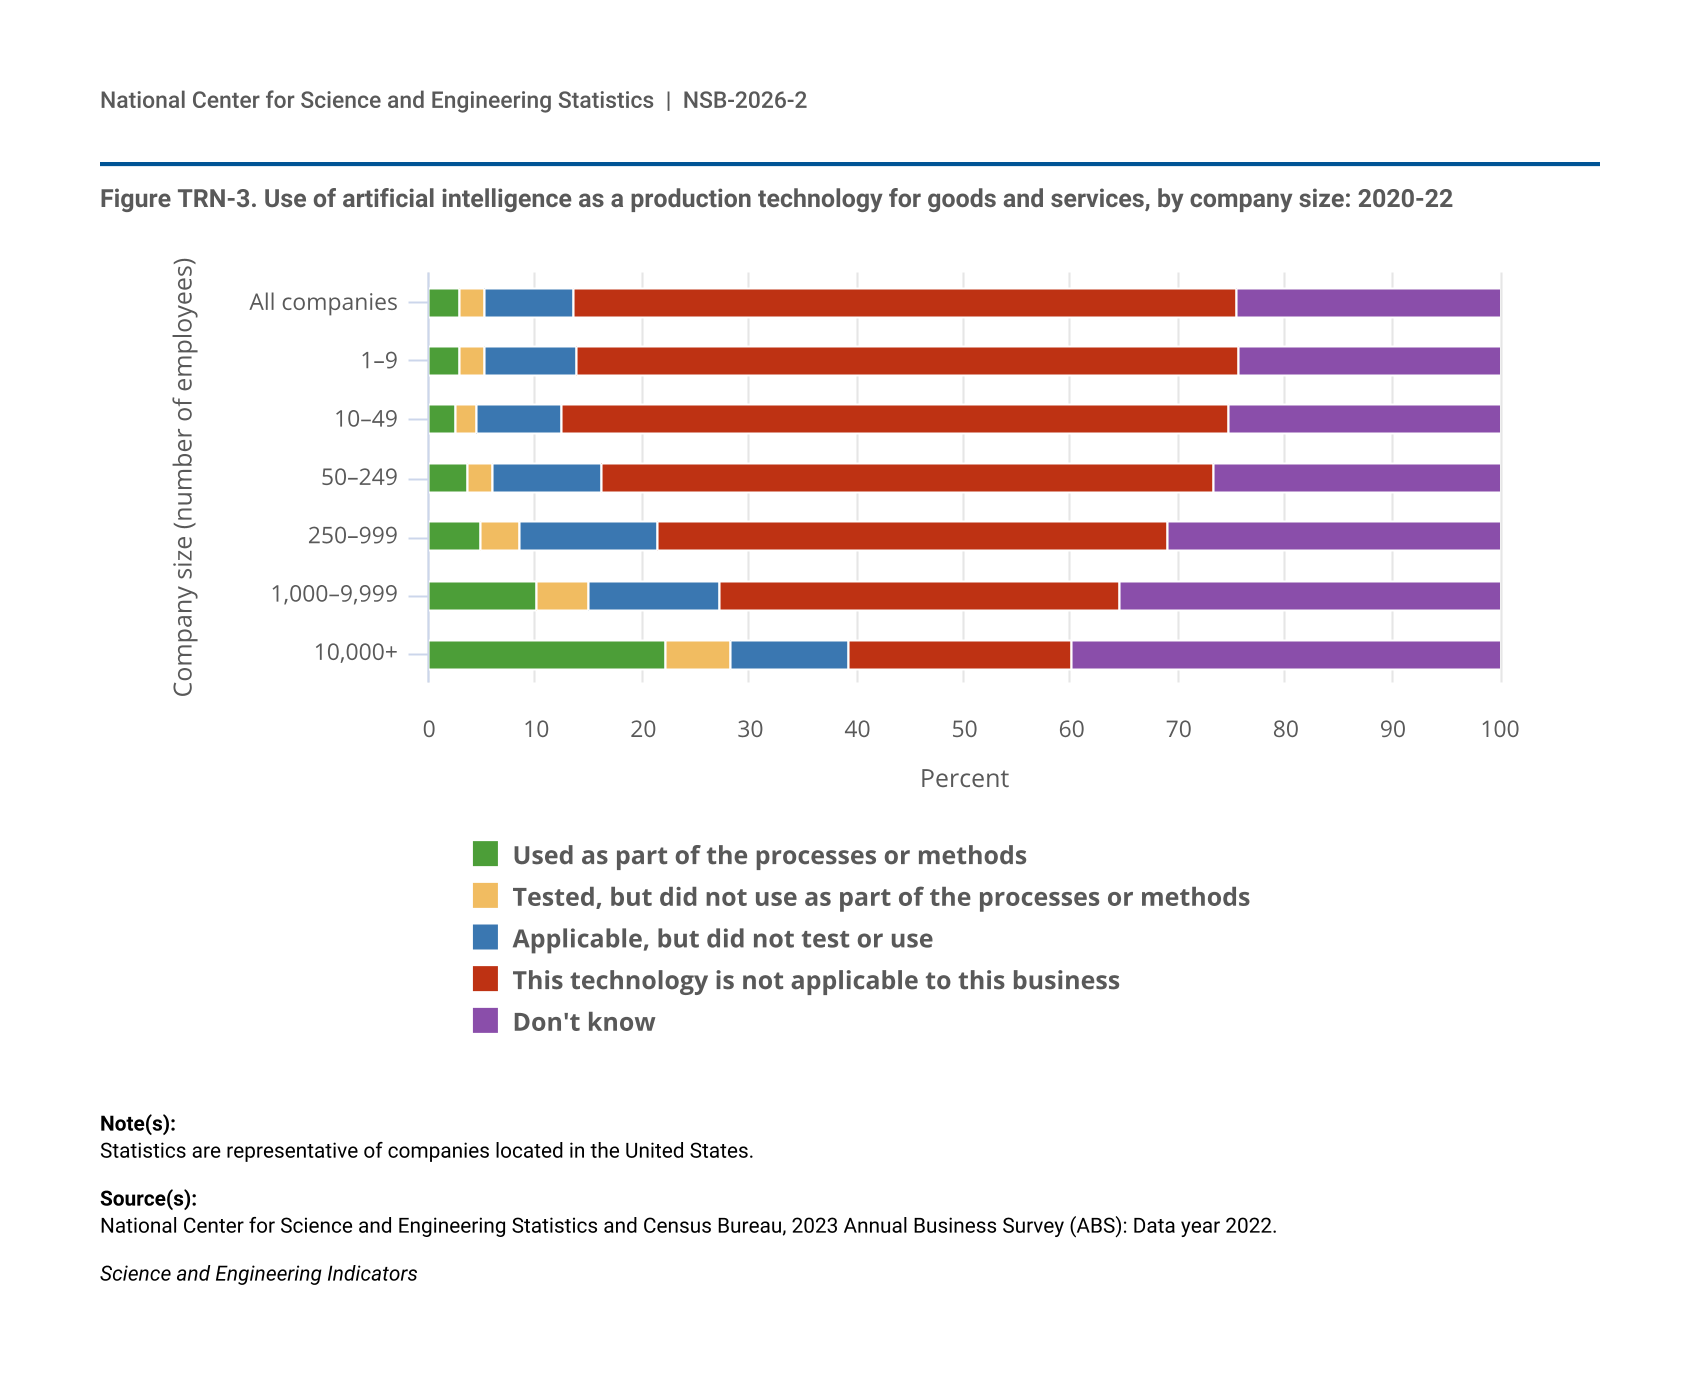
Business survey data provide insight into the extent of AI’s use within specific industries. According to the 2023 Annual Business Survey (ABS), 2.9% of companies reported using AI as a production technology for goods and services between 2020 and 2022. During the same period, 1 in 5 firms (20.1%) in the software industry reported using the technology (Figure TRN-2). For firms with more than 10,000 employees, 22.2% of firms reported using AI between 2020 and 2022, while for microbusinesses (1–9 employees) and small businesses (10–49 employees), 2.9% and 2.5% reported utilizing the technology, respectively (Figure TRN-3).
| Industry and NAICS code | Used as part of the processes or methods | Tested, but did not use as part of the processes or methods | Applicable, but did not test or use | This technology is not applicable to this business | Don't know |
|---|---|---|---|---|---|
| All industries, 11, 21–23, 31–33, 42–81 | 2.9 | 2.3 | 8.5 | 61.7 | 24.6 |
| Manufacturing industries, 31–33 | 1.9 | 1.5 | 8.3 | 65.2 | 23.1 |
| Pharmaceuticals and medicines, 3254 | 3.1 | 2.4 | 13.0 | 51.6 | 29.9 |
| Navigational, measuring, electromedical, and control instruments, 3345 | 5.7 | 3.9 | 12.5 | 54.6 | 23.3 |
| Nonmanufacturing industries, 11, 21–23, 42–81 | 2.9 | 2.3 | 8.5 | 61.6 | 24.6 |
| Software publishers, 5112 | 20.1 | 13.2 | 22.0 | 23.2 | 21.5 |
| Data processing, hosting, and related services, 518 | 15.9 | 9.4 | 20.0 | 33.7 | 20.9 |
| Computer systems design and related services, 5415 | 14.9 | 11.6 | 20.8 | 32.9 | 19.8 |
NAICS = 2017 North American Industry Classification System.
Industry classification is based on dominant establishment payroll. Statistics are representative of companies located in the United States.
National Center for Science and Engineering Statistics and Census Bureau, 2023 Annual Business Survey (ABS): Data year 2022.
Science and Engineering Indicators
| Company size (number of employees) | Used as part of the processes or methods | Tested, but did not use as part of the processes or methods | Applicable, but did not test or use | This technology is not applicable to this business | Don't know |
|---|---|---|---|---|---|
| All companies | 2.9 | 2.3 | 8.5 | 61.7 | 24.6 |
| 1–9 | 2.9 | 2.4 | 8.5 | 61.9 | 24.2 |
| 10–49 | 2.5 | 1.9 | 8.0 | 62.3 | 25.3 |
| 50–249 | 3.6 | 2.5 | 10.0 | 57.2 | 26.7 |
| 250–999 | 4.9 | 3.7 | 12.8 | 47.5 | 30.9 |
| 1,000–9,999 | 10.0 | 5.0 | 12.1 | 37.3 | 35.4 |
| 10,000+ | 22.2 | 6.0 | 11.1 | 20.8 | 39.9 |
Statistics are representative of companies located in the United States.
National Center for Science and Engineering Statistics and Census Bureau, 2023 Annual Business Survey (ABS): Data year 2022.
Science and Engineering Indicators
A summary of the indicators used in this report and their sources is found in Table TRN-1; see also the sidebar Measuring Short- and Long-Term Impacts of S&E Activity.
BLS = Bureau of Labor Statistics; EPO = European Patent Office; NCSES = National Center for Science and Engineering Statistics; SBIR = Small Business Innovation Research; STTR = Small Business Technology Transfer; USPTO = Patent and Trademark Office.
Science and Engineering Indicators