 An official website of the United States government
 Executive Summary
U.S. STEM Workforce Scale and Composition
The U.S. science, technology, engineering, and mathematics (STEM) workforce in 2023 represented about a quarter of all workers in the domestic economy and demonstrated distinct patterns of educational attainment and industry concentration.
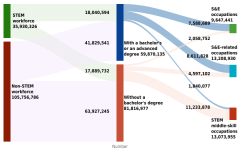
- In 2023, there were 36 million STEM workers in the United States, accounting for 25% of the total workforce.
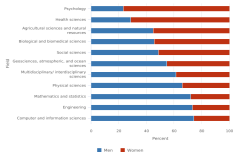
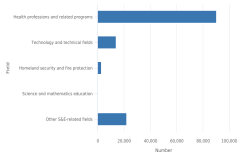
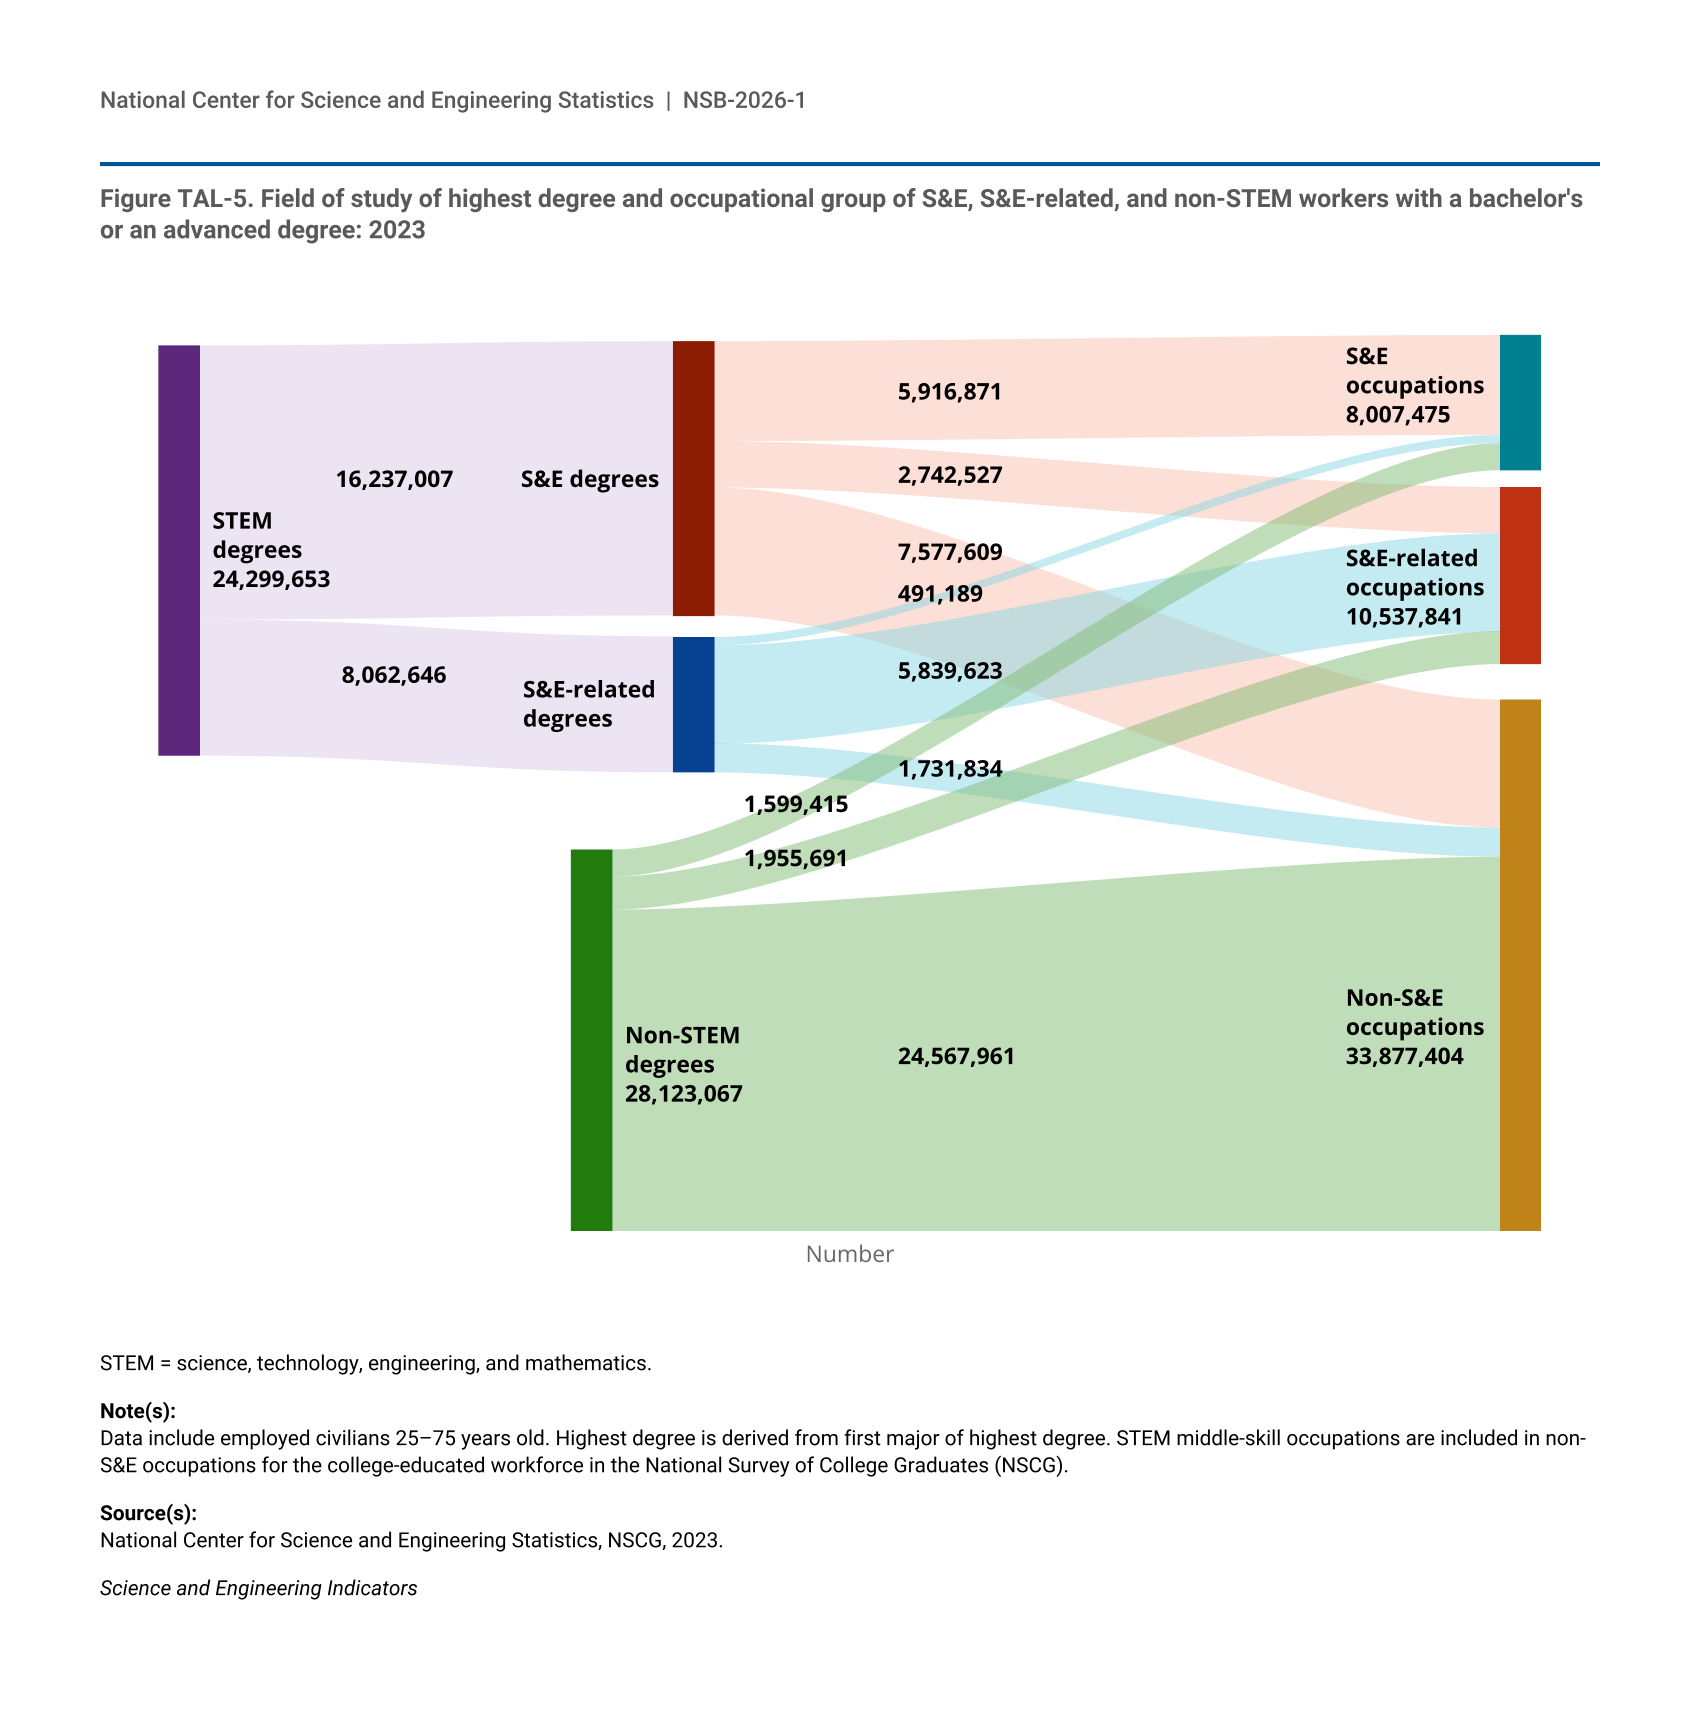
- In 2023, science and engineering (S&E) workers (42%) and S&E-related workers (48%) made up 90% of the STEM workforce with a bachelor’s or an advanced degree; workers in STEM middle-skill occupations made up the other 10%. Among STEM workers without a bachelor’s degree, 63% were employed in STEM middle-skill occupations.
- In 2023, 22% of the U.S. STEM workforce was foreign born. Naturalized U.S. citizens made up 52% of the foreign-born domestic STEM workforce, noncitizens made up 42%, and foreign-born workers who were U.S. citizens by birth (i.e., born abroad to a parent or parents who are U.S. citizens) made up 5%.
- In 2022, over a third (36%, or about 6 million) of the workers in research and development (R&D)-intensive industries were employed in STEM occupations. Under a quarter (24%, or 30 million) of the workers in non–R&D-intensive industries were employed in STEM occupations.
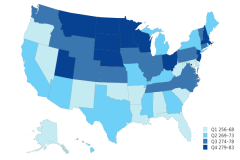
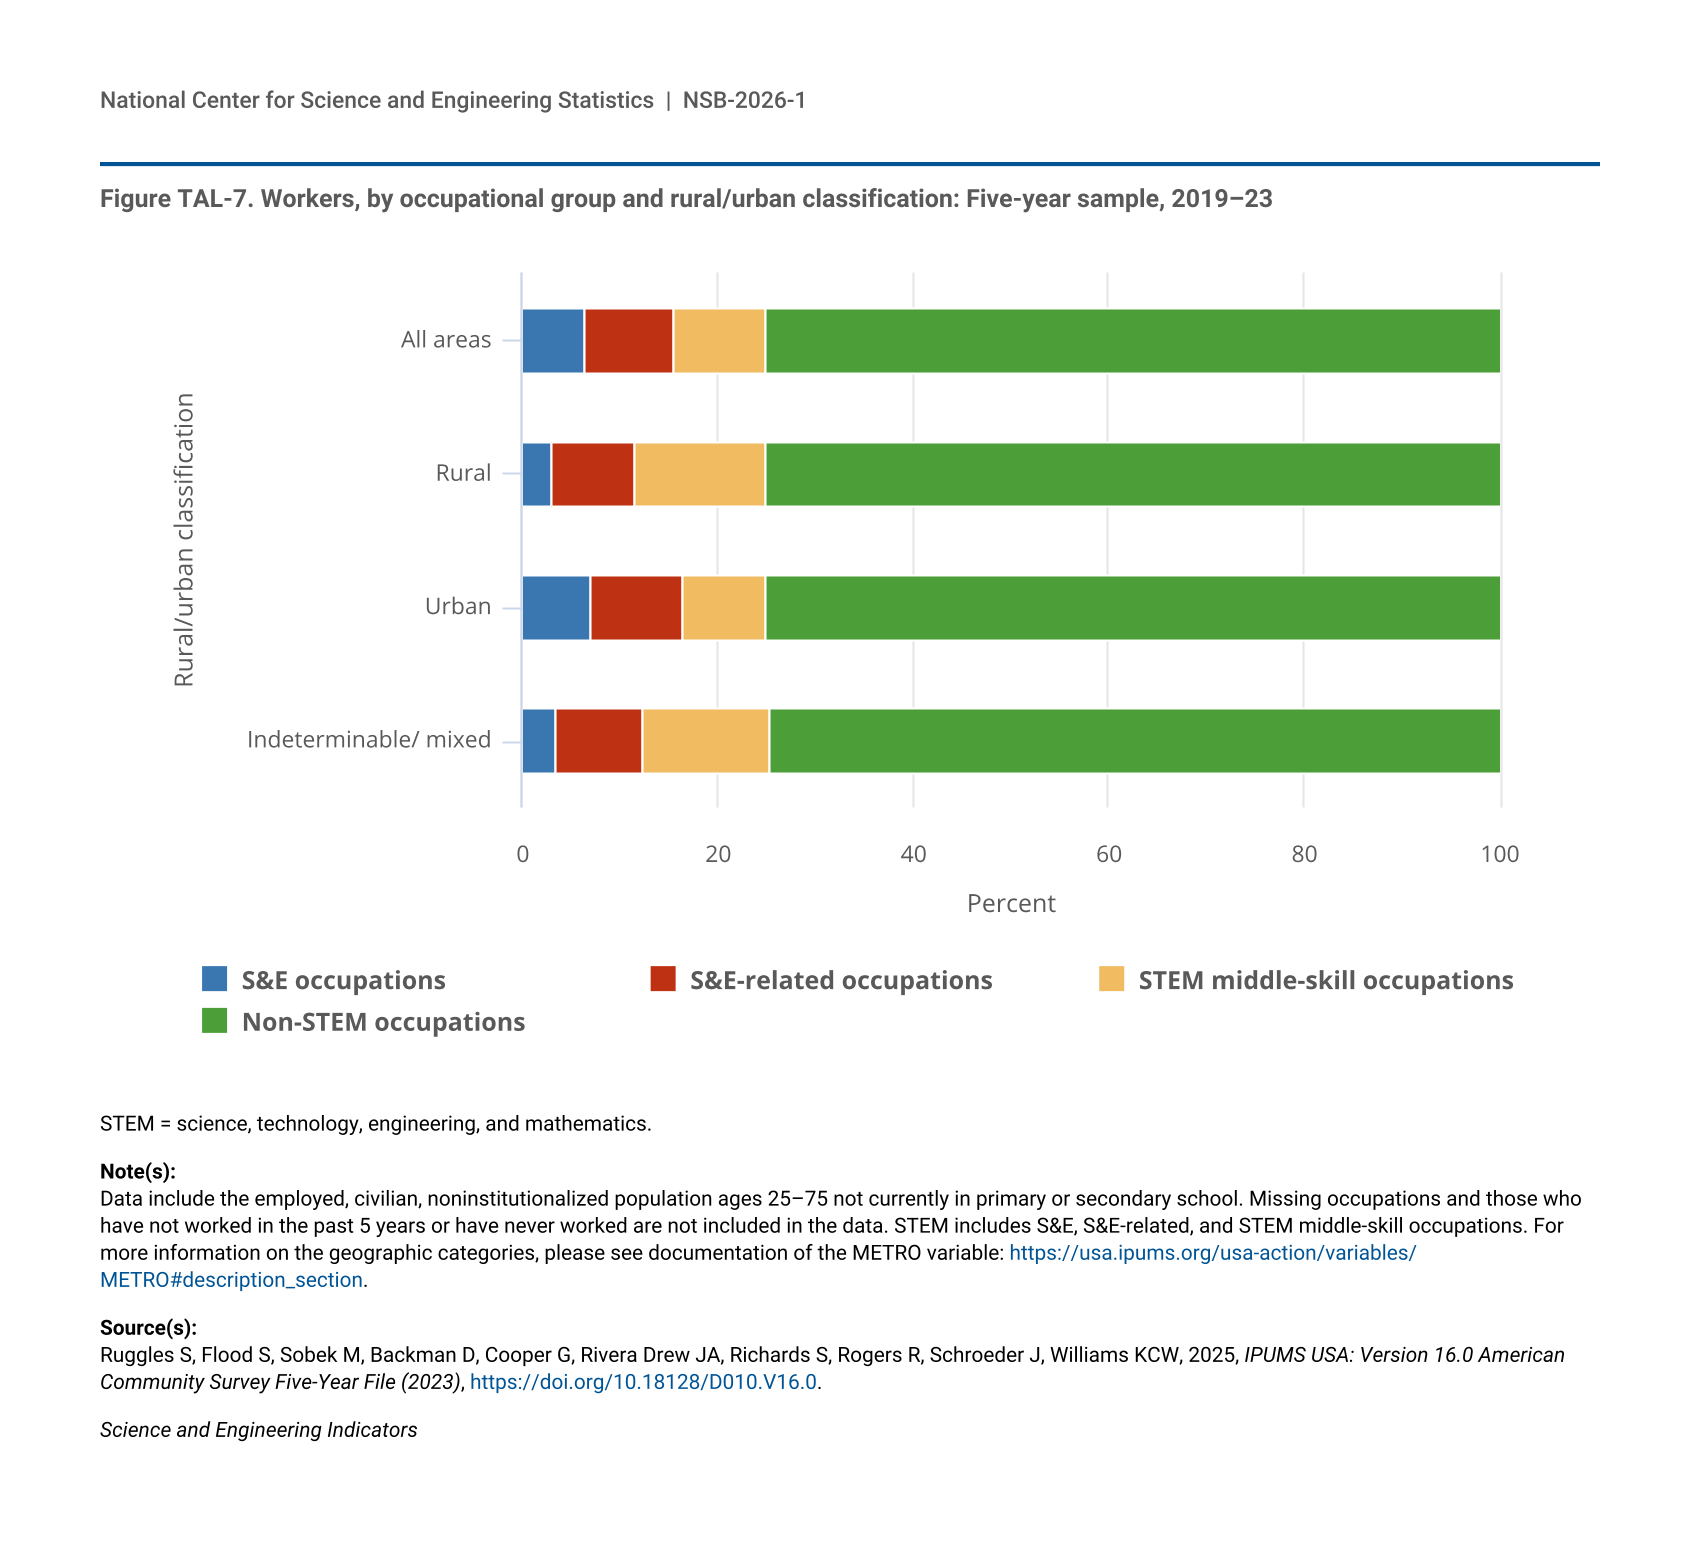
- Based on the American Community Survey 5-Year File, 2023, comparable proportions of workers in rural (25%) and urban (25%) areas were employed in STEM occupations, but the occupational groups varied by geography. The share of workers in STEM middle-skill occupations in rural areas (13%) was higher than the share in urban areas (9%), whereas the share of S&E workers in urban areas (7%) was higher than the share in rural areas (3%).
U.S. STEM Workforce Growth and Economic Impact
Employment in STEM occupations grew at a faster rate than in non-STEM occupations between 2013 and 2023 and provided economic premiums to STEM workers.
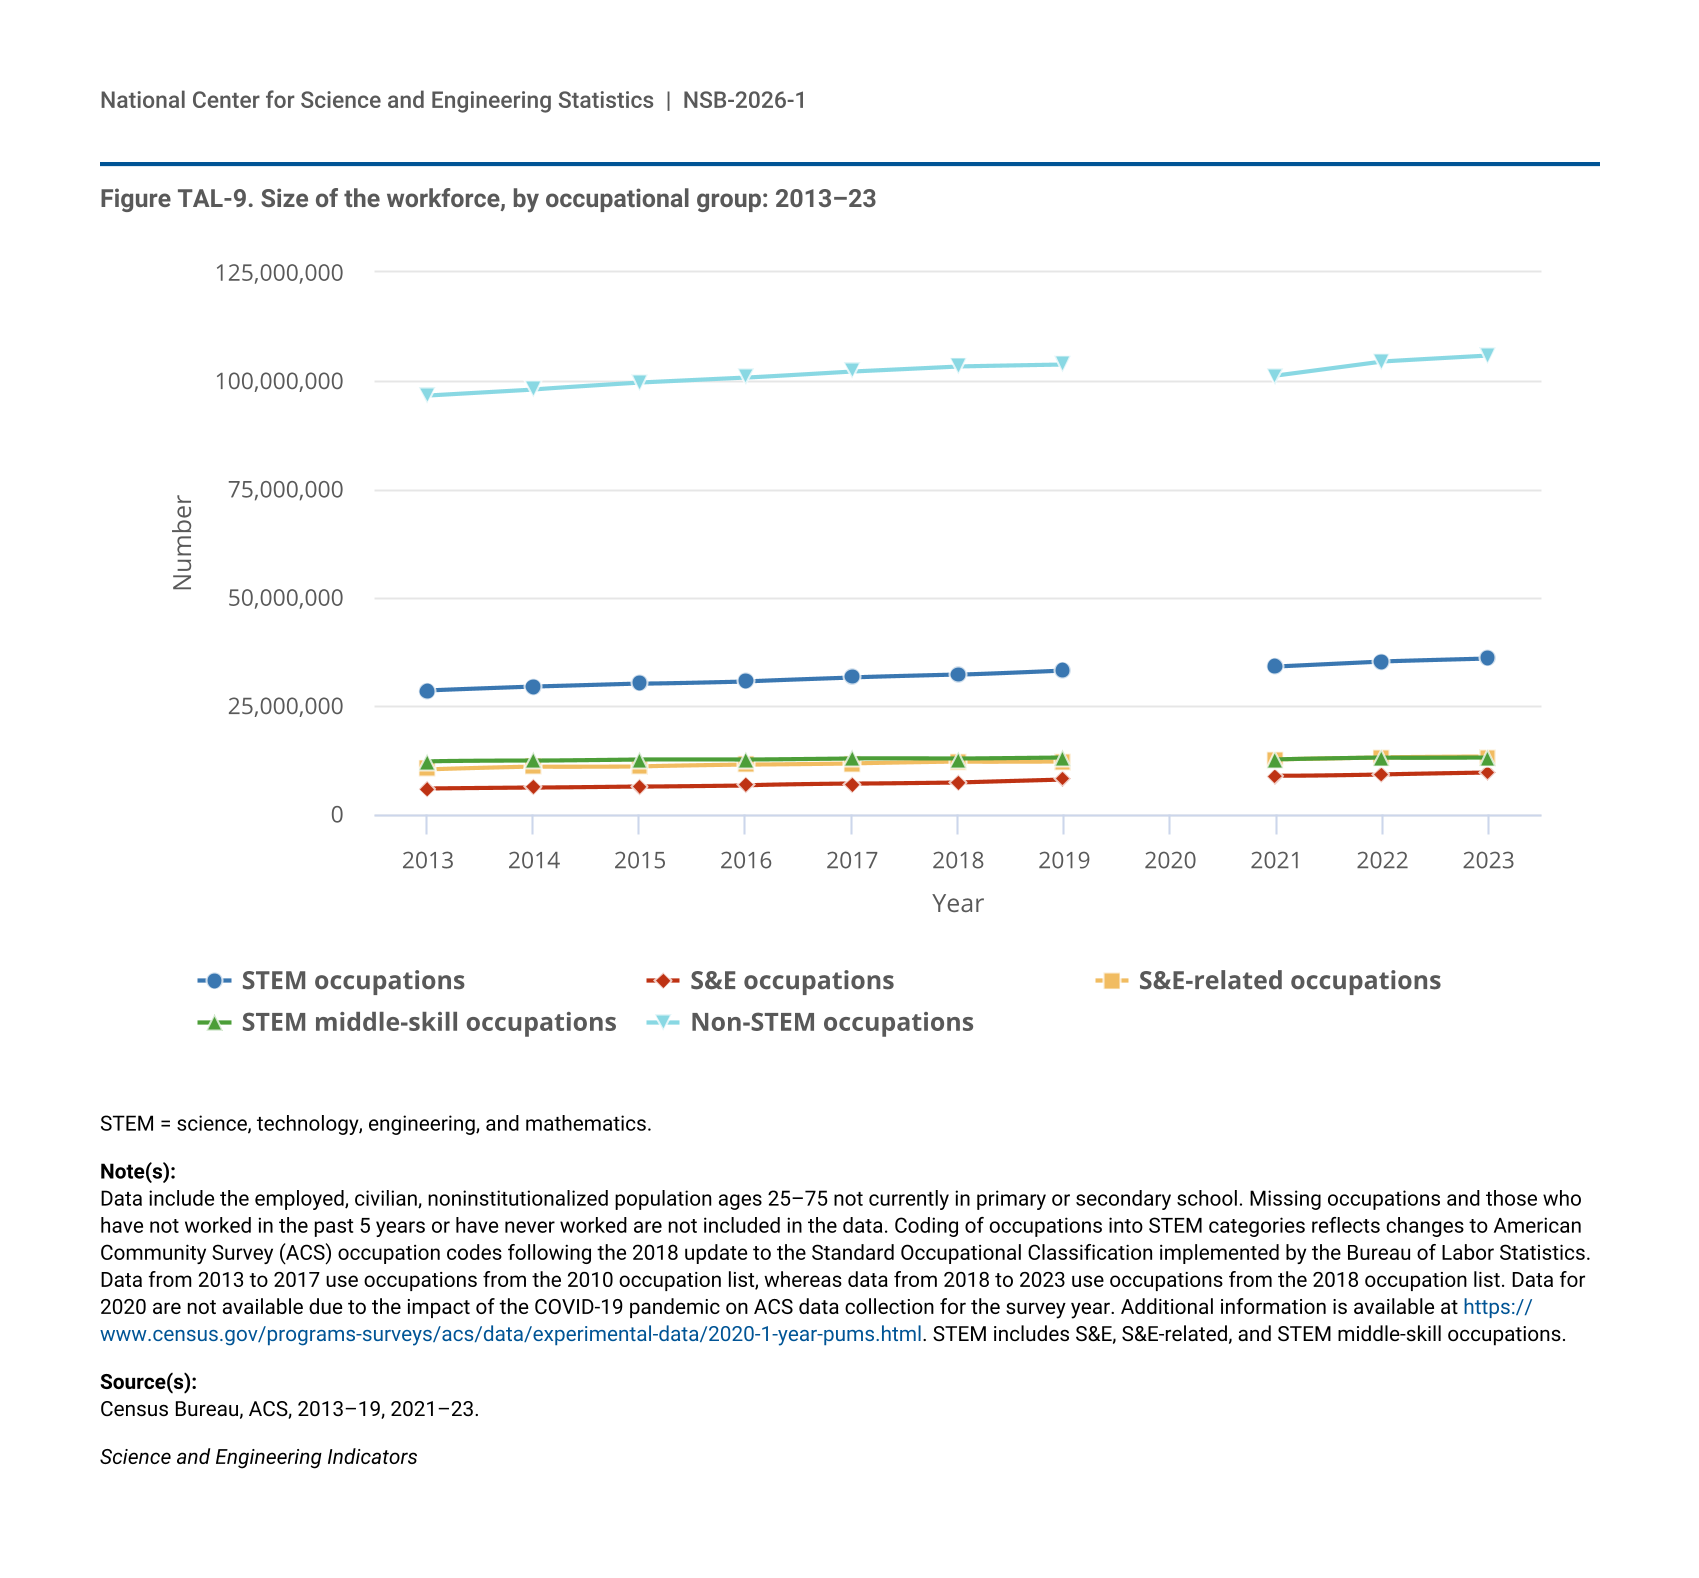
- Between 2013 and 2023, the STEM workforce grew by 26%, faster than the 9% growth in the non-STEM workforce.
- Employment in STEM occupations is projected to grow 6% from 2024 to 2034, faster than the projected 2% growth in employment in non-STEM occupations.
- In 2023, full-time, year-round workers in STEM occupations had higher median earnings ($76,000) than workers in non-STEM occupations ($55,000). Within STEM occupations, S&E workers had the highest overall earnings ($100,000), followed by S&E-related workers ($80,000), then by workers in STEM middle-skill occupations ($58,000).
- In 2023, the two largest countries or economies of origin for foreign-born STEM workers in the United States were Mexico (1.3 million) and India (1.0 million), which combined to represent 31% of all foreign-born STEM workers in the United States. Workers from the top 30 countries or economies of origin made up 79% of the foreign-born STEM workers in the United States.
K–12 STEM Education Performance and Challenges
Recent assessments reveal concerning trends in U.S. K–12 STEM education, with incomplete recovery from pandemic-related learning losses and declining international competitiveness, particularly in mathematics. In mathematics assessments, students taught by experienced, credentialed teachers outperformed students taught by less-experienced teachers.
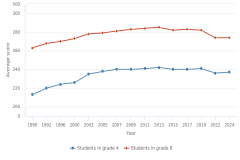
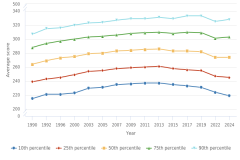
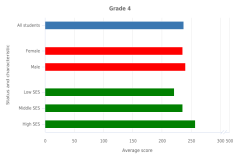
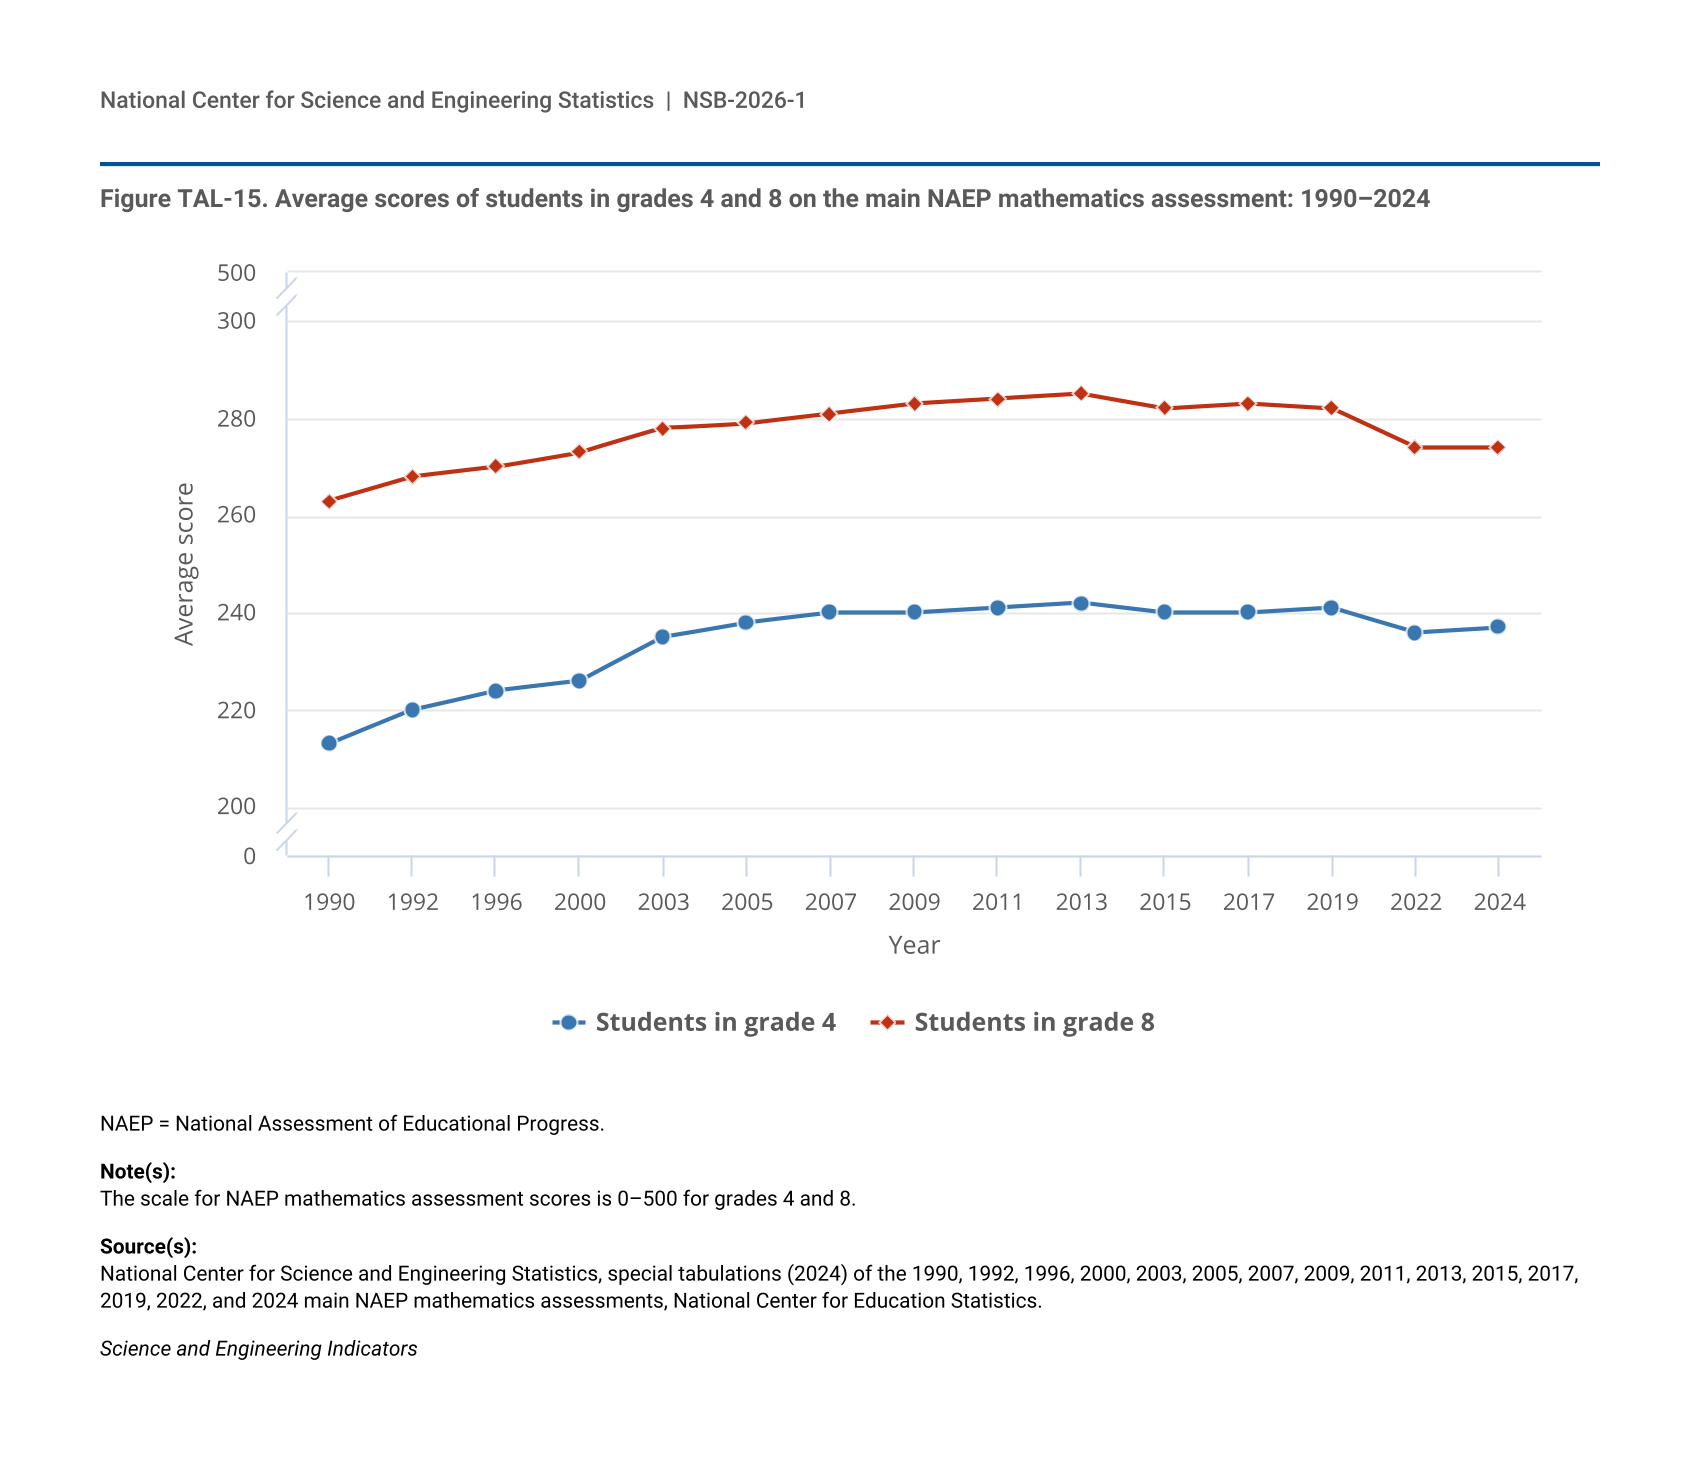
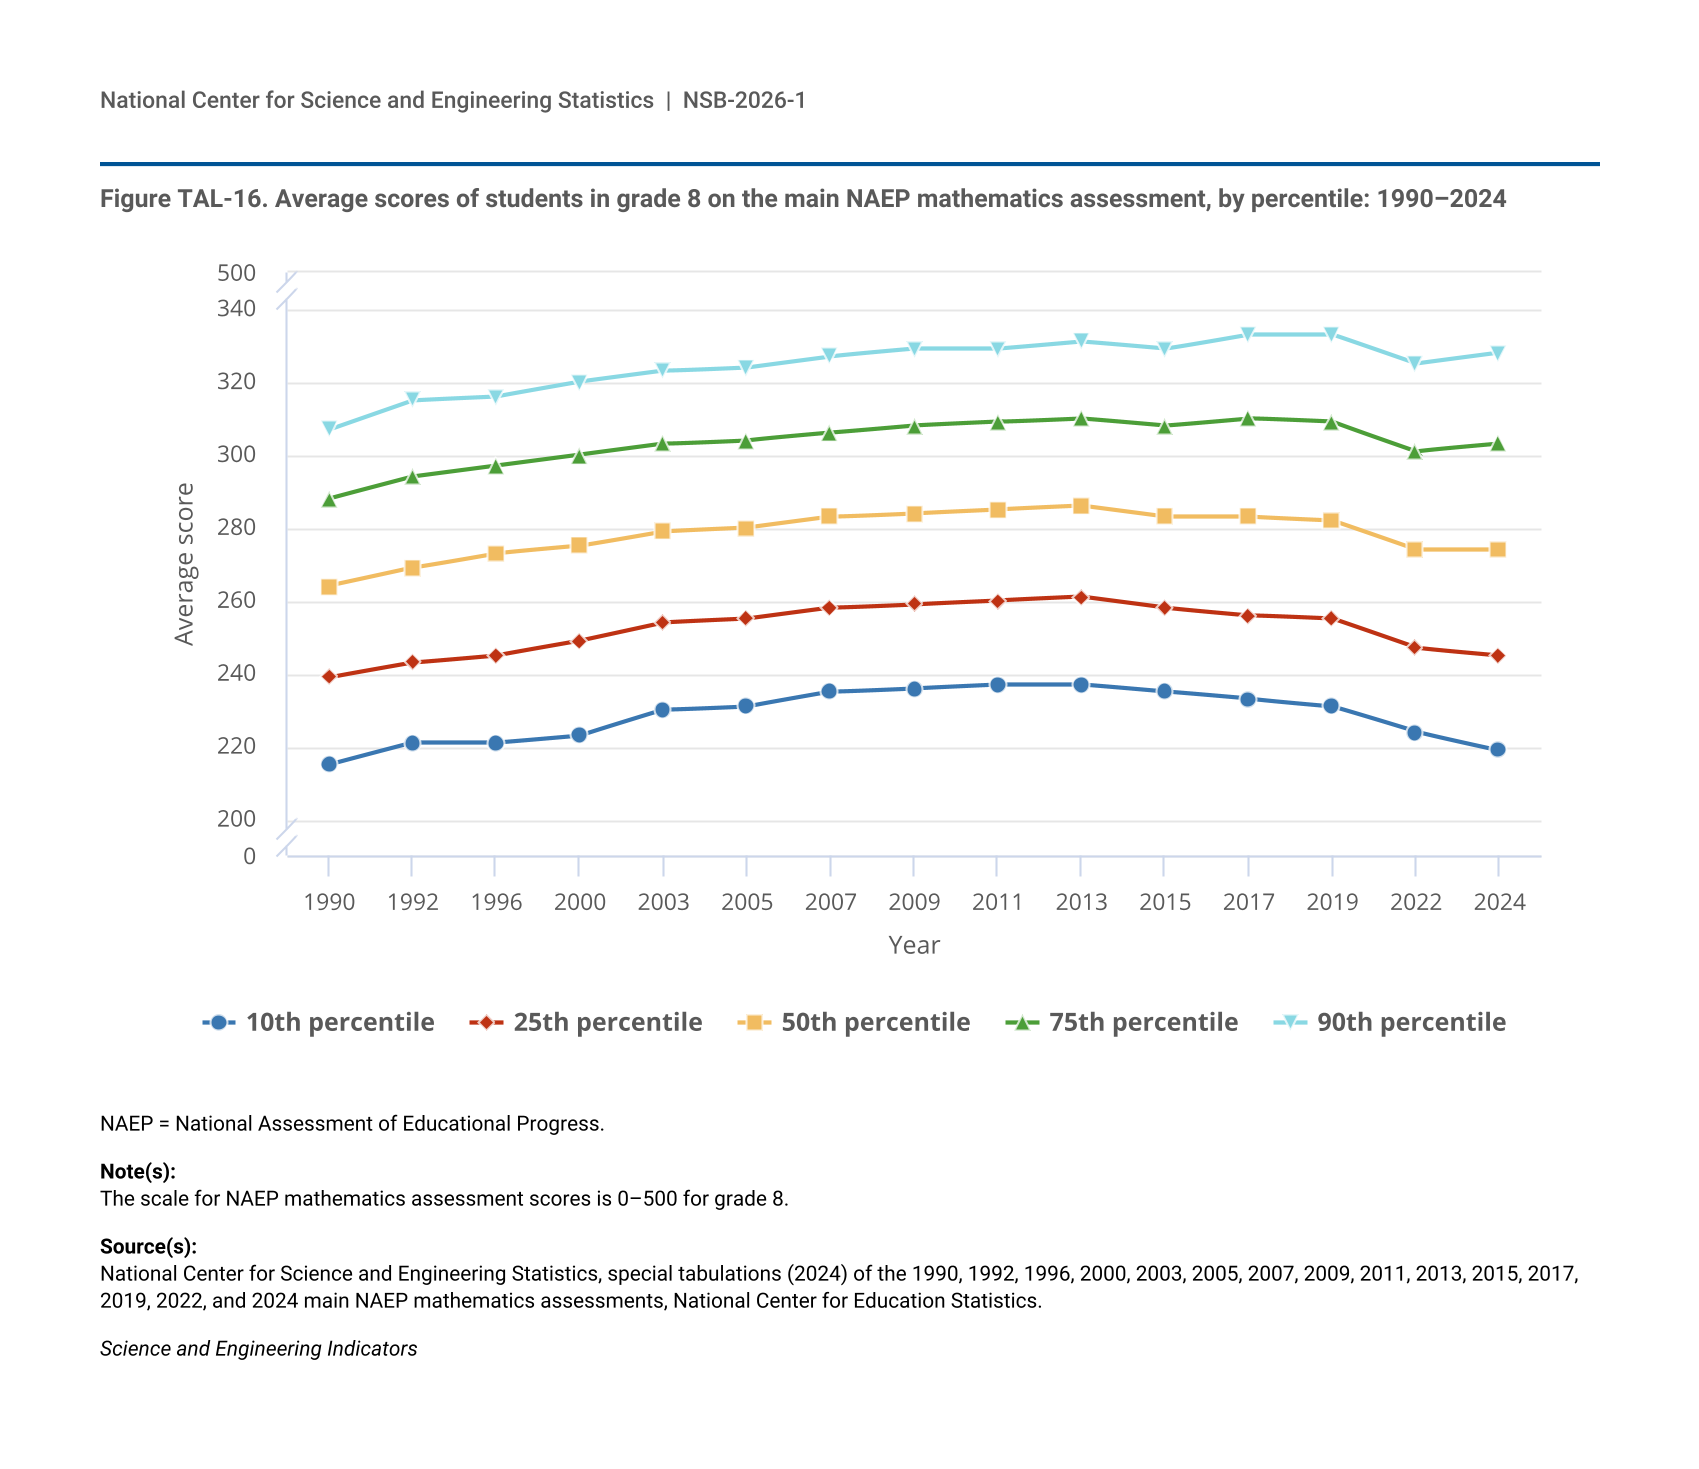
- A 2024 national assessment of fourth and eighth graders’ mathematics performance shows some post–COVID-19 pandemic learning recovery since 2022 for higher-performing students but no recovery for lower-performing students. Other than for fourth-grade students scoring at the 75th and 90th percentiles, student scores have not returned to pre-pandemic levels.
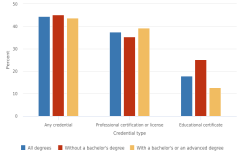
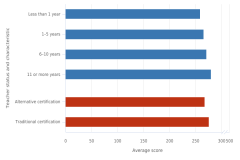
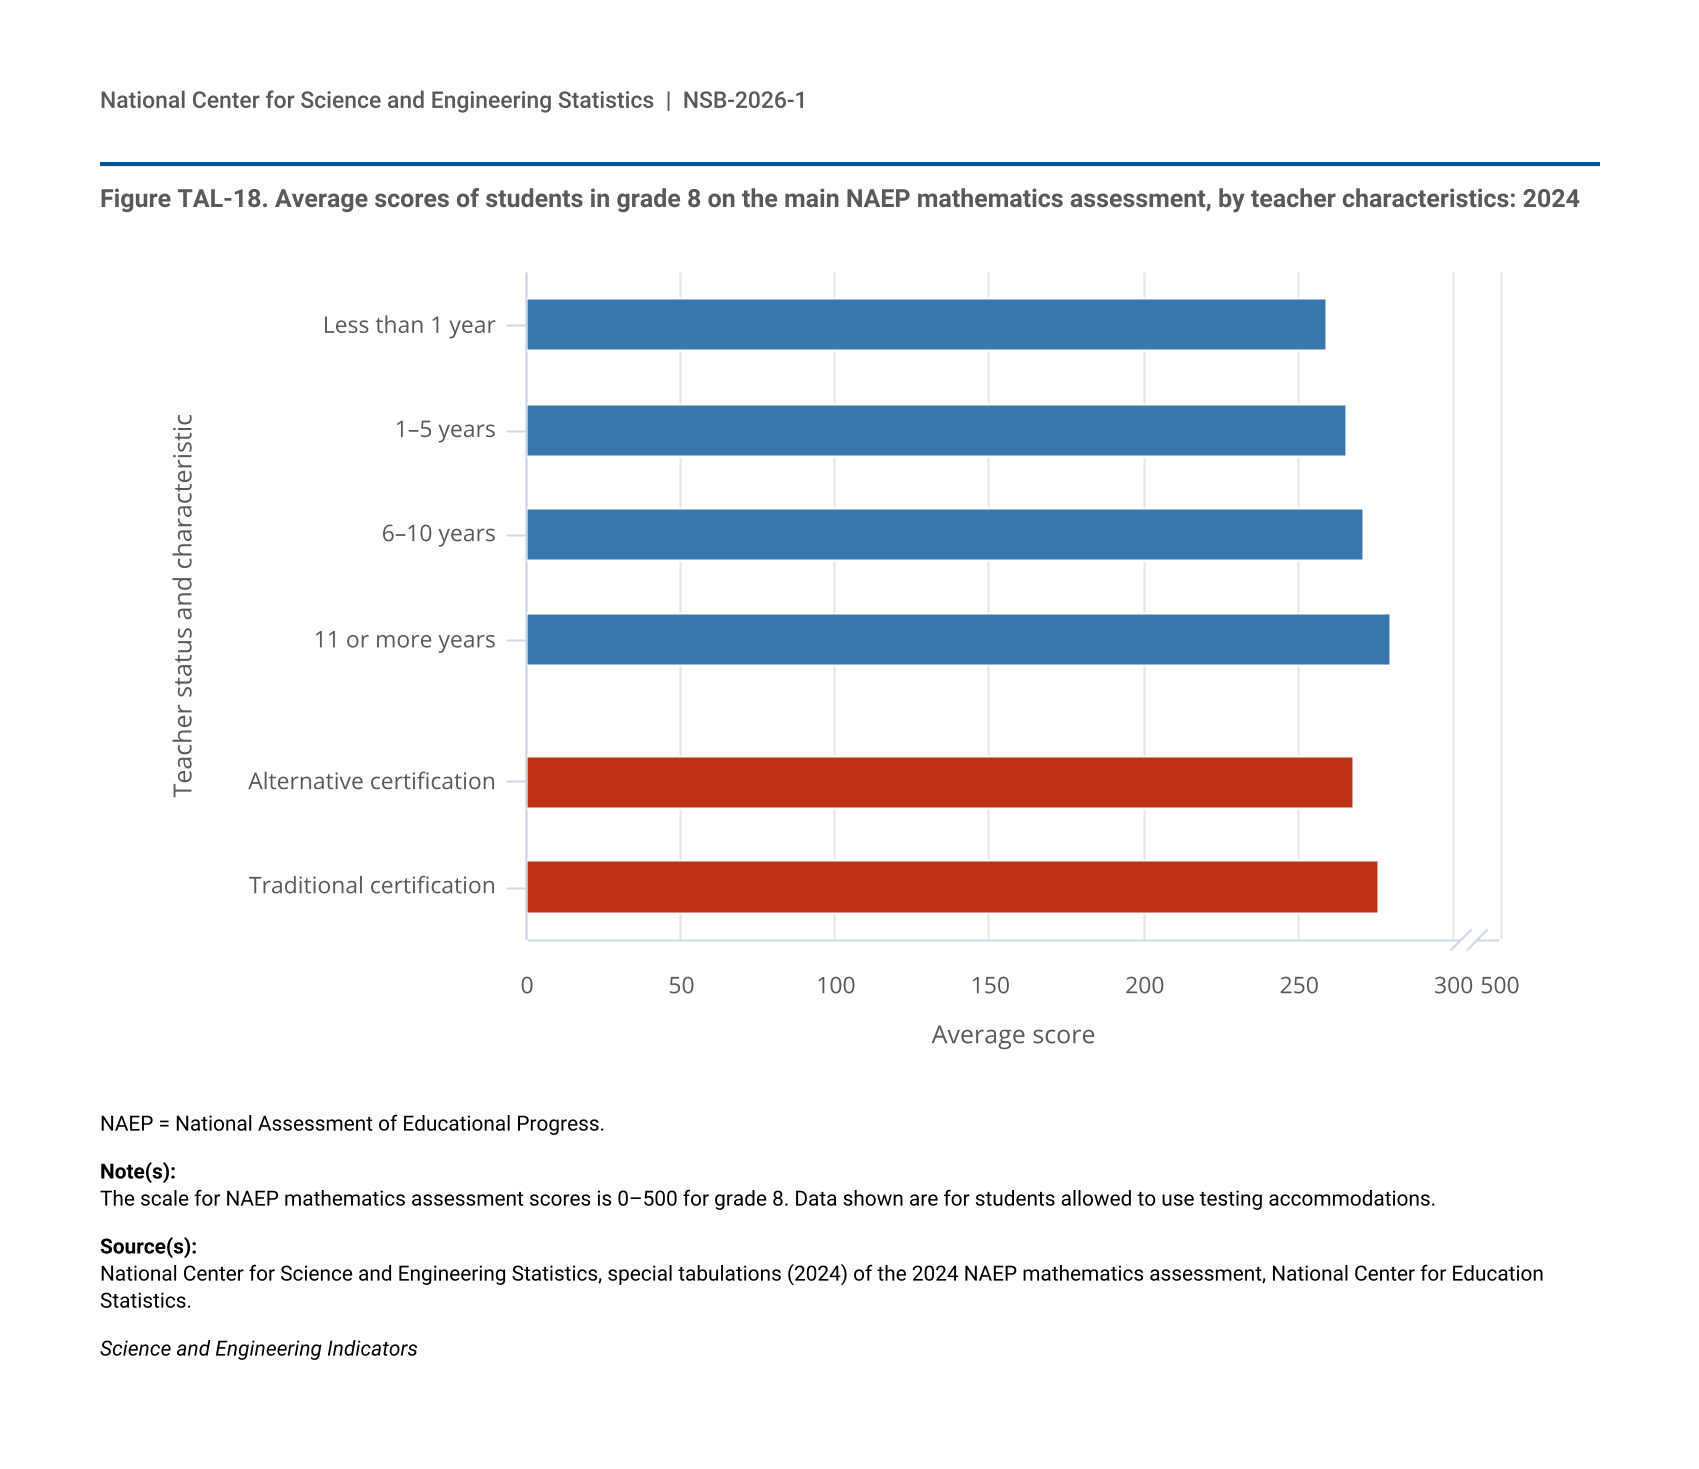
- The national mathematics assessment in 2024 shows that students taught by teachers with 6 or more years of experience scored higher than students taught by less-experienced teachers, as did students taught by teachers with traditional certifications rather than teachers with alternative certifications.
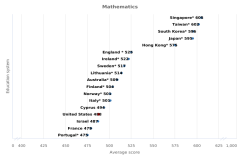
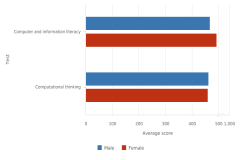
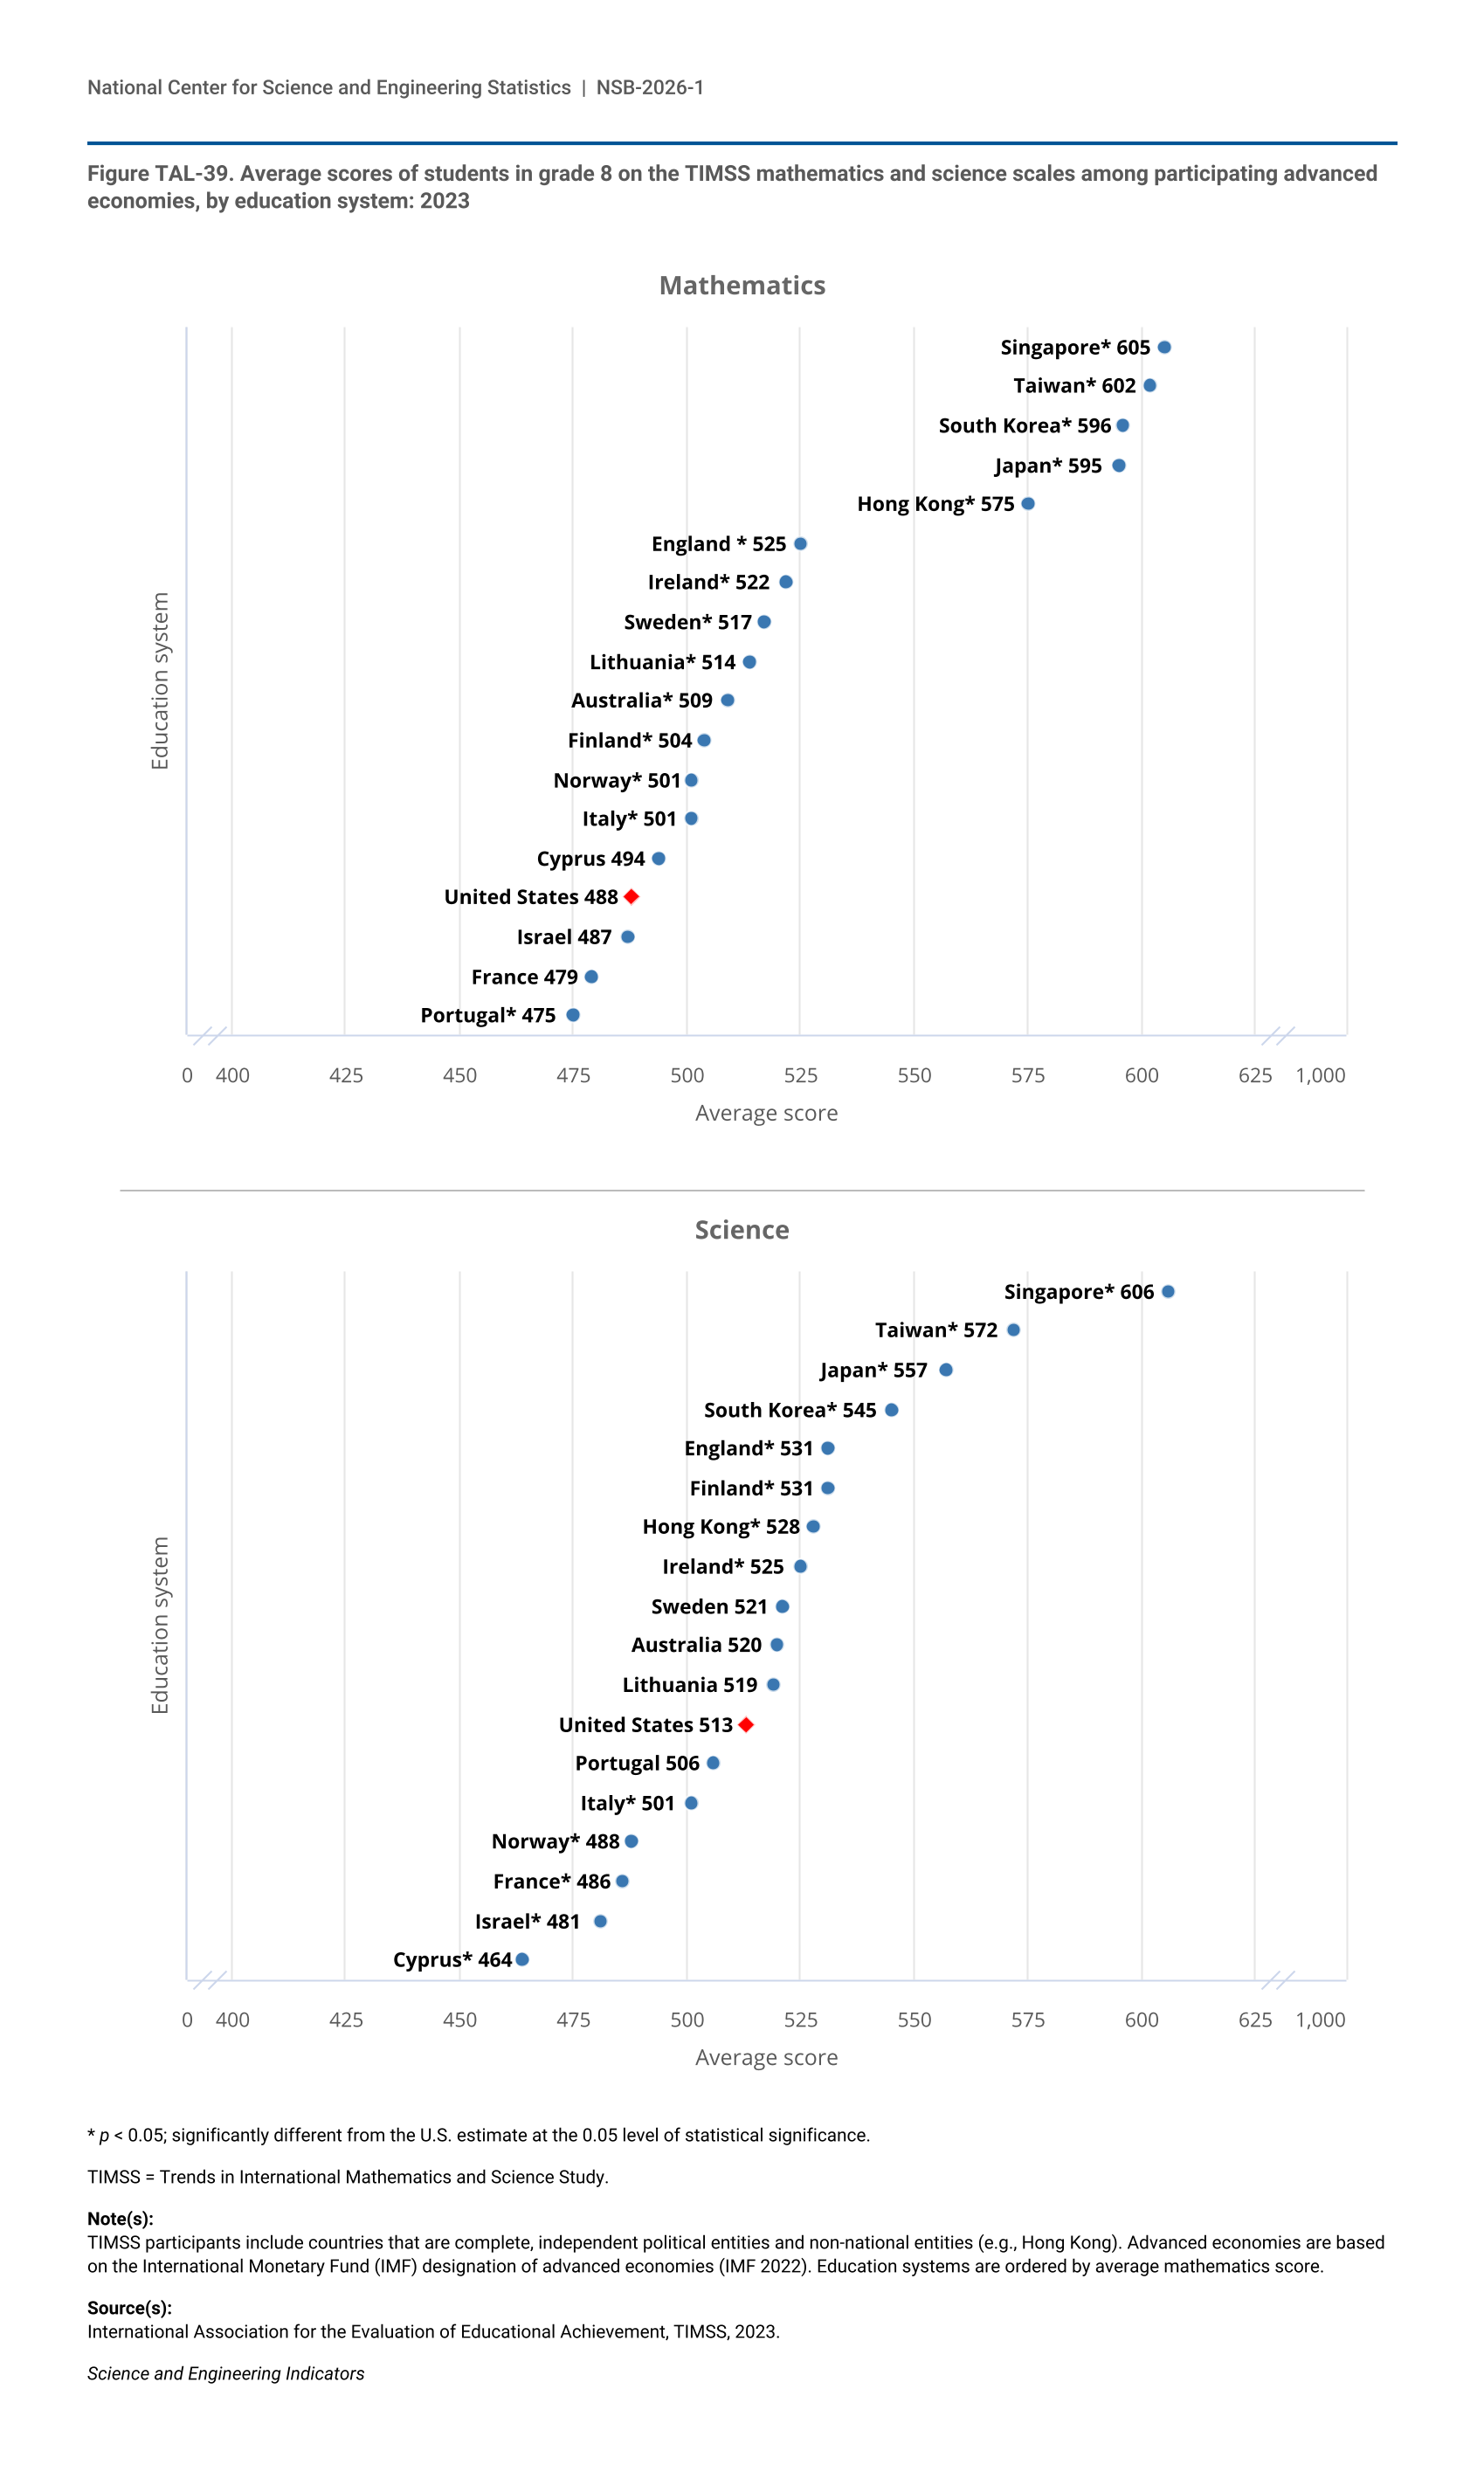
- Eighth graders from 18 advanced economies participated in an international assessment in 2023. U.S. students scored in the middle of the group in science and in the bottom third in mathematics.
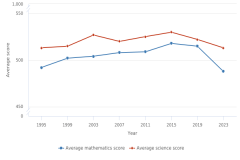
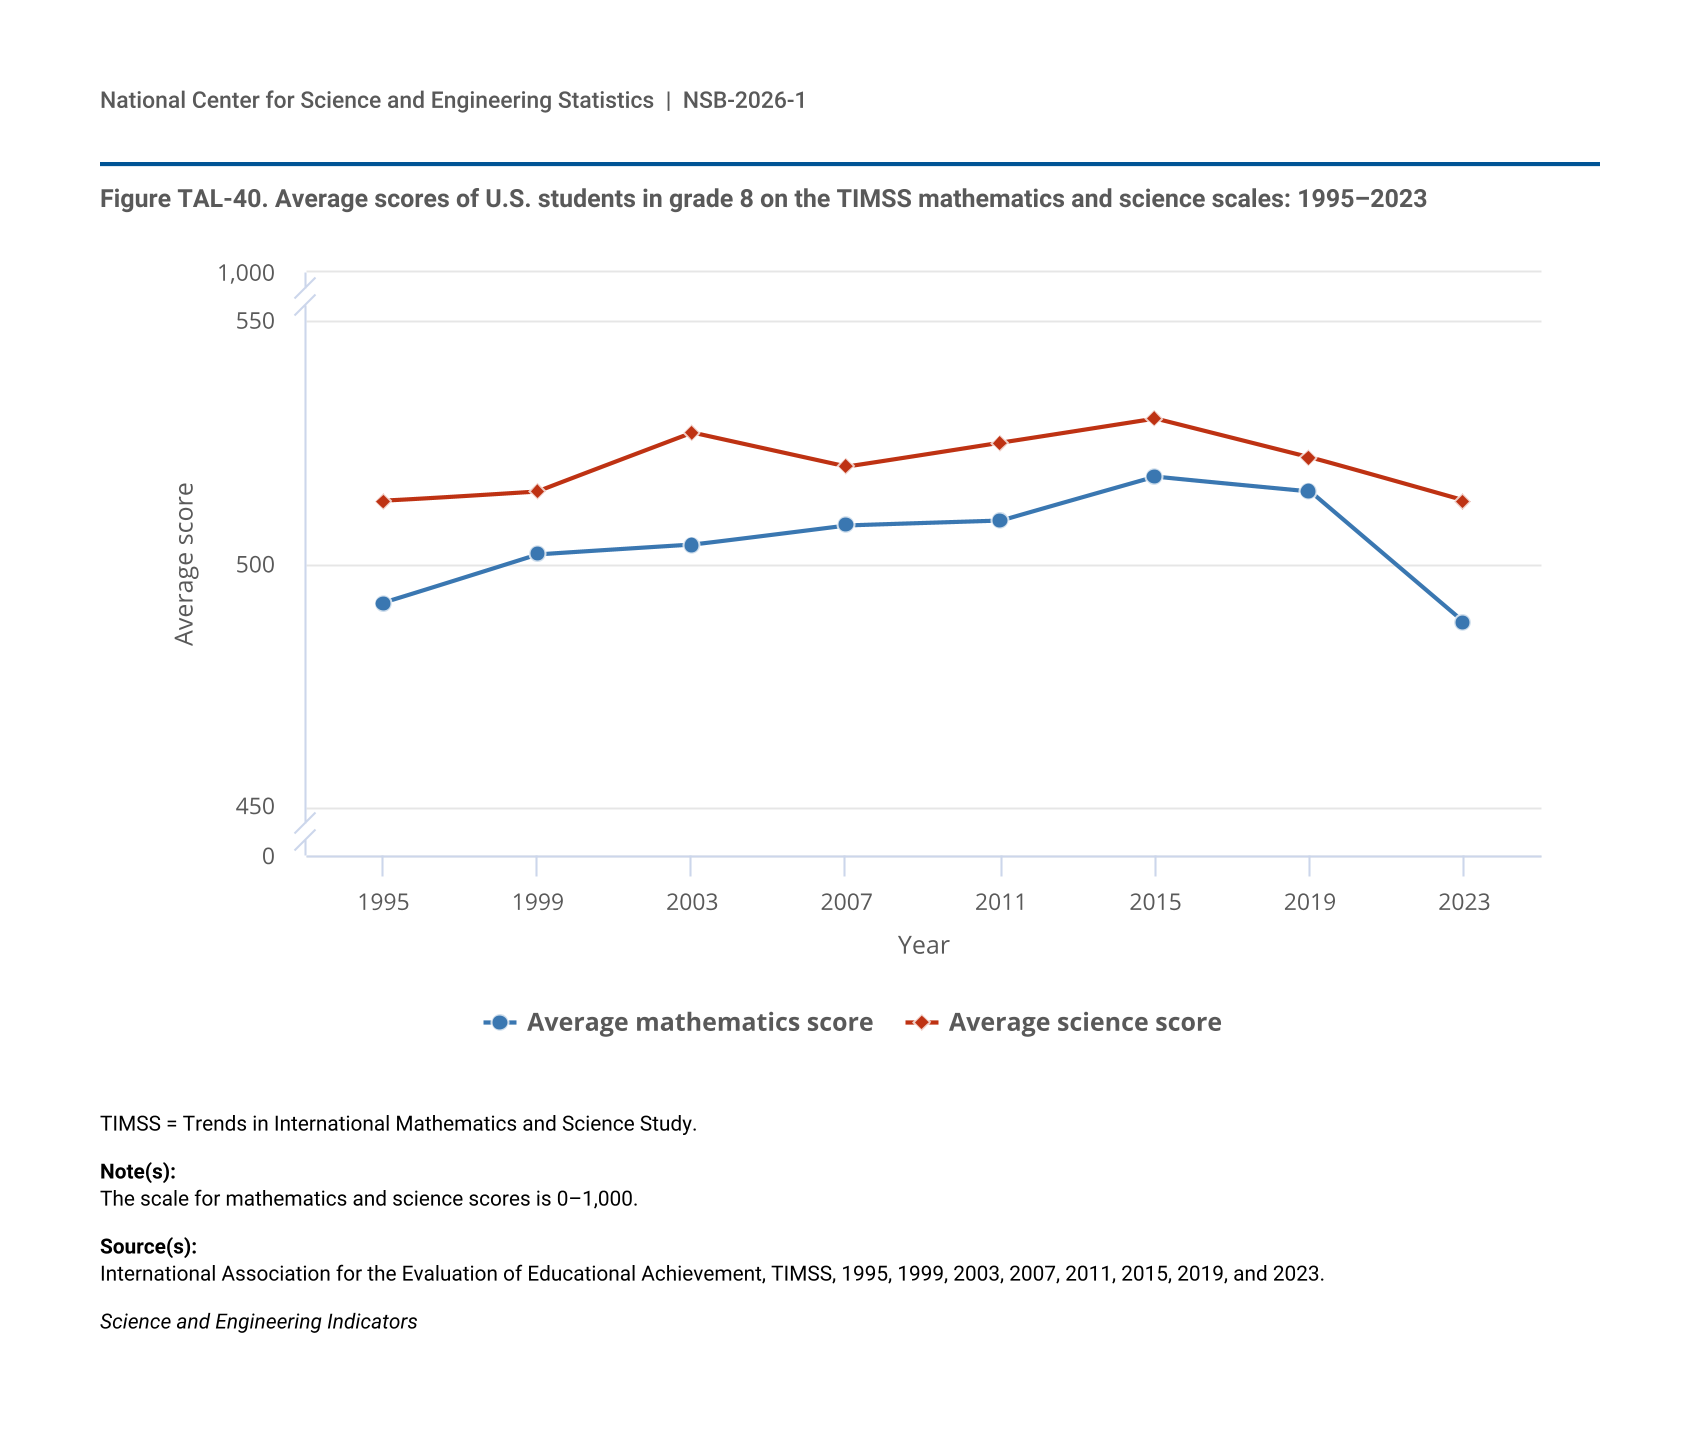
- Average mathematics scores for U.S. eighth-grade students who participated in international assessments decreased by 27 points, from 515 of 1,000 possible points in a pre-pandemic 2019 assessment to 488 points in a 2023 assessment.
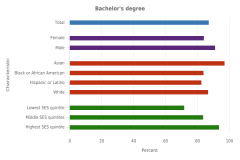
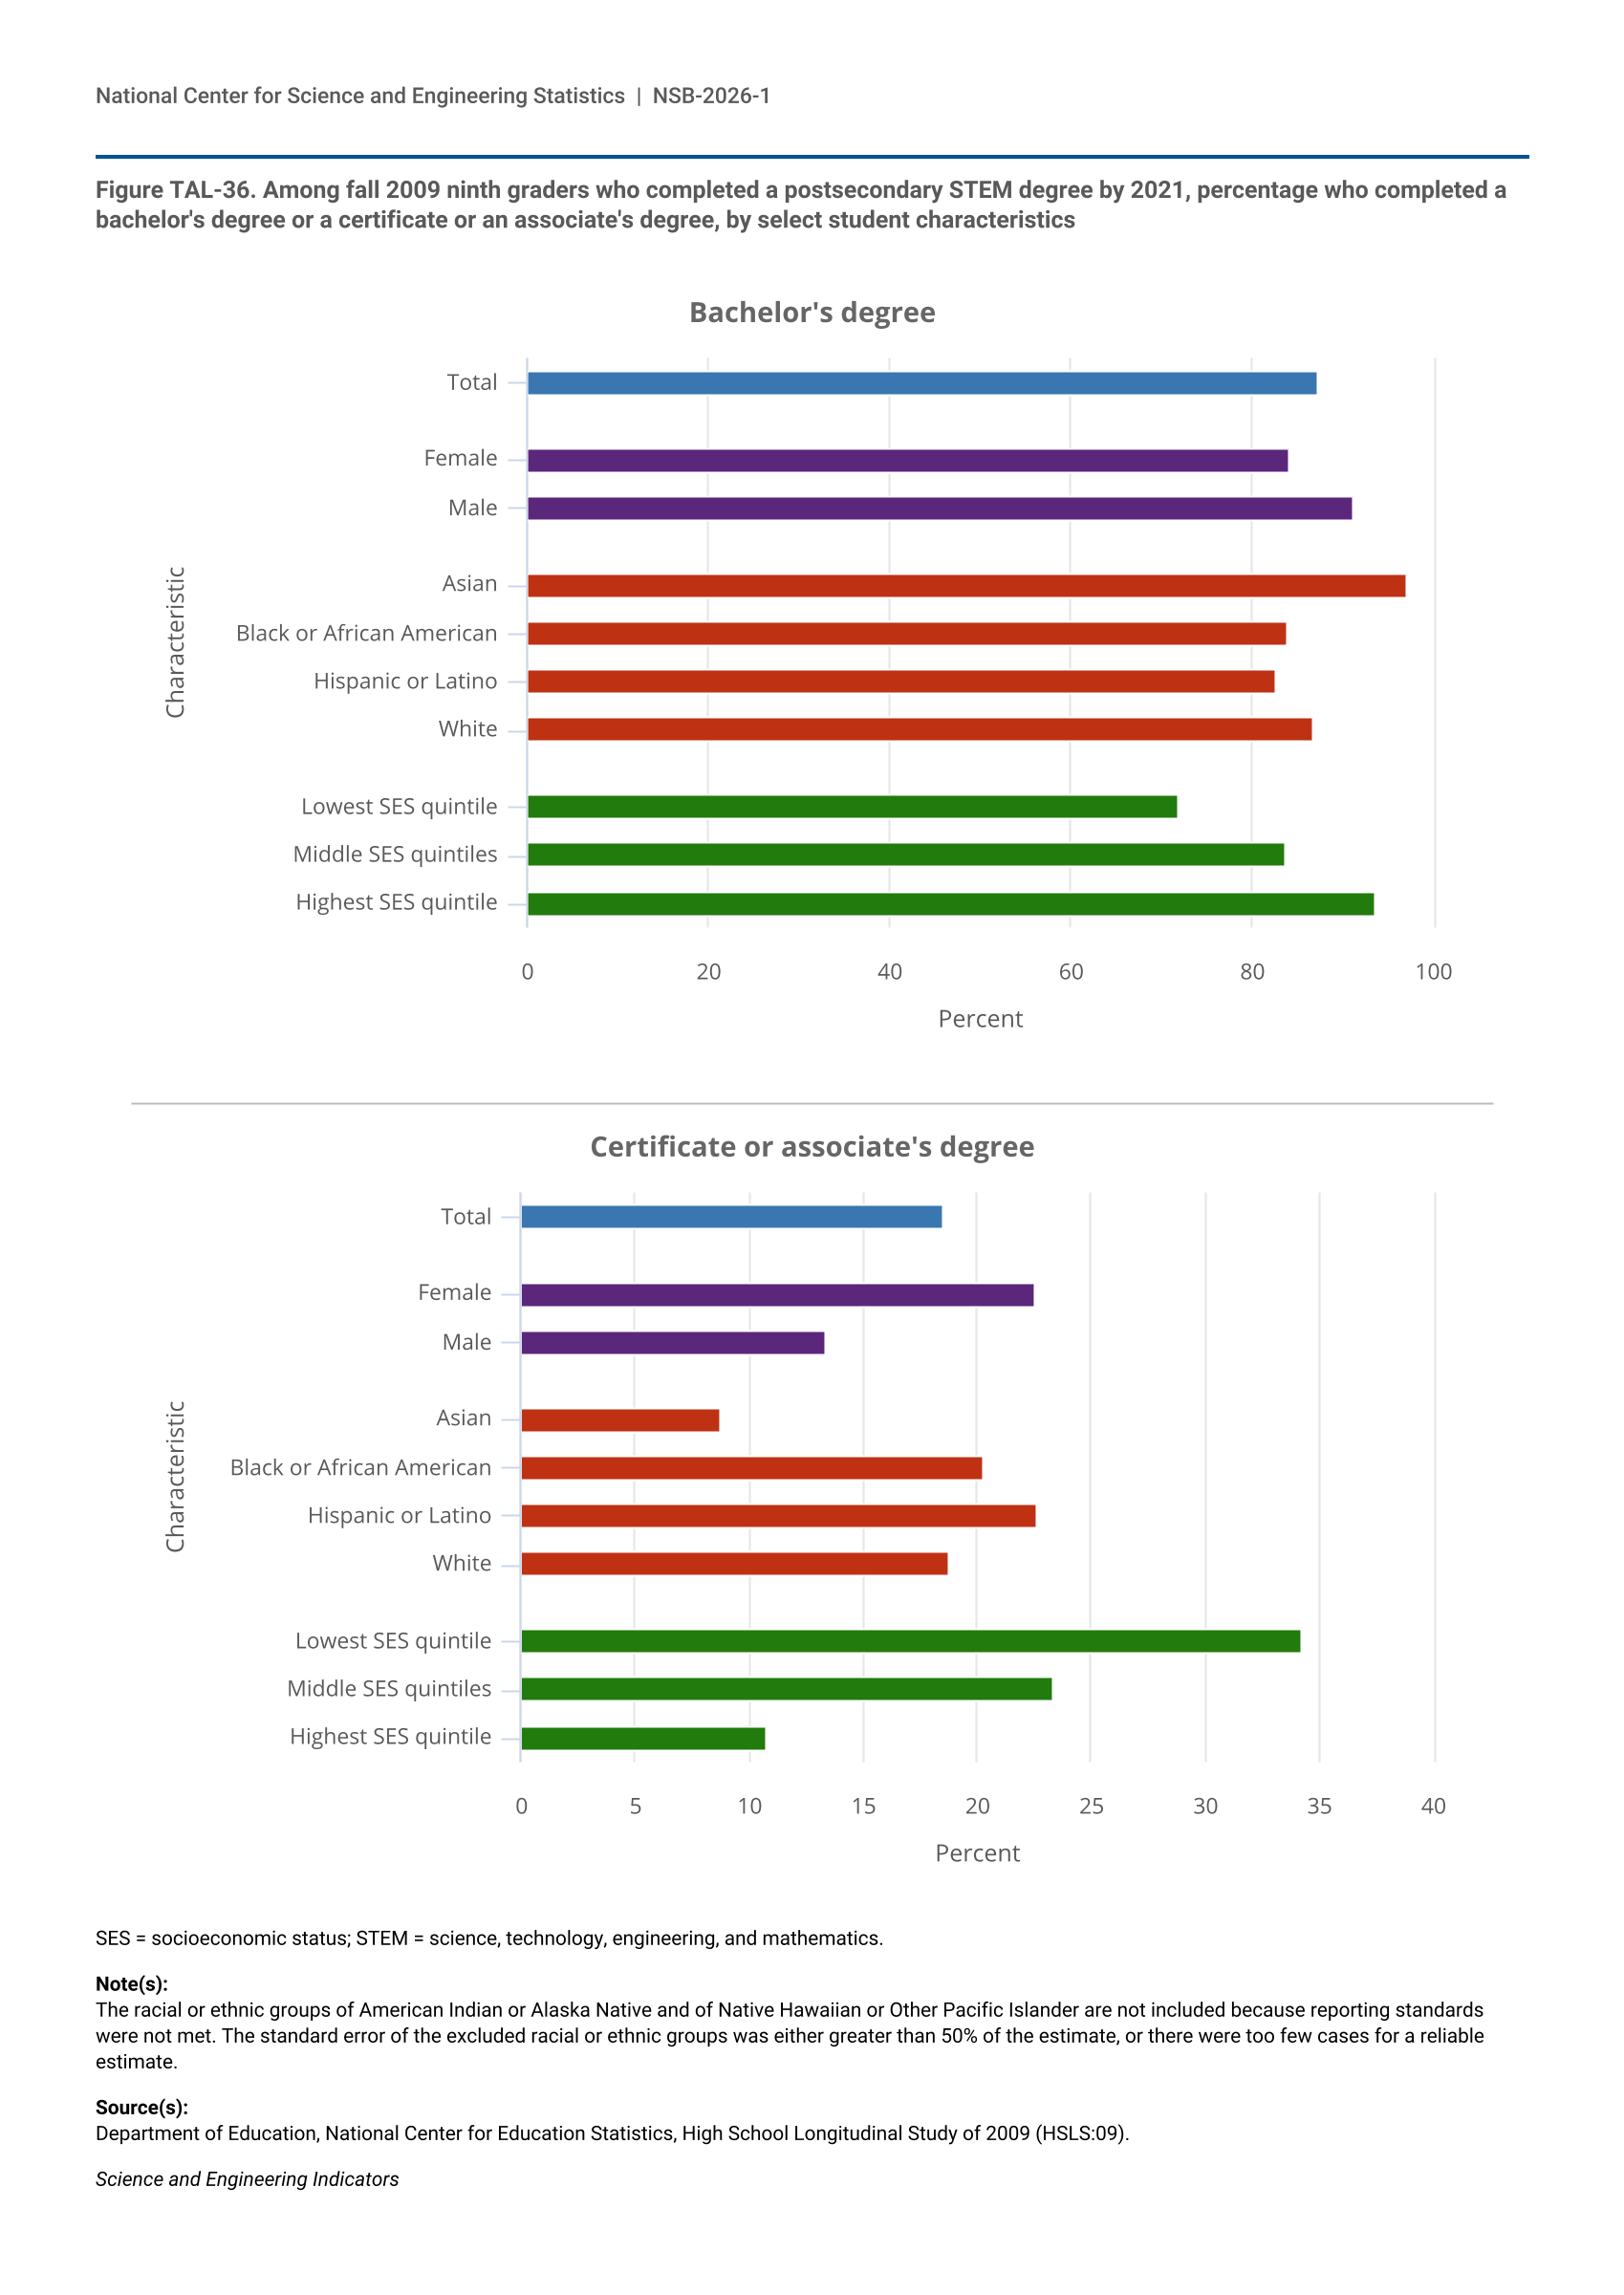
- Students’ mathematics achievement in high school is associated with postsecondary STEM degree outcomes. Of students who scored in the highest quintile of a mathematics assessment in grade 11 and declared a postsecondary STEM major in college, 71% completed a STEM degree, compared with 34% of students who scored in the lowest quintile.
Higher Education STEM Pipeline and International Competitiveness
U.S. higher education institutions continue to expand STEM degree production at all levels, with particularly strong growth in S&E fields. In 2023, the United States maintained its position as a leading destination for international students, despite a slight decline in overall share since 2013 and increasing global competition.
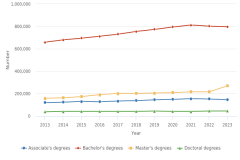
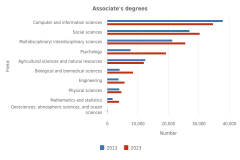
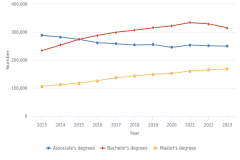
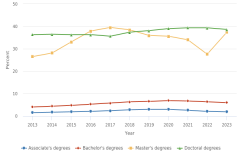
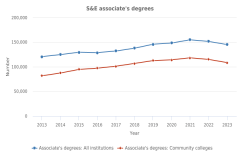
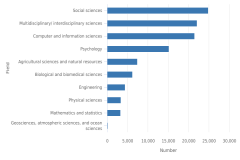
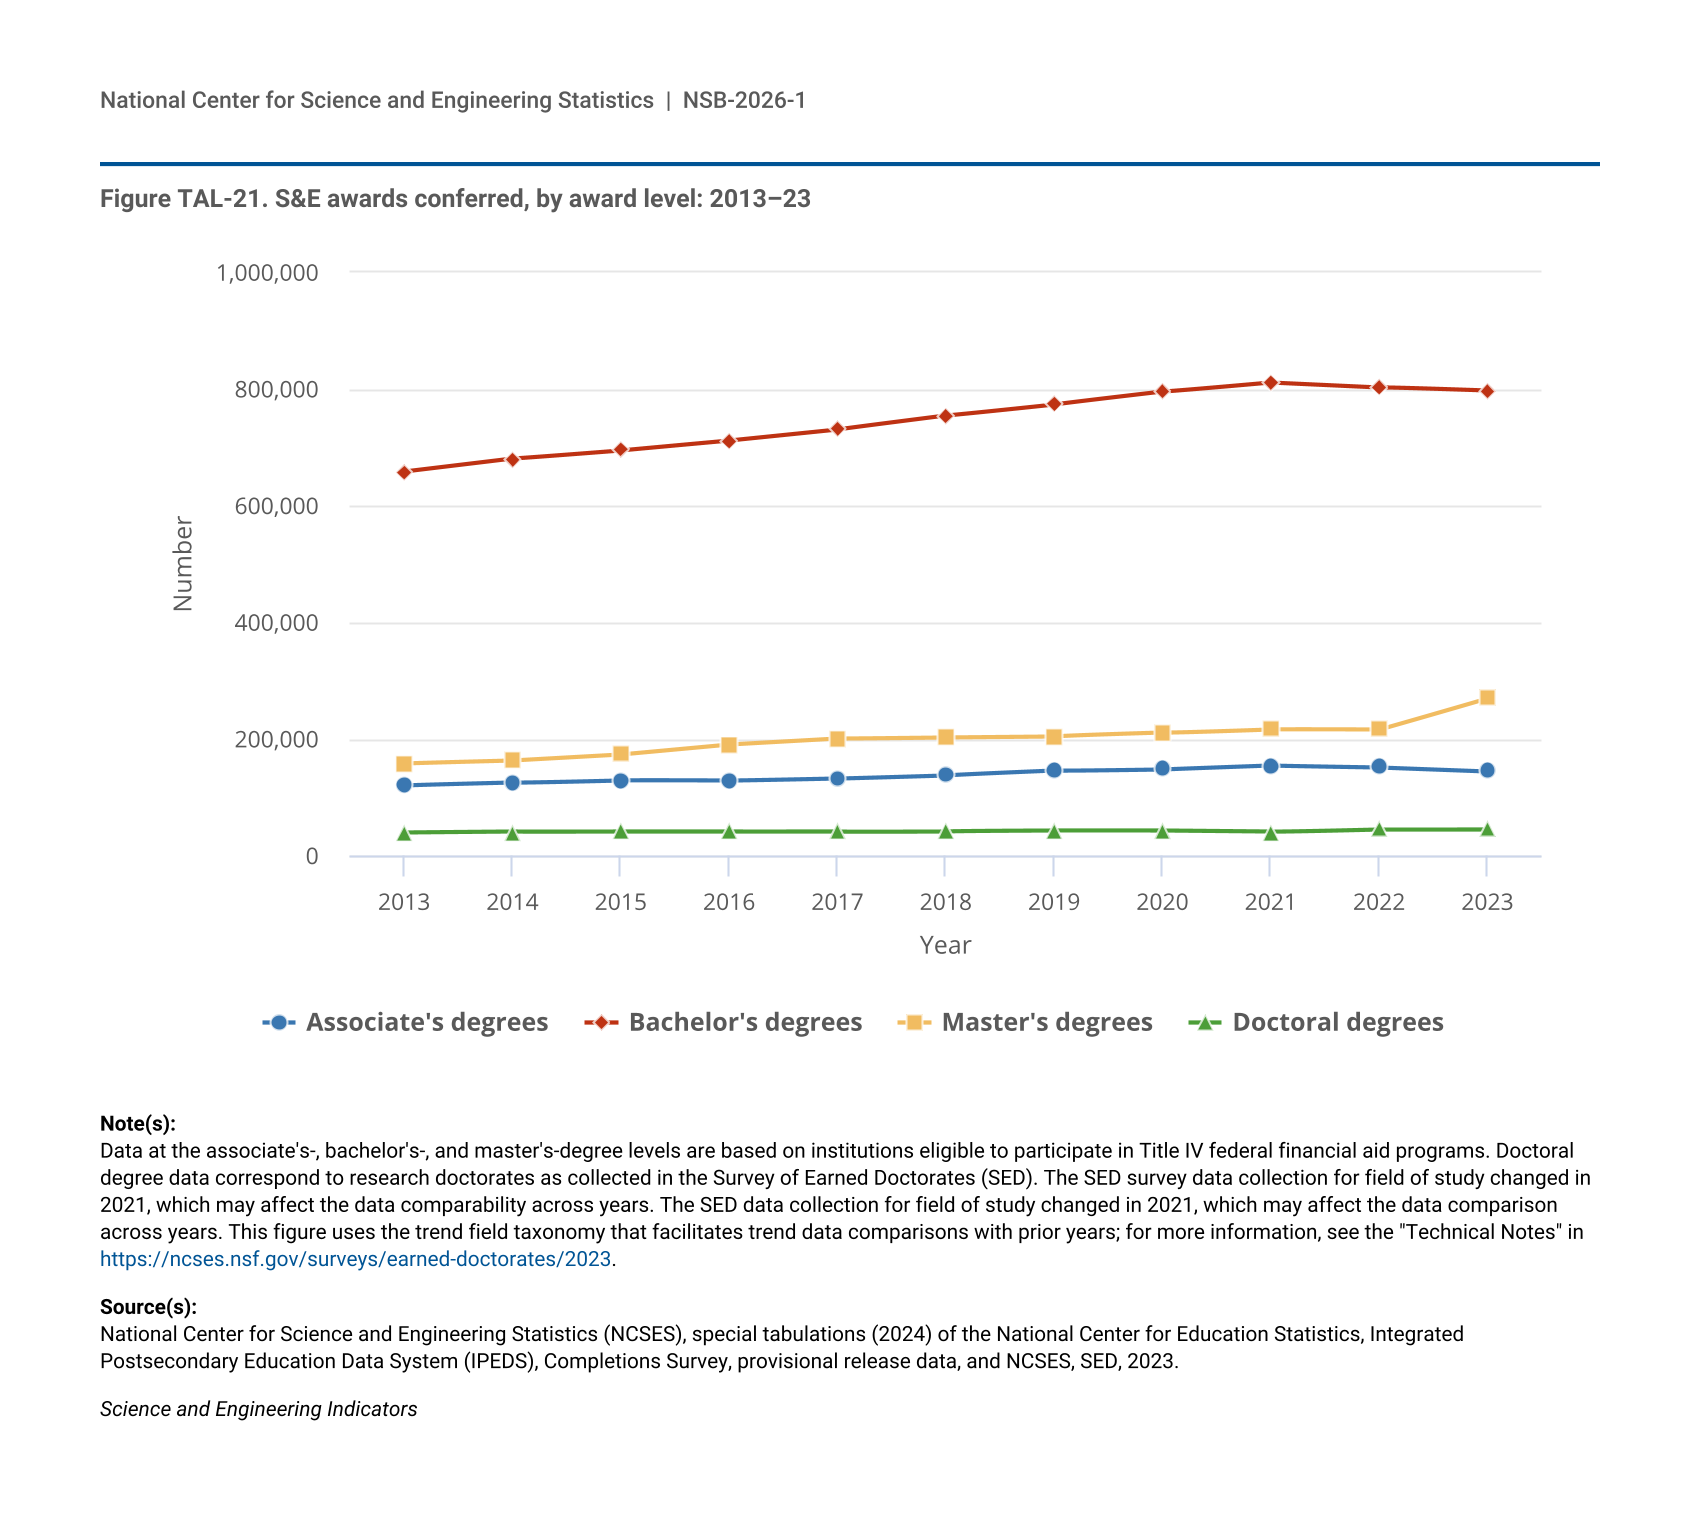
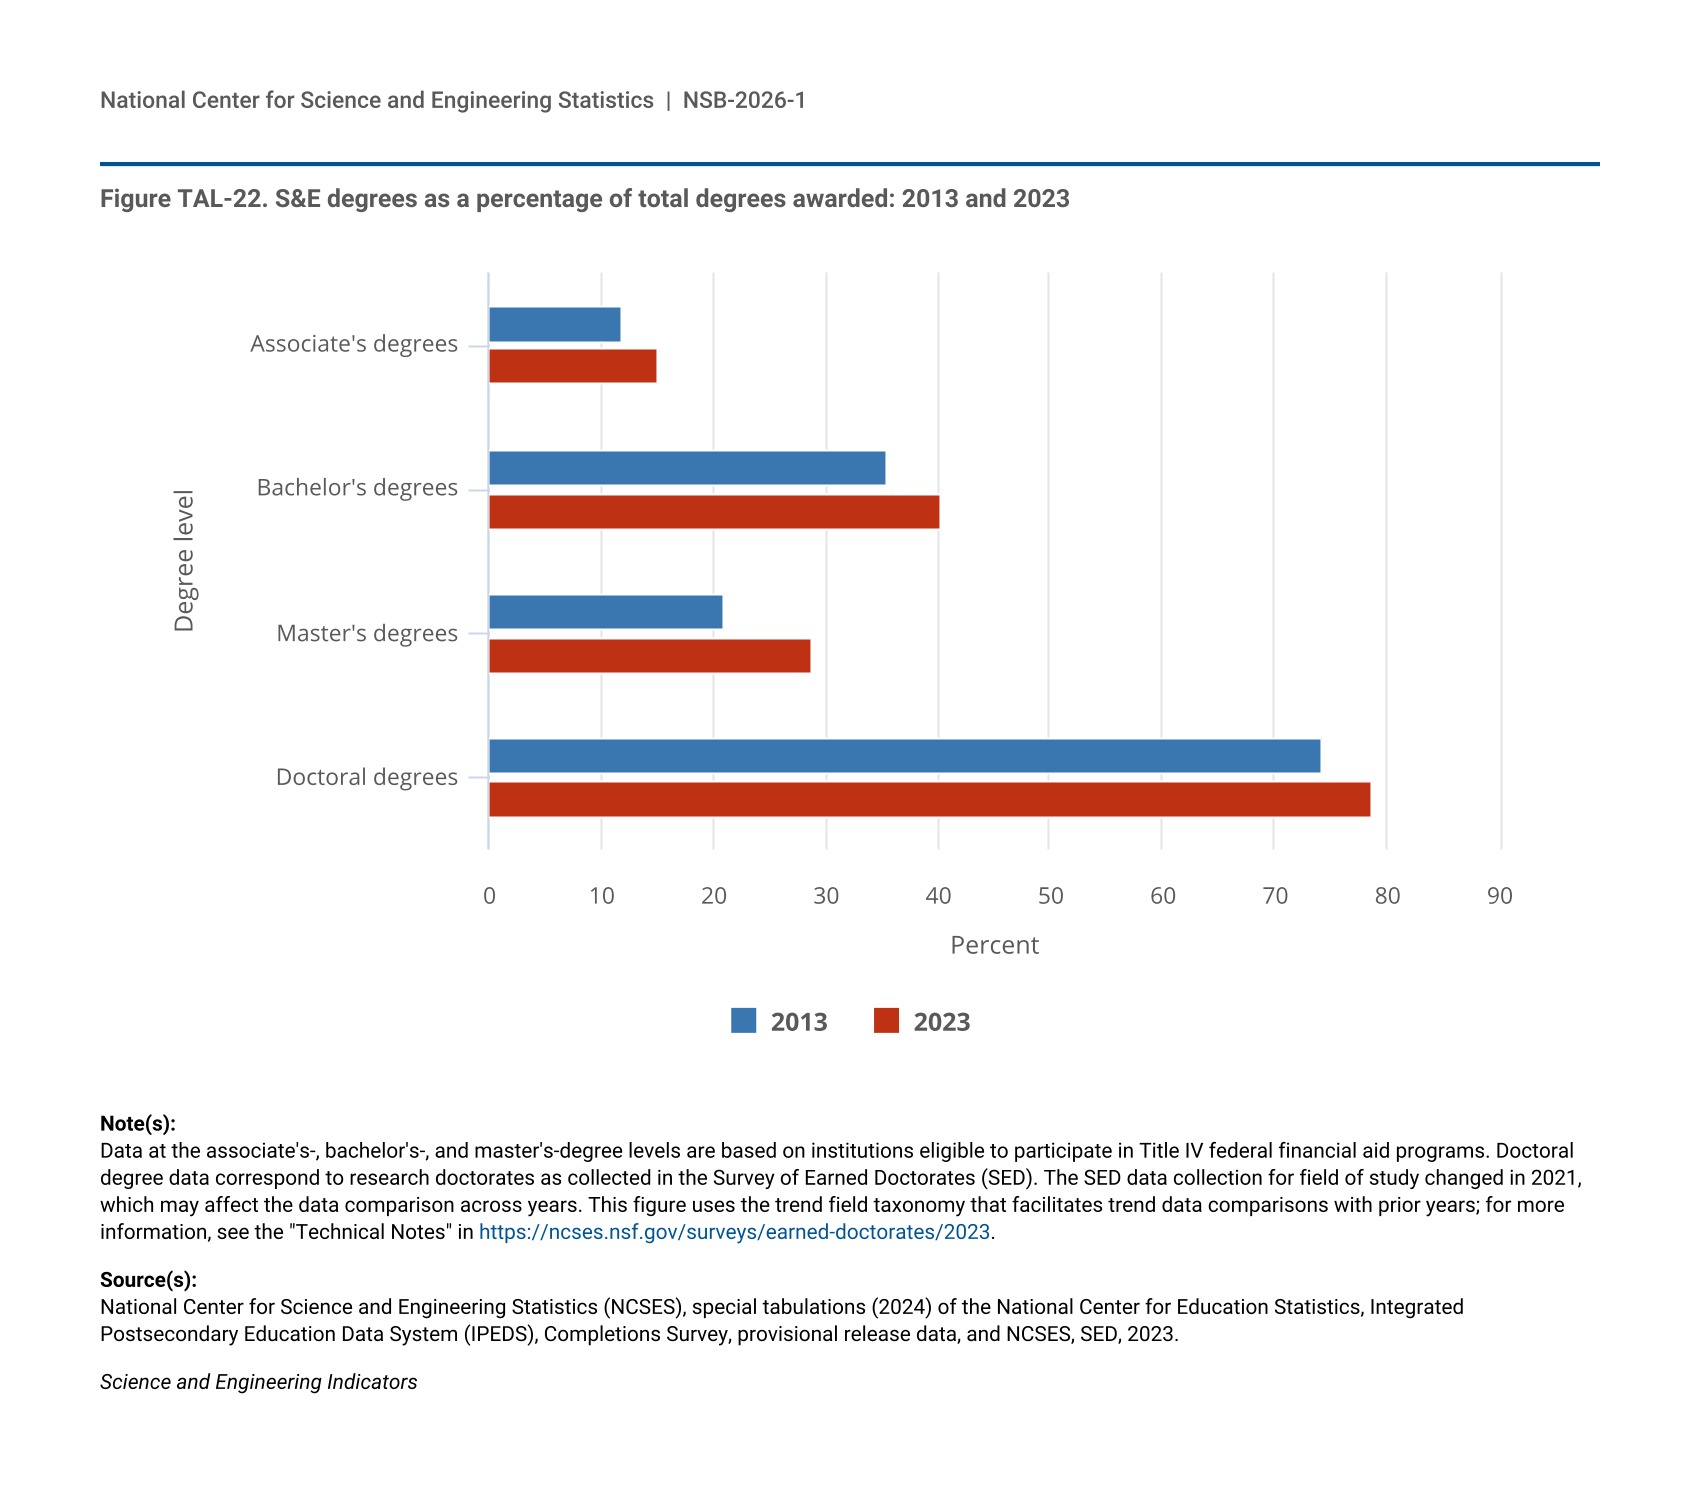
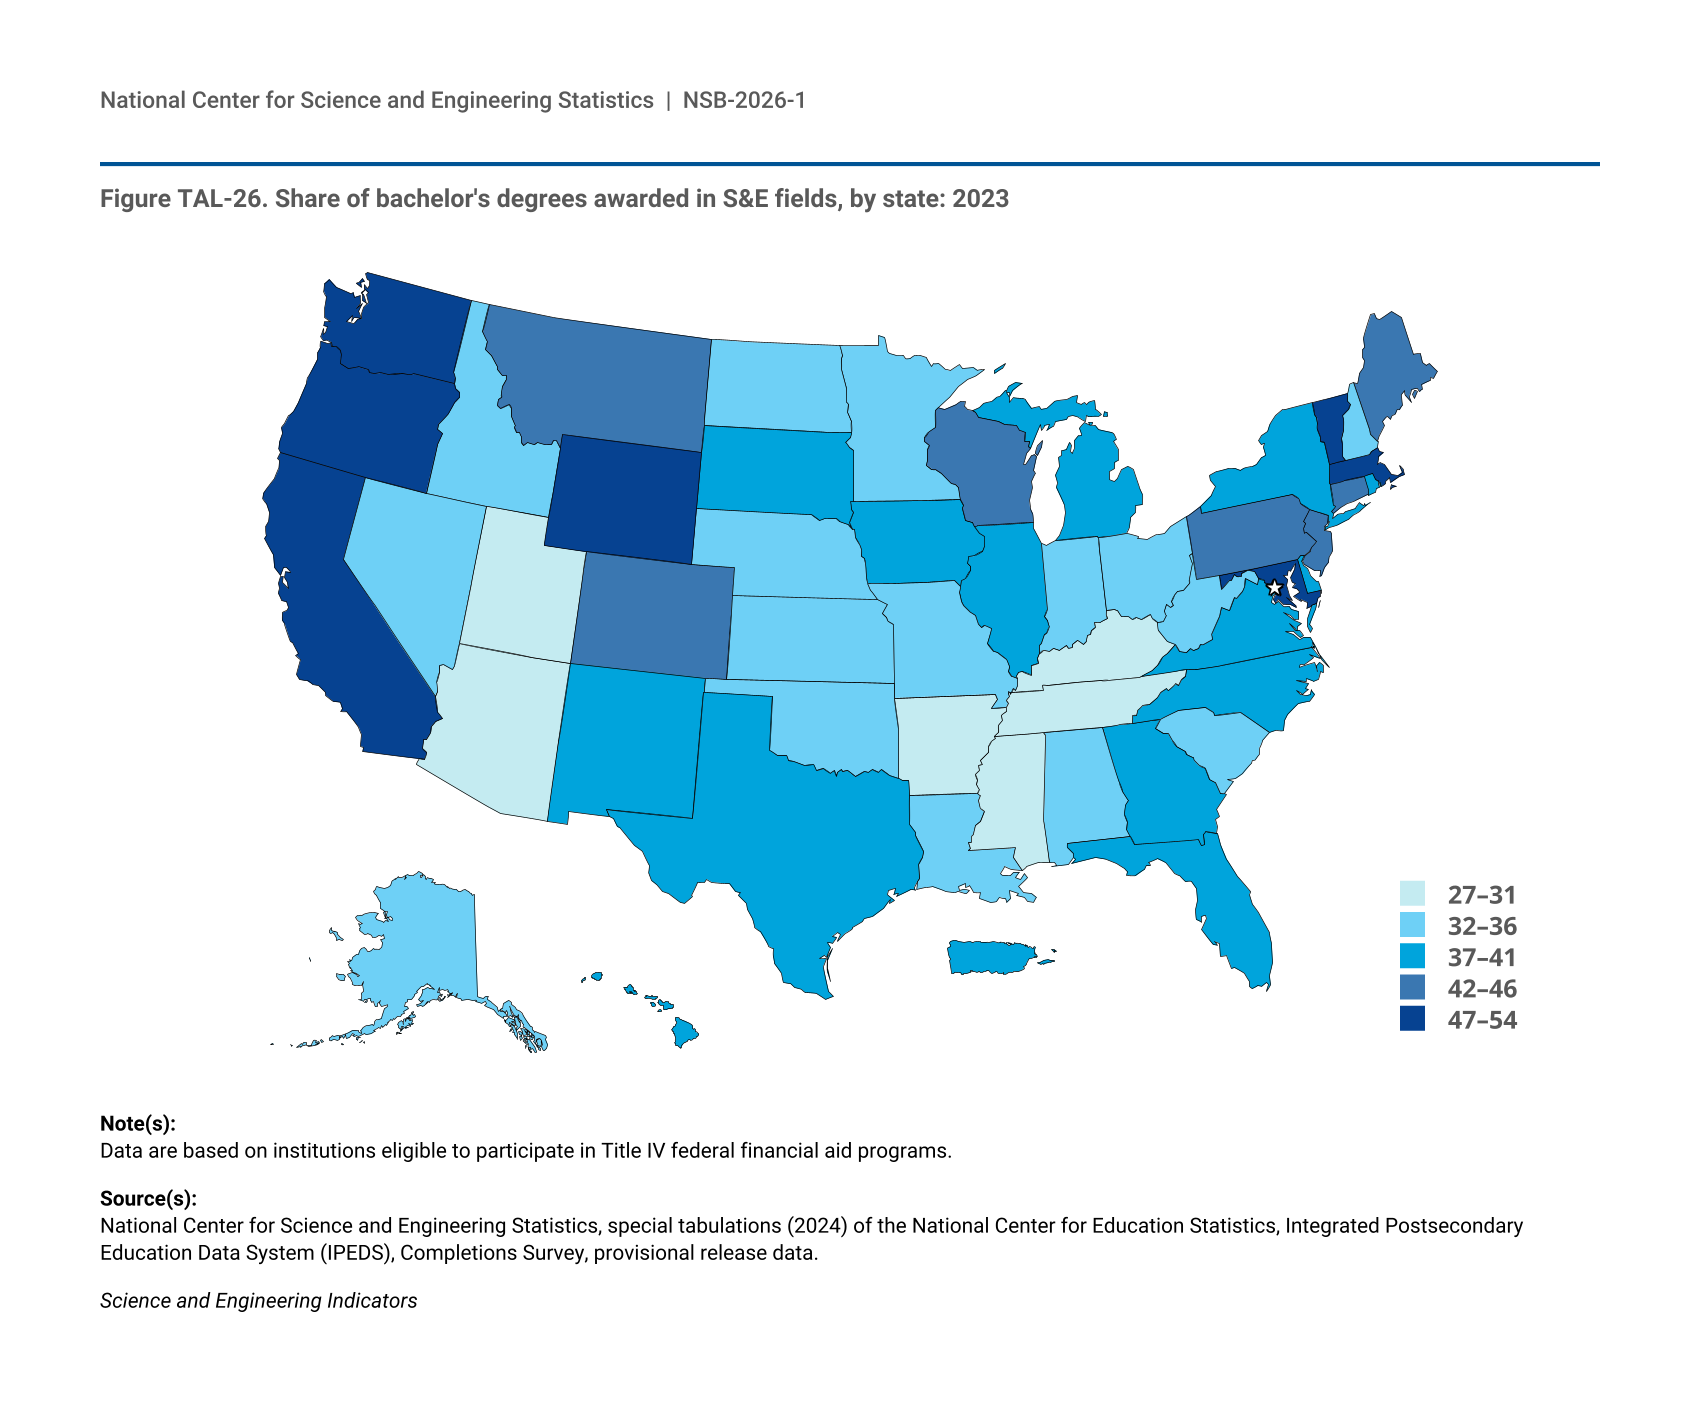
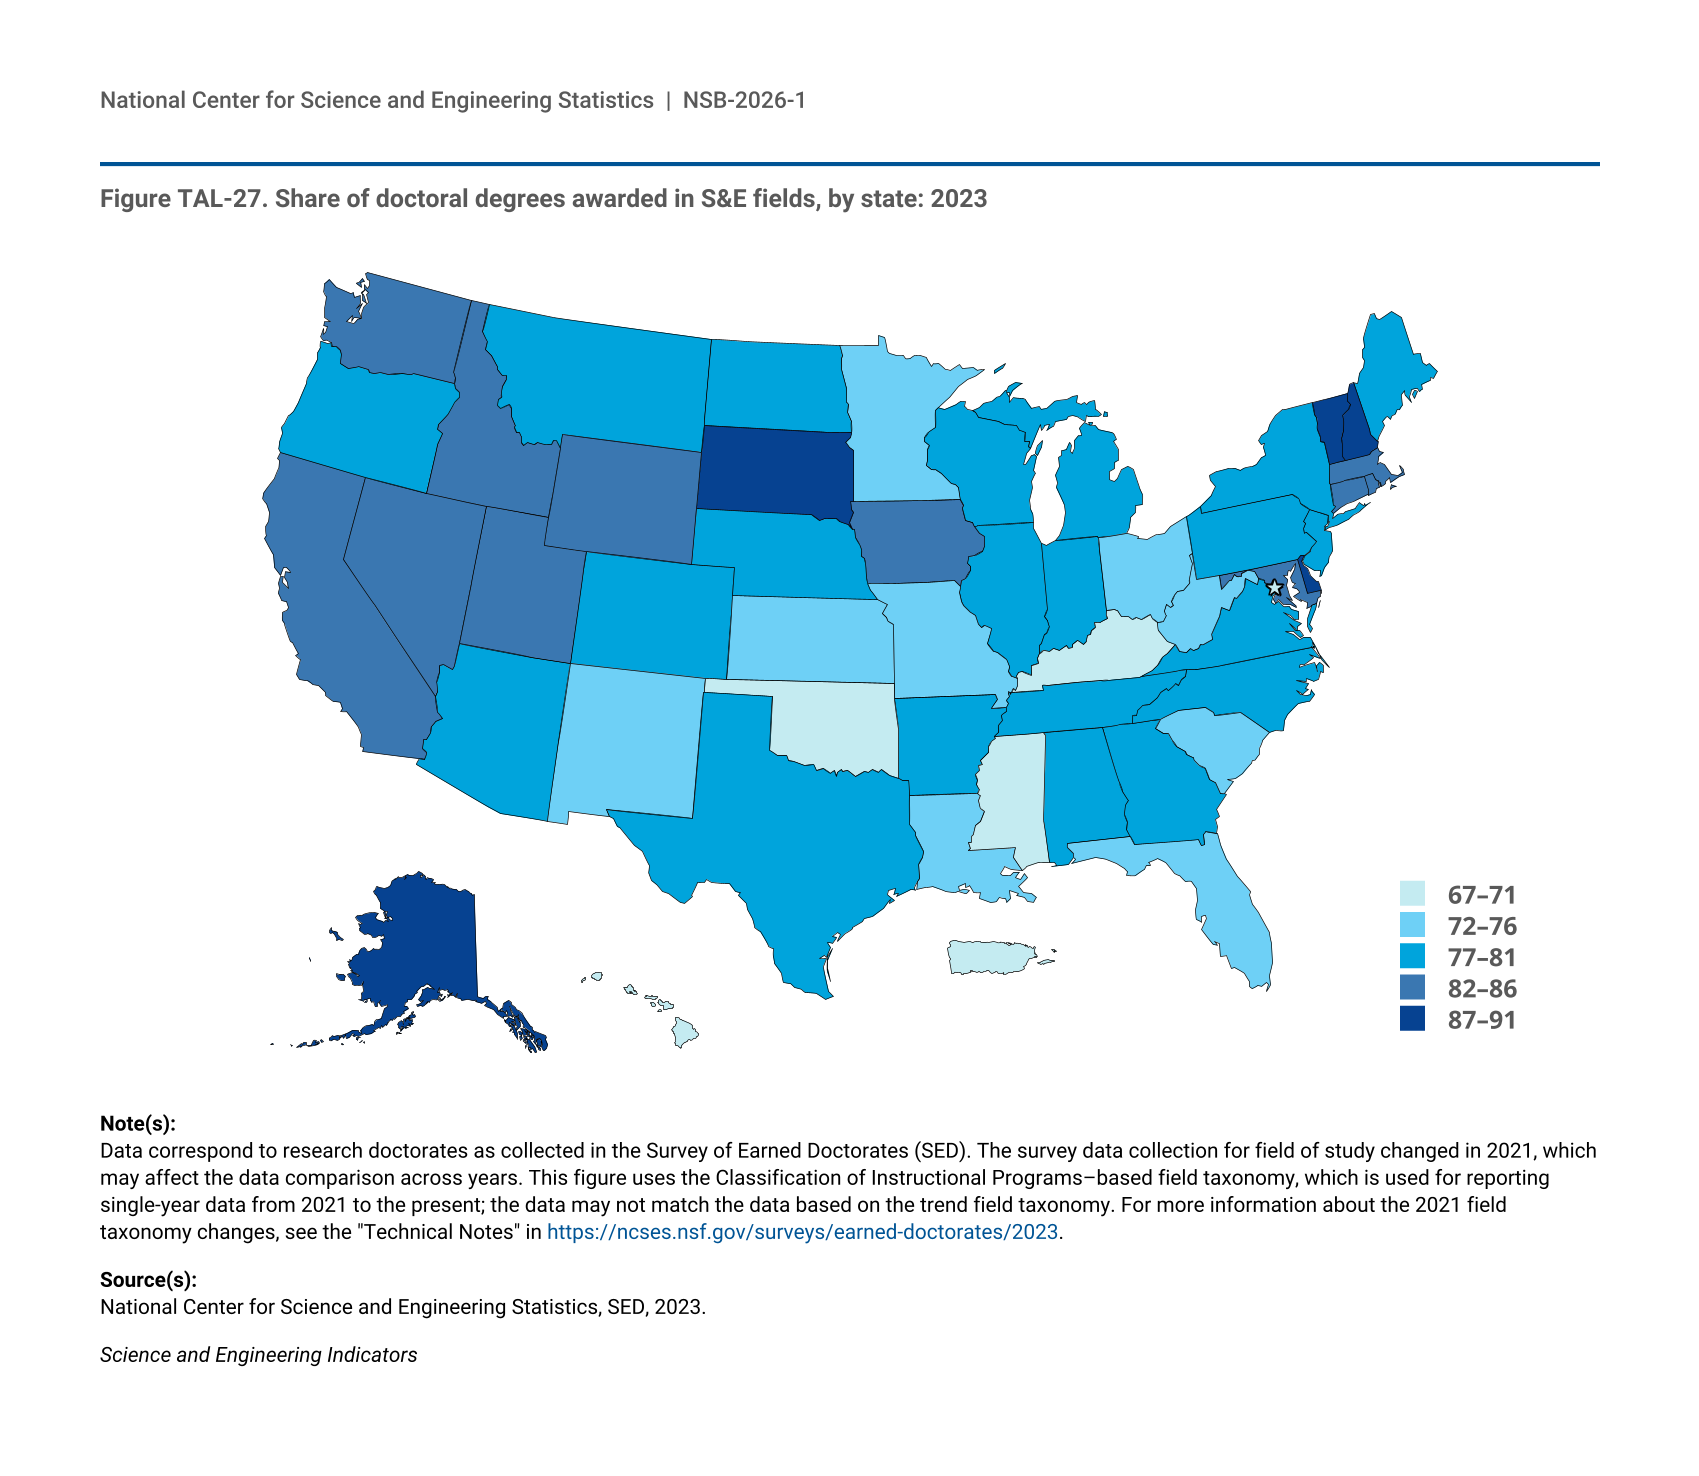
- Between 2013 and 2023, the number of S&E degrees awarded by U.S. institutions increased at all levels. At all degree levels, the growth in S&E degree completions during this period was higher than the growth in the college-age population.
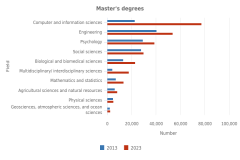
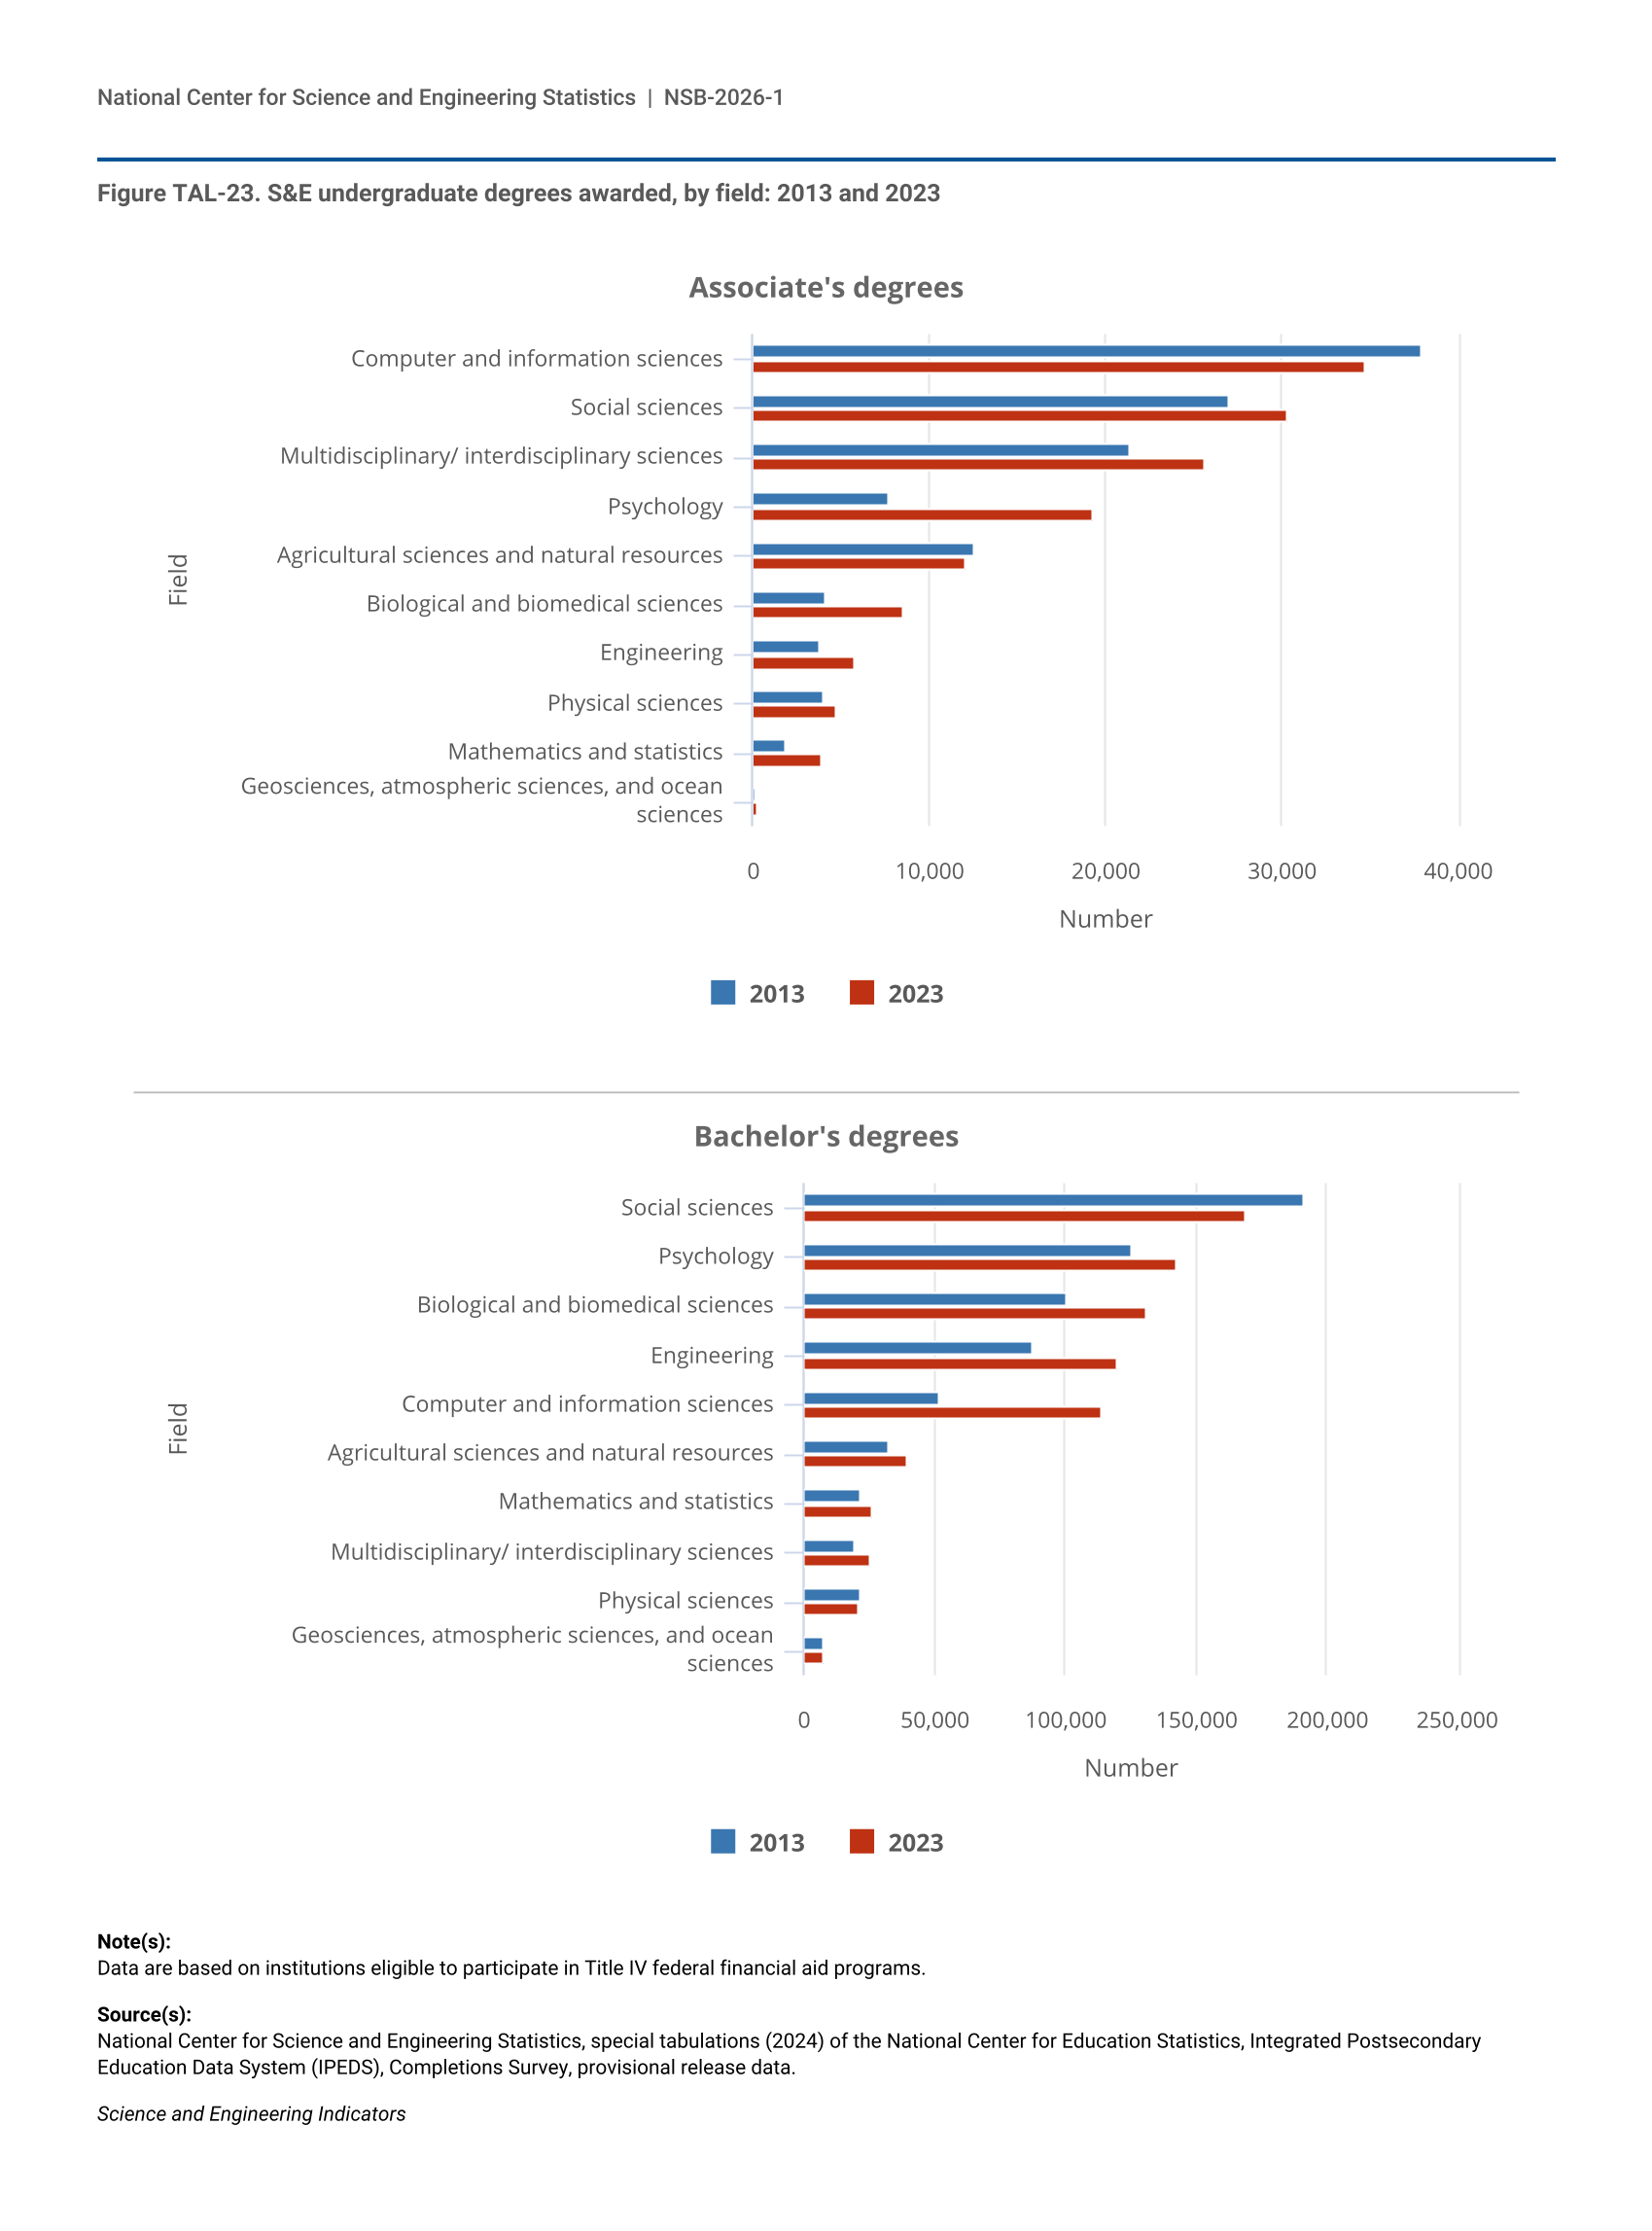
- Between 2013 and 2023, computer and information sciences degree awards at the bachelor’s and master’s levels exhibited strong growth, from about 51,500 to 114,100 and from about 22,800 to 77,200, respectively.
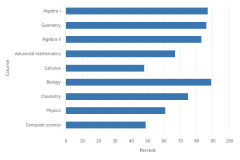
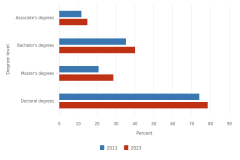
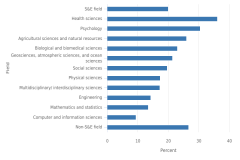
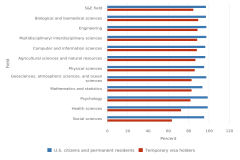
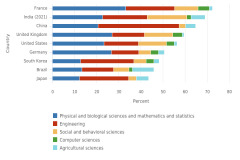
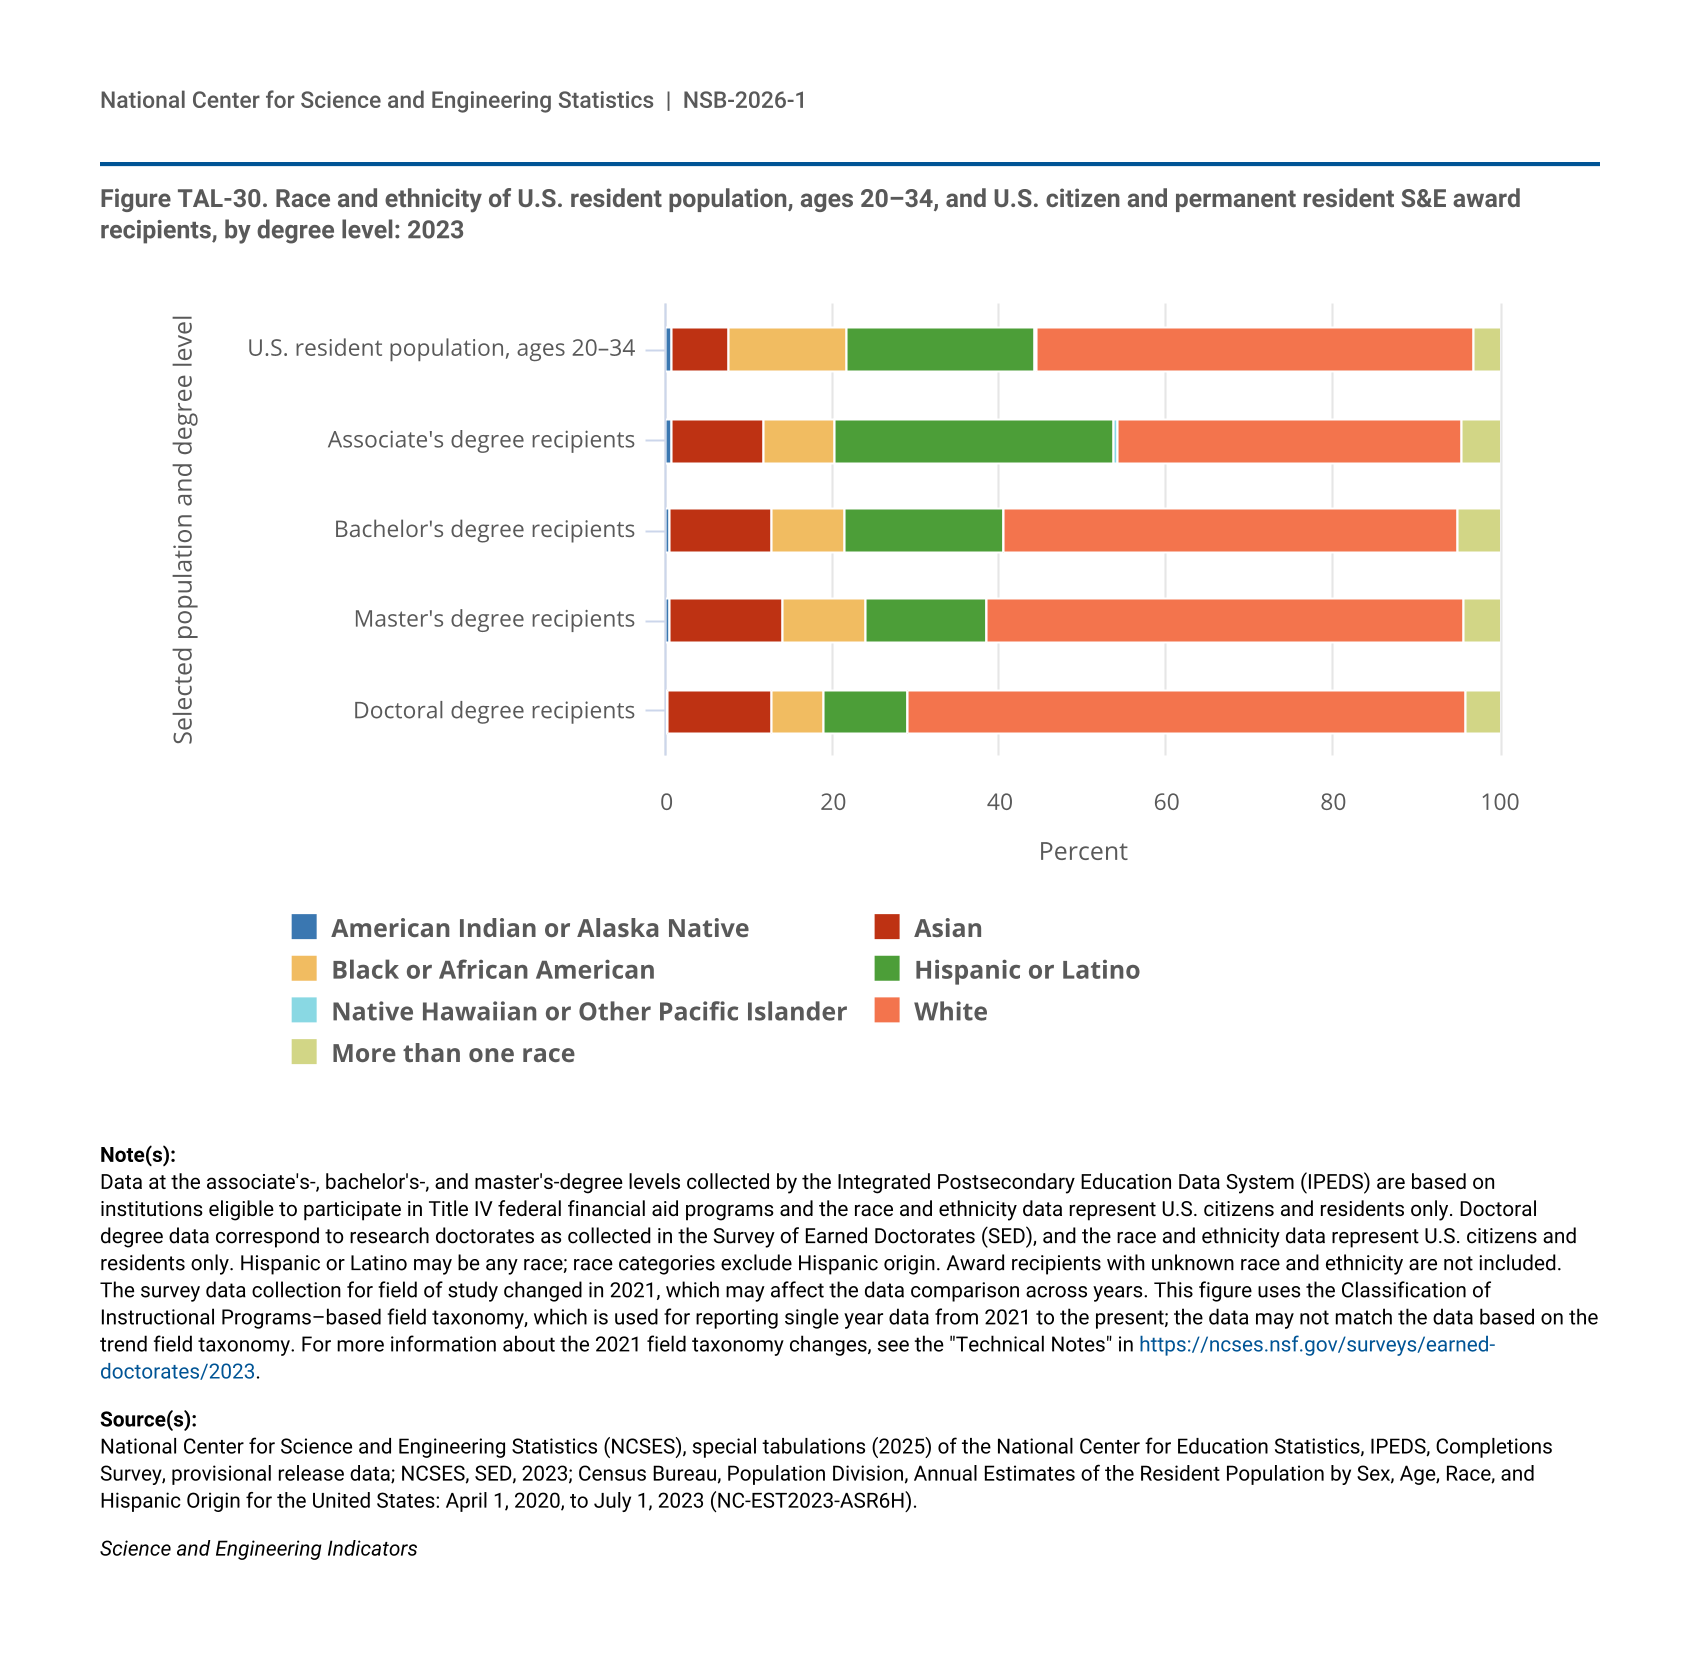
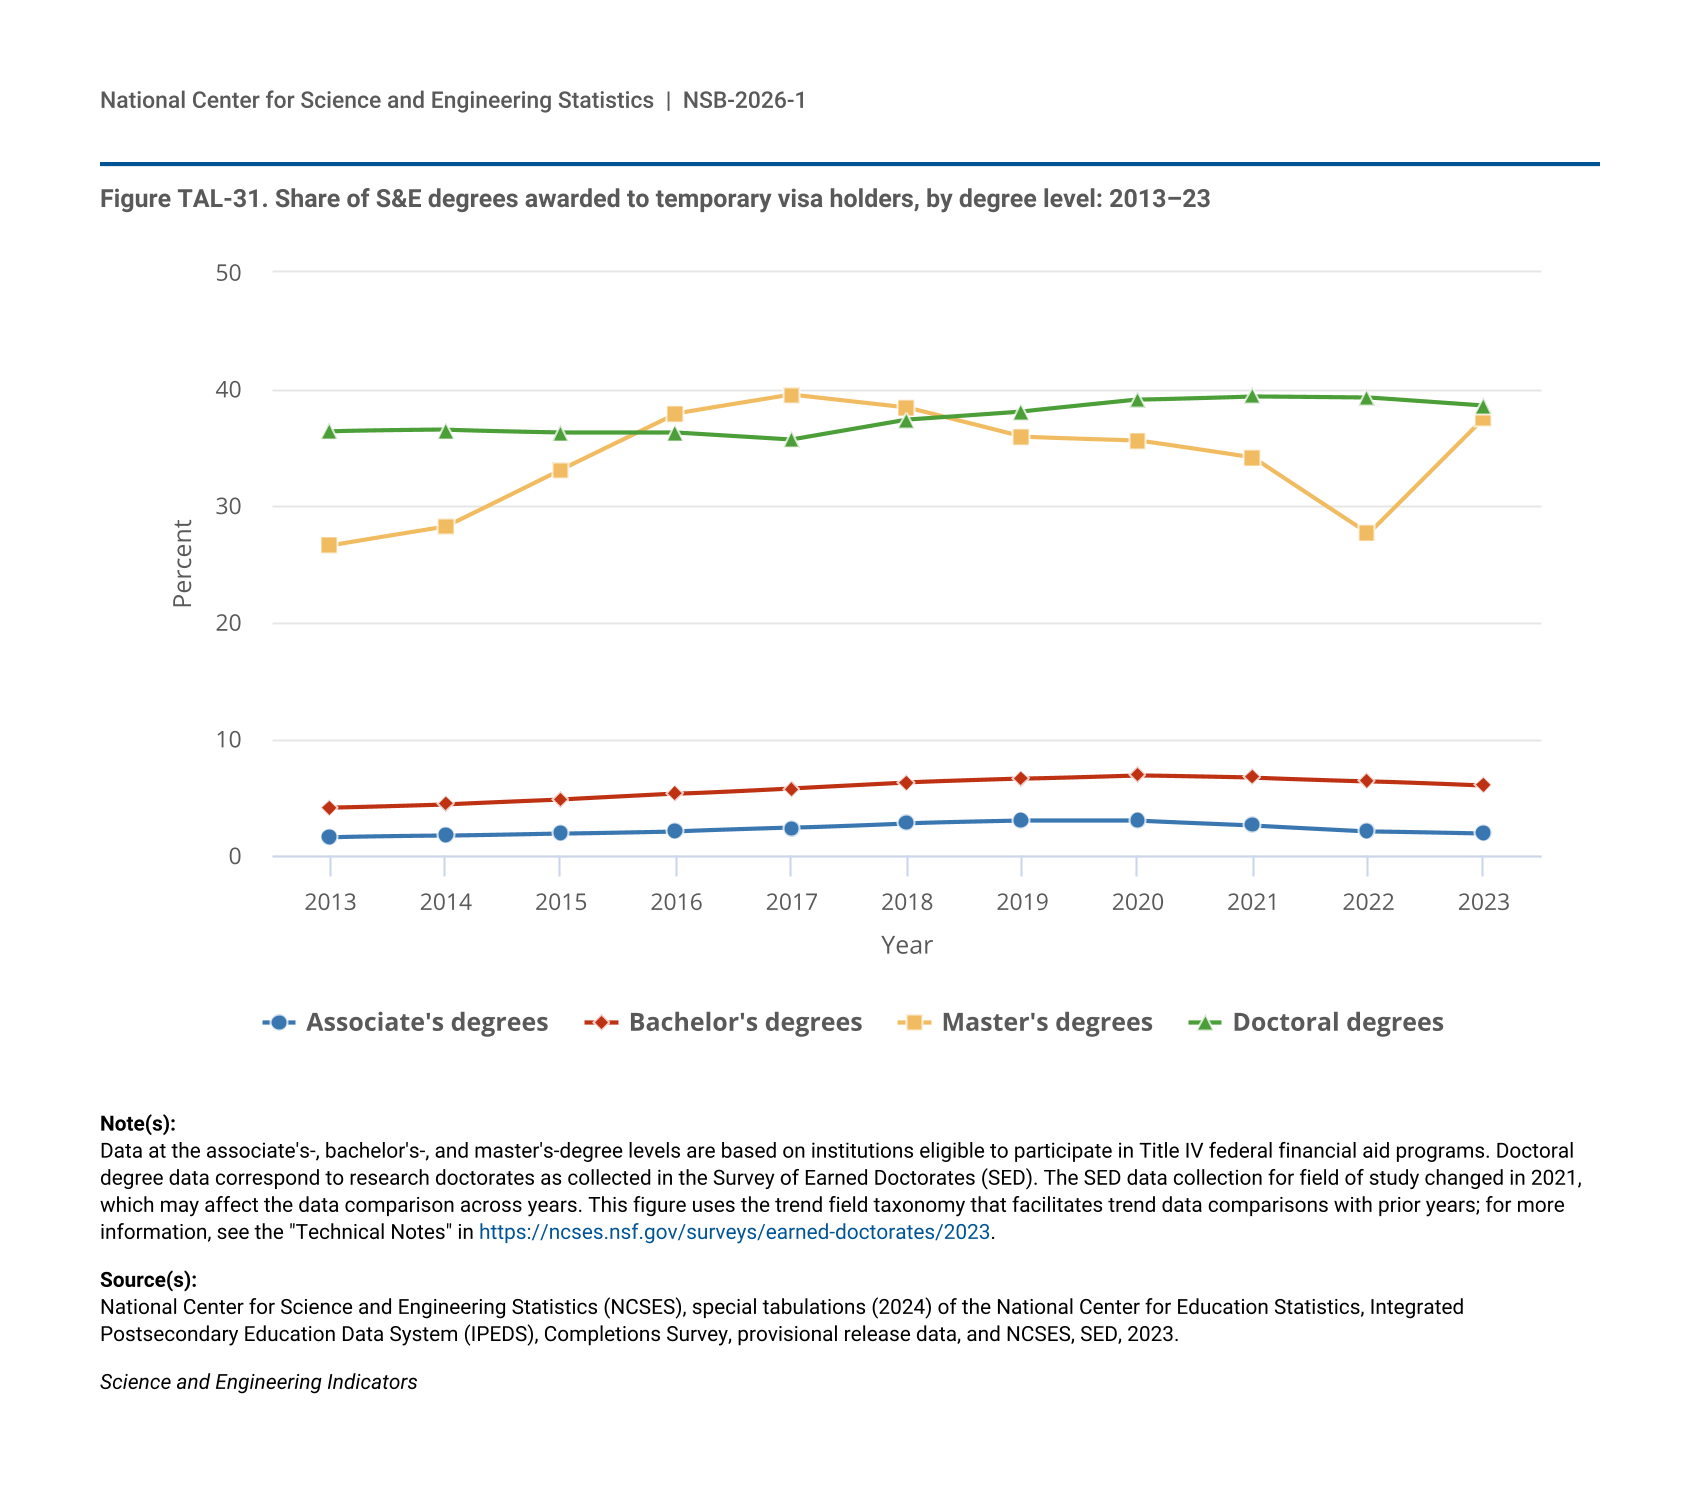
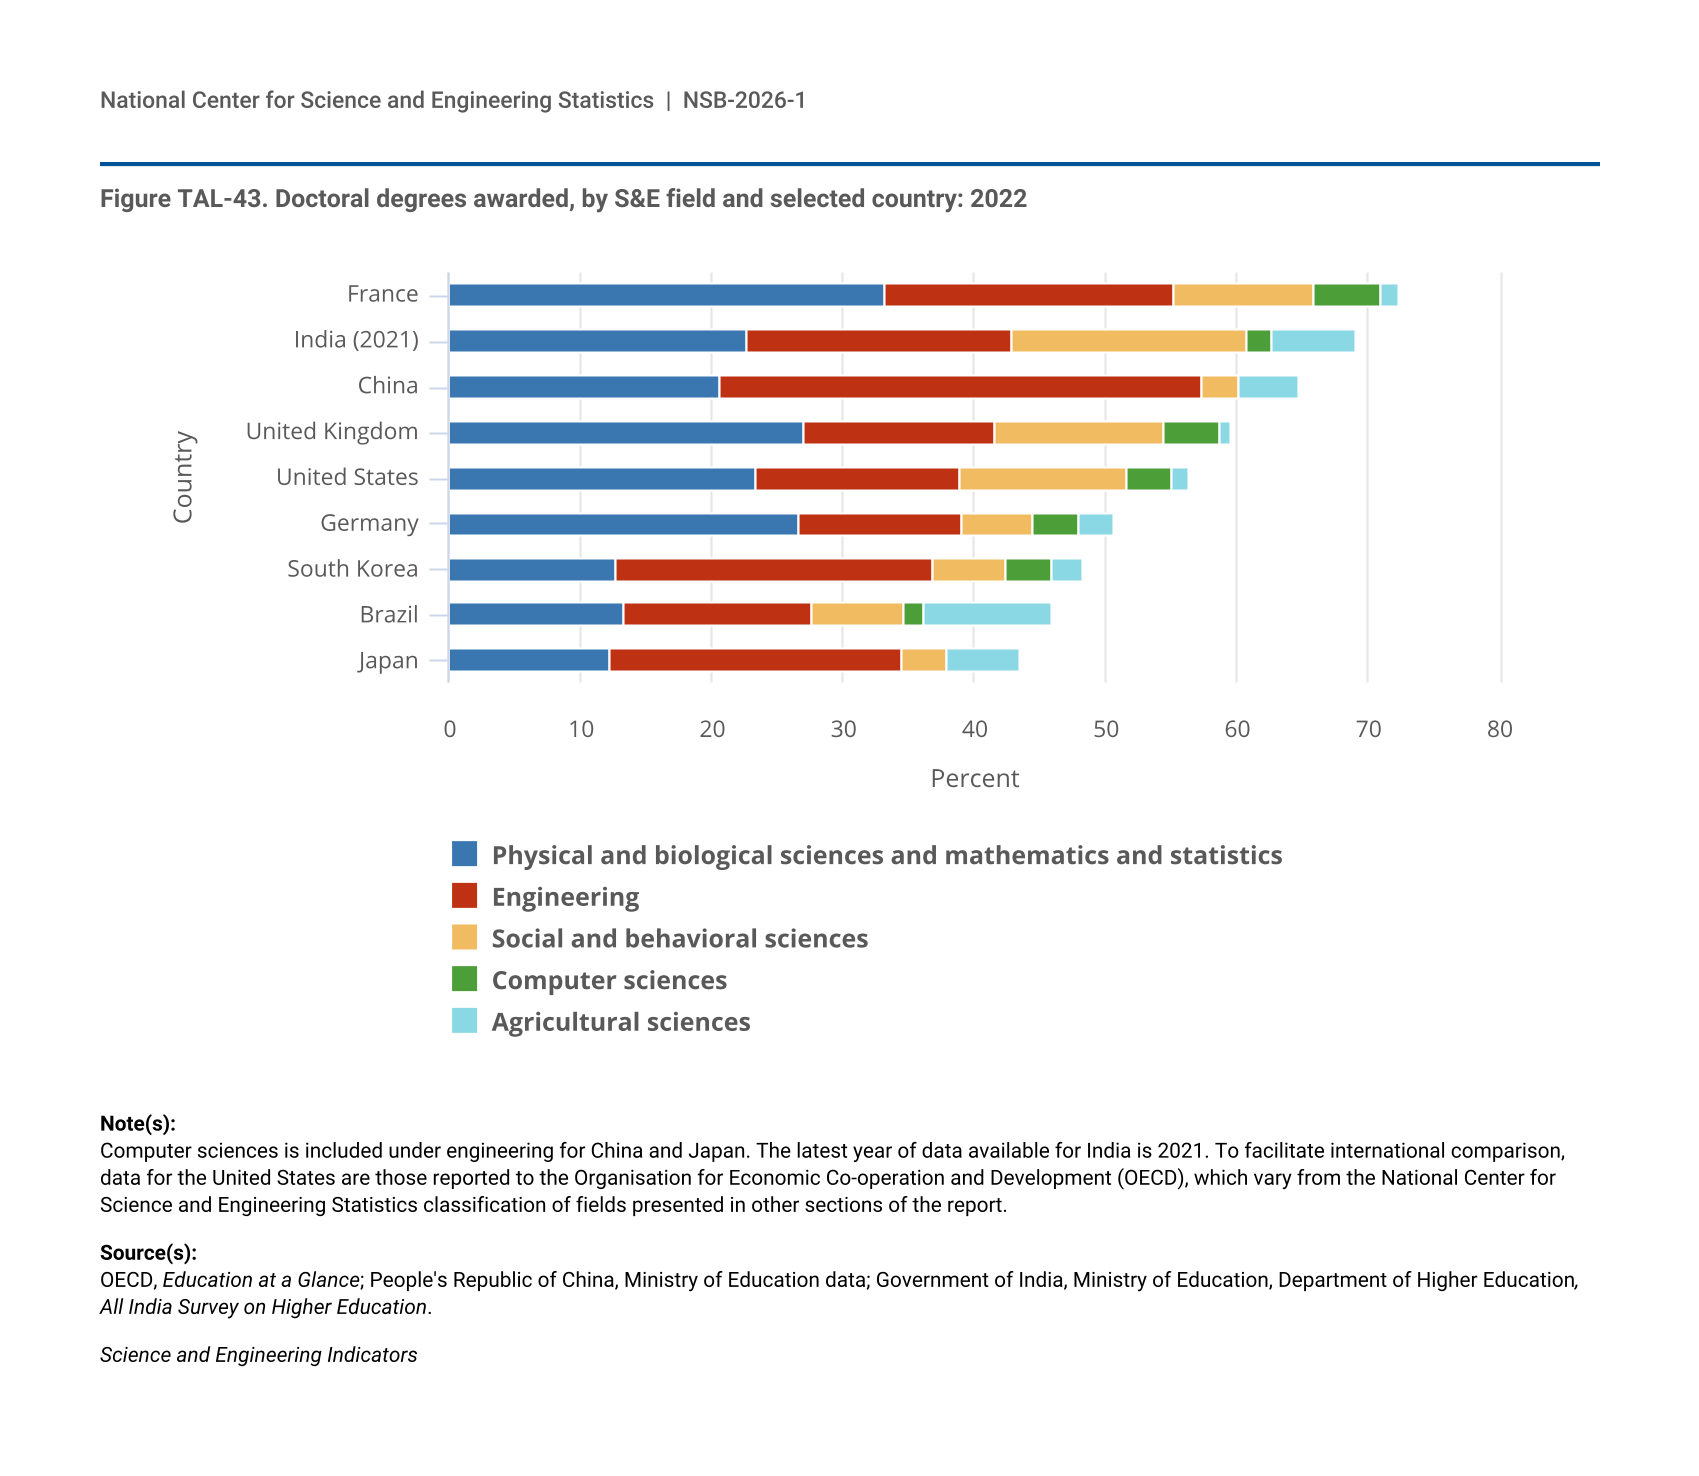
- In 2023, visa holders continue to be highly represented among advanced degree awardees (master’s and doctoral levels) in technologically important fields—computer and information sciences, engineering, and mathematics and statistics.
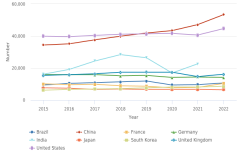
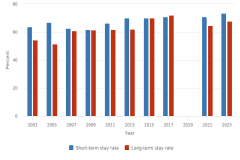
- The United States was the most popular destination for internationally mobile postsecondary students in 2023. However, the number of internationally mobile students enrolled in the United States fell by 3% between 2017 and 2023, while it rose in other countries that are major attractors of this talent.


