 An official website of the United States government
 STEM Labor
U.S. STEM Workforce: Size, Demographic Characteristics, and Labor Market Outcomes
STEM workers play an important role in the economic vitality, health, and security of the United States. They contribute to cutting-edge research and development (R&D), the application and maintenance of technologies in all sectors of the economy, and the provision of services that contribute to the well-being of every citizen. The United States relies on STEM workers to build its scientific and technical capacity and maintain the global competitiveness of its industries. The STEM workforce is defined as those currently employed in S&E, S&E-related, or STEM middle-skill occupations (see the Glossary section). STEM middle-skill occupations are those occupations that require technical knowledge but are not classified as S&E or S&E-related and do not require a bachelor’s degree (Table TAL-1).
STEM = science, technology, engineering, and mathematics.
Please see https://ncses.nsf.gov/pubs/nsb20212/ for the expanded definition of STEM occupations; https://ncses.nsf.gov/pubs/nsb20212/table/SLBR-1 for the classification of STEM occupations; and https://ncses.nsf.gov/136/assets/0/files/ncses_workforcestatistics_onepager.pdf for an overview.
National Science Board, National Science Foundation, 2021, The STEM Labor Force of Today: Scientists, Engineers and Skilled Technical Workers, Science and Engineering Indicators 2022, NSB-2021-2, available at https://ncses.nsf.gov/pubs/nsb20212/; National Center for Science and Engineering Statistics, 2022, Workforce Statistics, NCSES 2022-203, available at https://ncses.nsf.gov/136/assets/0/files/ncses_workforcestatistics_onepager.pdf.
Science and Engineering Indicators
Size of the STEM Workforce
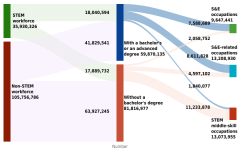
In 2023, there were 36 million STEM workers in the United States, making up 25% of the total U.S. workforce. Employment and educational attainment patterns varied among S&E, S&E-related, and STEM middle-skill occupations (Figure TAL-1). Among STEM workers, 27% were employed in S&E occupations, 37% in S&E-related occupations, and 36% in STEM middle-skill occupations. Most workers in S&E (79%) and S&E-related (65%) occupations had a bachelor’s or an advanced degree, whereas 14% of workers in STEM middle-skill occupations did. Of the STEM workers with a bachelor’s or an advanced degree, 42% were employed in S&E occupations, 48% were in S&E-related occupations, and 10% were in STEM middle-skill occupations. About half of the workers in the STEM workforce did not have a bachelor’s degree; of these workers, 63% were employed in STEM middle-skill occupations.
| Education level and occupational group | Total |
|---|---|
| Total | 141,687,112 |
| STEM workforce | 35,930,326 |
| STEM, with a bachelor's degree or an advanced degree | 18,040,594 |
| STEM, with a bachelor's degree or an advanced degree, S&E occupations | 7,588,689 |
| STEM, with a bachelor's degree or an advanced degree, S&E-related occupations | 8,611,828 |
| STEM, with a bachelor's degree or an advanced degree, STEM middle-skill occupations | 1,840,077 |
| STEM, without a bachelor's degree | 17,889,732 |
| STEM, without a bachelor's degree, S&E occupations | 2,058,752 |
| STEM, without a bachelor's degree, S&E-related occupations | 4,597,102 |
| STEM, without a bachelor's degree, STEM middle-skill occupations | 11,233,878 |
| Non-STEM workforce | 105,756,786 |
| Non-STEM, with a bachelor's degree or an advanced degree | 41,829,541 |
| Non-STEM, without a bachelor's degree | 63,927,245 |
STEM = science, technology, engineering, and mathematics.
Data include the employed, civilian, noninstitutionalized population ages 25–75 not currently in primary or secondary school. Missing occupations and those who have not worked in the past 5 years or have never worked are not included in the data. STEM includes S&E, S&E-related, and STEM middle-skill occupations.
Census Bureau, American Community Survey (ACS), 2023.
Science and Engineering Indicators
Demographic Patterns of the STEM Workforce
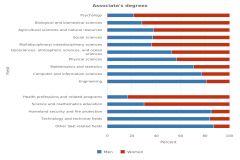
The STEM workforce is predominantly male. Of the 36 million workers in the STEM workforce in 2023, 65% were men (Figure TAL-2). Although men accounted for most workers in S&E (73%) and STEM middle-skill (89%) occupations, women accounted for the majority (65%) of workers in S&E-related occupations.
| Occupational group | Men | Women |
|---|---|---|
| All workers | 74,587,549 | 67,099,563 |
| STEM occupations | 23,304,772 | 12,625,554 |
| S&E occupations | 7,059,361 | 2,588,080 |
| S&E-related occupations | 4,604,183 | 8,604,747 |
| STEM middle-skill occupations | 11,641,228 | 1,432,727 |
| Non-STEM occupations | 51,282,777 | 54,474,009 |
| Occupational group | Men | Women |
|---|---|---|
| STEM occupations | 31.2 | 18.8 |
| S&E occupations | 9.5 | 3.9 |
| S&E-related occupations | 6.2 | 12.8 |
| STEM middle-skill occupations | 15.6 | 2.1 |
| Non-STEM occupations | 68.8 | 81.2 |
STEM = science, technology, engineering, and mathematics.
Data include the employed, civilian, noninstitutionalized population ages 25–75 not currently in primary or secondary school. Missing occupations and those who have not worked in the past 5 years or have never worked are not included in the data. STEM includes S&E, S&E-related, and STEM middle-skill occupations.
Census Bureau, American Community Survey (ACS), 2023.
Science and Engineering Indicators
A greater share of the total male workforce of the United States was employed in STEM occupations than their female counterparts in 2023: 31% of the total male workforce was employed in STEM occupations, compared to 19% of the total female workforce (Figure TAL-2). However, a different pattern emerged by STEM occupational group. Greater shares of the total male workforce were employed in S&E (9%) and middle-skill (16%) occupations than their female counterparts (4% and 2%, respectively), whereas a greater share (13%) of the total female workforce was employed in S&E-related occupations than their male counterparts (6%).
Participation in the STEM workforce varied by racial and ethnic group. In 2023, 38% of all Asian workers were employed in STEM occupations, the highest share of any racial or ethnic group, followed by White workers at 27% (Figure TAL-3; Table STAL-1). Roughly 20% of Black or African American (Black), Hispanic or Latino (Hispanic), American Indian or Alaska Native, and Native Hawaiian or Other Pacific Islander workers were employed in STEM occupations.
| Race or ethnicity | % in STEM occupations |
|---|---|
| Total | 25.4 |
| White | 26.5 |
| Black or African American | 19.4 |
| Hispanic or Latino | 20.6 |
| Asian | 38.2 |
| AIAN | 20.5 |
| NHOPI | 19.8 |
| Other race alone or more than one race | 25.9 |
AIAN = American Indian or Alaska Native; NHOPI = Native Hawaiian or Other Pacific Islander; STEM = science, technology, engineering, and mathematics.
Data include the employed, civilian, noninstitutionalized population ages 25–75 not currently in primary or secondary school. Missing occupations and those who have not worked in the past 5 years or have never worked are not included in the data. Hispanic or Latino may be any race; race categories exclude Hispanic origin. STEM includes S&E, S&E-related, and STEM middle-skill occupations.
Census Bureau, American Community Survey (ACS), 2023.
Science and Engineering Indicators
Educational Attainment of the STEM Workforce
Postsecondary education is a common educational pathway to STEM occupations. In 2023, 62% of STEM workers had earned a postsecondary degree, with 50% having earned a bachelor’s or an advanced degree and another 12% having earned an associate’s degree (Figure TAL-4; Table STAL-1). STEM workers had higher shares of each level of postsecondary degree (associate’s through doctoral degrees) than non-STEM workers. The majority of workers in S&E occupations had a bachelor’s or an advanced degree (79%), higher than the shares of these degrees among workers in S&E-related (65%), STEM middle-skill (14%), and non-STEM (40%) occupations. A bachelor’s degree was the most common degree among workers in S&E (45%) and S&E-related (32%) occupations. For workers in STEM middle-skill occupations, 75% did not have a postsecondary degree.
| Occupational group | Up to high school | Some college, no degree | Associate's degree | Bachelor's degree | Master's or professional degree | Doctoral degree |
|---|---|---|---|---|---|---|
| STEM occupations | 22.8 | 15.3 | 11.7 | 27.8 | 18.4 | 4.0 |
| S&E occupations | 5.2 | 9.7 | 6.4 | 45.3 | 26.4 | 7.0 |
| S&E-related occupations | 7.6 | 11.5 | 15.7 | 31.5 | 28.1 | 5.6 |
| STEM middle-skill occupations | 51.2 | 23.4 | 11.4 | 11.2 | 2.7 | 0.2 |
| Non-STEM occupations | 32.2 | 19.5 | 8.7 | 24.6 | 13.6 | 1.4 |
STEM = science, technology, engineering, and mathematics.
Data include the employed, civilian, noninstitutionalized population ages 25–75 not currently in primary or secondary school. Missing occupations and those who have not worked in the past 5 years or have never worked are not included in the data. STEM includes S&E, S&E-related, and STEM middle-skill occupations.
Census Bureau, American Community Survey (ACS), 2023.
Science and Engineering Indicators
Relationship between Field of Study and Occupational Group
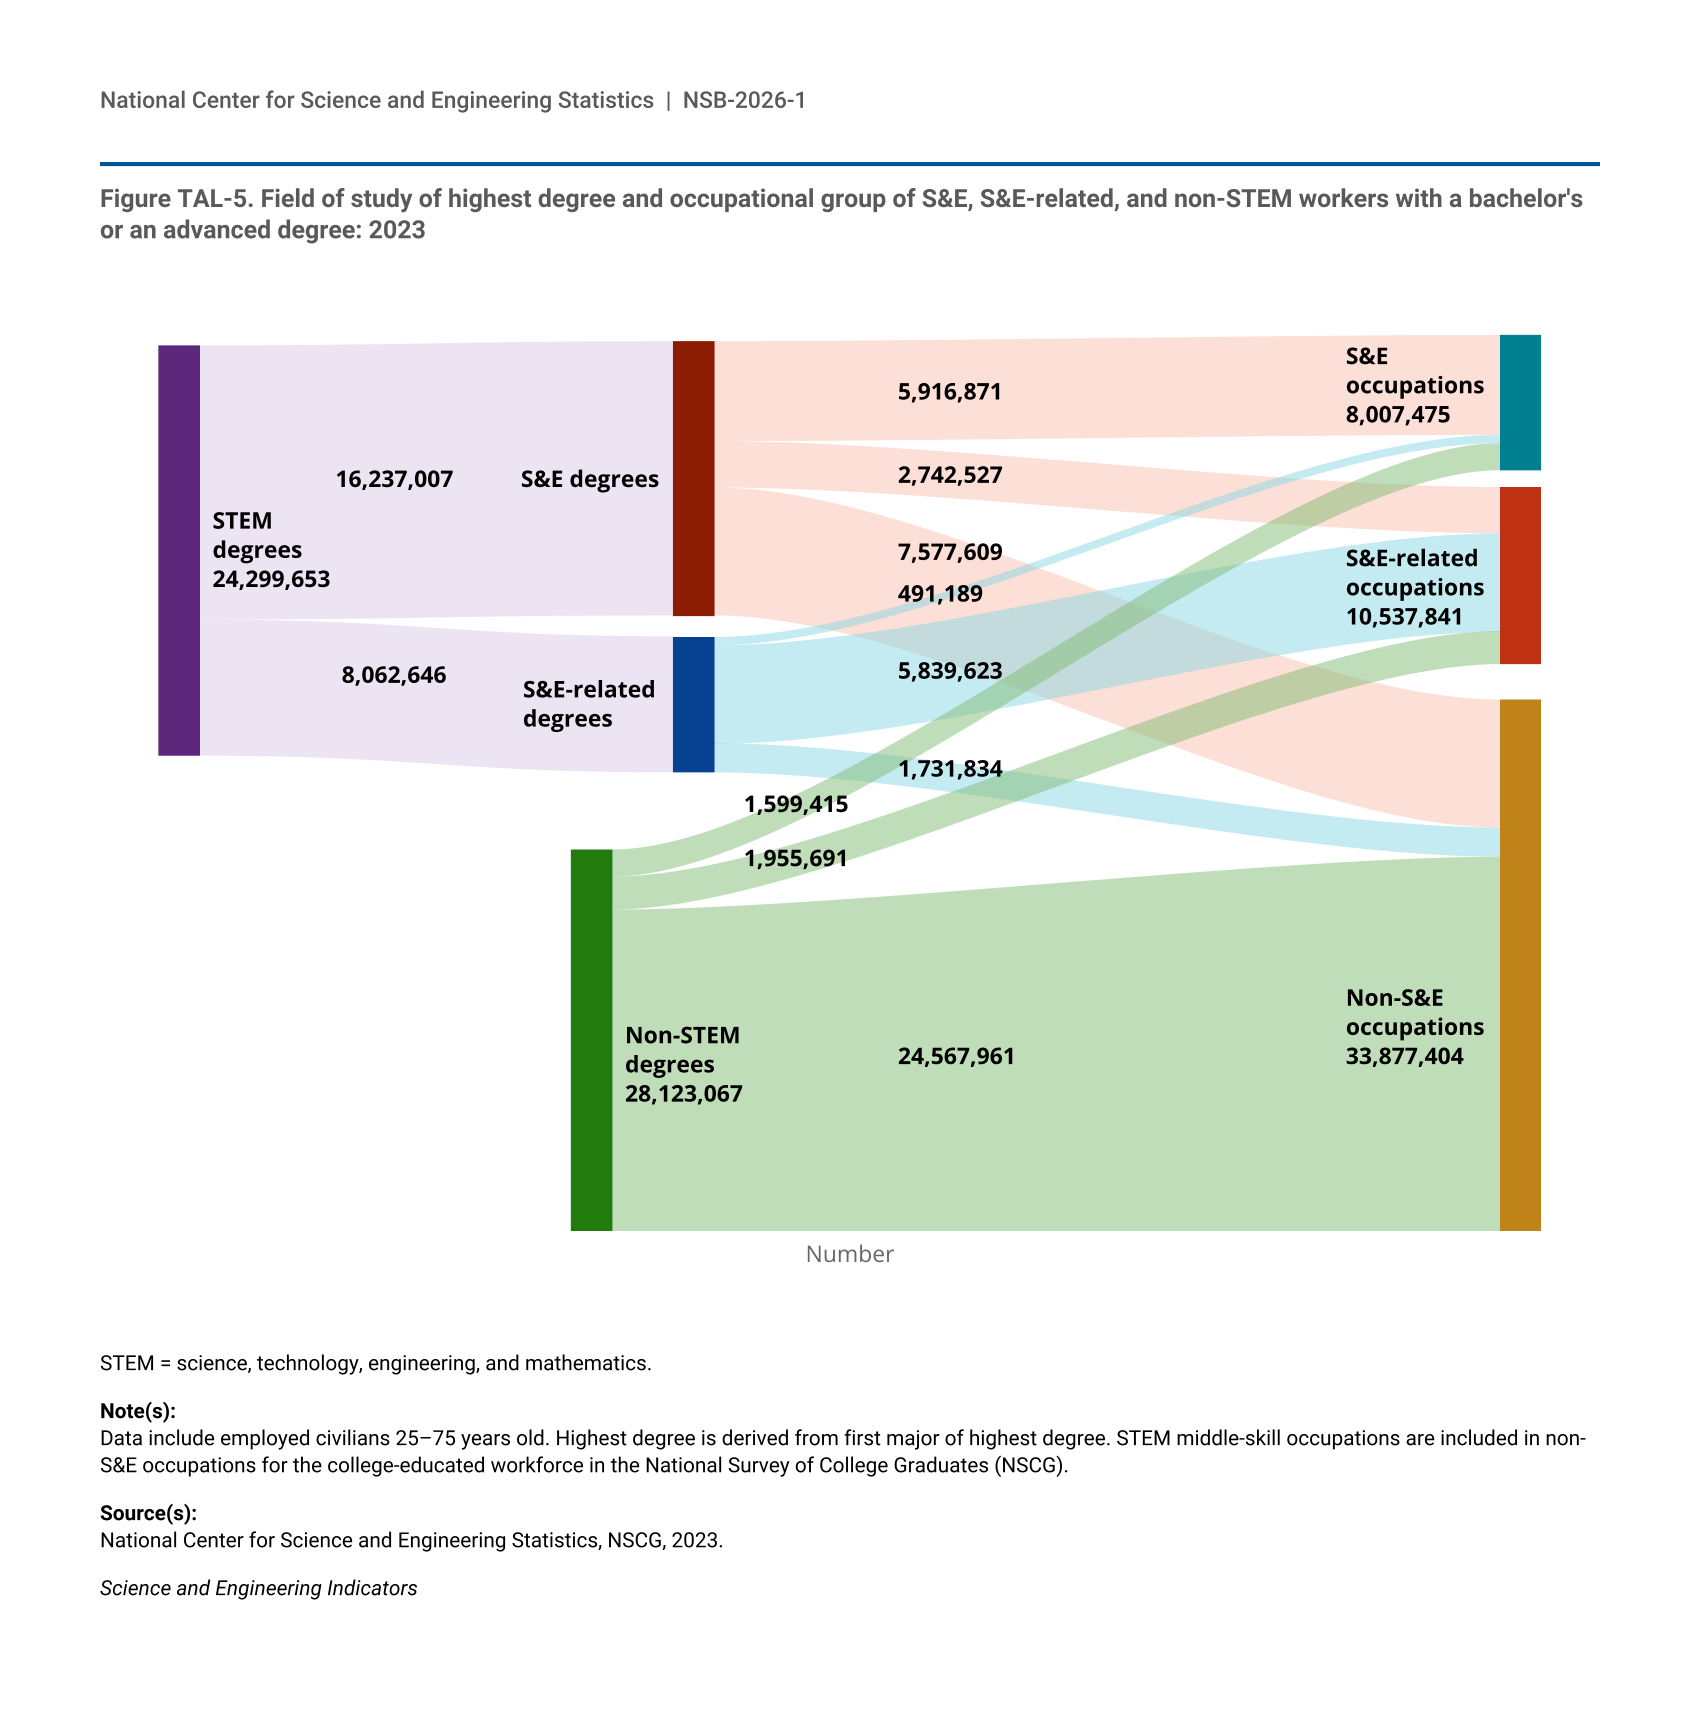
Workers in STEM occupations have diverse educational backgrounds, although most earned their degrees in STEM fields. Based on the National Survey of College Graduates (NSCG), 24 million college-educated workers had their highest degree in a STEM field in 2023, comprising 46% of the college-educated workforce (Figure TAL-5). Of those with their highest degree in a STEM field, about two-thirds (16.2 million) received their highest degree in an S&E field, and the other third (8.1 million) received S&E-related degrees. The college-educated workforce had 19 million workers in S&E and S&E-related occupations, with 8 million in S&E and 11 million in S&E-related occupations. Most S&E (80%) and S&E-related (81%) workers received STEM degrees. About a quarter of S&E workers (26%) did not receive their highest degree in an S&E field, and close to half (45%) of S&E-related workers did not receive their highest degree in an S&E-related field.
| Field of study and occupational group | Total |
|---|---|
| All fields of study | 52,422,719 |
| STEM degrees | 24,299,653 |
| STEM degrees, S&E degrees | 16,237,007 |
| STEM degrees, S&E degrees, S&E occupations | 5,916,871 |
| STEM degrees, S&E degrees, S&E-related occupations | 2,742,527 |
| STEM degrees, S&E degrees, non-S&E occupations | 7,577,609 |
| STEM degrees, S&E-related degrees | 8,062,646 |
| STEM degrees, S&E-related degrees, S&E occupations | 491,189 |
| STEM degrees, S&E-related degrees, S&E-related occupations | 5,839,623 |
| STEM degrees, S&E-related degrees, non-S&E occupations | 1,731,834 |
| Non-STEM degrees | 28,123,067 |
| Non-STEM degrees, S&E occupations | 1,599,415 |
| Non-STEM degrees, S&E-related occupations | 1,955,691 |
| Non-STEM degrees, non-S&E occupations | 24,567,961 |
STEM = science, technology, engineering, and mathematics.
Data include employed civilians 25–75 years old. Highest degree is derived from first major of highest degree. STEM middle-skill occupations are included in non-S&E occupations for the college-educated workforce in the National Survey of College Graduates (NSCG).
National Center for Science and Engineering Statistics, NSCG, 2023.
Science and Engineering Indicators
Labor Market Outcomes
Indicators of labor market conditions, such as unemployment rates and earnings, provide information on the economic value proposition of STEM occupations. STEM workers fare well in the labor market. Each year from 2013 to 2023, the unemployment rate of STEM workers was lower than that of non-STEM workers (Figure TAL-6; Table STAL-2). However, unemployment rates varied among STEM occupational groups. S&E and S&E-related workers consistently had lower unemployment rates than workers in STEM middle-skill occupations. The unemployment rate of workers in STEM middle-skill occupations was much closer to that of non-STEM workers. Between 2013 and 2016, the unemployment rate of workers in STEM middle-skill occupations was comparable to that of non-STEM workers. Since 2017, the unemployment rate of workers in non-STEM occupations exceeded that of STEM middle-skill workers.
| Year | STEM occupations | S&E occupations | S&E-related occupations | STEM middle-skill occupations | Non-STEM occupations |
|---|---|---|---|---|---|
| 2013 | 4.5 | 3.1 | 2.6 | 6.8 | 6.5 |
| 2014 | 3.8 | 2.7 | 2.4 | 5.5 | 5.4 |
| 2015 | 3.2 | 2.5 | 1.9 | 4.7 | 4.7 |
| 2016 | 2.8 | 2.2 | 1.7 | 4.1 | 4.3 |
| 2017 | 2.6 | 2.2 | 1.6 | 3.6 | 3.9 |
| 2018 | 2.3 | 2.1 | 1.5 | 3.2 | 3.7 |
| 2019 | 2.2 | 2.0 | 1.5 | 3.0 | 3.4 |
| 2020 | NA | NA | NA | NA | NA |
| 2021 | 3.4 | 2.5 | 2.1 | 5.2 | 5.7 |
| 2022 | 2.1 | 1.6 | 1.5 | 3.1 | 3.4 |
| 2023 | 2.1 | 2.0 | 1.4 | 3.0 | 3.3 |
STEM = science, technology, engineering, and mathematics.
Data include the civilian, noninstitutionalized population ages 25–75 not currently in primary or secondary school. Coding of occupations into STEM categories reflects changes to American Community Survey (ACS) occupation codes following the 2018 update to the Standard Occupational Classification implemented by the Bureau of Labor Statistics. Data from 2013 to 2017 use occupations from the 2010 occupation list, whereas data from 2018 to 2023 use occupations from the 2018 occupation list. Data for 2020 are not available due to the impact of the COVID-19 pandemic on ACS data collection for the survey year. Additional information is available at https://www.census.gov/programs-surveys/acs/data/experimental-data/2020-1-year-pums.html. STEM includes S&E, S&E-related, and STEM middle-skill occupations. Unemployment rate is defined as the number of unemployed individuals as a percentage of the number of individuals in the labor force (employed and unemployed).
Census Bureau, ACS, 2023.
Science and Engineering Indicators
Median Earnings in the Workforce
Overall, full-time, year-round workers in STEM occupations had higher median earnings ($76,000) than workers in non-STEM occupations ($55,000) in 2023 (Table TAL-2). Among STEM workers, S&E workers had the highest overall median earnings ($100,000) and the highest median earnings among all STEM occupational groups at each educational attainment level. STEM workers in STEM middle-skill occupations had the lowest overall earnings ($58,000) among STEM occupations. But at the educational attainment levels of up to a high school degree or equivalent, some college, and associate’s degree, their earnings exceeded the earnings of non-STEM workers. The difference in median earnings from associate’s to bachelor’s degrees was the smallest among workers in STEM middle-skill occupations, suggesting that workers in STEM middle-skill occupations did not see the same earnings premium for bachelor’s degrees that other occupational groups received. For all occupational groups, earnings increased with each degree level. The range in median earnings from up to a high school degree or equivalent to a doctoral degree was the greatest for workers in S&E-related occupations ($68,000) and was the smallest for workers in STEM middle-skill occupations ($40,000).
STEM = science, technology, engineering, and mathematics.
Data include the employed, civilian, noninstitutionalized population ages 25–75 not currently in primary or secondary school. Missing occupations and those who have not worked in the past 5 years or have never worked are not included in the workforce data. STEM includes S&E, S&E-related, and STEM middle-skill occupations.
Census Bureau, American Community Survey (ACS), 2023.
Science and Engineering Indicators
Geographic Distribution of STEM Workers
STEM workers are geographically concentrated in a few states. In 2023, the three states with the largest shares of the total working-age population of the Unites States—California, Texas, and Florida—were also the states with the largest shares of STEM workers (Table STAL-3, Table STAL-4). Together, these three states contributed to about a quarter (26%) of the nation’s STEM workforce.
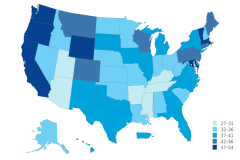
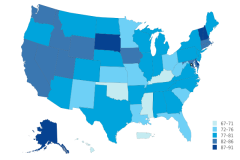
Participation in the STEM workforce varied by state. In 2023, between 20% and 30% of the workforce in each state was employed in STEM occupations. North Dakota and New Hampshire had the highest shares (30% each) of STEM workers in their workforce (Table STAL-4, Table STAL-5); the District of Columbia (23%), New York (22%), and Nevada (20%) had the lowest shares.
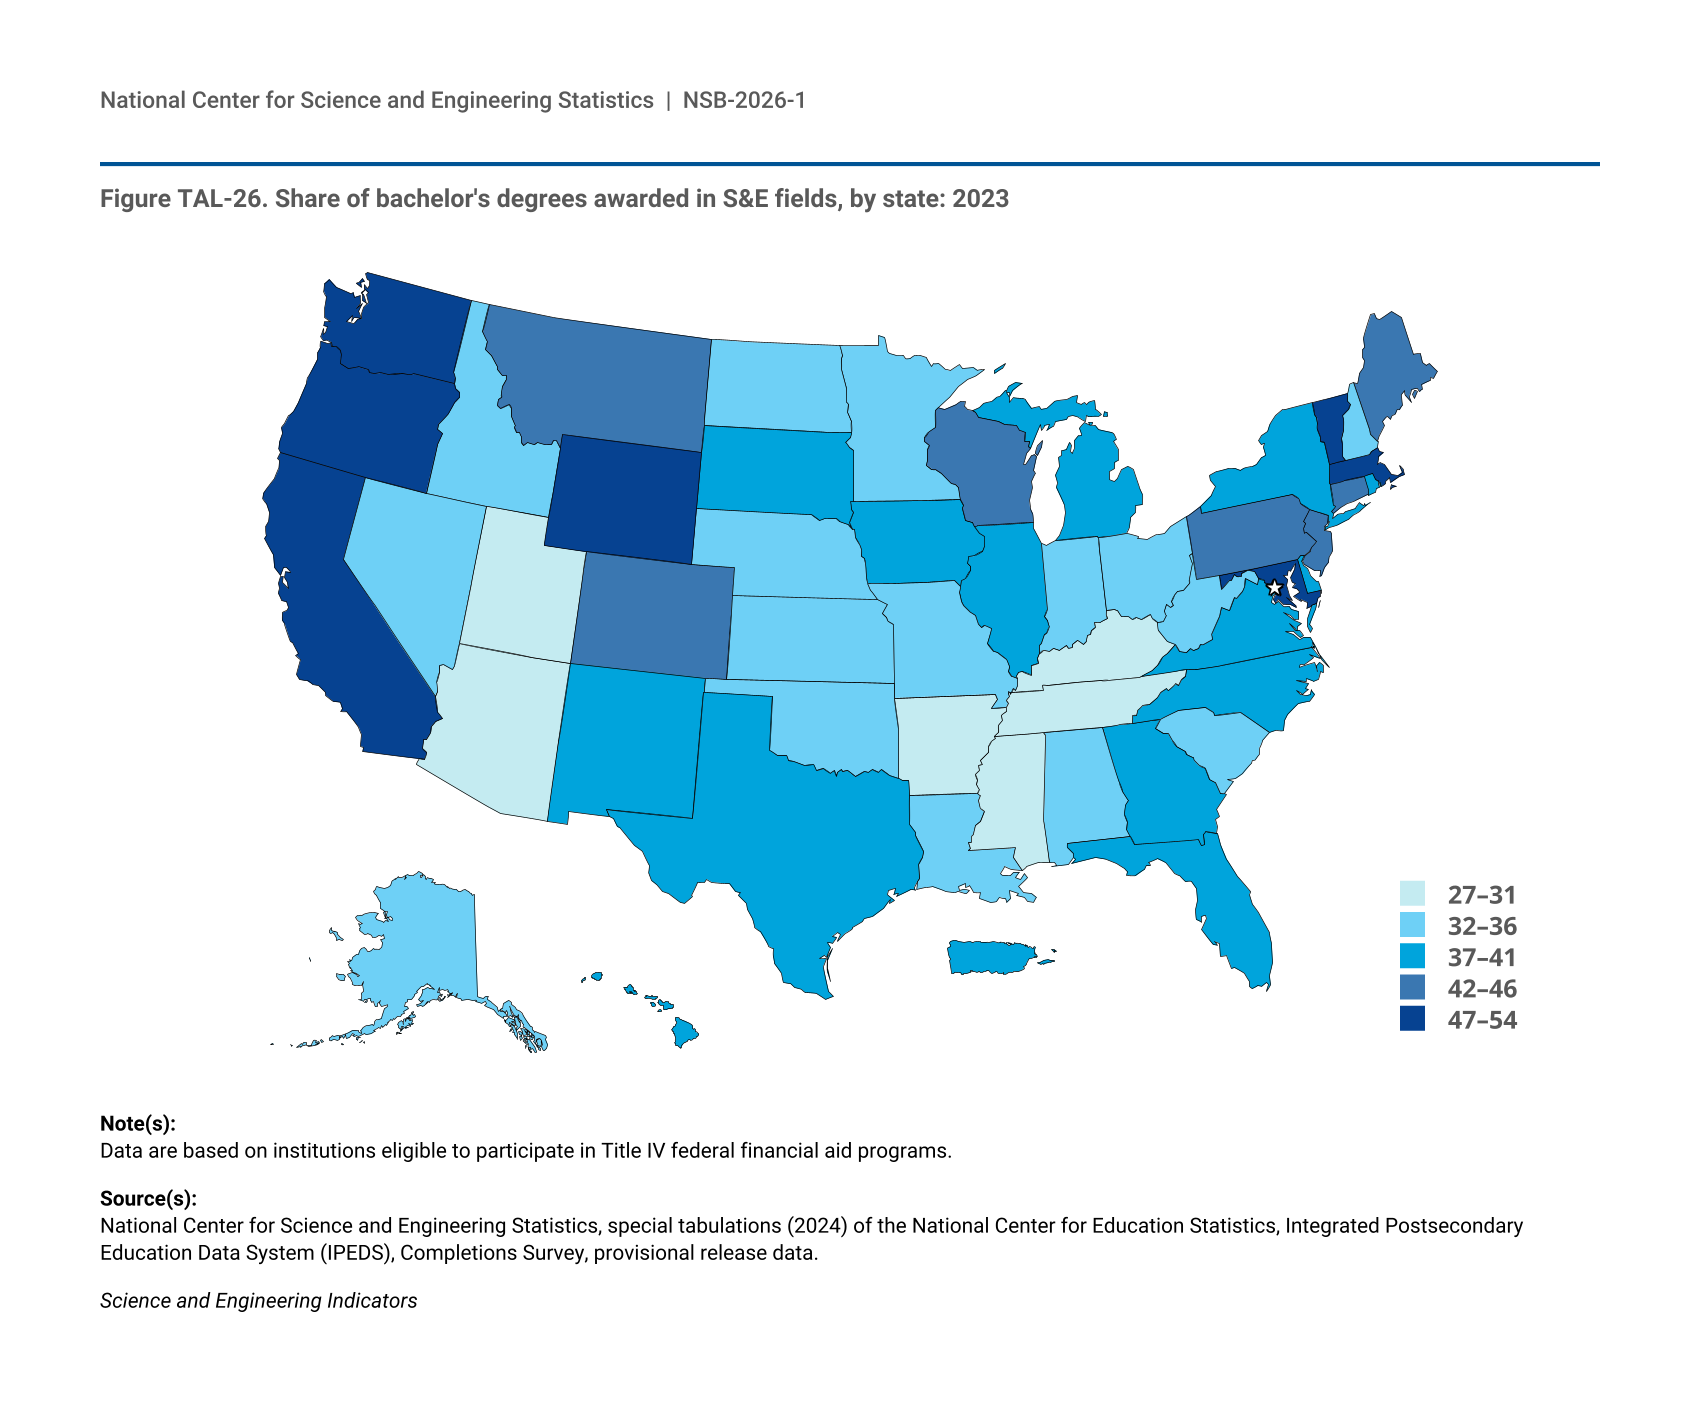
Differences in educational attainment for the STEM workforce existed across states. In 34 states, half or more of STEM workers did not have a bachelor’s degree (Table STAL-4, Table STAL-6). Mississippi had the largest share of STEM workers without a bachelor’s degree (64%). Sixteen states, plus the District of Columbia, had a STEM workforce in which the majority of workers had a bachelor’s or an advanced degree. Among these, the District of Columbia had the highest share of STEM workers with a bachelor’s or an advanced degree (88%), followed by Massachusetts (64%).
The STEM Workforce by Rural-Urban Classification
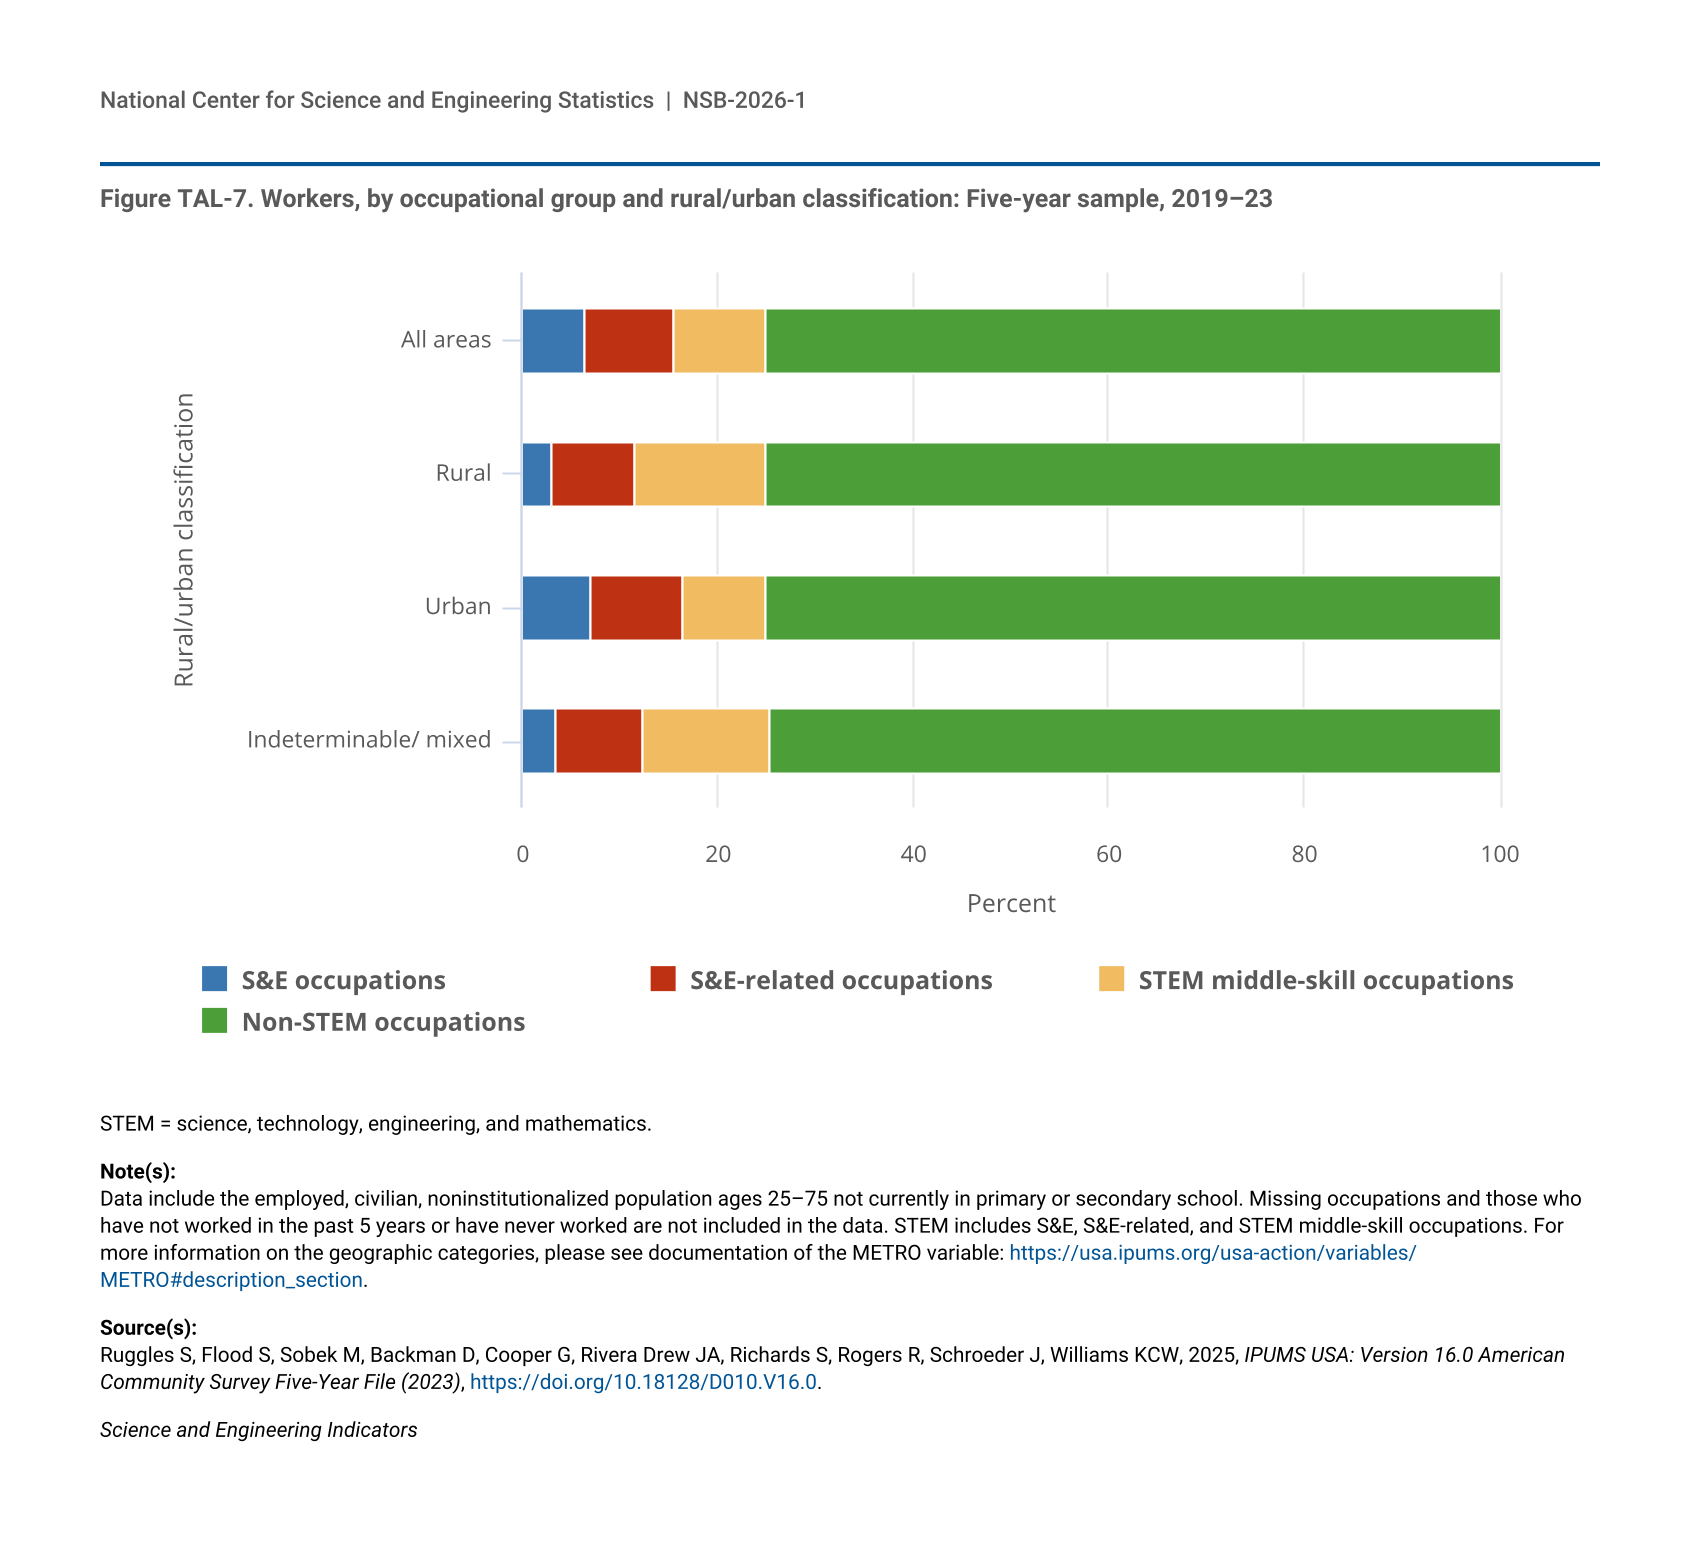
Equal proportions of rural and urban workers were employed in STEM occupations (25%), according to the American Community Survey (ACS) 5-Year File, 2023 (Figure TAL-7; Table STAL-7). Although the overall shares of STEM workers were comparable in rural and urban areas, the distribution of STEM occupational groups differed. In rural areas, STEM workers were concentrated in STEM middle-skill occupations (13%). In urban areas, 9% of the workers were in STEM middle-skill occupations. Workers in rural areas were the least prevalent in S&E occupations, comprising 3% of the overall workforce in rural areas, whereas 7% of the workers in urban areas were in S&E occupations.
| Rural/urban classification | S&E occupations | S&E-related occupations | STEM middle-skill occupations | Non-STEM occupations |
|---|---|---|---|---|
| All areas | 6.4 | 9.2 | 9.4 | 75.0 |
| Rural | 3.0 | 8.5 | 13.5 | 75.0 |
| Urban | 7.1 | 9.3 | 8.5 | 75.1 |
| Indeterminable/ mixed | 3.5 | 8.8 | 13.1 | 74.6 |
STEM = science, technology, engineering, and mathematics.
Data include the employed, civilian, noninstitutionalized population ages 25–75 not currently in primary or secondary school. Missing occupations and those who have not worked in the past 5 years or have never worked are not included in the data. STEM includes S&E, S&E-related, and STEM middle-skill occupations. For more information on the geographic categories, please see documentation of the METRO variable: https://usa.ipums.org/usa-action/variables/METRO#description_section.
Ruggles S, Flood S, Sobek M, Backman D, Cooper G, Rivera Drew JA, Richards S, Rogers R, Schroeder J, Williams KCW, 2025, IPUMS USA: Version 16.0 American Community Survey Five-Year File (2023), https://doi.org/10.18128/D010.V16.0.
Science and Engineering Indicators
Educational Attainment of STEM Workers in Rural and Urban Areas
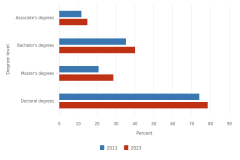
The prevalence of rural and urban workers in STEM occupations overall differed by educational attainment. STEM workers without a bachelor’s degree were more common in rural areas: 24% of rural workers without a bachelor’s degree were in STEM occupations compared to 21% of their counterparts in urban areas. STEM workers with a bachelor’s or an advanced degree were more common in urban areas: 30% of urban workers with a bachelor’s or an advanced degree were in STEM occupations, compared to 27% of their rural counterparts (Figure TAL-8; Table STAL-7). For each occupational group, however, the pattern between urban and rural areas was consistent across educational attainment groups. The urban workforce had higher shares of S&E workers in each educational attainment group. The pattern was reversed for workers in S&E-related and STEM middle-skill occupations—the rural workforce had higher shares of these workers relative to the urban workforce. Among workers with a bachelor’s or an advanced degree, the share of workers in STEM middle-skill occupations in rural areas (5%) was nearly double the urban share (3%).
| Classification and educational attainment | S&E occupations | S&E-related occupations | STEM middle-skill occupations | Non-STEM occupations |
|---|---|---|---|---|
| Rural, without a bachelor's degree | 1.4 | 6.0 | 16.6 | 75.9 |
| Rural, with a bachelor's degree or an advanced degree | 7.3 | 15.2 | 5.1 | 72.5 |
| Urban, without a bachelor's degree | 2.6 | 5.5 | 13.0 | 79.0 |
| Urban, with a bachelor's degree or an advanced degree | 12.8 | 14.2 | 2.8 | 70.1 |
| Indeterminable/ mixed, without a bachelor's degree | 1.7 | 6.2 | 16.4 | 75.6 |
| Indeterminable/ mixed, with a bachelor's degree or an advanced degree | 8.1 | 15.3 | 4.7 | 71.9 |
STEM = science, technology, engineering, and mathematics.
Data include the employed, civilian, noninstitutionalized population ages 25–75 not currently in primary or secondary school. Missing occupations and those who have not worked in the past 5 years or have never worked are not included in the data. STEM includes S&E, S&E-related, and STEM middle-skill occupations. For more information on the geographic categories, please see documentation of the METRO variable: https://usa.ipums.org/usa-action/variables/METRO#description_section.
Ruggles S, Flood S, Sobek M, Backman D, Cooper G, Rivera Drew JA, Richards S, Rogers R, Schroeder J, Williams KCW, 2025, IPUMS USA: Version 16.0 American Community Survey Five-Year File (2023), https://doi.org/10.18128/D010.V16.0.
Science and Engineering Indicators
Growth of the STEM Workforce
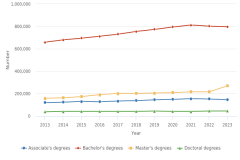
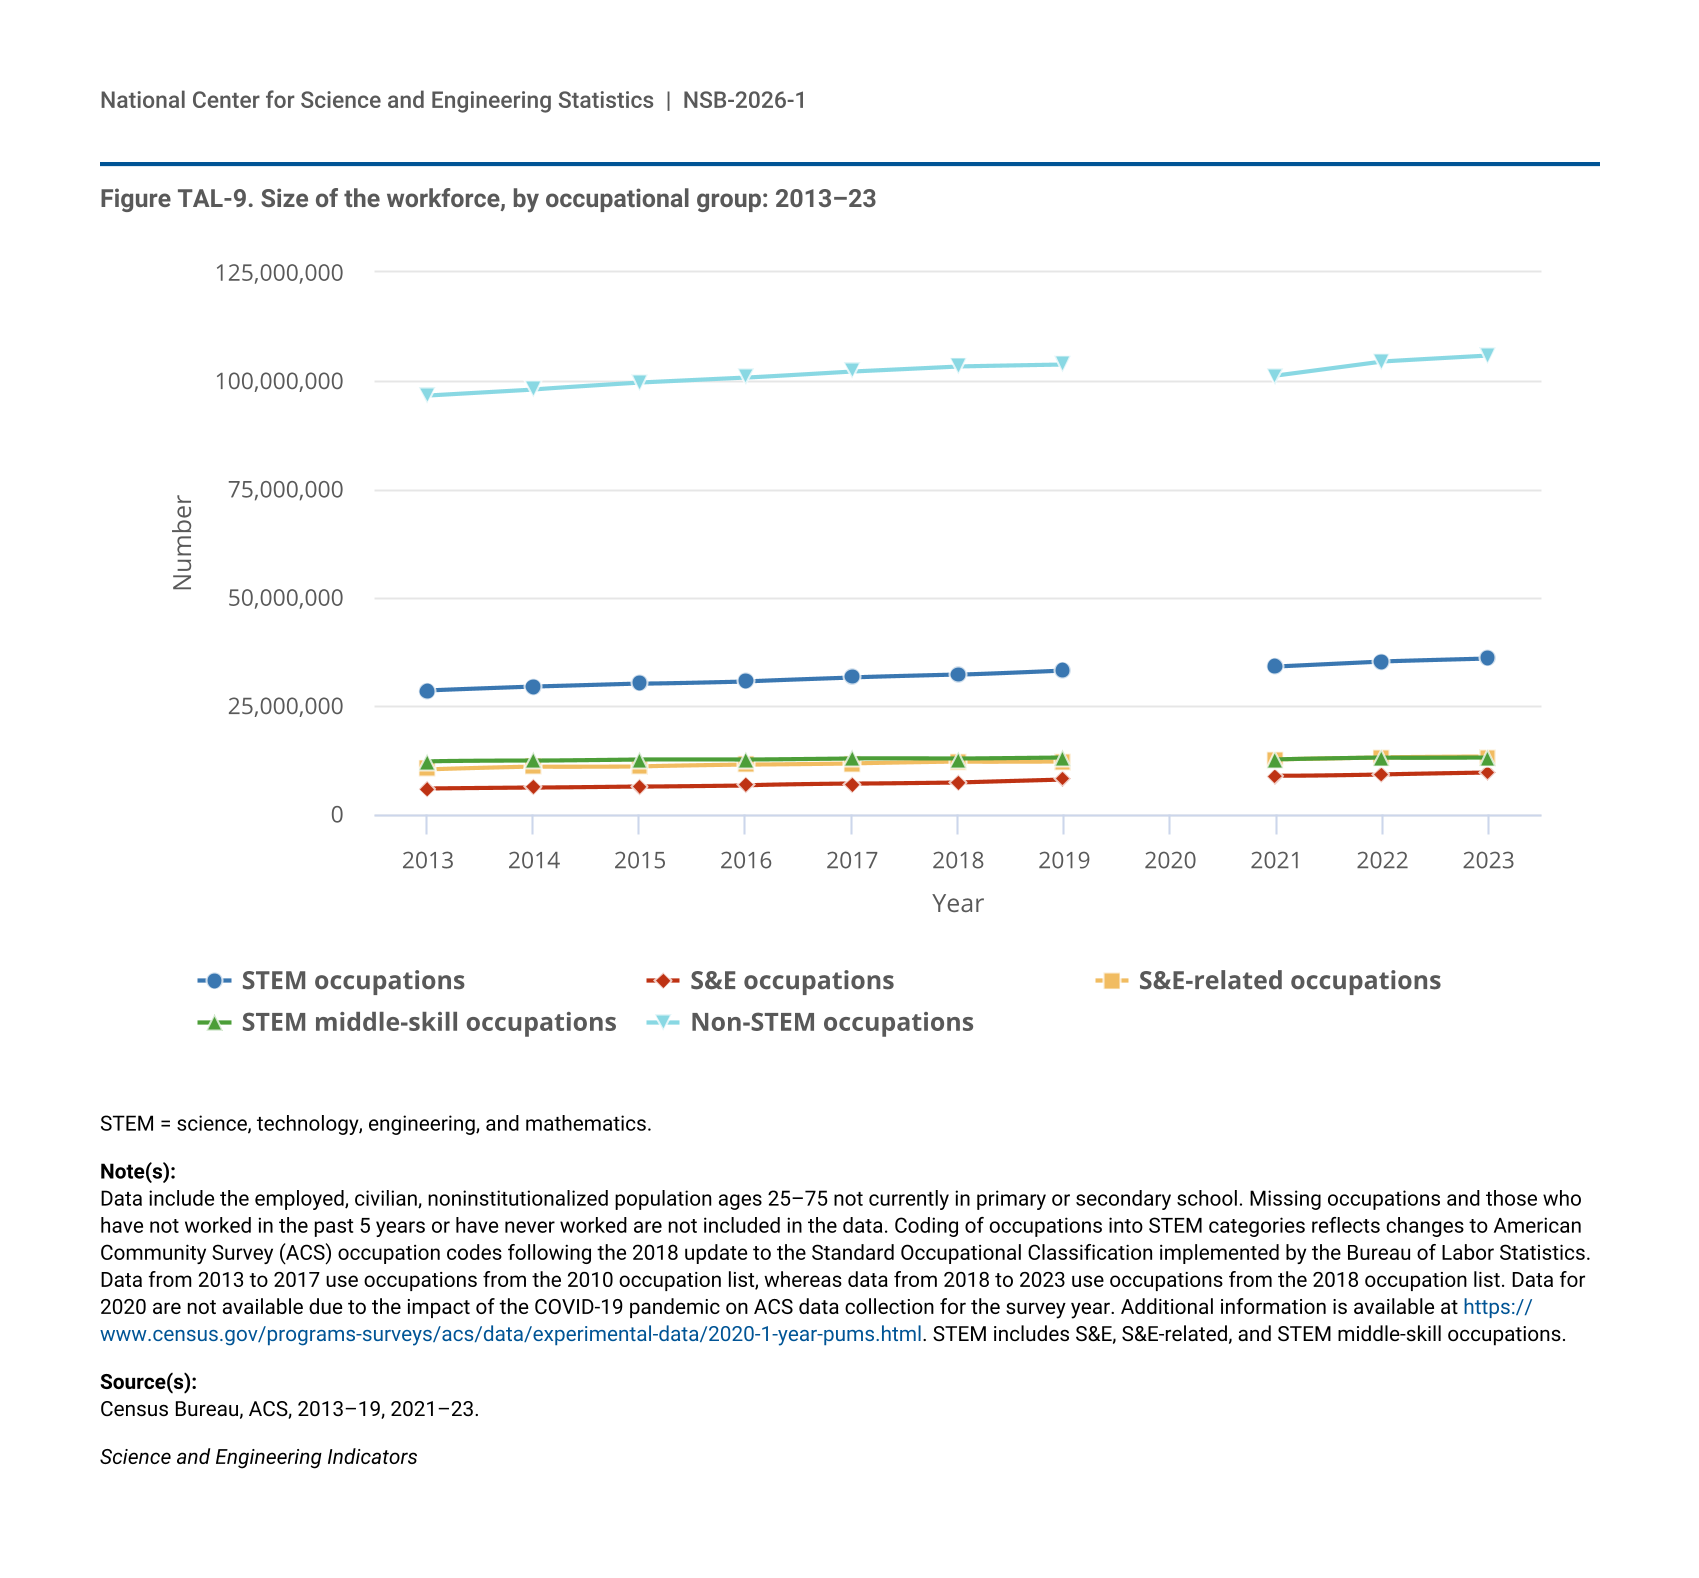
Between 2013 and 2023, employment in STEM occupations in the United States grew at a faster rate than non-STEM occupations. During this period, the STEM workforce increased by 26%, from 29 million to 36 million workers, whereas the non-STEM workforce increased by 9%, from 97 million to 106 million workers. The STEM workforce also increased as a share of the total workforce between 2013 (23%) and 2023 (25%). Within STEM occupations, the number of workers employed in S&E occupations increased most (63%) during this period, followed by S&E-related occupations (27%) and STEM middle-skill occupations (7%) (Figure TAL-9).
| Year | STEM occupations | S&E occupations | S&E-related occupations | STEM middle-skill occupations | Non-STEM occupations |
|---|---|---|---|---|---|
| 2013 | 28,527,222 | 5,914,203 | 10,383,818 | 12,229,201 | 96,705,952 |
| 2014 | 29,379,696 | 6,124,521 | 10,959,834 | 12,295,341 | 98,086,960 |
| 2015 | 30,091,124 | 6,400,969 | 11,091,266 | 12,598,889 | 99,598,168 |
| 2016 | 30,689,527 | 6,698,995 | 11,440,888 | 12,549,644 | 100,749,699 |
| 2017 | 31,534,645 | 6,968,513 | 11,745,296 | 12,820,836 | 102,201,782 |
| 2018 | 32,128,434 | 7,274,871 | 12,129,826 | 12,723,737 | 103,368,462 |
| 2019 | 33,189,074 | 7,951,262 | 12,253,149 | 12,984,663 | 103,785,336 |
| 2020 | NA | NA | NA | NA | NA |
| 2021 | 34,126,859 | 8,820,194 | 12,707,771 | 12,598,894 | 101,168,470 |
| 2022 | 35,287,039 | 9,250,614 | 13,089,698 | 12,946,727 | 104,402,154 |
| 2023 | 35,930,326 | 9,647,441 | 13,208,930 | 13,073,955 | 105,756,786 |
STEM = science, technology, engineering, and mathematics.
Data include the employed, civilian, noninstitutionalized population ages 25–75 not currently in primary or secondary school. Missing occupations and those who have not worked in the past 5 years or have never worked are not included in the data. Coding of occupations into STEM categories reflects changes to American Community Survey (ACS) occupation codes following the 2018 update to the Standard Occupational Classification implemented by the Bureau of Labor Statistics. Data from 2013 to 2017 use occupations from the 2010 occupation list, whereas data from 2018 to 2023 use occupations from the 2018 occupation list. Data for 2020 are not available due to the impact of the COVID-19 pandemic on ACS data collection for the survey year. Additional information is available at https://www.census.gov/programs-surveys/acs/data/experimental-data/2020-1-year-pums.html. STEM includes S&E, S&E-related, and STEM middle-skill occupations.
Census Bureau, ACS, 2013–19, 2021–23.
Science and Engineering Indicators
Growth of the STEM Workforce by State
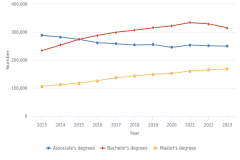
Between 2013 and 2023, the share of the total workforce in each state and the District of Columbia employed in STEM occupations increased but varied widely among jurisdictions. Among states, the largest increases in the share of STEM workers between 2013 and 2023 were in North Dakota and Washington State (about 5 percentage points)—from 25% to 30% in North Dakota and 25% to 29% in Washington State (Table TAL-3; Table STAL-8). The smallest increase in the share of workers in STEM occupations was in Louisiana: 24% of its workforce was employed in STEM occupations in 2013 and 25% in 2023.
NA = not available.
STEM = science, technology, engineering, and mathematics.
Data include the employed, civilian, noninstitutionalized population ages 25–75 not currently in primary or secondary school. Missing occupations and those who have not worked in the past 5 years or have never worked are not included in the data. Coding of occupations into STEM categories reflects changes to American Community Survey (ACS) occupation codes following the 2018 update to the Standard Occupational Classification implemented by the Bureau of Labor Statistics. Data from 2013 to 2017 use occupations from the 2010 occupation list, while data from 2018 to 2023 use occupations from the 2018 occupation list. Data for 2020 are not available due to the impact of the COVID-19 pandemic on ACS data collection for the survey year. Additional information is available at https://www.census.gov/programs-surveys/acs/data/experimental-data/2020-1-year-pums.html. STEM includes S&E, S&E-related, and STEM middle-skill occupations.
Census Bureau, ACS, 2013–19, 2021–23.
Science and Engineering Indicators
STEM Employment Growth Projections
Employment projections are indicators that provide insight into how the labor market might expand or contract. According to employment projections from the Bureau of Labor Statistics (BLS 2025c), general employment is projected to grow by 5.2 million jobs between 2024 and 2034, or 3%, with employment in STEM occupations projected to grow by 6% (Figure TAL-10). S&E occupations are expected to grow by 9% during this period, the fastest among STEM occupations, followed by S&E-related (8%) and STEM middle-skill occupations (3%).
| Occupational group | 2024 | 2034 |
|---|---|---|
| All | 169,956.4 | 175,169.9 |
| STEM occupations | 37,112.7 | 39,496.7 |
| S&E occupations | 8,757.3 | 9,531.8 |
| S&E-related occupations | 13,654.1 | 14,753.0 |
| STEM middle-skill occupations | 14,701.3 | 15,211.9 |
| Non-STEM occupations | 132,843.7 | 135,673.2 |
STEM = science, technology, engineering, and mathematics.
Estimates of current and projected employment for 2024–34 are from the Bureau of Labor Statistics (BLS) National Employment Matrix; estimates in the matrix are developed using data from the Occupational Employment and Wage Statistics (OEWS) program and the Current Population Survey (CPS). Together, these sources cover paid workers and self-employed workers in all industries, agriculture, and private households. Because data are derived from multiple sources, they can often differ from employment data provided by OEWS, CPS, or other employment surveys alone. BLS does not make projections for S&E occupations as a group, nor does it do so for some of the S&E and S&E-related occupational categories as defined by the National Center for Science and Engineering Statistics (NCSES); numbers in the figure are based on the sum of BLS projections for occupations that NCSES includes in the respective categories. The STEM classifications used here differ slightly from those used in the American Community Survey due to additional occupation detail in the projections tabulations. A crosswalk will be provided upon request.
BLS, special tabulations (2025) of the 2024–34 Employment Projections.
Science and Engineering Indicators
Within S&E occupations, employment in data science is projected to have the highest (34%) growth between 2024 and 2034, followed by information security analysis (29%) and operations research analysts (21%) (Table STAL-9). The numbers of workers employed in network and computer system administration and in survey research are expected to decline the most (4% and 6%, respectively) by 2034. Within S&E-related occupations, the largest growth is expected in the numbers of workers employed as nurse practitioners (40%), medical and health services managers (23%), and actuaries (22%), and the largest decline is expected in the numbers of workers employed as computer programmers (6%), mechanical drafters (7%), all other drafters (7%), and nuclear technicians (8%). Employment is expected to grow the most by 2034 in two STEM middle-skill occupations: wind turbine service technicians and solar photovoltaic installers are projected to grow by 51% and 42%, respectively. However, nearly a third (33 of 104 STEM middle-skill occupations) of the STEM middle-skill occupational categories are projected to have no growth or to decline in employment during this period.
Foreign-Born STEM Workers in the United States
Overall Foreign-Born STEM Workforce
The U.S. STEM economy has become increasingly reliant on foreign-born talent, and these workers are widely considered to be crucial in maintaining the nation’s competitiveness in the S&E enterprise (NSB 2020b). Foreign-born workers are defined as those born outside of the United States and its territories, regardless of citizenship status. Foreign-born workers are more highly represented in the U.S. STEM workforce than in the general workforce. In 2023, 29 million of the 142 million workers in the United States were foreign born, accounting for 20% of the general workforce (Table TAL-4; Table STAL-1). Of the 36 million STEM workers in the United States, 8 million were foreign born, accounting for 22% of the STEM workforce. Among foreign-born STEM workers, 34% were employed in S&E occupations, 31% in S&E-related occupations, and 35% in STEM middle-skill occupations. In comparison, 25% of U.S.-born STEM workers were employed in S&E occupations, 38% in S&E-related occupations, and 37% in STEM middle-skill occupations.
STEM = science, technology, engineering, and mathematics.
Data include the employed, civilian, noninstitutionalized population ages 25–75 not currently in primary or secondary school. Missing occupations and those who have not worked in the past 5 years or have never worked are not included in the workforce data. STEM includes S&E, S&E-related, and STEM middle-skill occupations.
Census Bureau, American Community Survey (ACS), 2023.
Science and Engineering Indicators
Region, Country, or Economy of Origin of Foreign-Born Workers
In 2023, the two largest countries or economies of origin for foreign-born STEM workers in the United States were Mexico (1.3 million) and India (1.0 million), which combined to represent 31% of all foreign-born STEM workers in the United States (Table TAL-5). Among S&E workers, 45% of the foreign-born workforce was from three countries: India (727,625), China (309,759), and Mexico (128,863). For the 2.4 million foreign-born S&E-related workers in the United States, the Philippines (315,520), India (272,039), and Mexico (151,931) were the three top countries or economies of origin, accounting for 31% of all foreign-born workers in this category. Workers born in Mexico accounted for 38% of all foreign-born workers employed in STEM middle-skill occupations (1.1 million of 2.8 million total). All other countries or economies of origin each contributed 5% or less of the share of foreign-born workers in STEM middle-skill occupations.
STEM = science, technology, engineering, and mathematics.
Data include the employed, civilian, noninstitutionalized population ages 25–75 not currently in primary or secondary school. Missing occupations and those who have not worked in the past 5 years or have never worked are not included in the workforce data. STEM includes S&E, S&E-related, and STEM middle-skill occupations.
Census Bureau, American Community Survey (ACS), 2023.
Science and Engineering Indicators
Citizenship Status of STEM Workers
In 2023, most (54%) foreign-born STEM workers from the top 30 countries or economies of origin were U.S. citizens, and most of the foreign-born U.S. citizen STEM workers were naturalized citizens (Table TAL-6). Foreign-born STEM workers from Vietnam, Jamaica, Poland, and the Philippines had the highest shares of naturalized citizens among their foreign-born populations. Mexico and India were the top two countries of origin for foreign-born STEM workers, and the majority of the workers from Mexico (64%) and India (59%) were not U.S. citizens.
STEM = science, technology, engineering, and mathematics.
Data include the employed, civilian, noninstitutionalized population ages 25–75 not currently in primary or secondary school. Missing occupations and those who have not worked in the past 5 years or have never worked are not included in the workforce data. STEM includes S&E, S&E-related, and STEM middle-skill occupations.
Census Bureau, American Community Survey (ACS), 2023.
Science and Engineering Indicators
Pathways to STEM Occupations
Credentialing: Certificates and Licenses
A postsecondary degree in a STEM field is the most common path to employment in a STEM occupation. However, not all STEM occupations require a STEM degree as a condition of employment. Nondegree training, such as career and technical education and apprenticeships that lead to credentialing, is another path to STEM employment. There are three main types of work credentials: educational certificates, professional certifications, and licenses. Educational certificates are typically awarded by an educational institution, such as a community college, and indicate the completion of a program of study. Professional certifications indicate that the worker possesses certain skills, abilities, or specializations and are awarded by independent organizations that are often associated with a particular industry or profession (BLS n.d.). Some workers who may have professional certifications are project managers, software developers, and financial analysts (BLS 2019). Licenses are issued by a government agency and convey a legal authority to perform an occupation (BLS 2019). Licenses are prevalent in healthcare, legal, and educational occupations.
Many workers who obtain credentials realize economic and employment benefits. In general, workers with credentials enjoy wage premiums and lower rates of unemployment than workers without credentials (BLS 2025a, 2025b). Credentials, such as occupational licenses, may be a job market signal to employers of the worker’s readiness for employment, level of technical training, and productivity (BLS 2019, 2023).
Data from the 2024 Census Bureau’s Survey of Income and Program Participation (SIPP) was used to analyze the distribution of credentials among STEM workers. The SIPP is a longitudinal survey, and the 2024 survey in general uses 2023 as the reference year for monthly data collection (Census Bureau 2025b). Estimates below are presented from month 12 of the reference year among respondents ages 25–75 years that had at least a high school diploma or GED.
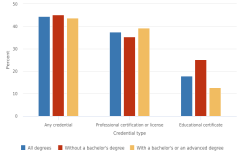
Based on the 2024 SIPP data, 44% (16 million) of workers in the STEM workforce held a credential, with comparable proportions of STEM workers without a bachelor’s degree holding a credential (45%) as those with a bachelor’s or an advanced degree (44%) (Figure TAL-11; Table STAL-10). When credential type was considered, a slightly higher proportion of STEM workers with a bachelor's or an advanced degree held a professional certification or license (39%) than those without a bachelor’s degree (35%). The opposite was true for educational certificates, where a much higher share of STEM workers without a bachelor’s degree held an educational certificate than STEM workers with a bachelor’s or an advanced degree (25% vs. 13%), and this pattern held across all occupational groups (Table STAL-10). Within STEM occupations, a much higher share of S&E-related workers held any credential (66%) than S&E workers (28%) or workers in STEM middle-skill occupations (38%).
| Credential type | All degrees | Without a bachelor's degree | With a bachelor's or an advanced degree |
|---|---|---|---|
| Any credential | 44.4 | 45.1 | 43.8 |
| Professional certification or license | 37.5 | 35.3 | 39.2 |
| Educational certificate | 17.9 | 25.1 | 12.6 |
STEM = science, technology, engineering, and mathematics.
Data include the employed, civilian, noninstitutionalized population ages 25–75 with at least a high school diploma or GED employed in the 12th month of 2023 and exclude those with only military occupations, those missing occupation data or who have not worked in the last 5 years, and those currently enrolled in primary or secondary school. Non-STEM occupations are not shown.
Census Bureau, Survey of Income and Program Participation (SIPP), Public-Use File, 2024.
Science and Engineering Indicators
Degree-Based Estimate of STEM Talent
The STEM workforce in this report is defined by the worker’s occupation, which captures only those who are in the labor force. However, not all STEM-trained individuals enter the labor force, and not all members of the STEM-trained workforce work in STEM occupations. This section uses a degree-based definition to provide insight into the number of individuals with S&E and S&E-related training.
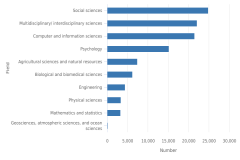
In 2023, close to half (46%, 31 million) of the 25- to 75-year-old college-educated population with a bachelor’s or an advanced degree had earned their highest degree in a STEM field (Table TAL-7). Of these individuals, about two-thirds (21 million) were in S&E fields and one-third (10 million) in S&E-related fields. Among S&E fields, social and related science was the most prevalent field of study (36%, 7 million), and physical and related sciences the least (5%, 1 million).
STEM = science, technology, engineering, and mathematics.
Data include civilians 25–75 years old.
National Center for Science and Engineering Statistics, National Survey of College Graduates (NSCG), 2023.
Science and Engineering Indicators
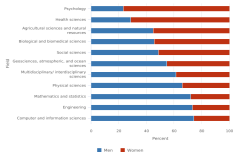
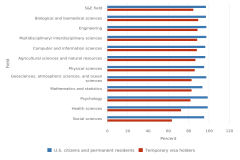
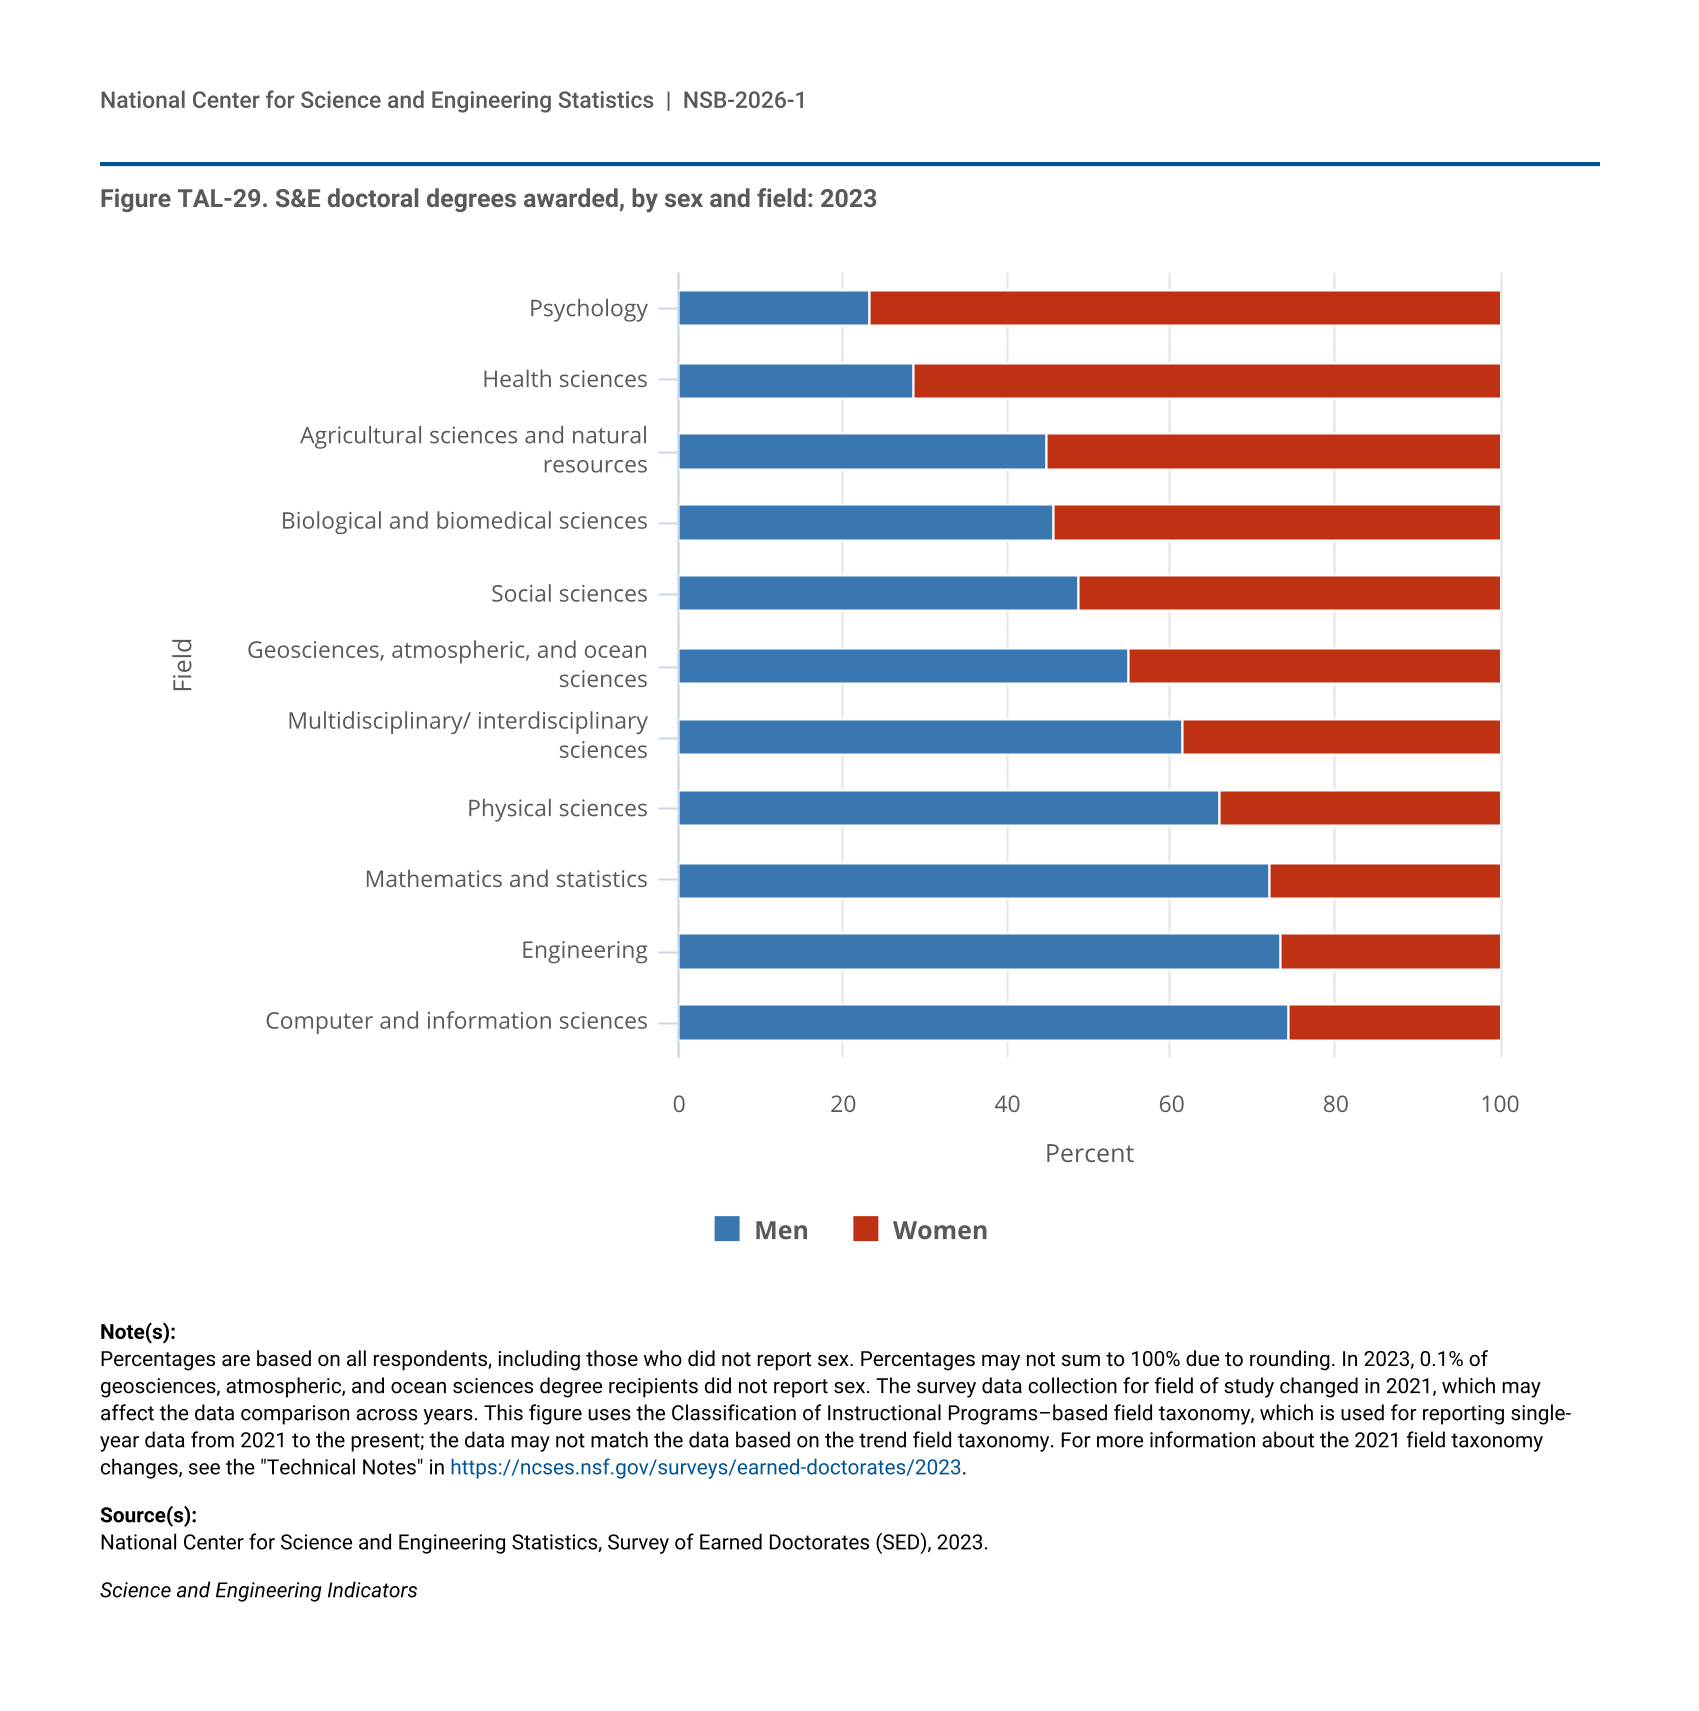
Slightly more women with a bachelor’s or an advanced degree (51%) earned their highest degree in a STEM field than men with a bachelor’s or an advanced degree (49%) in 2023 (Figure TAL-12; Table STAL-11). Although men were the majority (58%) of those with highest degrees in S&E fields, women were the majority (65%) of those with highest degrees in S&E-related fields. Within S&E fields, more men than women earned their highest degrees in engineering (83%), computer and mathematical sciences (70%), and physical and related sciences (69%), whereas more women than men earned their highest degrees in social and related sciences (60%) and biological, agricultural, and environmental life sciences (53%). Women with a bachelor’s or an advanced degree in 2023 also earned the majority of the highest degrees in non-STEM fields (59%) relative to men (41%).
| Field of study | Women | Men |
|---|---|---|
| All highest degrees | 54.3 | 45.7 |
| Highest degree in a STEM field | 49.2 | 50.8 |
| Highest degree in an S&E field | 41.6 | 58.4 |
| Computer and mathematical sciences | 30.2 | 69.8 |
| Biological, agricultural, and environmental life sciences | 53.0 | 47.0 |
| Physical and related sciences | 30.7 | 69.3 |
| Social and related sciences | 59.9 | 40.1 |
| Engineering | 17.3 | 82.7 |
| Highest degree in S&E-related field | 64.7 | 35.3 |
| Highest degree in non-STEM field | 58.6 | 41.4 |
| Field of study | Asian | American Indian or Alaska Native | Black or African American | Hispanic or Latino | White | Native Hawaiian or Other Pacific Islander | More than one race |
|---|---|---|---|---|---|---|---|
| All highest degrees | 10.6 | 0.2 | 7.9 | 10.0 | 68.7 | 0.1 | 2.5 |
| Highest degree in a STEM field | 14.8 | 0.2 | 7.0 | 9.7 | 65.6 | 0.1 | 2.6 |
| Highest degree in an S&E field | 15.5 | 0.2 | 6.5 | 10.1 | 64.9 | 0.1 | 2.8 |
| Computer and mathematical sciences | 25.1 | 0.1 | 7.2 | 9.7 | 55.5 | 0.1 | 2.5 |
| Biological, agricultural, and environmental life sciences | 12.7 | 0.2 | 5.1 | 9.7 | 69.2 | 0.0 | 3.0 |
| Physical and related sciences | 12.9 | 0.1 | 3.7 | 7.2 | 73.6 | 0.1 | 2.4 |
| Social and related sciences | 7.0 | 0.3 | 8.8 | 11.1 | 69.3 | 0.2 | 3.4 |
| Engineering | 23.0 | 0.1 | 3.9 | 9.9 | 60.9 | 0.1 | 2.1 |
| Highest degree in S&E-related field | 13.4 | 0.2 | 8.0 | 8.8 | 67.2 | 0.2 | 2.3 |
| Highest degree in non-STEM field | 7.2 | 0.2 | 8.7 | 10.3 | 71.2 | 0.1 | 2.3 |
STEM = science, technology, engineering, and mathematics.
Data include civilians 25–75 years old. Hispanic or Latino may be any race; race categories exclude Hispanic origin.
National Center for Science and Engineering Statistics, National Survey of College Graduates (NSCG), 2023.
Science and Engineering Indicators
White college-educated individuals comprised the majority of highest degree awardees in each field in 2023 (Figure TAL-12; Table STAL-11). Among all other demographic groups, composition varied by field. In S&E fields, specifically, Asian college-educated individuals were the second-most prevalent ethnic group after White college-educated individuals in all fields (ranging from 13% in both biological, agricultural, and environmental sciences and physical and related sciences to 25% in computer and mathematical sciences), except in social and related sciences. Within S&E fields, Hispanic (11%) and Black (9%) college-educated individuals were the second- and third-most prevalent demographic group, respectively, in social and related sciences. American Indian and Alaska Native college-educated individuals and Native Hawaiian and Other Pacific Islander college-educated individuals made up between 0.1% and 0.3% of college-educated individuals across all fields. College-educated individuals that reported more than one race represented between 2% and 3% of college-educated individuals across all fields.
STEM Workers in the Economy
All major industrial sectors of the U.S. economy employ STEM talent but at differing rates. In 2023, the health care and social assistance sector (47%) and the utilities sector (46%) employed the highest shares of STEM workers among major industrial sectors (Table TAL-8; Table STAL-1). Major industries differed in the shares of workers in S&E, S&E-related, and STEM middle-skill occupations that they employed. The professional, scientific, and technical services sector and the information sector employed the highest shares of S&E workers, with 26% and 17% of their respective workforce in S&E occupations. The health care and social assistance sector employed the highest share of S&E-related workers, accounting for 43% of its workforce. The construction sector (37%) and the agriculture, forestry, fishing, and hunting sector (35%) employed the highest shares of STEM workers in STEM middle-skill occupations.
STEM = science, technology, engineering, and mathematics.
Data include the employed, civilian, noninstitutionalized population ages 25–75 not currently in primary or secondary school. Missing occupations and those who have not worked in the past 5 years or have never worked are not included in the workforce data. STEM includes S&E, S&E-related, and STEM middle-skill occupations.
Census Bureau, American Community Survey (ACS), 2023.
Science and Engineering Indicators
The health care and social assistance sector also had the largest STEM workforce (9.6 million workers), accounting for over a quarter (27%) of the total STEM workforce. The top five industrial sectors by size of their workforces employed in STEM occupations—health care and social assistance; manufacturing; professional, scientific, and technical services; construction; and public administration—jointly accounted for 72% of the total STEM workforce in the United States.
Industrial Sectors and the Foreign-Born STEM Workforce
Foreign-born STEM workers are more prevalent in some major industrial sectors than the overall STEM workforce. Of the major industrial sectors where the share of workers employed in STEM occupations was greater than the average across all industries (25%), the professional, scientific, and technical services sector, the construction sector, and the information sector had the highest shares of STEM workers who were foreign born (27%, 27%, and 25%, respectively), and each had high shares of noncitizen STEM workers in the STEM workforce relative to other sectors with higher than average shares of STEM workers (12%, 18%, and 12%, respectively) (Table TAL-8, Table TAL-9; Table STAL-12). The proportions of foreign-born STEM workers in these three industrial sectors who were U.S. citizens (through birth or naturalization) relative to noncitizens differed, with native-born and naturalized U.S. citizens making up 34% of the STEM workers in construction, 51% of the STEM workers in information, and 54% of the STEM workers in professional, scientific, and technical services. Among the two largest major industrial sectors with high shares of STEM workers—health care and social assistance and utilities—foreign-born STEM workers made up 18% and 13%, respectively, of the STEM workforce (Table TAL-8, Table TAL-9). Within the foreign-born population in these industries, 78% were U.S. citizens in health care and social assistance and 65% in utilities. Over 70% of the foreign-born STEM workers in public administration (72%) and in health care and social assistance (71%) were naturalized citizens—the highest across all major industries.
STEM = science, technology, engineering, and mathematics.
Data include the employed, civilian, noninstitutionalized population ages 25–75 not currently in primary or secondary school. Missing occupations and those who have not worked in the past 5 years or have never worked are not included in the workforce data. STEM includes S&E, S&E-related, and STEM middle-skill occupations.
Census Bureau, American Community Survey (ACS), 2023.
Science and Engineering Indicators
Workers in R&D-Intensive Industries
R&D intensity is a ratio of R&D expenses to sales. In this report, it is defined as the cost of domestic R&D paid for by the company and others outside of the company and performed by the company as a percentage of domestic net sales of companies that performed or funded R&D (NCSES 2024a). Using the Business Enterprise Research and Development (BERD) survey, R&D intensity is derived for selected North American Industry Classification System (NAICS) industries. Industries that have an R&D intensity higher than the average across all listed industries are considered R&D-intensive. These industries are then mapped onto modified NAICS codes in the ACS to identify a set of industries that were R&D-intensive using BERD 2022 data (Table STAL-13).
Using a set of industries identified as R&D-intensive in BERD 2022, 11% of the workers in the total workforce and 16% of the workers in the STEM workforce were employed in R&D-intensive industries in 2022 (Figure TAL-13; Table STAL-14). Using the same set of BERD 2022 R&D-intensive industries, 10% of the general workforce and 14% of the STEM workforce were employed in R&D-intensive industries in 2017 (Figure TAL-13). In 2022, over 40% of the workers in S&E occupations were employed in R&D-intensive industries, compared with 9% of workers in S&E-related and 7% in STEM middle-skill occupations. In 2017, these proportions were 39%, 8%, and 7%, respectively. Higher shares of workers in S&E and STEM middle-skill occupations with a bachelor’s or an advanced degree were employed in R&D-intensive industries in 2022 than those without a bachelor’s degree. The pattern was reversed for S&E-related workers. In 2017, across all occupational groups, higher shares of workers with a bachelor’s or an advanced degree were employed in R&D-intensive industries than their counterparts without a bachelor’s degree (Figure TAL-13; Table STAL-14).
| Population segment and occupational group | All workers in R&D-intensive industries | Workers in R&D-intensive industries, without a bachelor's degree | Workers in R&D-intensive industries, with a bachelor's or an advanced degree |
|---|---|---|---|
| Workforce | 9.9 | 5.7 | 16.8 |
| STEM occupations | 14.4 | 8.8 | 21.4 |
| S&E occupations | 38.5 | 35.6 | 39.4 |
| S&E-related occupations | 8.3 | 7.0 | 9.1 |
| STEM middle-skill occupations | 6.9 | 5.5 | 16.8 |
| Non-STEM occupations | 8.5 | 4.9 | 15.1 |
| Population segment and occupational group | Workers in R&D-intensive industries | Workers in R&D-intensive industries, without a bachelor's degree | Workers in R&D-intensive industries, with a bachelor's or an advanced degree |
|---|---|---|---|
| Workforce | 11.4 | 6.4 | 18.4 |
| STEM occupations | 16.3 | 10.0 | 22.7 |
| S&E occupations | 40.0 | 37.1 | 40.8 |
| S&E-related occupations | 8.6 | 8.9 | 8.5 |
| STEM middle-skill occupations | 7.0 | 5.6 | 15.8 |
| Non-STEM occupations | 9.7 | 5.4 | 16.5 |
STEM = science, technology, engineering, and mathematics.
Data include the employed, civilian, noninstitutionalized population ages 25–75 not currently in primary or secondary school. Missing occupations and those who have not worked in the past 5 years or have never worked are not included in the data. See Business Research and Development Survey (BRDS), 2017, Table 17 for the list of industries: https://ncses.nsf.gov/pubs/nsf20311/table/17. Data in the BRDS table withheld to avoid disclosing operations of individual companies are not included in the analysis. For the correspondence of North American Industry Classification System (NAICS) codes to modified NAICS codes (NAICSP), see https://www.census.gov/programs-surveys/acs/microdata/documentation.html. As a result of these conversions, the list of industries used in this report may not be identical to the industries listed in the BRDS table. Data from 2017 use codes from the 2012 version of NAICS industries. Conversion from NAICS to modified NAICS codes may not be a one-to-one match and may include additional components.
Census Bureau, American Community Survey (ACS), 2017, 2022.
Science and Engineering Indicators
Occupational Composition of R&D-Intensive Industries
STEM workers are highly represented in R&D-intensive industries. In 2022, 36% of workers in R&D-intensive industries (6 million individuals) were in STEM occupations (Figure TAL-14; Table STAL-14). About a quarter (23%) of the workers in R&D-intensive industries were in S&E occupations. The proportion of S&E workers in R&D-intensive industries was close to 6 times higher than that of S&E workers in non–R&D-intensive industries (4%)—the most pronounced difference between industries among all occupational groups.
| Industry | S&E occupations | S&E-related occupations | STEM middle-skill occupations | Non-STEM occupations |
|---|---|---|---|---|
| All industries | 6.6 | 9.4 | 9.3 | 74.7 |
| Non-R&D intensive industries | 4.5 | 9.7 | 9.7 | 76.1 |
| R&D-intensive industries | 23.3 | 7.1 | 5.7 | 63.9 |
STEM = science, technology, engineering, and mathematics.
Data include the employed, civilian, noninstitutionalized population ages 25–75 not currently in primary or secondary school. Missing occupations and those who have not worked in the past 5 years or have never worked are not included in the workforce data. STEM includes S&E, S&E-related, and STEM middle-skill occupations. See Business Enterprise Research and Development (BERD), 2022, Table 17 for list of industries: https://ncses.nsf.gov/pubs/nsf24335/table/17. Data in the BERD table withheld to avoid disclosing operations of individual companies are not included the analysis. For the correspondence of NAICS codes to modified NAICS codes (NAICSP), see https://www.census.gov/programs-surveys/acs/microdata/documentation.html. As a result of these conversions, the list of industries used in this report may not be identical to the industries listed in the BERD table. Data from 2022 use codes from the 2017 version of NAICS industries. Conversion from NAICS to modified NAICS codes may not be a one-to-one match and may include additional components.
Census Bureau, American Community Survey (ACS), 2022.
Science and Engineering Indicators


