 An official website of the United States government
 Path to STEM Employment
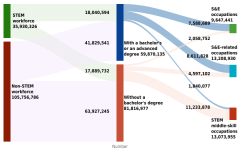
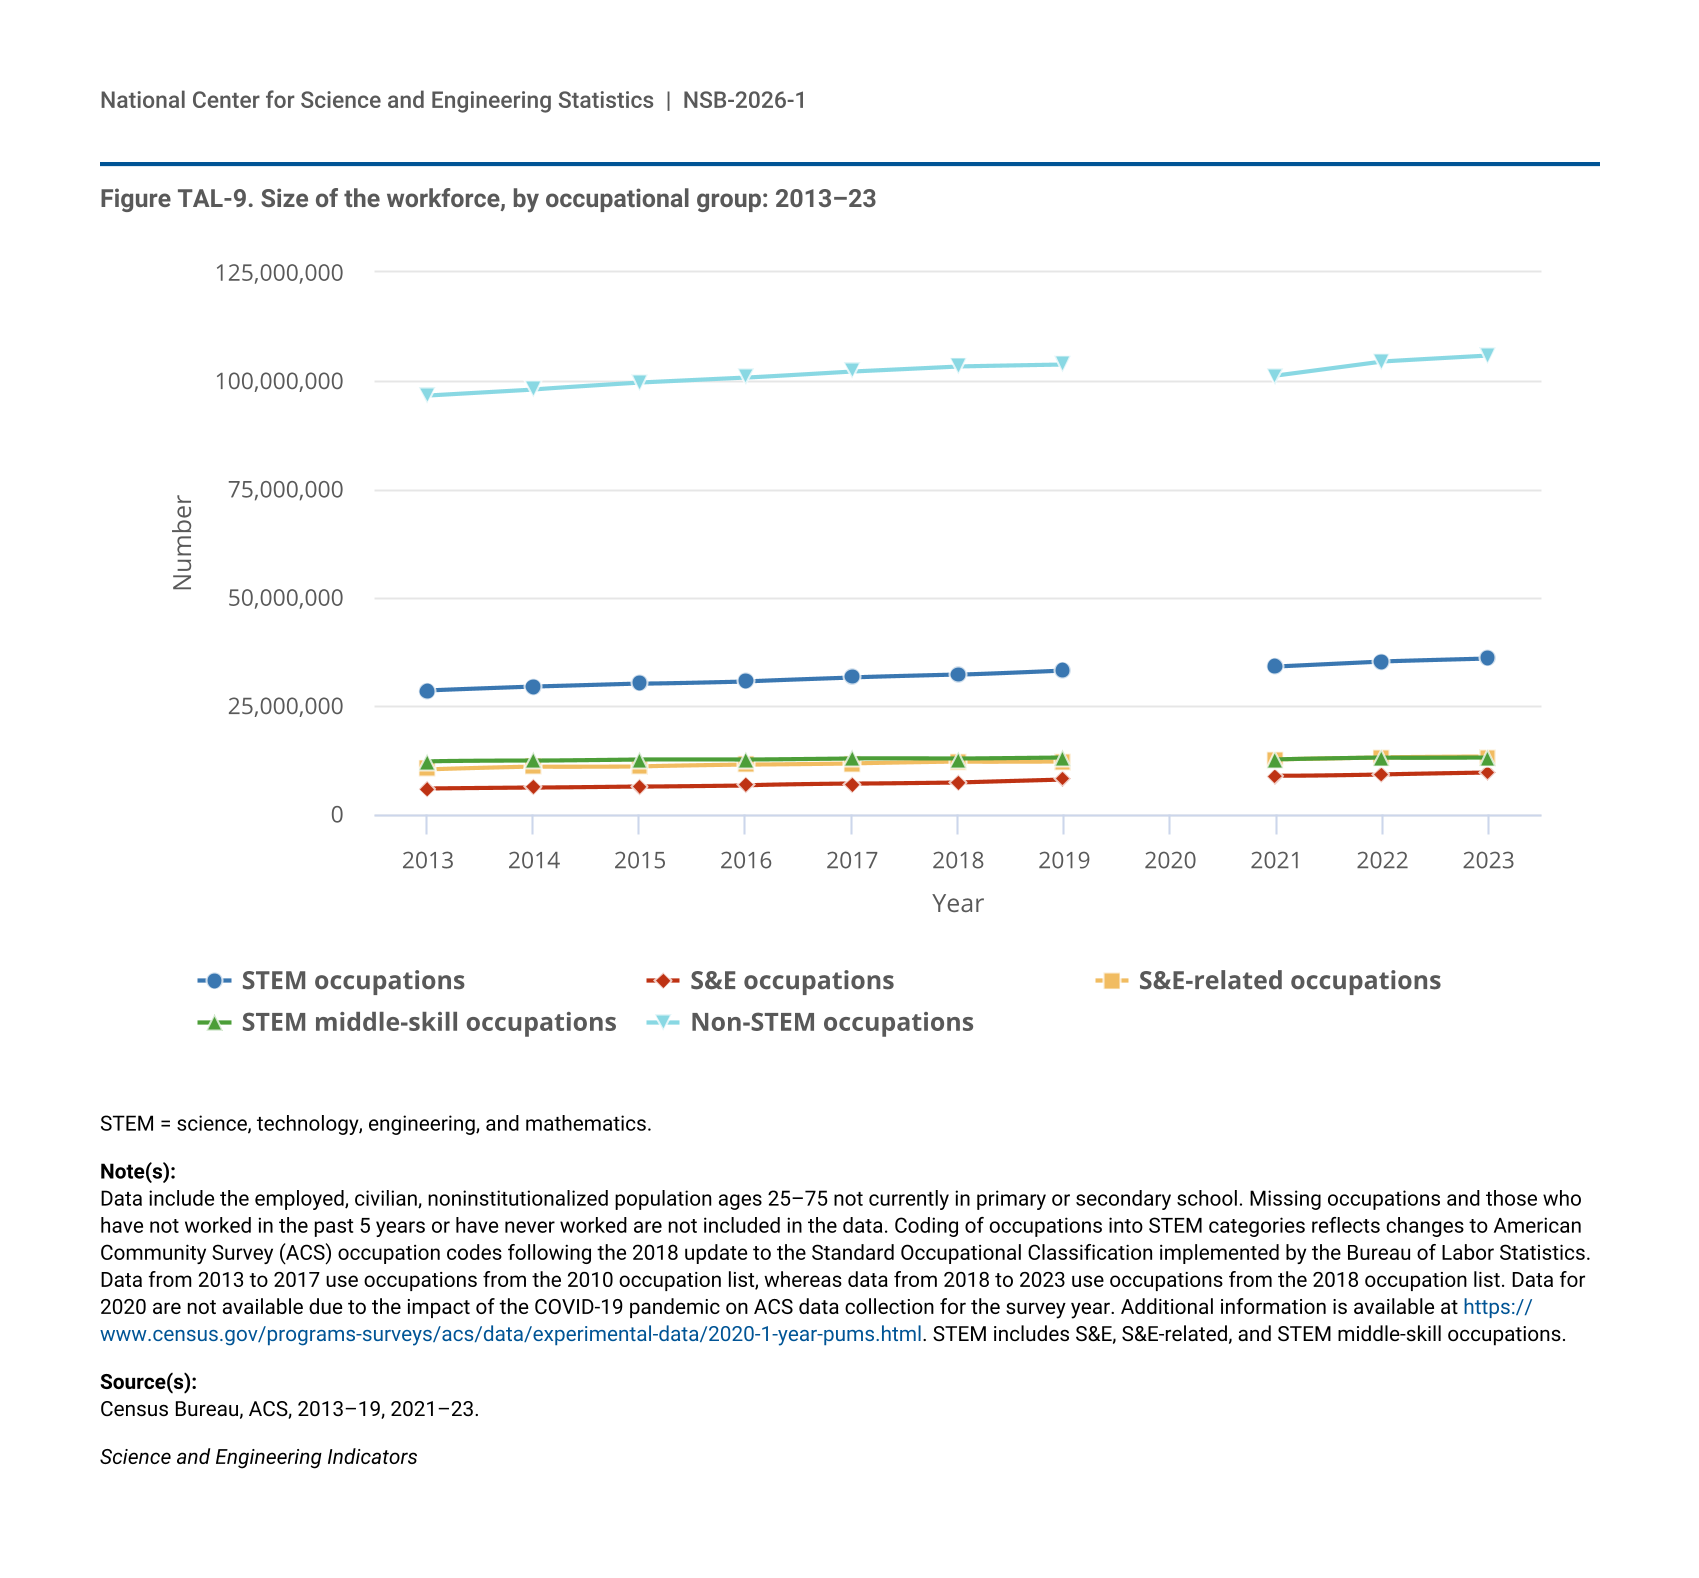
The path to STEM employment starts early and can be complex, with many junctions where an individual may choose between continuing along the path of STEM education and employment or seeking other options. Indicators highlight numerous factors, including academic performance, teacher quality, and access to advanced courses at the K–12 level, that affect students’ STEM experience at the K–12 level and STEM degree attainment, ranging from associate’s to doctoral degrees in higher education.
K–12 STEM Education
The National Assessment of Educational Progress (NAEP) mathematics assessment tracks student academic performance over time and is administered every 2 years to nationally representative samples of fourth- and eighth-grade students in the United States and every 4 years to a nationally representative sample of 12th-grade students. This section presents scores for the 2024 assessments and includes comparisons to scores in 2019 and 2022 to understand the impact of the COVID-19 pandemic on student academic performance.
Results for Students in Grades 4 and 8
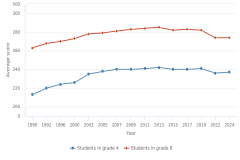
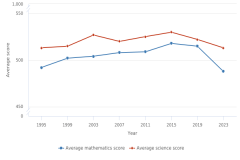
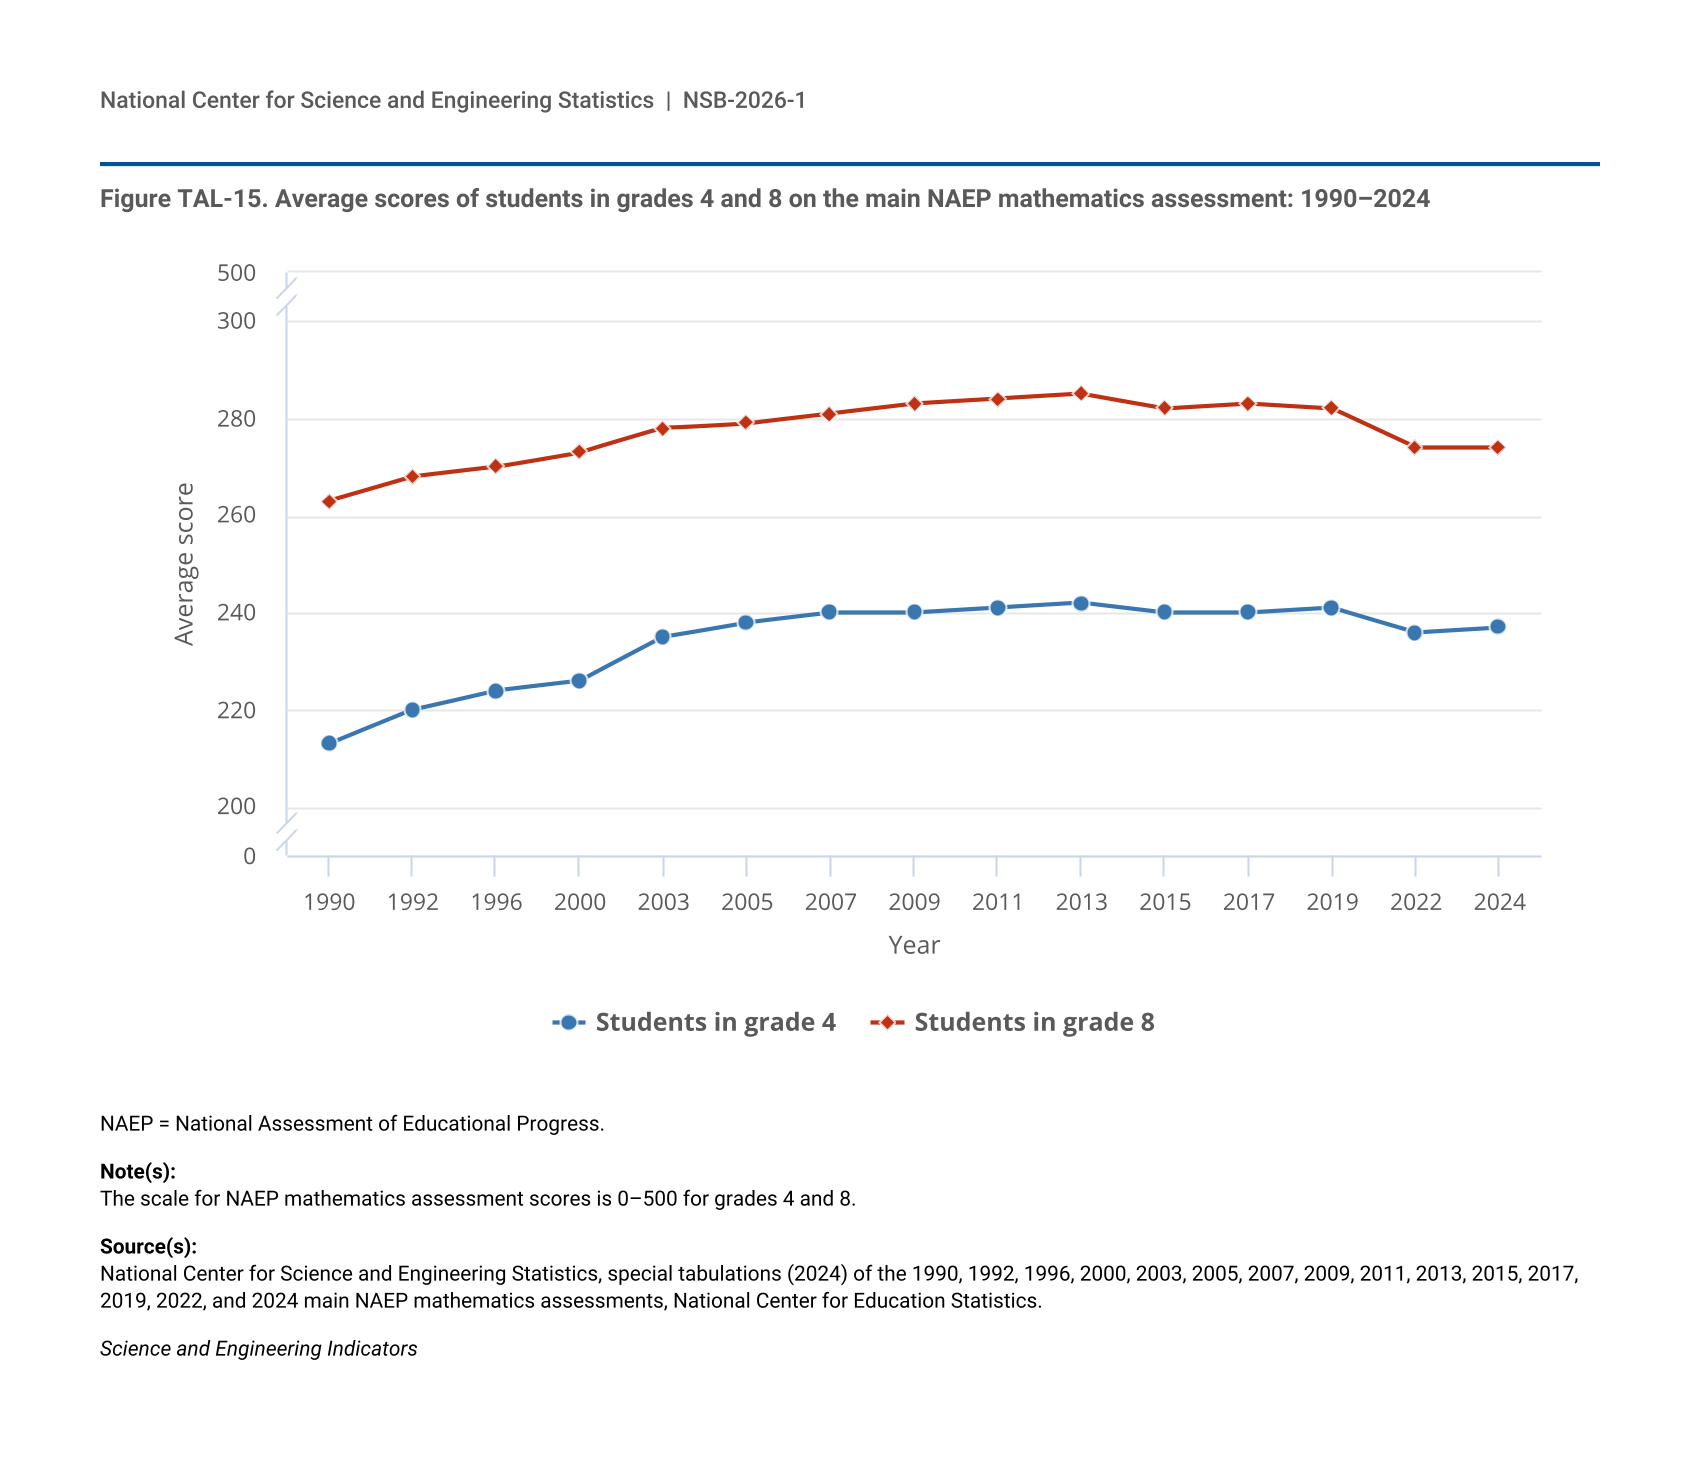
The 2022 NAEP mathematics assessment revealed a decline in average scores for all fourth- and eighth-grade students compared with pre-pandemic scores in 2019. The NAEP mathematics assessment data gathered in 2024 indicate a slight recovery since 2022 in average mathematics performance among fourth graders, but the decline from the pre-pandemic benchmark of 2019 continues for both grade levels (Figure TAL-15). The 5-point difference in fourth-grade average scores from 2019 to 2022 improved to a 3-point difference from 2019 to 2024, whereas the 8-point difference in eighth-grade average scores from 2019 to 2022 remained unchanged in 2024.
| Year | Students in grade 4 | Students in grade 8 |
|---|---|---|
| 1990 | 213 | 263 |
| 1992 | 220 | 268 |
| 1996 | 224 | 270 |
| 2000 | 226 | 273 |
| 2003 | 235 | 278 |
| 2005 | 238 | 279 |
| 2007 | 240 | 281 |
| 2009 | 240 | 283 |
| 2011 | 241 | 284 |
| 2013 | 242 | 285 |
| 2015 | 240 | 282 |
| 2017 | 240 | 283 |
| 2019 | 241 | 282 |
| 2022 | 236 | 274 |
| 2024 | 237 | 274 |
NAEP = National Assessment of Educational Progress.
The scale for NAEP mathematics assessment scores is 0–500 for grades 4 and 8.
National Center for Science and Engineering Statistics, special tabulations (2024) of the 1990, 1992, 1996, 2000, 2003, 2005, 2007, 2009, 2011, 2013, 2015, 2017, 2019, 2022, and 2024 main NAEP mathematics assessments, National Center for Education Statistics.
Science and Engineering Indicators
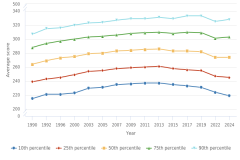
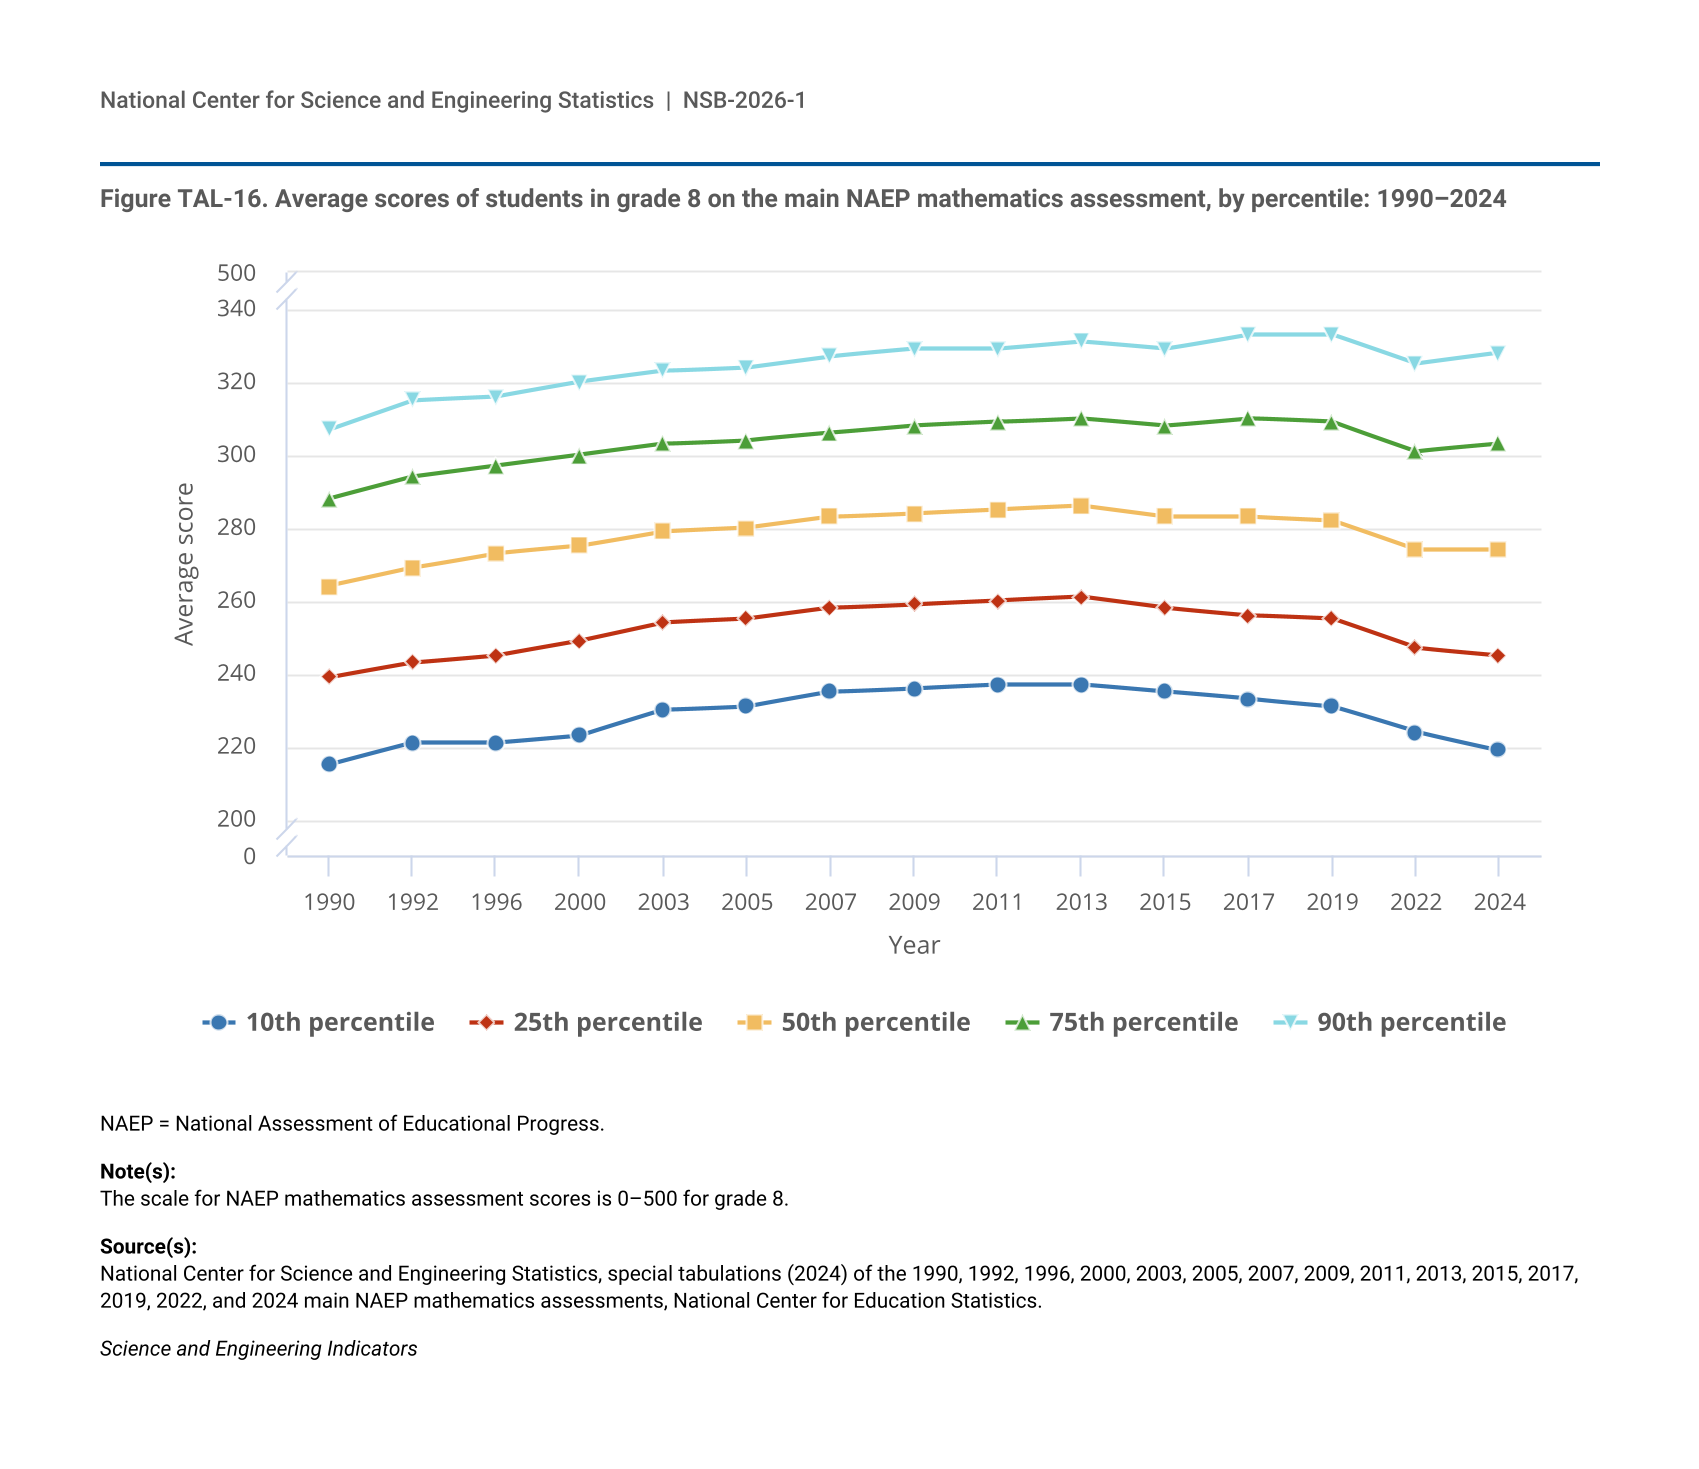
For both grade levels, the mathematics scores for students at the 10th percentile showed either declines or no changes between 2022 and 2024, whereas the scores of students at the 90th percentile increased. The gaps between the scores at the 10th and 90th percentiles at both grade levels in 2024 widened to the largest gaps since the NAEP assessment began in 1990 (Figure TAL-16; Table STAL-15, Table STAL-16). These results suggest some learning recovery for higher-performing students between 2022 and 2024 but no recovery for lower-performing students. In 2024, full returns to pre-pandemic performance were observed only at the 75th and 90th percentiles of mathematics scores for fourth-grade students.
| Year | 10th percentile | 25th percentile | 50th percentile | 75th percentile | 90th percentile |
|---|---|---|---|---|---|
| 1990 | 215 | 239 | 264 | 288 | 307 |
| 1992 | 221 | 243 | 269 | 294 | 315 |
| 1996 | 221 | 245 | 273 | 297 | 316 |
| 2000 | 223 | 249 | 275 | 300 | 320 |
| 2003 | 230 | 254 | 279 | 303 | 323 |
| 2005 | 231 | 255 | 280 | 304 | 324 |
| 2007 | 235 | 258 | 283 | 306 | 327 |
| 2009 | 236 | 259 | 284 | 308 | 329 |
| 2011 | 237 | 260 | 285 | 309 | 329 |
| 2013 | 237 | 261 | 286 | 310 | 331 |
| 2015 | 235 | 258 | 283 | 308 | 329 |
| 2017 | 233 | 256 | 283 | 310 | 333 |
| 2019 | 231 | 255 | 282 | 309 | 333 |
| 2022 | 224 | 247 | 274 | 301 | 325 |
| 2024 | 219 | 245 | 274 | 303 | 328 |
NAEP = National Assessment of Educational Progress.
The scale for NAEP mathematics assessment scores is 0–500 for grade 8.
National Center for Science and Engineering Statistics, special tabulations (2024) of the 1990, 1992, 1996, 2000, 2003, 2005, 2007, 2009, 2011, 2013, 2015, 2017, 2019, 2022, and 2024 main NAEP mathematics assessments, National Center for Education Statistics.
Science and Engineering Indicators
Variations in Scores by Student, Teacher, and School Factors
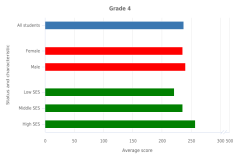
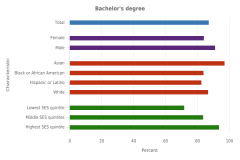
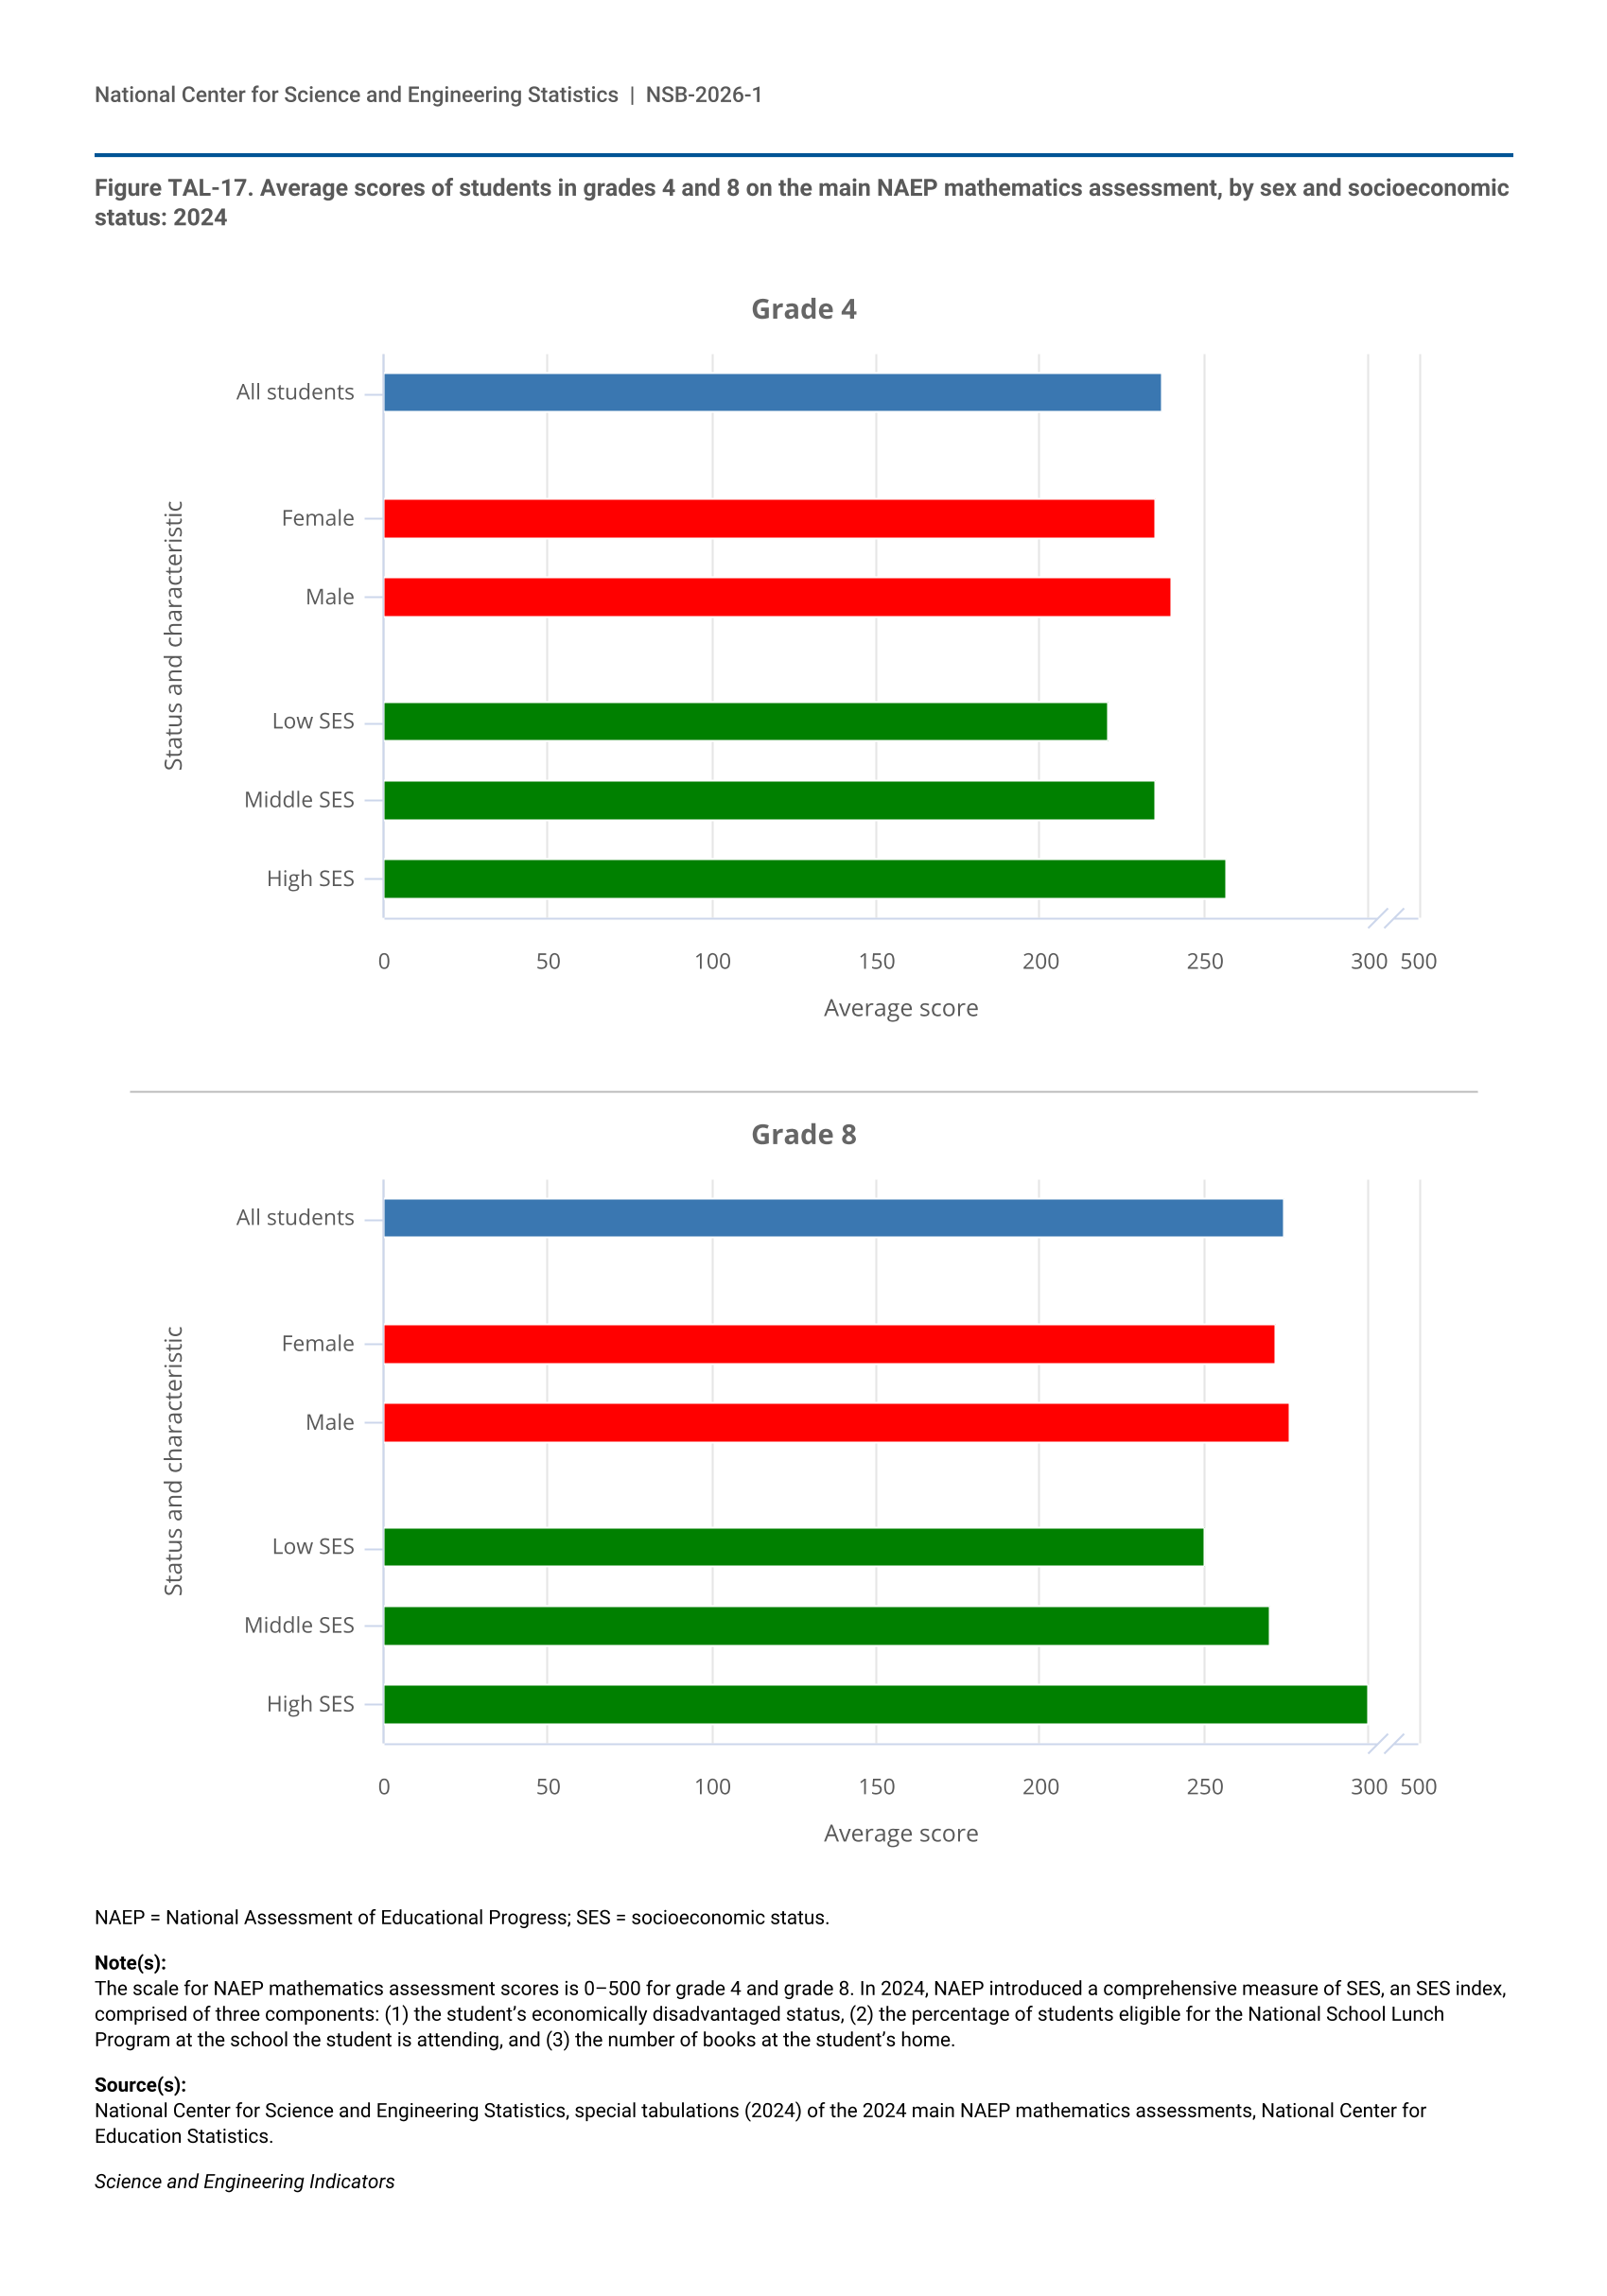
NAEP mathematics results in 2024 show differences in average student performance associated with student, school, and teacher factors. Male students scored higher than female students at both grade levels, as did high socioeconomic status (SES) students compared with low SES students (Figure TAL-17).
| Status and characteristic | Score |
|---|---|
| All students | 237 |
| Female | 235 |
| Male | 240 |
| Low SES | 221 |
| Middle SES | 235 |
| High SES | 257 |
| Status and characteristic | Score |
|---|---|
| All students | 274 |
| Female | 272 |
| Male | 276 |
| Low SES | 250 |
| Middle SES | 270 |
| High SES | 300 |
NAEP = National Assessment of Educational Progress; SES = socioeconomic status.
The scale for NAEP mathematics assessment scores is 0–500 for grade 4 and grade 8. In 2024, NAEP introduced a comprehensive measure of SES, an SES index, comprised of three components: (1) the student’s economically disadvantaged status, (2) the percentage of students eligible for the National School Lunch Program at the school the student is attending, and (3) the number of books at the student’s home.
National Center for Science and Engineering Statistics, special tabulations (2024) of the 2024 main NAEP mathematics assessments, National Center for Education Statistics.
Science and Engineering Indicators
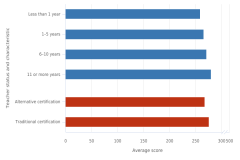
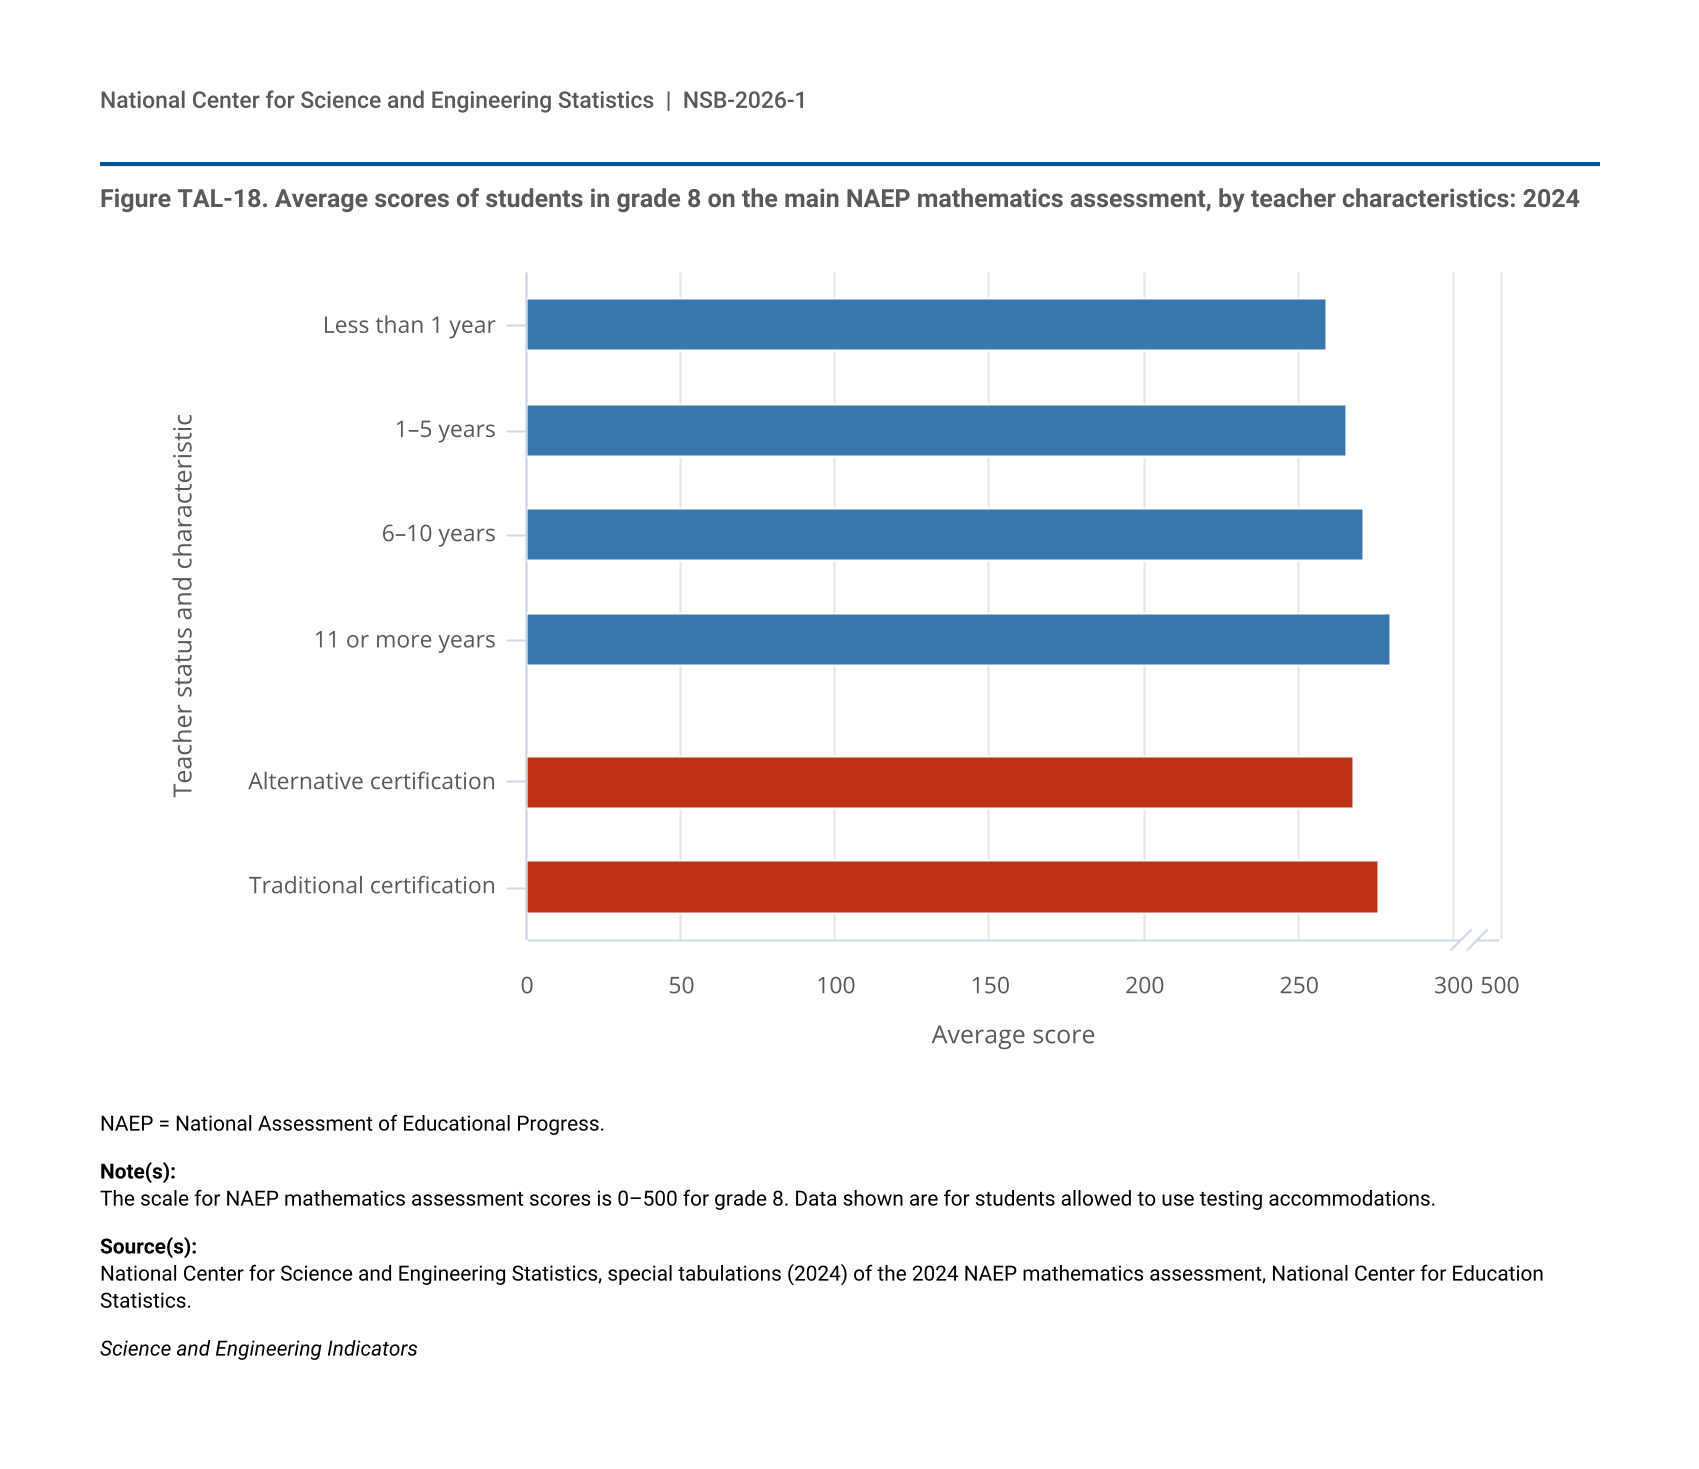
Asian and White students posted the highest scores at both grade levels (Table TAL-10). Students with more-experienced teachers scored higher than students with less-experienced teachers, as did students taught by teachers with traditional certifications rather than teachers with alternative certifications (Figure TAL-18). Students who attended schools with extracurricular mathematics enrichment activities, including mathematics club competitions, scored higher than students who attended schools without these activities (Table STAL-17).
s = suppressed for reasons of confidentiality and/or reliability.
NAEP = National Assessment of Educational Progress.
The scale for NAEP mathematics assessment scores is 0–500 for grade 4 and grade 8 and 0–300 for grade 12. Black includes African American. Hispanic includes Latino. Hispanic may be any race; race categories exclude Hispanic origin.
National Center for Science and Engineering Statistics, special tabulations (2024) of the 2024 main NAEP mathematics assessments, National Center for Education Statistics.
Science and Engineering Indicators
| Teacher status and characteristic | 2024 |
|---|---|
| Less than 1 year | 259 |
| 1–5 years | 266 |
| 6–10 years | 271 |
| 11 or more years | 280 |
| Alternative certification | 268 |
| Traditional certification | 276 |
NAEP = National Assessment of Educational Progress.
The scale for NAEP mathematics assessment scores is 0–500 for grade 8. Data shown are for students allowed to use testing accommodations.
National Center for Science and Engineering Statistics, special tabulations (2024) of the 2024 NAEP mathematics assessment, National Center for Education Statistics.
Science and Engineering Indicators
Variations in Scores by Geography
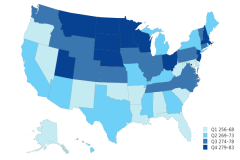
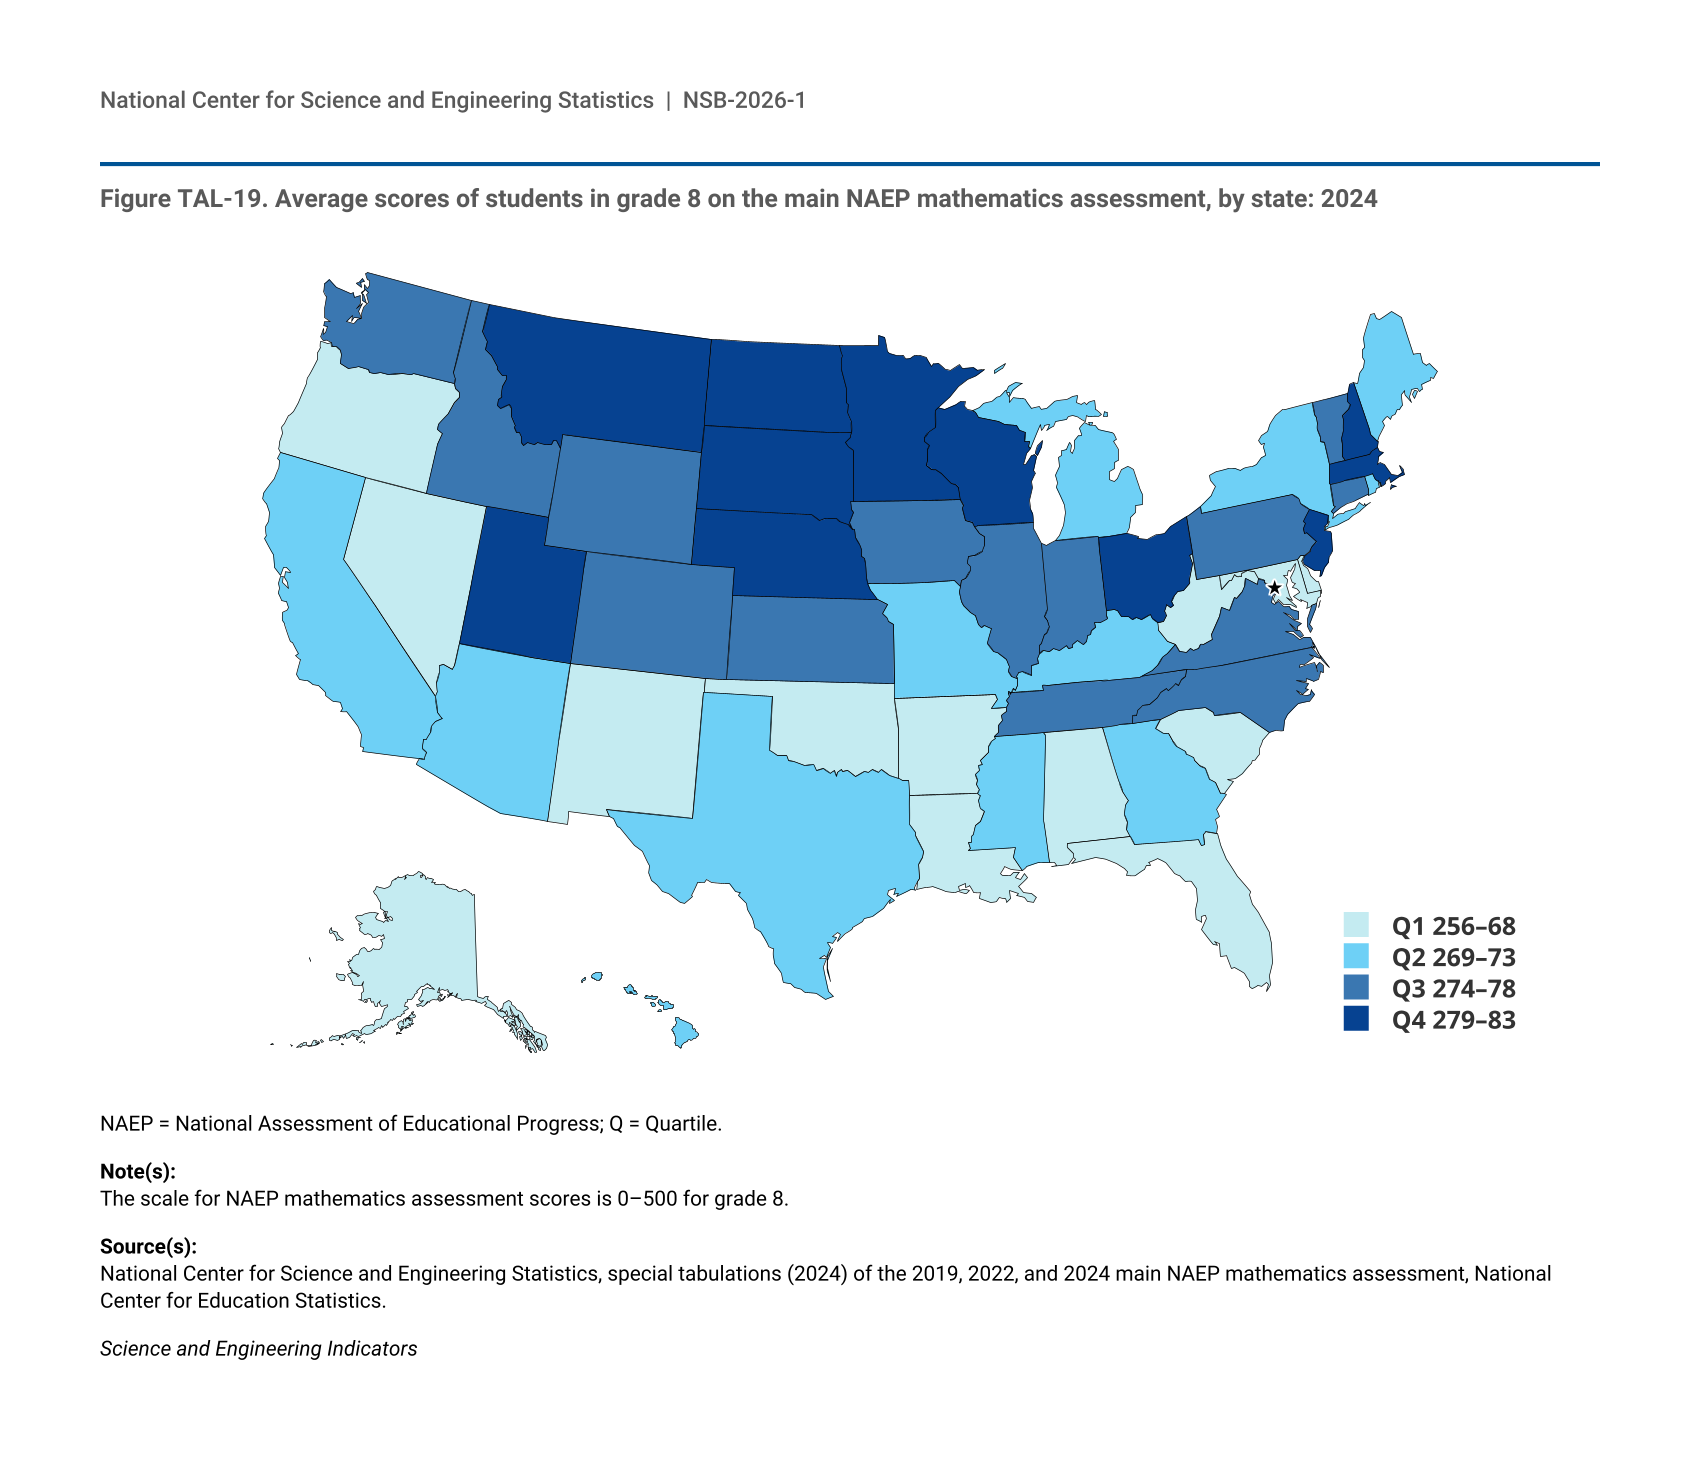
Average student scores in 2024 varied by geographic factors, including school location, census division, and state. Fourth- and eighth-grade students in suburban and rural areas scored higher in 2024 than students in towns and urban areas. Students in both grades who attended suburban schools posted the highest scores (Table STAL-18). In 2024, fourth-grade students in the West scored lower than students in all three other U.S. Census Bureau regions. At the state level, eighth-grade students in Massachusetts, Wisconsin, Minnesota, New Jersey, and Utah were among the highest-scoring students, whereas students in Alabama, the District of Columbia, West Virginia, and New Mexico were among the lowest (Figure TAL-19). State-level data and other geographic analyses on mathematics and science achievement can be found in Science and Engineering Indicators: State Indicators.
| State | 2024 |
|---|---|
| New Mexico | 256 |
| West Virginia | 261 |
| District of Columbia | 262 |
| Alabama | 262 |
| Delaware | 263 |
| Alaska | 264 |
| Oklahoma | 264 |
| Nevada | 265 |
| Arkansas | 266 |
| Louisiana | 267 |
| Florida | 267 |
| Oregon | 268 |
| South Carolina | 268 |
| Maryland | 268 |
| Georgia | 269 |
| California | 269 |
| Mississippi | 269 |
| Texas | 269 |
| Arizona | 270 |
| Rhode Island | 270 |
| Michigan | 270 |
| Hawaii | 270 |
| Missouri | 270 |
| Kentucky | 271 |
| New York | 271 |
| Maine | 273 |
| Washington | 274 |
| Kansas | 274 |
| Iowa | 275 |
| Virginia | 275 |
| Vermont | 276 |
| North Carolina | 276 |
| Tennessee | 276 |
| Pennsylvania | 276 |
| Connecticut | 277 |
| Illinois | 277 |
| Idaho | 278 |
| Colorado | 278 |
| Indiana | 278 |
| Wyoming | 278 |
| Ohio | 279 |
| Montana | 279 |
| New Hampshire | 280 |
| North Dakota | 280 |
| Nebraska | 280 |
| South Dakota | 281 |
| New Jersey | 282 |
| Utah | 282 |
| Minnesota | 282 |
| Wisconsin | 283 |
| Massachusetts | 283 |
NAEP = National Assessment of Educational Progress; Q = Quartile.
The scale for NAEP mathematics assessment scores is 0–500 for grade 8.
National Center for Science and Engineering Statistics, special tabulations (2024) of the 2019, 2022, and 2024 main NAEP mathematics assessment, National Center for Education Statistics.
Science and Engineering Indicators
Results for Students in Grade 12
NAEP mathematics assessments results for 12th-grade students show similar patterns to those for fourth- and eighth-grade students. The average score in 2024 for 12th-grade students was 3 points lower than in 2019 and lower than all years since the current mathematics assessment framework was instituted in 2005, suggesting an adverse impact of the COVID-19 pandemic on 12th-grade students’ academic performance (Table STAL-19). Students at the 90th percentile scored the same in 2024 as in 2019, whereas students at the 10th percentile scored 4 points lower, resulting in the largest gap between higher- and lower-performing students since the current assessment began in 2005 (Table STAL-16). Score differences among male and female 12th-grade students also reflected patterns observed among fourth- and eighth-grade students; the average score for male students was 5 points higher than the average score for female students.
STEM Course Access and Enrollment
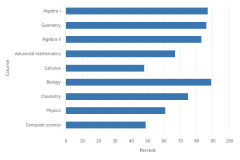
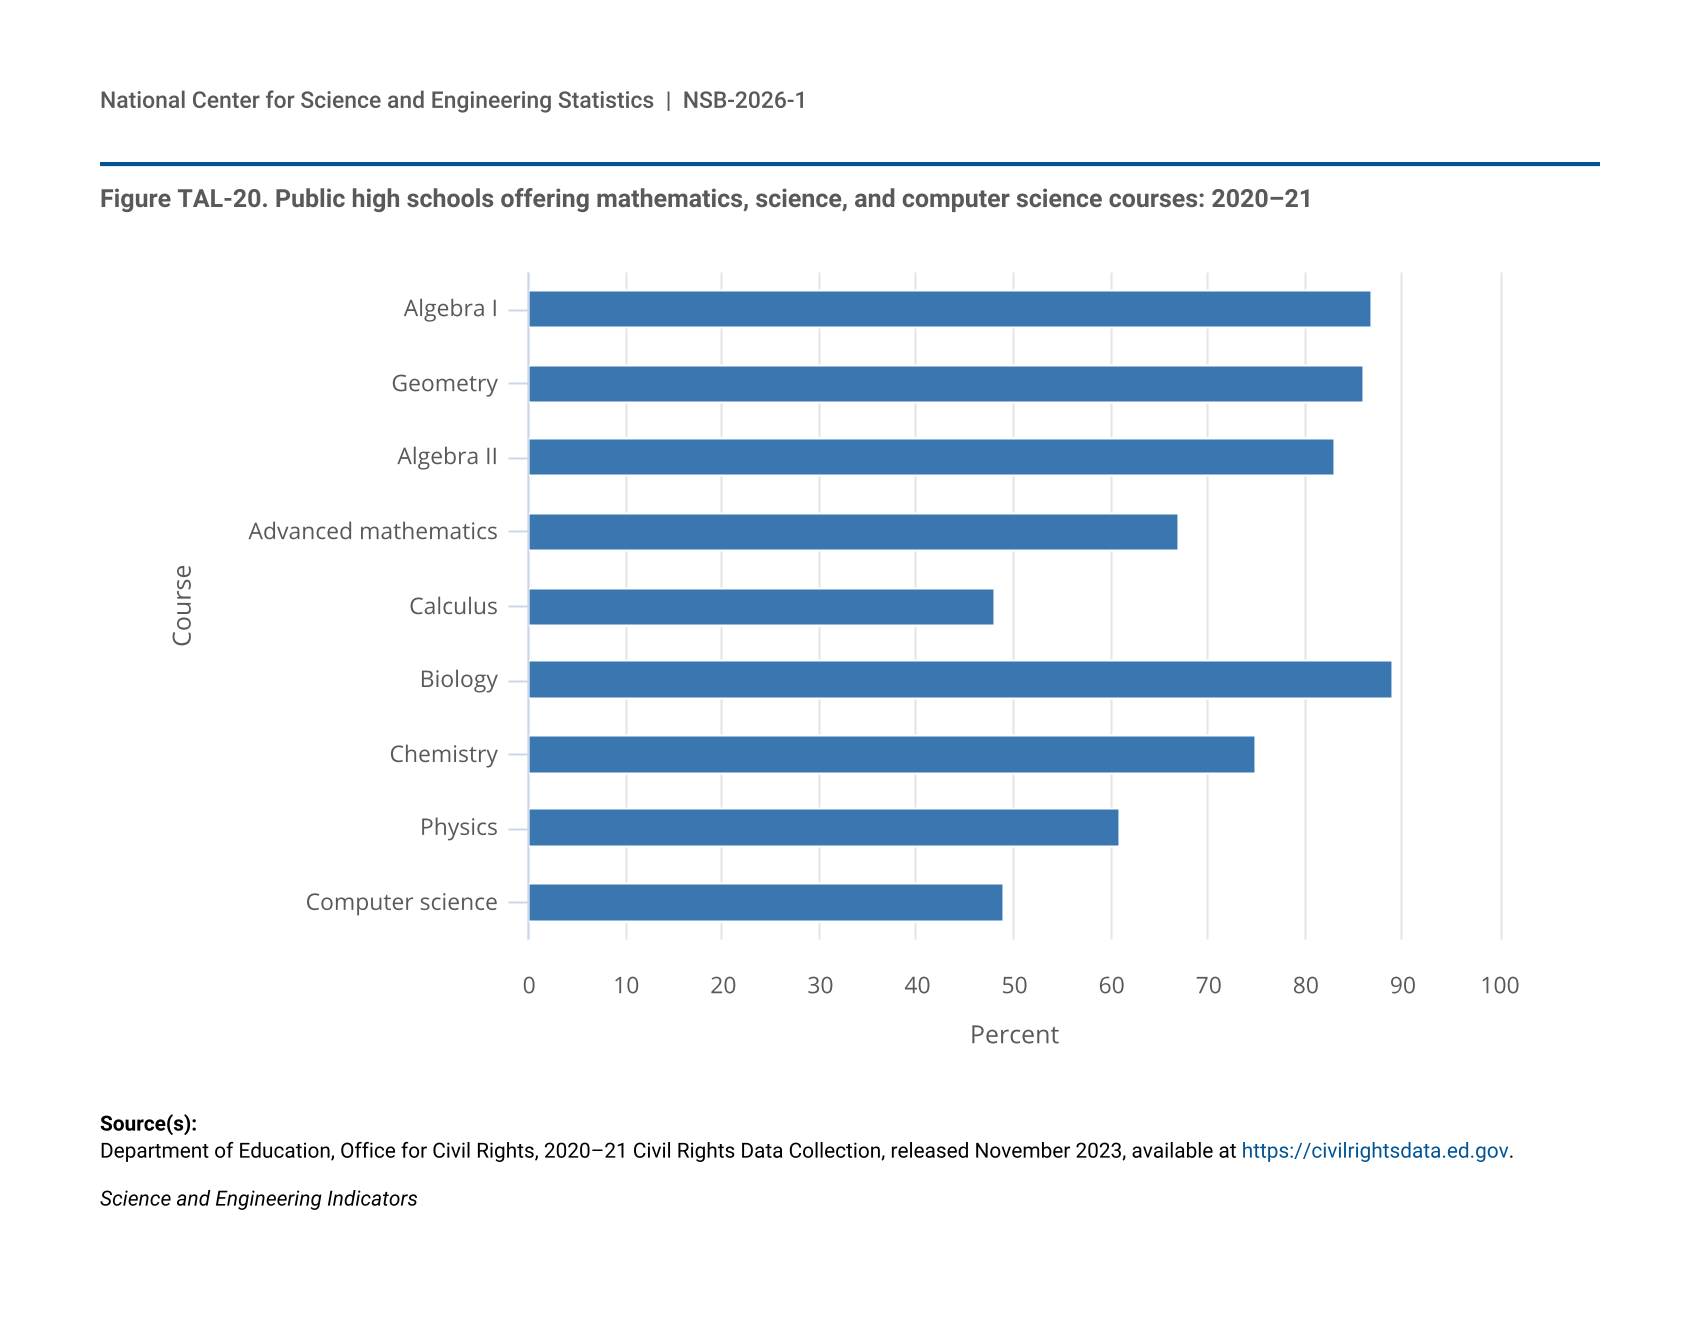
The 2020–21 Civil Rights Data Collection (CRDC) is a survey of all public school districts and schools serving students in preschool through grade 12 in the United States. It provides data about public high school students’ access to STEM courses and their enrollment in those courses. Statistics cited here are from the 2020–21 CRDC report (Department of Education 2024), which includes data for the 26,200 public high schools in the United States enrolling approximately 17 million students. During the 2020–21 school year, more than 80% of high schools offered algebra I, algebra II, geometry, and biology; 75% offered chemistry; 67% offered advanced mathematics; and 61% offered physics (Figure TAL-20). Less than 50% of schools offered calculus or computer science. Access to these courses varied by student and school characteristics. At the student level, 69% of Asian students, 55% of White students, 51% of Hispanic students, and 47% of Black students attended high schools that offered a full range of mathematics, science, and computer science courses. At the school level, approximately 35% of schools with high enrollments of Black and Hispanic students (i.e., more than 75% of students) offered calculus, compared with 54% of schools with low enrollments of Black and Hispanic students (i.e., less than 25% of students).
| Course | Percent |
|---|---|
| Algebra I | 87 |
| Geometry | 86 |
| Algebra II | 83 |
| Advanced mathematics | 67 |
| Calculus | 48 |
| Biology | 89 |
| Chemistry | 75 |
| Physics | 61 |
| Computer science | 49 |
Department of Education, Office for Civil Rights, 2020–21 Civil Rights Data Collection, released November 2023, available at https://civilrightsdata.ed.gov.
Science and Engineering Indicators
Approximately 2.9 million public high school students across the nation were enrolled in at least one Advanced Placement (AP) course in mathematics, science, or computer science during the 2020–21 school year. Student enrollment in AP STEM courses differed by race or ethnicity. For example, Asian students represented 5% of total high school student enrollment but accounted for 17% of students enrolled in AP science and AP mathematics courses. Black students represented 15% of total high school student enrollment but accounted for 8% of students enrolled in AP science and 6% of students enrolled in AP mathematics courses.
For more information about the CRDC mathematics, science, and computer science course enrollment, see Department of Education (2024).
STEM Degrees
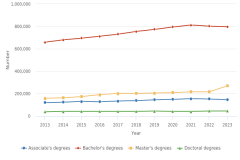
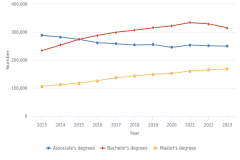
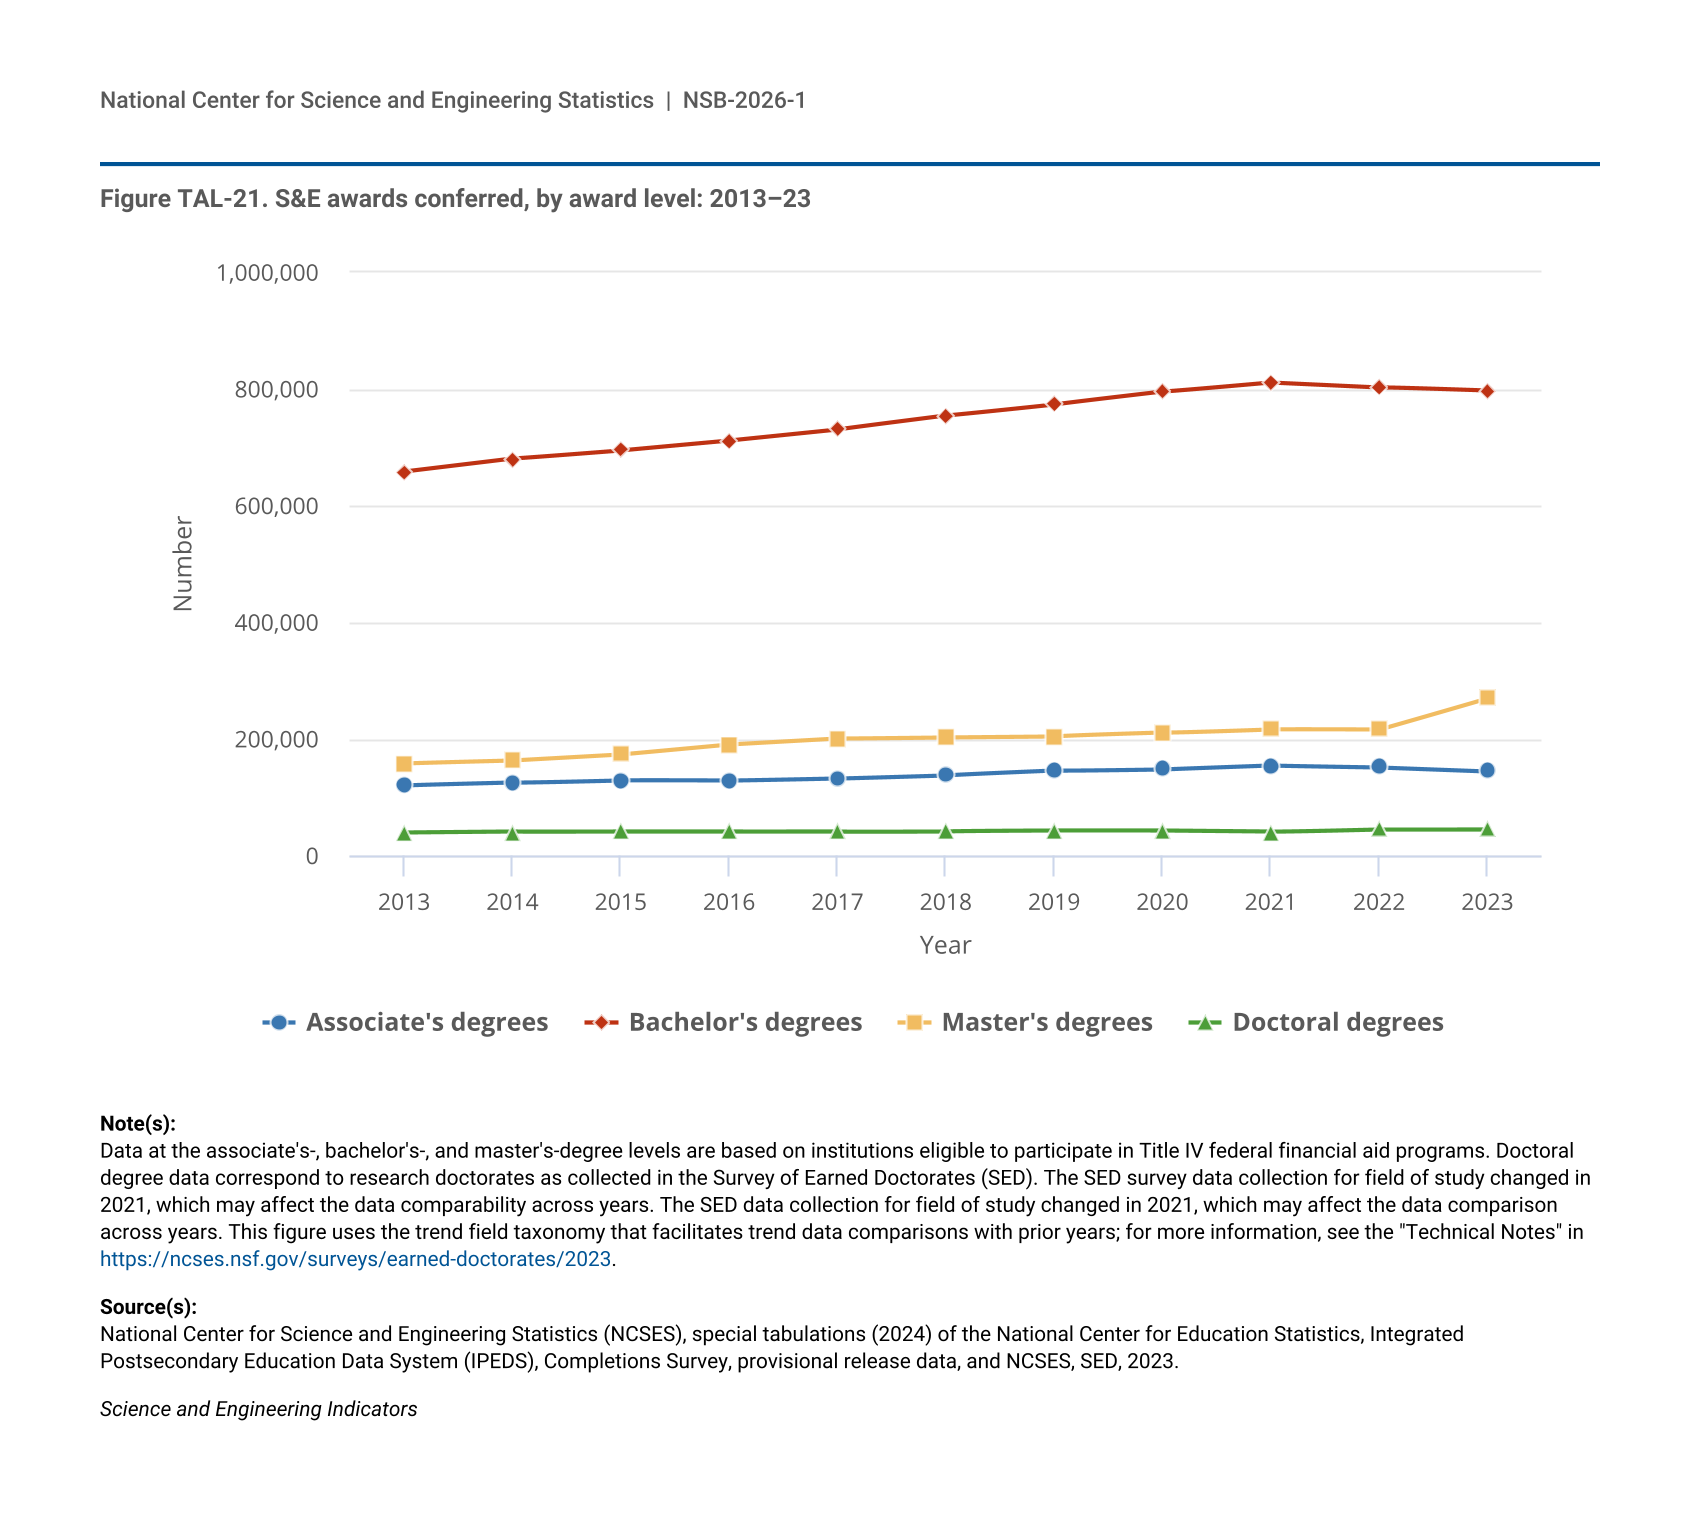
Counts of STEM higher education degrees approximate a potential supply of workers for employment in the STEM workforce. Between 2013 and 2023, the number of S&E awards conferred by U.S. postsecondary institutions increased at all levels (Figure TAL-21). The number of S&E associate’s degrees and the number of S&E bachelor’s degrees awarded increased by 21% each during this period, the number of S&E master’s degrees increased by 70%, and the number of S&E doctoral degrees increased by 17%. At all degree levels, the growth in S&E degree completions between 2013 and 2023 was higher than the growth in the college-age population during the same period.
| Year | Associate's degrees | Bachelor's degrees | Master's degrees | Doctoral degrees |
|---|---|---|---|---|
| 2013 | 120,346 | 657,959 | 158,787 | 39,084 |
| 2014 | 124,916 | 680,302 | 163,584 | 40,708 |
| 2015 | 129,468 | 694,701 | 173,854 | 41,247 |
| 2016 | 128,526 | 711,624 | 191,012 | 41,306 |
| 2017 | 132,433 | 730,573 | 201,311 | 41,364 |
| 2018 | 137,984 | 754,094 | 203,441 | 42,144 |
| 2019 | 145,685 | 773,662 | 205,067 | 42,897 |
| 2020 | 148,449 | 795,235 | 210,637 | 42,564 |
| 2021 | 155,029 | 811,706 | 217,146 | 40,819 |
| 2022 | 152,024 | 803,211 | 216,243 | 45,402 |
| 2023 | 145,187 | 796,772 | 270,133 | 45,533 |
Data at the associate's-, bachelor's-, and master's-degree levels are based on institutions eligible to participate in Title IV federal financial aid programs. Doctoral degree data correspond to research doctorates as collected in the Survey of Earned Doctorates (SED). The SED survey data collection for field of study changed in 2021, which may affect the data comparability across years. The SED data collection for field of study changed in 2021, which may affect the data comparison across years. This figure uses the trend field taxonomy that facilitates trend data comparisons with prior years; for more information, see the "Technical Notes" in https://ncses.nsf.gov/surveys/earned-doctorates/2023.
National Center for Science and Engineering Statistics (NCSES), special tabulations (2024) of the National Center for Education Statistics, Integrated Postsecondary Education Data System (IPEDS), Completions Survey, provisional release data, and NCSES, SED, 2023.
Science and Engineering Indicators
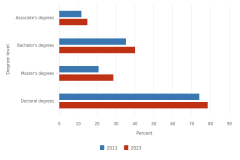
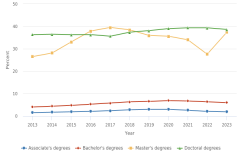
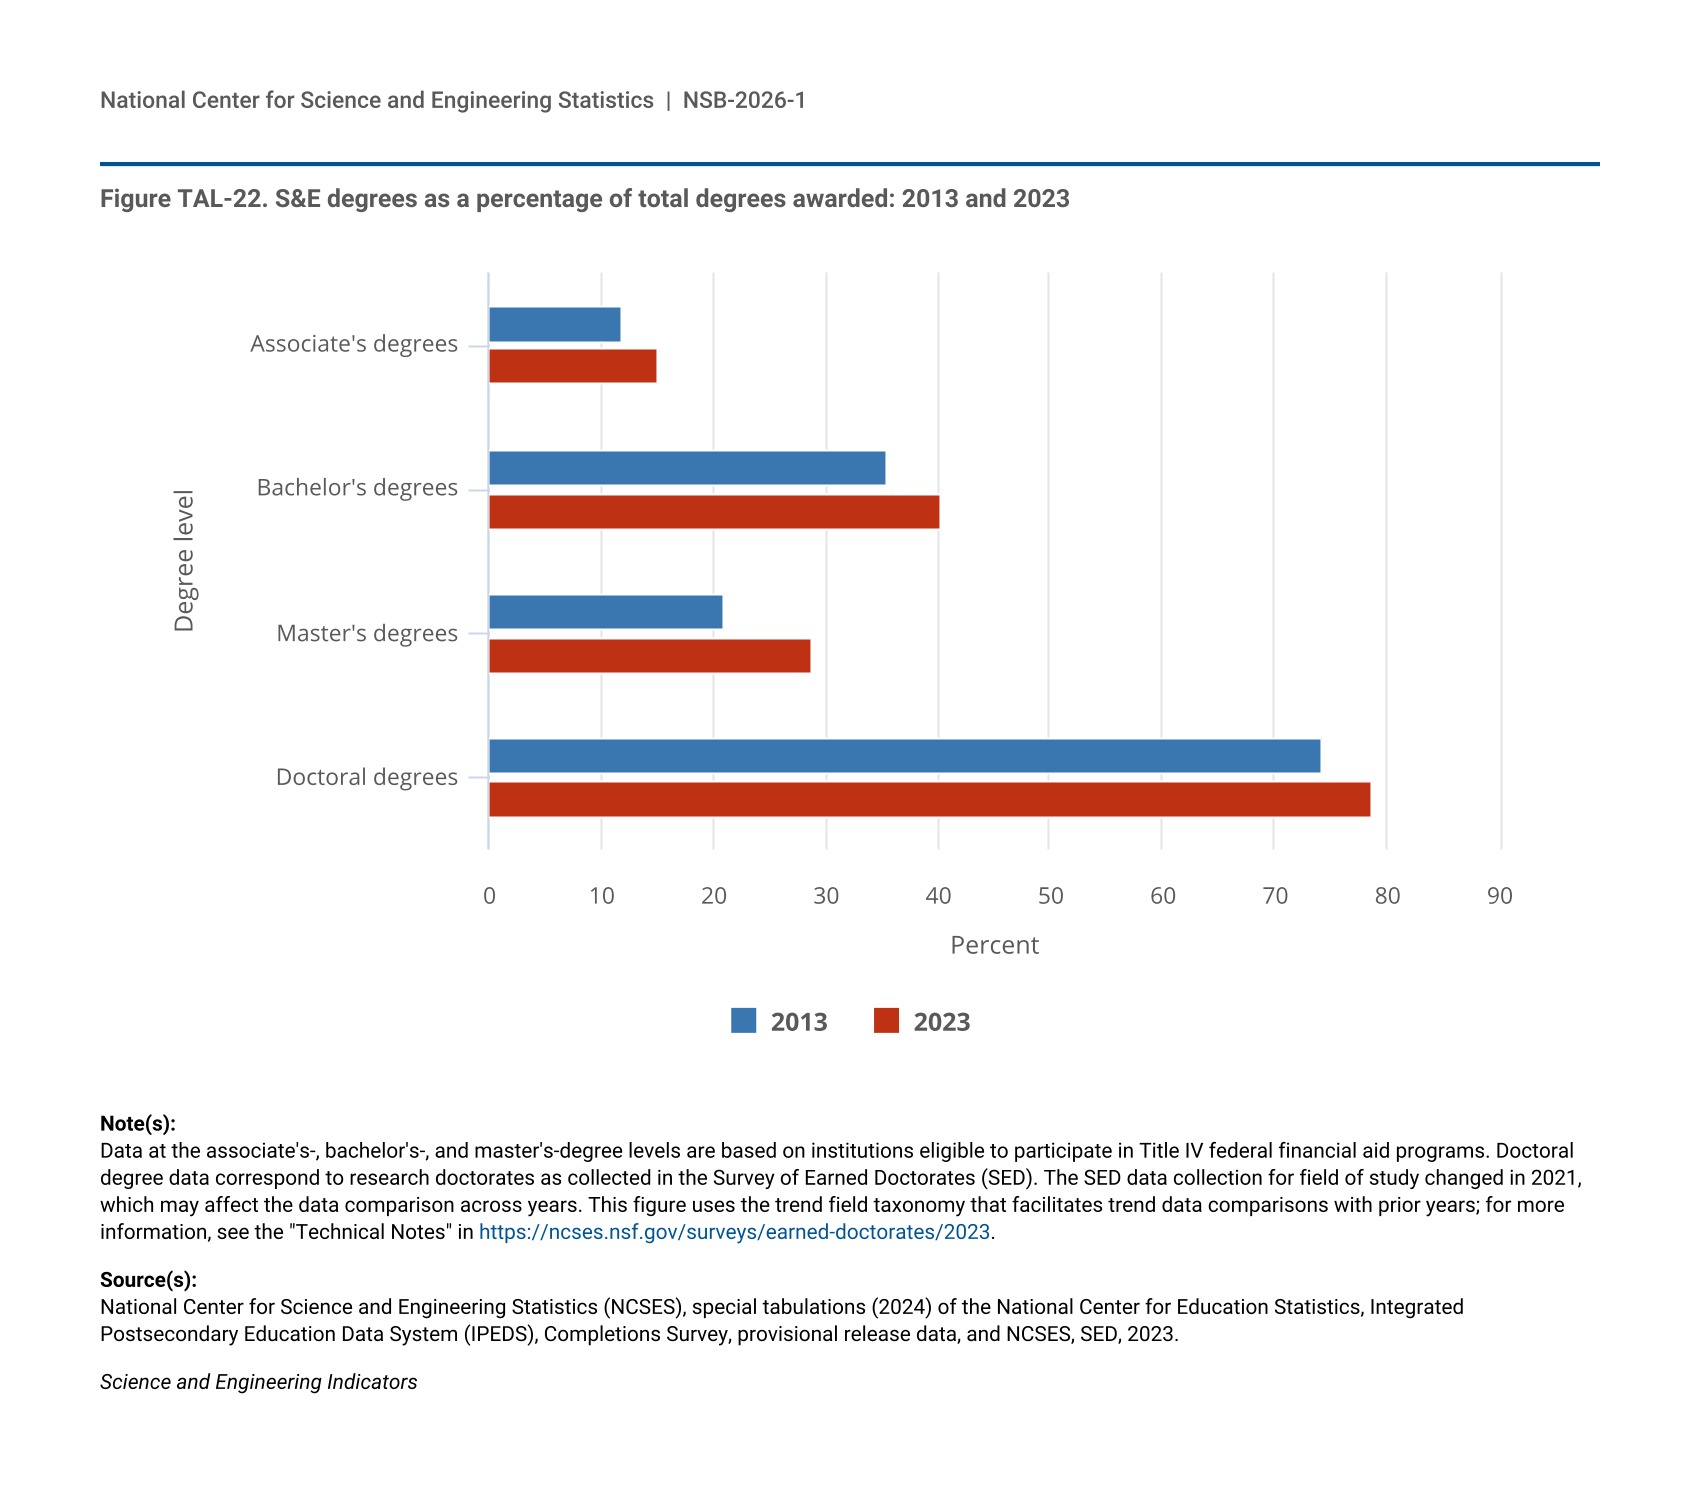
The increase in the number and share of S&E degree awards reflects a growing population and representation of postsecondary students in S&E fields. The share of S&E master’s degrees awarded increased at the highest rate among all award levels, from 21% of all master’s degrees awarded in 2013 to 29% in 2023 (Figure TAL-22). The share of awards in S&E fields at the associate’s, bachelor’s, and doctoral levels also increased but to a lesser degree. Doctoral degrees in S&E fields account for the vast majority (79%) of all doctoral degrees awarded in 2023, whereas S&E degrees do not account for the majority of degrees awarded at any other level.
| Degree level | 2013 | 2023 |
|---|---|---|
| Associate's degrees | 11.9 | 15.0 |
| Bachelor's degrees | 35.4 | 40.2 |
| Master's degrees | 21.0 | 28.8 |
| Doctoral degrees | 74.2 | 78.7 |
Data at the associate's-, bachelor's-, and master's-degree levels are based on institutions eligible to participate in Title IV federal financial aid programs. Doctoral degree data correspond to research doctorates as collected in the Survey of Earned Doctorates (SED). The SED data collection for field of study changed in 2021, which may affect the data comparison across years. This figure uses the trend field taxonomy that facilitates trend data comparisons with prior years; for more information, see the "Technical Notes" in https://ncses.nsf.gov/surveys/earned-doctorates/2023.
National Center for Science and Engineering Statistics (NCSES), special tabulations (2024) of the National Center for Education Statistics, Integrated Postsecondary Education Data System (IPEDS), Completions Survey, provisional release data, and NCSES, SED, 2023.
Science and Engineering Indicators
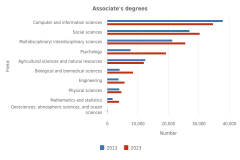
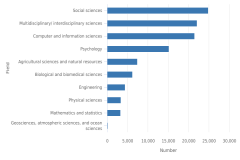
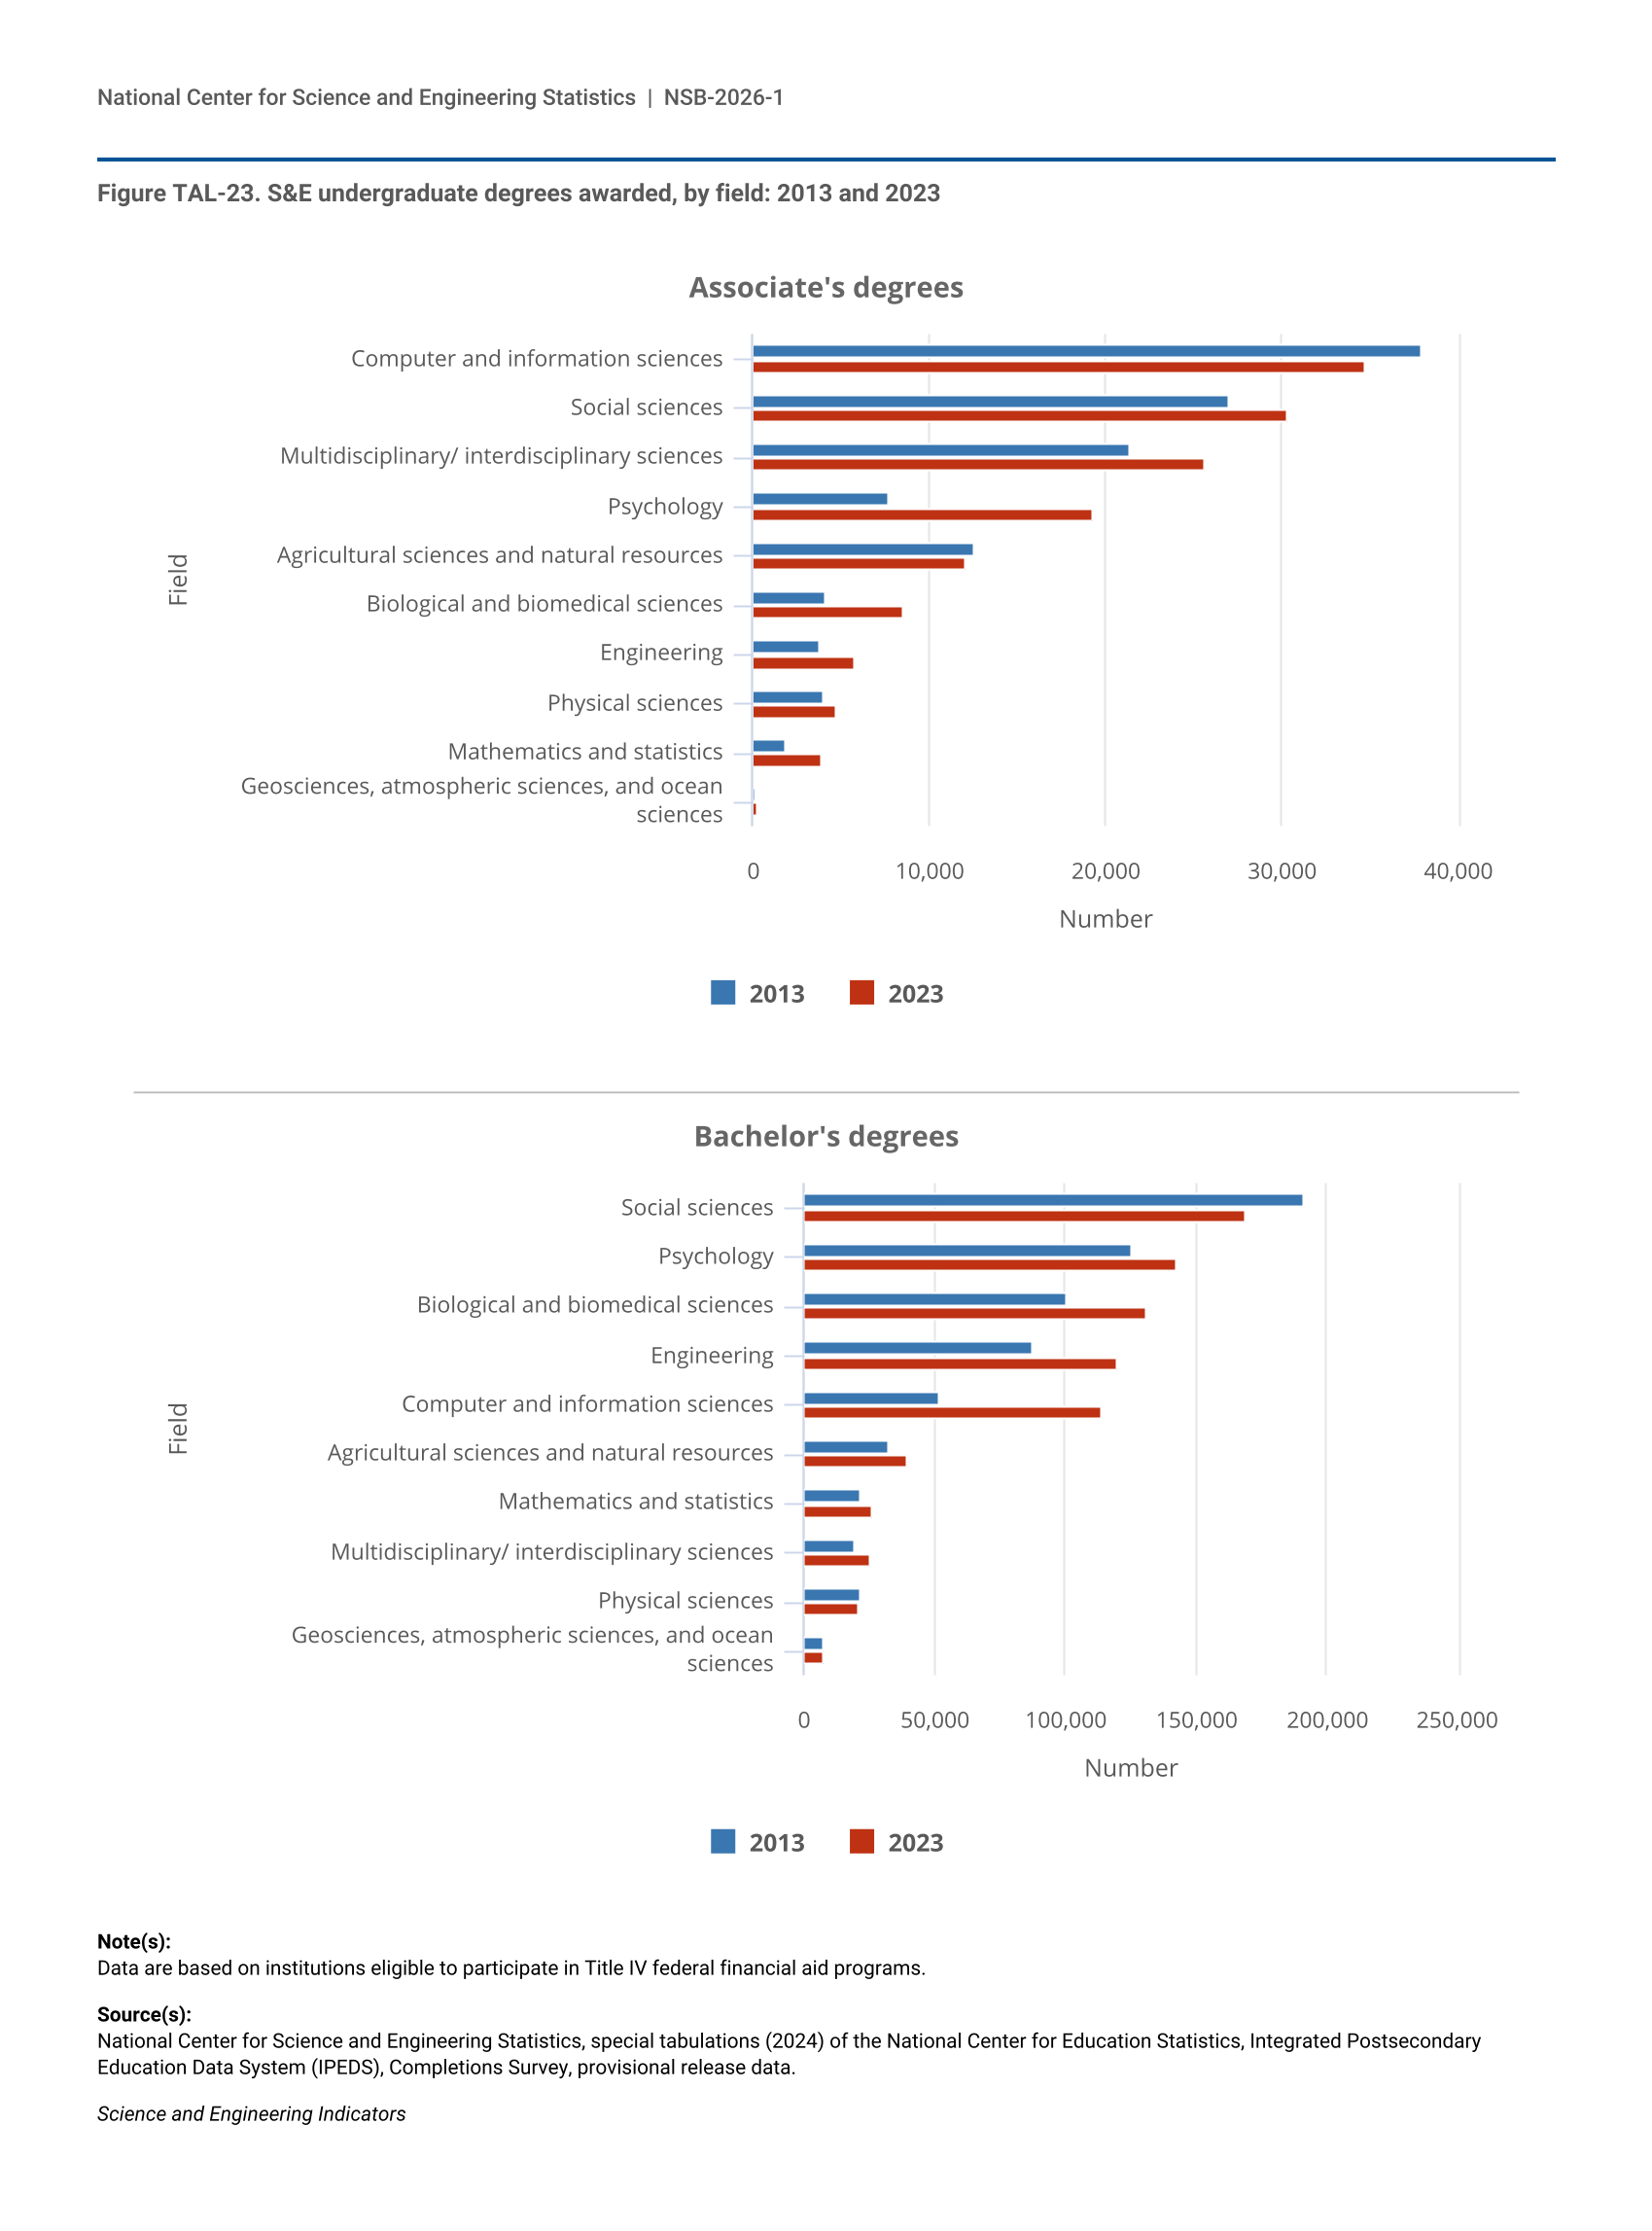
At the associate’s level, computer and information sciences, social sciences, and multidisciplinary/interdisciplinary sciences were the most common S&E fields in 2013 and 2023 (Figure TAL-23). Although the number of associate’s degrees awarded in computer and information sciences declined during this period, the number in multidisciplinary/interdisciplinary sciences, which includes fields such as computational science and engineering and data analytics, increased. At the bachelor’s level, social sciences remained the most popular S&E field in 2023, although the number of awards has decreased since 2013. The number of computer and information sciences bachelor’s degrees more than doubled over the decade, from 52,000 to 114,000.
| Field | 2013 | 2023 |
|---|---|---|
| Computer and information sciences | 37,937 | 34,712 |
| Social sciences | 26,982 | 30,365 |
| Multidisciplinary/ interdisciplinary sciences | 21,323 | 25,670 |
| Psychology | 7,657 | 19,300 |
| Agricultural sciences and natural resources | 12,501 | 12,110 |
| Biological and biomedical sciences | 4,191 | 8,538 |
| Engineering | 3,811 | 5,714 |
| Physical sciences | 3,998 | 4,703 |
| Mathematics and statistics | 1,802 | 3,874 |
| Geosciences, atmospheric sciences, and ocean sciences | 144 | 201 |
| Field | 2013 | 2023 |
|---|---|---|
| Social sciences | 191,217 | 168,348 |
| Psychology | 125,025 | 142,565 |
| Biological and biomedical sciences | 100,577 | 130,637 |
| Engineering | 87,075 | 120,208 |
| Computer and information sciences | 51,507 | 114,078 |
| Agricultural sciences and natural resources | 32,574 | 39,780 |
| Mathematics and statistics | 21,506 | 26,539 |
| Multidisciplinary/ interdisciplinary sciences | 19,529 | 25,630 |
| Physical sciences | 21,414 | 21,155 |
| Geosciences, atmospheric sciences, and ocean sciences | 7,535 | 7,832 |
Data are based on institutions eligible to participate in Title IV federal financial aid programs.
National Center for Science and Engineering Statistics, special tabulations (2024) of the National Center for Education Statistics, Integrated Postsecondary Education Data System (IPEDS), Completions Survey, provisional release data.
Science and Engineering Indicators
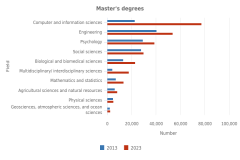
In 2023, computer and information sciences was the most popular S&E field for master’s degree recipients, followed by engineering, which had been the most popular field in 2013 (Figure TAL-24). In contrast, at the doctoral level, relatively few research doctoral degree recipients studied computer and information sciences. Instead, the largest number of research doctoral degree recipients in 2023 studied engineering, followed by biological and biomedical sciences, then by physical sciences.
| Field | 2013 | 2023 |
|---|---|---|
| Computer and information sciences | 22,833 | 77,223 |
| Engineering | 40,612 | 53,706 |
| Psychology | 29,244 | 38,901 |
| Social sciences | 27,757 | 30,002 |
| Biological and biomedical sciences | 13,227 | 22,939 |
| Multidisciplinary/ interdisciplinary sciences | 4,292 | 17,931 |
| Mathematics and statistics | 7,313 | 13,390 |
| Agricultural sciences and natural resources | 6,282 | 8,320 |
| Physical sciences | 4,912 | 5,277 |
| Geosciences, atmospheric sciences, and ocean sciences | 2,315 | 2,444 |
| Field | 2013 | 2023 |
|---|---|---|
| Engineering | 9,000 | 11,403 |
| Biological and biomedical sciences | 8,707 | 9,575 |
| Physical sciences | 4,595 | 5,460 |
| Social sciences | 5,041 | 5,199 |
| Psychology | 3,592 | 3,899 |
| Computer and information sciences | 1,843 | 2,687 |
| Health sciences | 2,109 | 2,435 |
| Mathematics and statistics | 1,817 | 2,167 |
| Agricultural sciences and natural resources | 1,391 | 1,477 |
| Geosciences, atmospheric sciences, and ocean sciences | 989 | 1,231 |
Master’s-level data are based on institutions eligible to participate in Title IV federal financial aid programs. Health sciences are classified in S&E only at the doctoral level. Doctoral-level data correspond to research doctorates as collected in the Survey of Earned Doctorates (SED). The SED data collection for field of study changed in 2021, which may affect the data comparison across years. This figure uses the trend field taxonomy that facilitates trend data comparisons with prior years; for more information, see the "Technical Notes" in https://ncses.nsf.gov/surveys/earned-doctorates/2023.
National Center for Science and Engineering Statistics (NCSES), special tabulations (2024) of the National Center for Education Statistics, Integrated Postsecondary Education Data System (IPEDS), Completions Survey, provisional release data, and NCSES, SED, 2023.
Science and Engineering Indicators
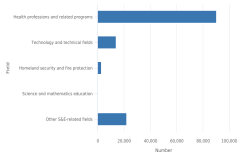
In contrast with the growth in S&E degrees at all levels between 2013 and 2023, the trend in the number of S&E-related awards differed by degree level (Figure TAL-25). During that period, the number of S&E-related associate’s degrees awarded decreased, whereas the number of bachelor’s and master’s degrees increased. The number of S&E bachelor’s degrees increased continuously through 2021 but declined in the following 2 years; however, the number awarded is still 35% higher than in 2013. At the associate’s, bachelor’s, and master’s levels, the most popular field of study among S&E-related fields was health professions and related programs (Table TAL-11). The number of degrees in science and mathematics teacher education decreased at these three degree levels, most notably at the bachelor’s level. In 2013, the number of bachelor’s degrees in science and mathematics teacher education (4,874) was larger than the number of master’s degrees (3,990); however, by 2023, the number of master’s degrees in this field (3,508) surpassed the number at the bachelor’s level (3,306).
| Year | Associate's degrees | Bachelor's degrees | Master's degrees |
|---|---|---|---|
| 2013 | 288,495 | 234,075 | 105,786 |
| 2014 | 281,774 | 253,671 | 112,194 |
| 2015 | 273,943 | 273,893 | 117,470 |
| 2016 | 261,833 | 287,445 | 126,393 |
| 2017 | 258,048 | 298,709 | 136,877 |
| 2018 | 253,585 | 307,096 | 143,154 |
| 2019 | 255,426 | 315,432 | 148,630 |
| 2020 | 245,644 | 322,133 | 152,812 |
| 2021 | 253,005 | 333,920 | 160,649 |
| 2022 | 250,987 | 328,711 | 165,358 |
| 2023 | 249,738 | 314,852 | 168,460 |
Data are based on institutions eligible to participate in Title IV federal financial aid programs.
National Center for Science and Engineering Statistics, special tabulations (2024) of the National Center for Education Statistics, Integrated Postsecondary Education Data System (IPEDS), Completions Survey, provisional release data.
Science and Engineering Indicators
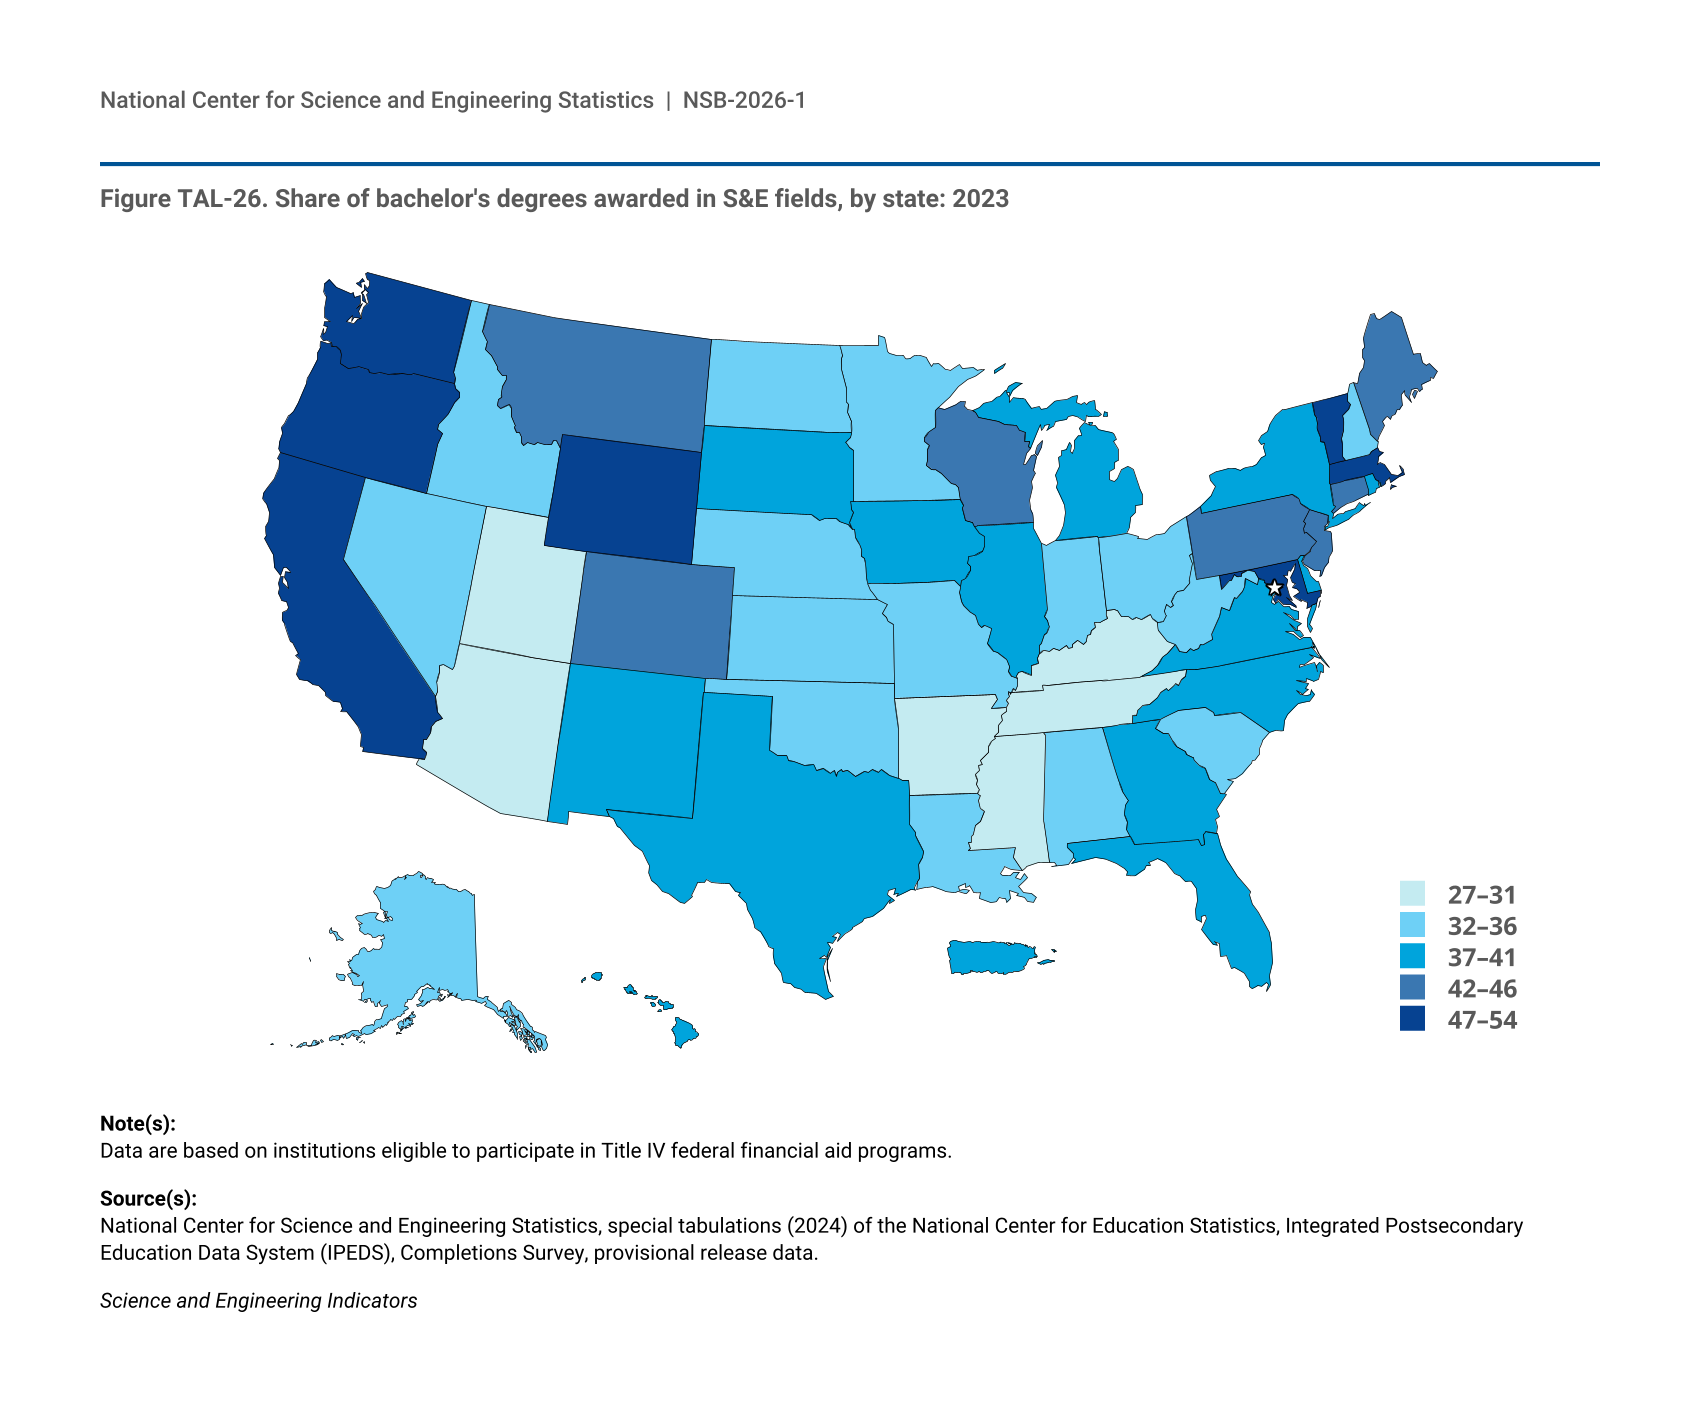
S&E Degrees by State
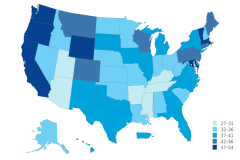
The availability of S&E training varies by geography. Higher education institutions vary in the percentage of degrees they award in S&E fields, and this variation is apparent at the state level. The share of bachelor’s degrees awarded in S&E fields by institutions within their geographic boundaries ranged from 27% in Arizona to 54% in Vermont (Figure TAL-26).
| State | Percent |
|---|---|
| Alabama | 32.7 |
| Alaska | 33.3 |
| Arizona | 26.7 |
| Arkansas | 29.6 |
| California | 50.7 |
| Colorado | 46.0 |
| Connecticut | 42.6 |
| Delaware | 41.0 |
| District of Columbia | 50.7 |
| Florida | 38.0 |
| Georgia | 40.7 |
| Hawaii | 38.6 |
| Idaho | 36.8 |
| Illinois | 37.3 |
| Indiana | 36.4 |
| Iowa | 37.4 |
| Kansas | 34.4 |
| Kentucky | 30.8 |
| Louisiana | 36.6 |
| Maine | 43.8 |
| Maryland | 52.6 |
| Massachusetts | 48.8 |
| Michigan | 41.4 |
| Minnesota | 34.7 |
| Mississippi | 30.9 |
| Missouri | 34.6 |
| Montana | 44.5 |
| Nebraska | 34.6 |
| Nevada | 36.0 |
| New Hampshire | 33.4 |
| New Jersey | 42.6 |
| New Mexico | 37.3 |
| New York | 41.9 |
| North Carolina | 41.4 |
| North Dakota | 33.7 |
| Ohio | 35.9 |
| Oklahoma | 33.7 |
| Oregon | 49.8 |
| Pennsylvania | 42.9 |
| Puerto Rico | 40.0 |
| Rhode Island | 39.5 |
| South Carolina | 36.4 |
| South Dakota | 38.9 |
| Tennessee | 31.4 |
| Texas | 38.6 |
| Utah | 30.5 |
| Vermont | 53.7 |
| Virginia | 41.2 |
| Washington | 49.5 |
| West Virginia | 32.2 |
| Wisconsin | 42.4 |
| Wyoming | 47.0 |
Data are based on institutions eligible to participate in Title IV federal financial aid programs.
National Center for Science and Engineering Statistics, special tabulations (2024) of the National Center for Education Statistics, Integrated Postsecondary Education Data System (IPEDS), Completions Survey, provisional release data.
Science and Engineering Indicators
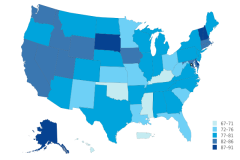
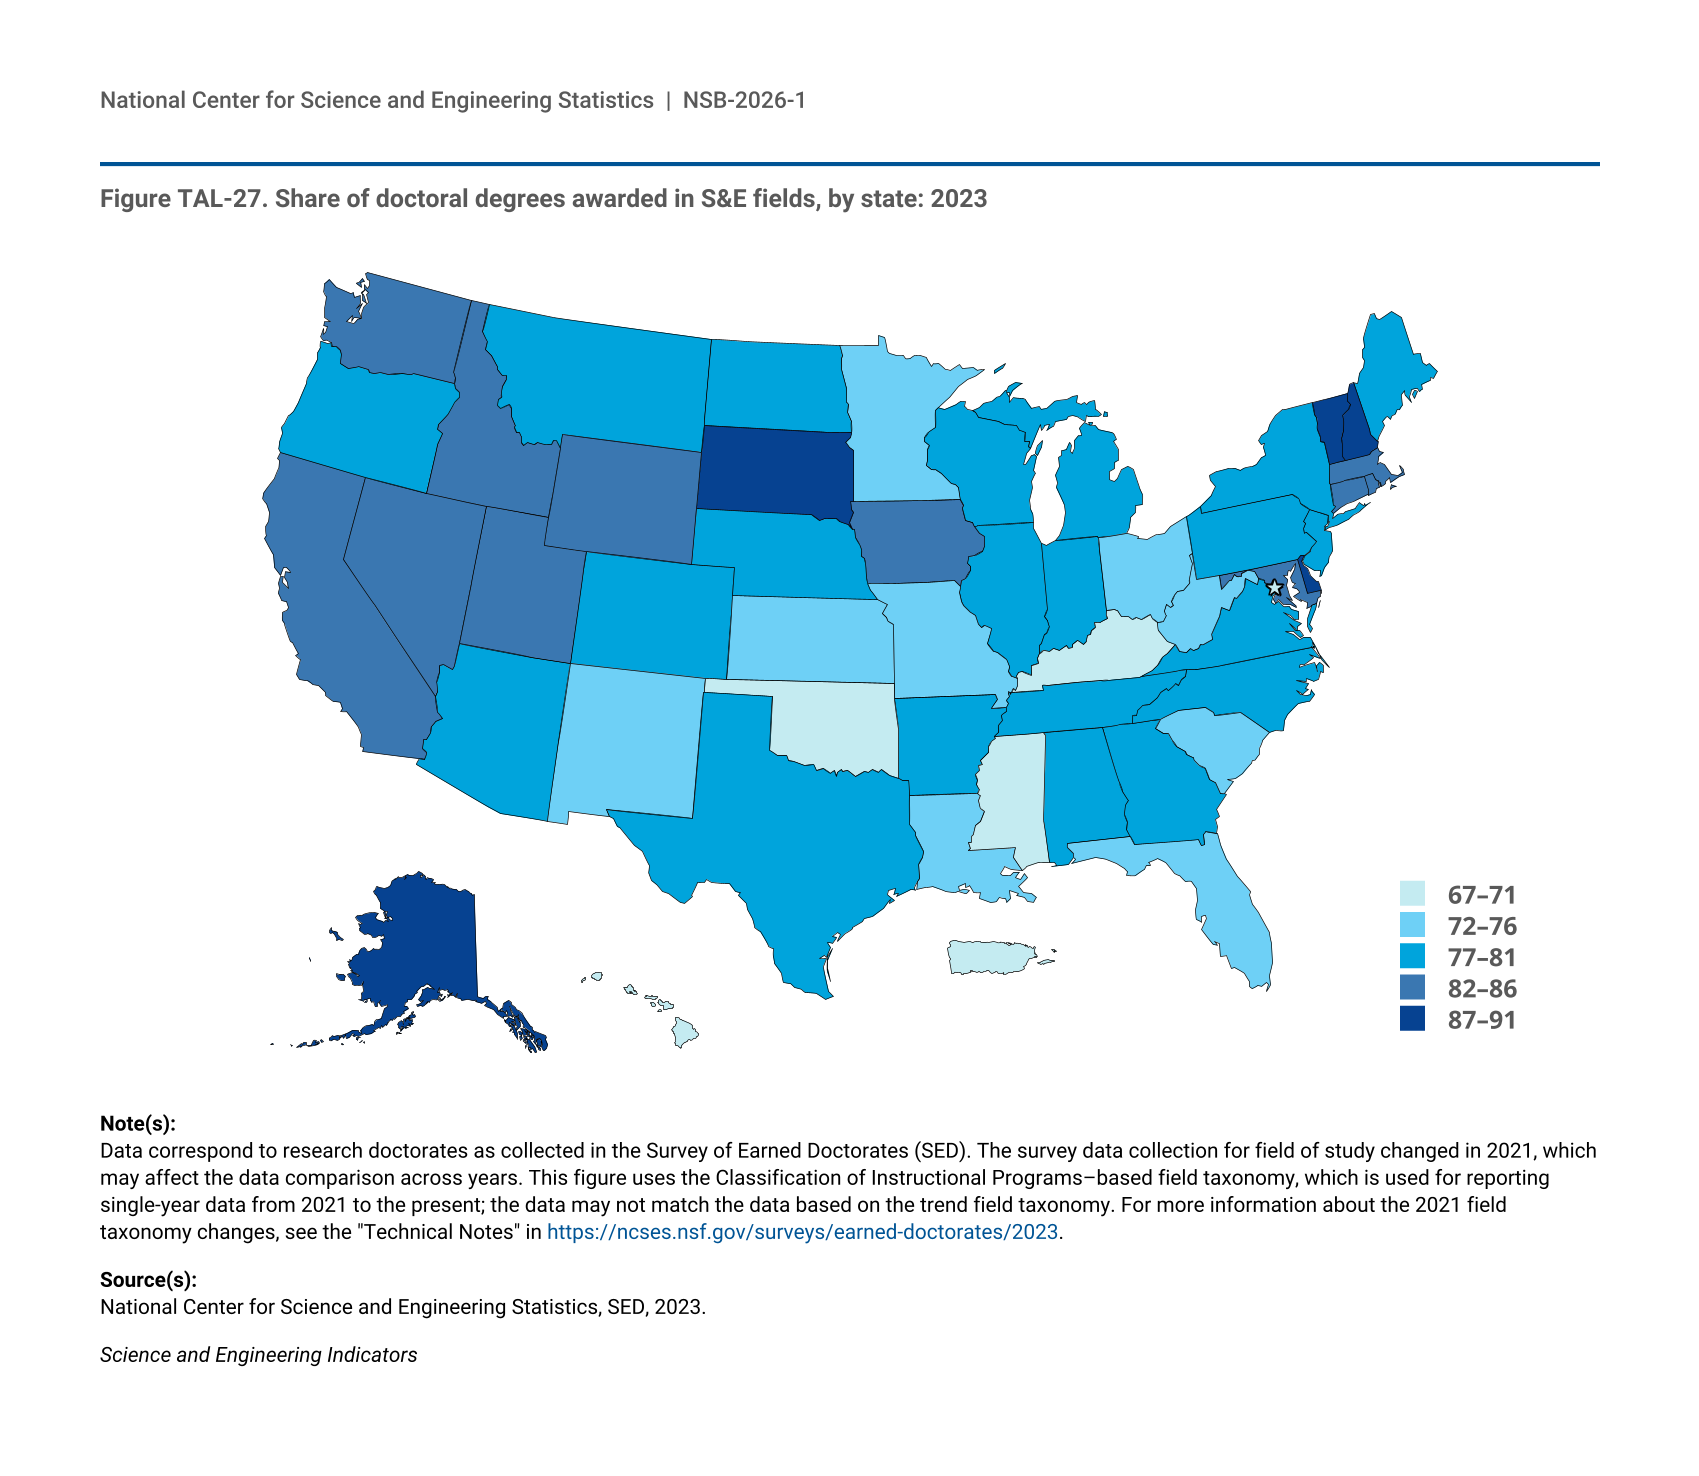
At the doctoral level, institutions in several states produced considerably higher concentrations of S&E degrees than were observed at the bachelor’s level. New Hampshire, Alaska, Delaware, and South Dakota had the highest share of doctoral degrees awarded in S&E fields of any state—90% or higher—although they awarded low numbers of doctoral degrees when compared with states like California or Texas (Figure TAL-27) (NCSES 2024b: Table 7-6). In 2023, Mississippi and Hawaii awarded the lowest proportion of doctoral degrees in S&E fields (67% and 68%, respectively).
| State | Percent |
|---|---|
| Alabama | 79.9 |
| Alaska | 91.4 |
| Arizona | 79.1 |
| Arkansas | 80.4 |
| California | 84.2 |
| Colorado | 81.6 |
| Connecticut | 82.5 |
| Delaware | 90.8 |
| District of Columbia | 71.8 |
| Florida | 75.5 |
| Georgia | 79.6 |
| Hawaii | 68.3 |
| Idaho | 83.9 |
| Illinois | 77.0 |
| Indiana | 79.6 |
| Iowa | 82.2 |
| Kansas | 75.6 |
| Kentucky | 70.5 |
| Louisiana | 73.3 |
| Maine | 81.5 |
| Maryland | 83.7 |
| Massachusetts | 83.8 |
| Michigan | 80.1 |
| Minnesota | 73.1 |
| Mississippi | 66.5 |
| Missouri | 75.2 |
| Montana | 79.0 |
| Nebraska | 79.9 |
| Nevada | 83.8 |
| New Hampshire | 91.4 |
| New Jersey | 77.6 |
| New Mexico | 75.2 |
| New York | 78.4 |
| North Carolina | 81.5 |
| North Dakota | 81.4 |
| Ohio | 76.4 |
| Oklahoma | 71.7 |
| Oregon | 81.7 |
| Pennsylvania | 79.9 |
| Puerto Rico | 71.2 |
| Rhode Island | 86.6 |
| South Carolina | 76.2 |
| South Dakota | 89.7 |
| Tennessee | 77.7 |
| Texas | 77.2 |
| Utah | 85.1 |
| Vermont | 89.4 |
| Virginia | 79.1 |
| Washington | 84.4 |
| West Virginia | 73.5 |
| Wisconsin | 77.2 |
| Wyoming | 84.9 |
Data correspond to research doctorates as collected in the Survey of Earned Doctorates (SED). The survey data collection for field of study changed in 2021, which may affect the data comparison across years. This figure uses the Classification of Instructional Programs–based field taxonomy, which is used for reporting single-year data from 2021 to the present; the data may not match the data based on the trend field taxonomy. For more information about the 2021 field taxonomy changes, see the "Technical Notes" in https://ncses.nsf.gov/surveys/earned-doctorates/2023.
National Center for Science and Engineering Statistics, SED, 2023.
Science and Engineering Indicators
STEM Degrees by Demographics
The demographic composition of S&E degree recipients varies by field of study. This section presents data on S&E degrees by sex, race and ethnicity, and citizenship status.
STEM Degrees by Sex
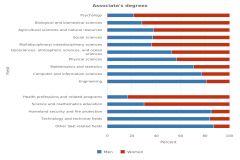
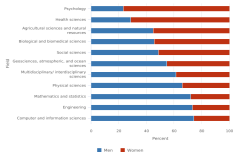
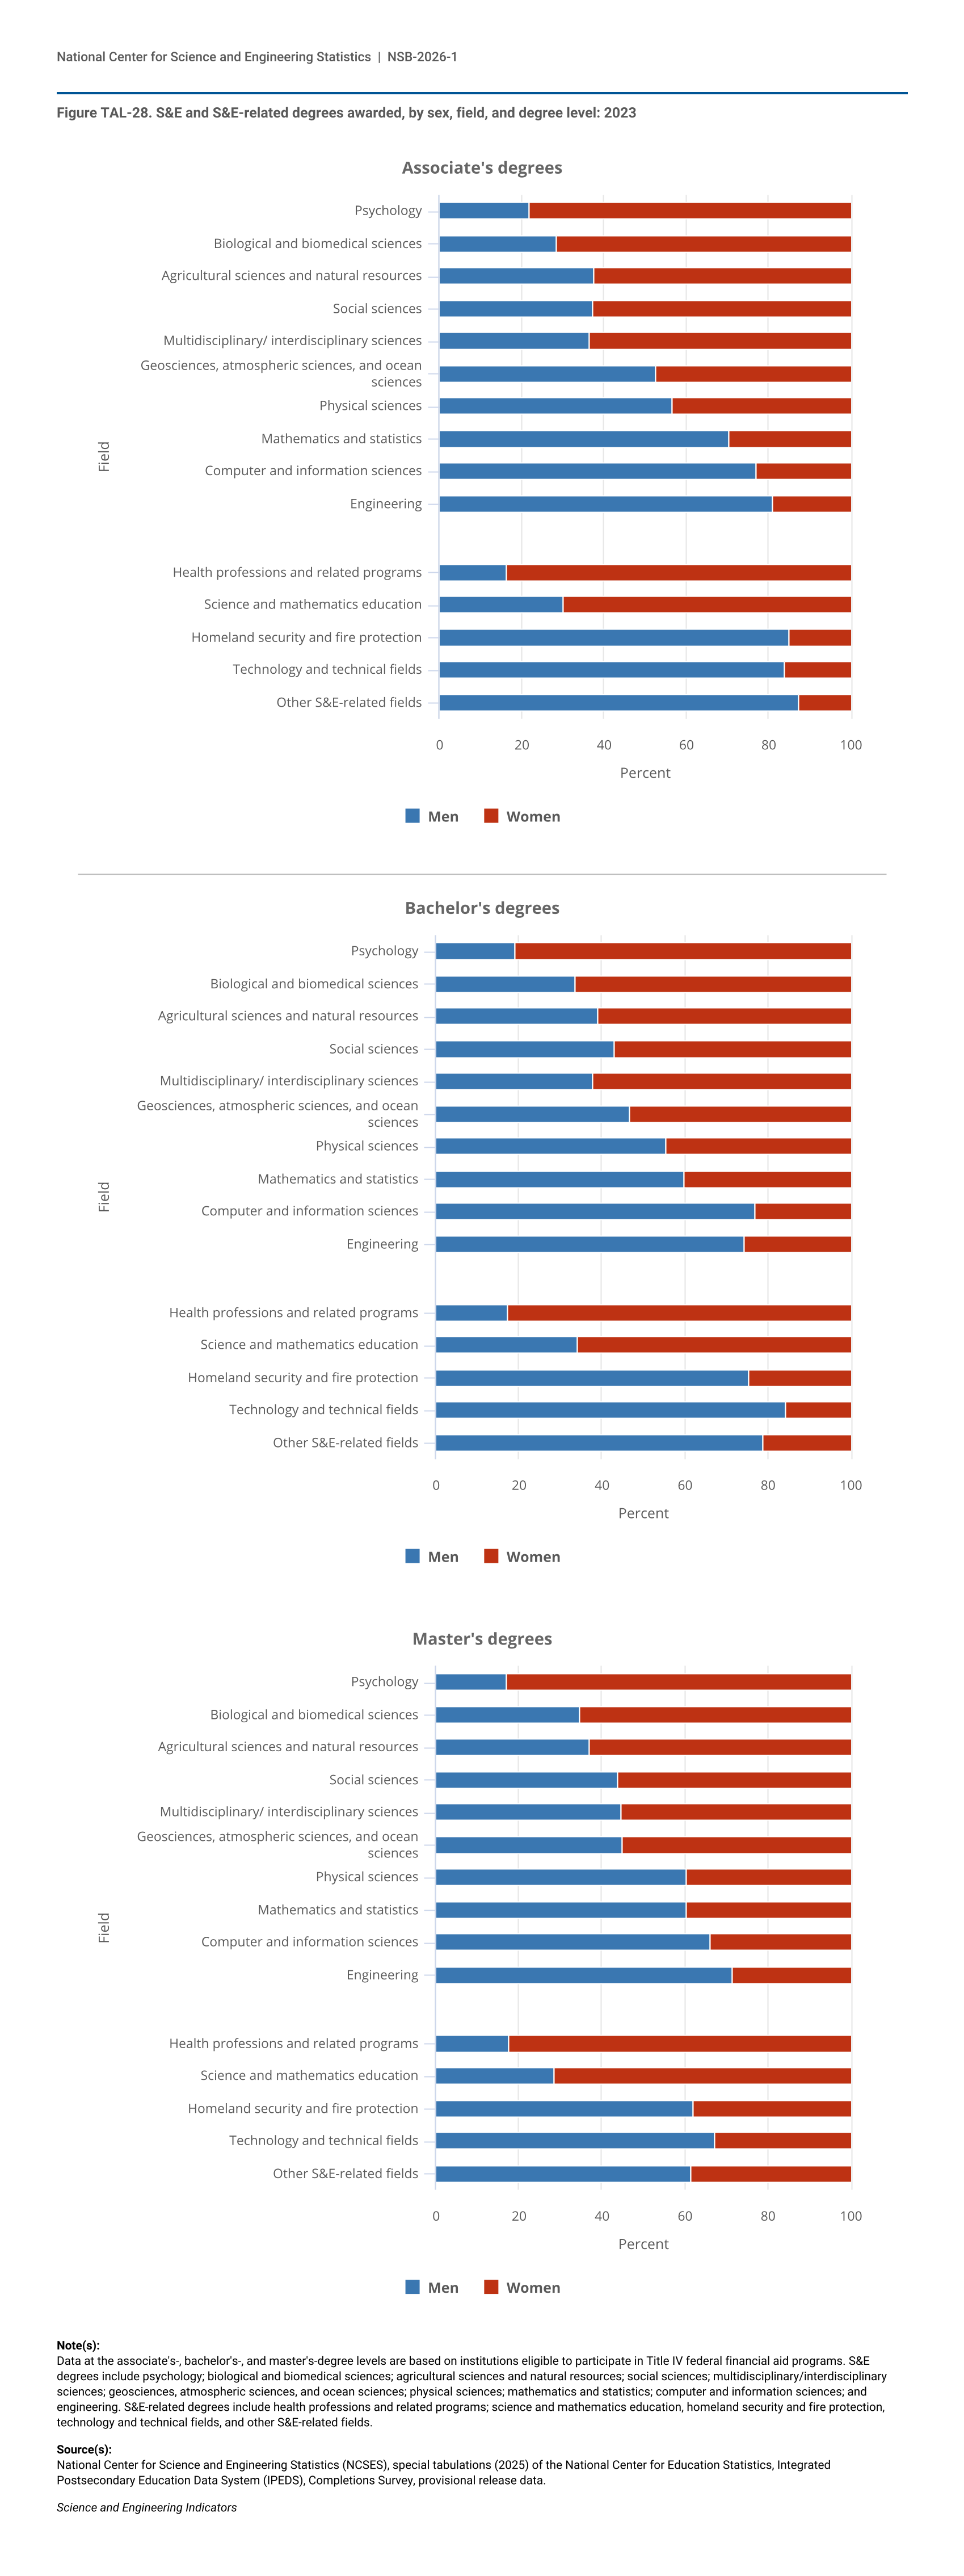
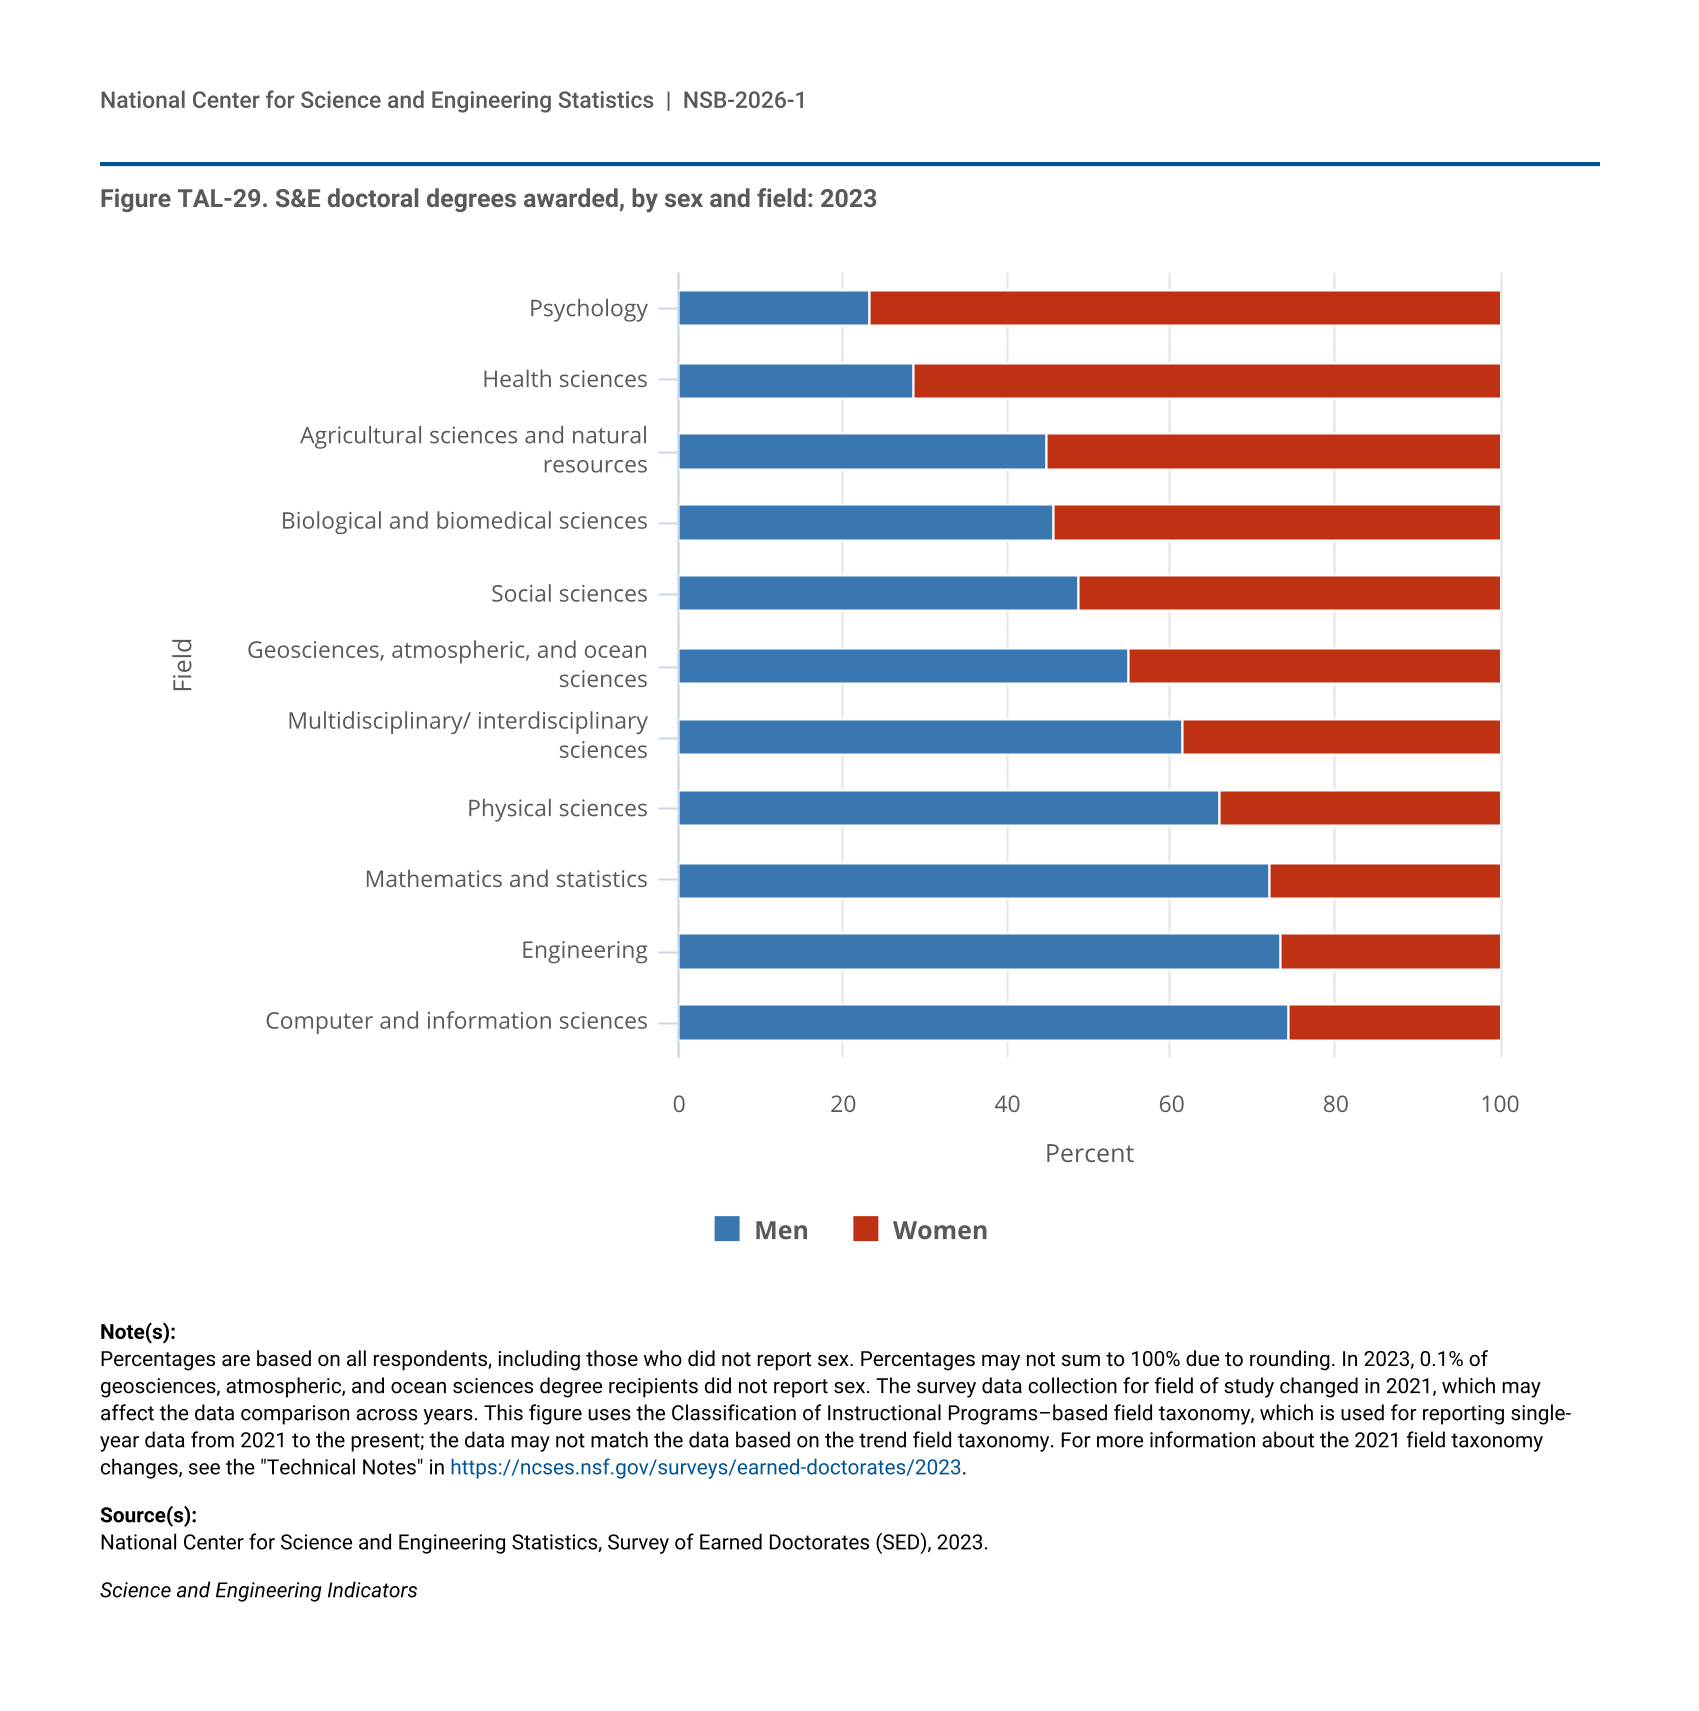
The proportion of S&E degrees that men and women earned in 2023 differed by field and by award level (Figure TAL-28, Figure TAL-29). Across all award levels, men earned larger proportions of degrees than women in engineering, computer and information sciences, mathematics and statistics, and physical sciences. At the associate’s, bachelor’s, and master’s levels, women earned larger proportions of degrees than men in psychology, biological and biomedical sciences, agricultural sciences and natural resources, social sciences, and multidisciplinary/interdisciplinary sciences. In geosciences, atmospheric sciences, and ocean sciences, men earned more than half of the associate’s and doctoral degrees, and women earned more than half of the bachelor’s and master’s degrees. Men earned the highest shares of degrees in engineering, accounting for at least 72% of the degrees at any level, and in computer and information sciences, accounting for at least 66% of the degrees at any level. Women earned the highest shares of degrees in psychology, with at least 77% of the degrees at any level. In the physical sciences, the proportion of awards that women earned was lower at the master’s and doctoral levels than at the undergraduate levels. The proportion of women in mathematics and statistics was highest at the bachelor’s and master’s levels (about 40% of women in each) and lowest at the associate’s and doctoral levels (29% and 28%, respectively).
| Field | Men | Women |
|---|---|---|
| Psychology | 21.8 | 78.2 |
| Biological and biomedical sciences | 28.5 | 71.5 |
| Agricultural sciences and natural resources | 37.7 | 62.3 |
| Social sciences | 37.3 | 62.7 |
| Multidisciplinary/ interdisciplinary sciences | 36.6 | 63.4 |
| Geosciences, atmospheric sciences, and ocean sciences | 52.7 | 47.3 |
| Physical sciences | 56.7 | 43.3 |
| Mathematics and statistics | 70.5 | 29.5 |
| Computer and information sciences | 76.9 | 23.1 |
| Engineering | 81.1 | 18.9 |
| Health professions and related programs | 16.3 | 83.7 |
| Science and mathematics education | 30.3 | 69.7 |
| Homeland security and fire protection | 85.2 | 14.8 |
| Technology and technical fields | 83.9 | 16.1 |
| Other S&E-related fields | 87.4 | 12.6 |
| Field | Men | Women |
|---|---|---|
| Psychology | 19.1 | 80.9 |
| Biological and biomedical sciences | 33.5 | 66.5 |
| Agricultural sciences and natural resources | 38.9 | 61.1 |
| Social sciences | 43.0 | 57.0 |
| Multidisciplinary/ interdisciplinary sciences | 37.9 | 62.1 |
| Geosciences, atmospheric sciences, and ocean sciences | 46.7 | 53.3 |
| Physical sciences | 55.5 | 44.5 |
| Mathematics and statistics | 59.8 | 40.2 |
| Computer and information sciences | 77.0 | 23.0 |
| Engineering | 74.4 | 25.6 |
| Health professions and related programs | 17.5 | 82.5 |
| Science and mathematics education | 34.1 | 65.9 |
| Homeland security and fire protection | 75.6 | 24.4 |
| Technology and technical fields | 84.3 | 15.7 |
| Other S&E-related fields | 79.0 | 21.0 |
| Field | Men | Women |
|---|---|---|
| Psychology | 17.2 | 82.8 |
| Biological and biomedical sciences | 34.7 | 65.3 |
| Agricultural sciences and natural resources | 36.9 | 63.1 |
| Social sciences | 43.9 | 56.1 |
| Multidisciplinary/ interdisciplinary sciences | 44.7 | 55.3 |
| Geosciences, atmospheric sciences, and ocean sciences | 45.0 | 55.0 |
| Physical sciences | 60.5 | 39.5 |
| Mathematics and statistics | 60.5 | 39.5 |
| Computer and information sciences | 66.0 | 34.0 |
| Engineering | 71.5 | 28.5 |
| Health professions and related programs | 17.8 | 82.2 |
| Science and mathematics education | 28.4 | 71.6 |
| Homeland security and fire protection | 62.1 | 37.9 |
| Technology and technical fields | 67.1 | 32.9 |
| Other S&E-related fields | 61.5 | 38.5 |
Data at the associate's-, bachelor's-, and master's-degree levels are based on institutions eligible to participate in Title IV federal financial aid programs. S&E degrees include psychology; biological and biomedical sciences; agricultural sciences and natural resources; social sciences; multidisciplinary/interdisciplinary sciences; geosciences, atmospheric sciences, and ocean sciences; physical sciences; mathematics and statistics; computer and information sciences; and engineering. S&E-related degrees include health professions and related programs; science and mathematics education, homeland security and fire protection, technology and technical fields, and other S&E-related fields.
National Center for Science and Engineering Statistics (NCSES), special tabulations (2025) of the National Center for Education Statistics, Integrated Postsecondary Education Data System (IPEDS), Completions Survey, provisional release data.
Science and Engineering Indicators
In 2023, the proportion of S&E-related degrees earned by men and women also differed by field and degree level (Figure TAL-28). Across all award levels, men earned larger proportions of degrees than women in homeland security and fire protection, technology and technical fields, and other S&E-related fields. Women earned larger proportions of degrees than men in the health professions and related programs and in science and mathematics education.
| Field | Men | Women |
|---|---|---|
| Psychology | 23.3 | 76.6 |
| Health sciences | 28.7 | 71.3 |
| Agricultural sciences and natural resources | 44.8 | 55.2 |
| Biological and biomedical sciences | 45.6 | 54.4 |
| Social sciences | 48.7 | 51.2 |
| Geosciences, atmospheric, and ocean sciences | 54.9 | 45.0 |
| Multidisciplinary/ interdisciplinary sciences | 61.3 | 38.7 |
| Physical sciences | 66.0 | 34.0 |
| Mathematics and statistics | 72.0 | 28.0 |
| Engineering | 73.4 | 26.6 |
| Computer and information sciences | 74.4 | 25.6 |
Percentages are based on all respondents, including those who did not report sex. Percentages may not sum to 100% due to rounding. In 2023, 0.1% of geosciences, atmospheric, and ocean sciences degree recipients did not report sex. The survey data collection for field of study changed in 2021, which may affect the data comparison across years. This figure uses the Classification of Instructional Programs–based field taxonomy, which is used for reporting single-year data from 2021 to the present; the data may not match the data based on the trend field taxonomy. For more information about the 2021 field taxonomy changes, see the "Technical Notes" in https://ncses.nsf.gov/surveys/earned-doctorates/2023.
National Center for Science and Engineering Statistics, Survey of Earned Doctorates (SED), 2023.
Science and Engineering Indicators
STEM Degrees by Race and Ethnicity
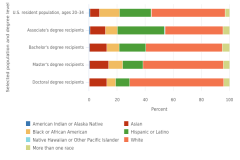
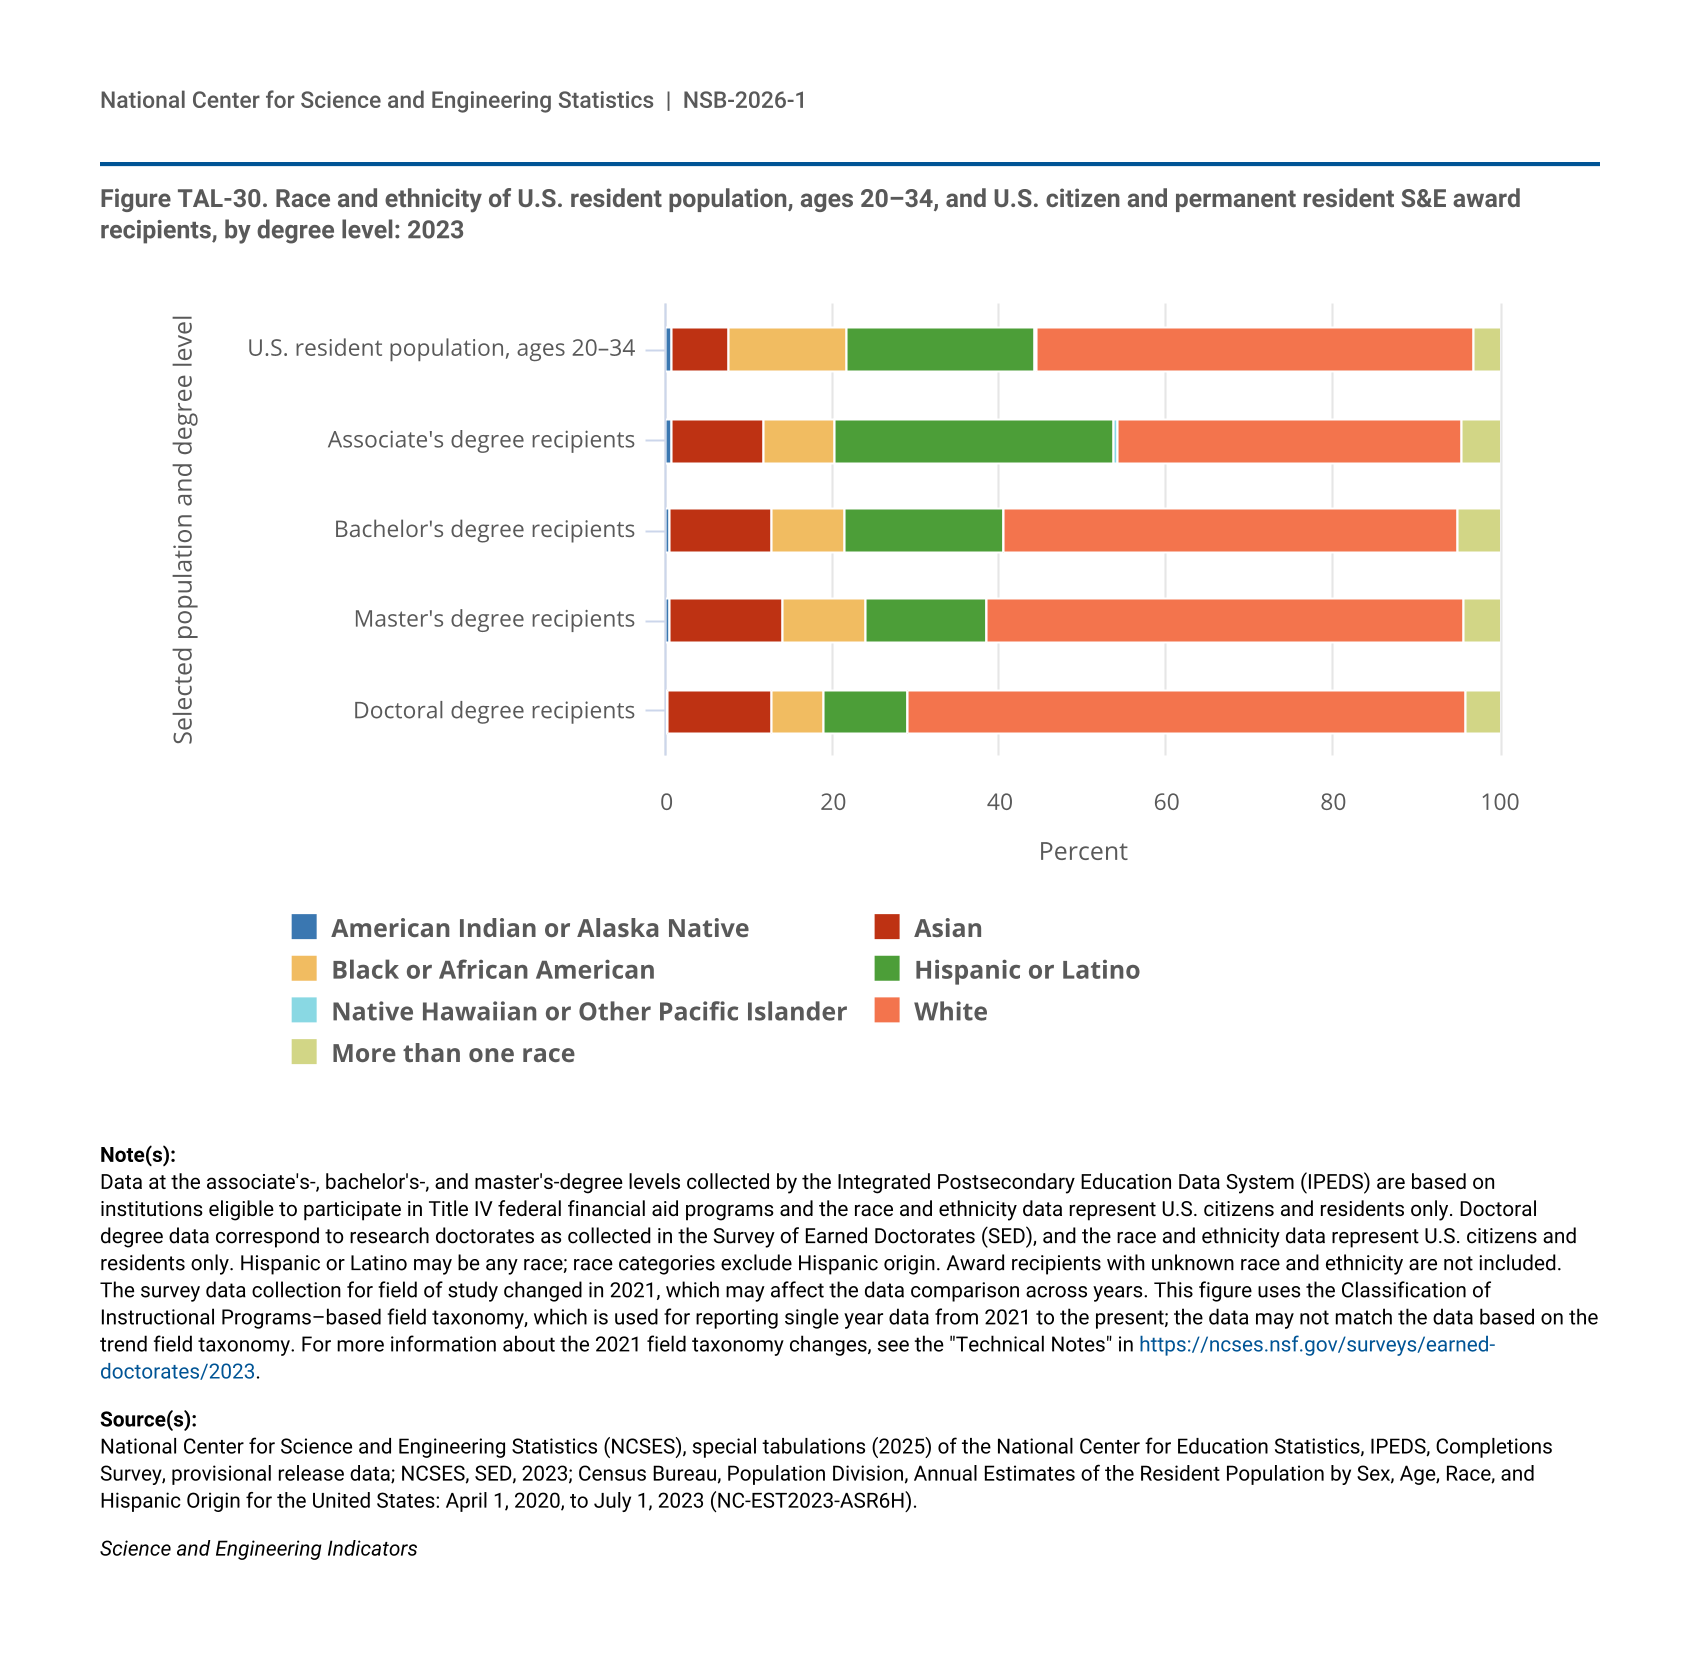
In 2023, relative to their shares of the U.S. population ages 20–34 years, racial and ethnic groups differed in the proportion of S&E degrees awarded at different degree levels (Figure TAL-30). White students earned a lower proportion of S&E associate’s degrees (41%) than their share of the 20- to 34-year-old U.S. population (53%). However, White students earned a share of the S&E bachelor’s degrees awarded (55%) similar to their proportion of the 20- to 34-year-old U.S. population. Asian students earned larger proportions of S&E degrees at all levels than their share of the U.S. population ages 20–34 years. In contrast, the proportion of S&E degree recipients among American Indian or Alaska Native, Black, and Hispanic students was lower than their respective shares of the U.S. population ages 20–34 years at most degree levels. One notable exception was that Hispanic students earned 34% of the S&E associate’s degrees awarded but comprised 23% of the U.S. population ages 20–34 years. Another exception was that American Indian or Alaska Native students earned the same proportion of associate’s degrees as their proportion in this population. Students who reported more than one race earned a higher proportion of S&E-related degrees at all degree levels relative to their shares of the 20- to 34-year-old U.S. population (Figure TAL-30). Native Hawaiian or Other Pacific Islander students earned a higher proportion at the associate’s level but a lower proportion at the bachelor’s, master’s, and doctoral levels relative to their shares of the 20- to 34-year-old U.S. population.
| Selected population and degree level | American Indian or Alaska Native | Asian | Black or African American | Hispanic or Latino | Native Hawaiian or Other Pacific Islander | White | More than one race |
|---|---|---|---|---|---|---|---|
| U.S. resident population, ages 20–34 | 0.8 | 6.7 | 14.2 | 22.5 | 0.2 | 52.7 | 2.9 |
| Associate's degree recipients | 0.8 | 10.9 | 8.5 | 33.6 | 0.4 | 41.2 | 4.6 |
| Bachelor's degree recipients | 0.4 | 12.3 | 8.8 | 18.9 | 0.2 | 54.5 | 4.9 |
| Master's degree recipients | 0.4 | 13.7 | 9.9 | 14.5 | 0.1 | 57.2 | 4.2 |
| Doctoral degree recipients | 0.3 | 12.4 | 6.3 | 9.9 | 0.1 | 67.0 | 4.0 |
Data at the associate's-, bachelor's-, and master's-degree levels collected by the Integrated Postsecondary Education Data System (IPEDS) are based on institutions eligible to participate in Title IV federal financial aid programs and the race and ethnicity data represent U.S. citizens and residents only. Doctoral degree data correspond to research doctorates as collected in the Survey of Earned Doctorates (SED), and the race and ethnicity data represent U.S. citizens and residents only. Hispanic or Latino may be any race; race categories exclude Hispanic origin. Award recipients with unknown race and ethnicity are not included. The survey data collection for field of study changed in 2021, which may affect the data comparison across years. This figure uses the Classification of Instructional Programs–based field taxonomy, which is used for reporting single year data from 2021 to the present; the data may not match the data based on the trend field taxonomy. For more information about the 2021 field taxonomy changes, see the "Technical Notes" in https://ncses.nsf.gov/surveys/earned-doctorates/2023.
National Center for Science and Engineering Statistics (NCSES), special tabulations (2025) of the National Center for Education Statistics, IPEDS, Completions Survey, provisional release data; NCSES, SED, 2023; Census Bureau, Population Division, Annual Estimates of the Resident Population by Sex, Age, Race, and Hispanic Origin for the United States: April 1, 2020, to July 1, 2023 (NC-EST2023-ASR6H).
Science and Engineering Indicators
STEM Degrees by Citizenship Status
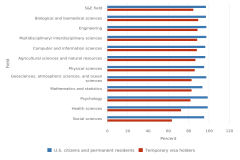
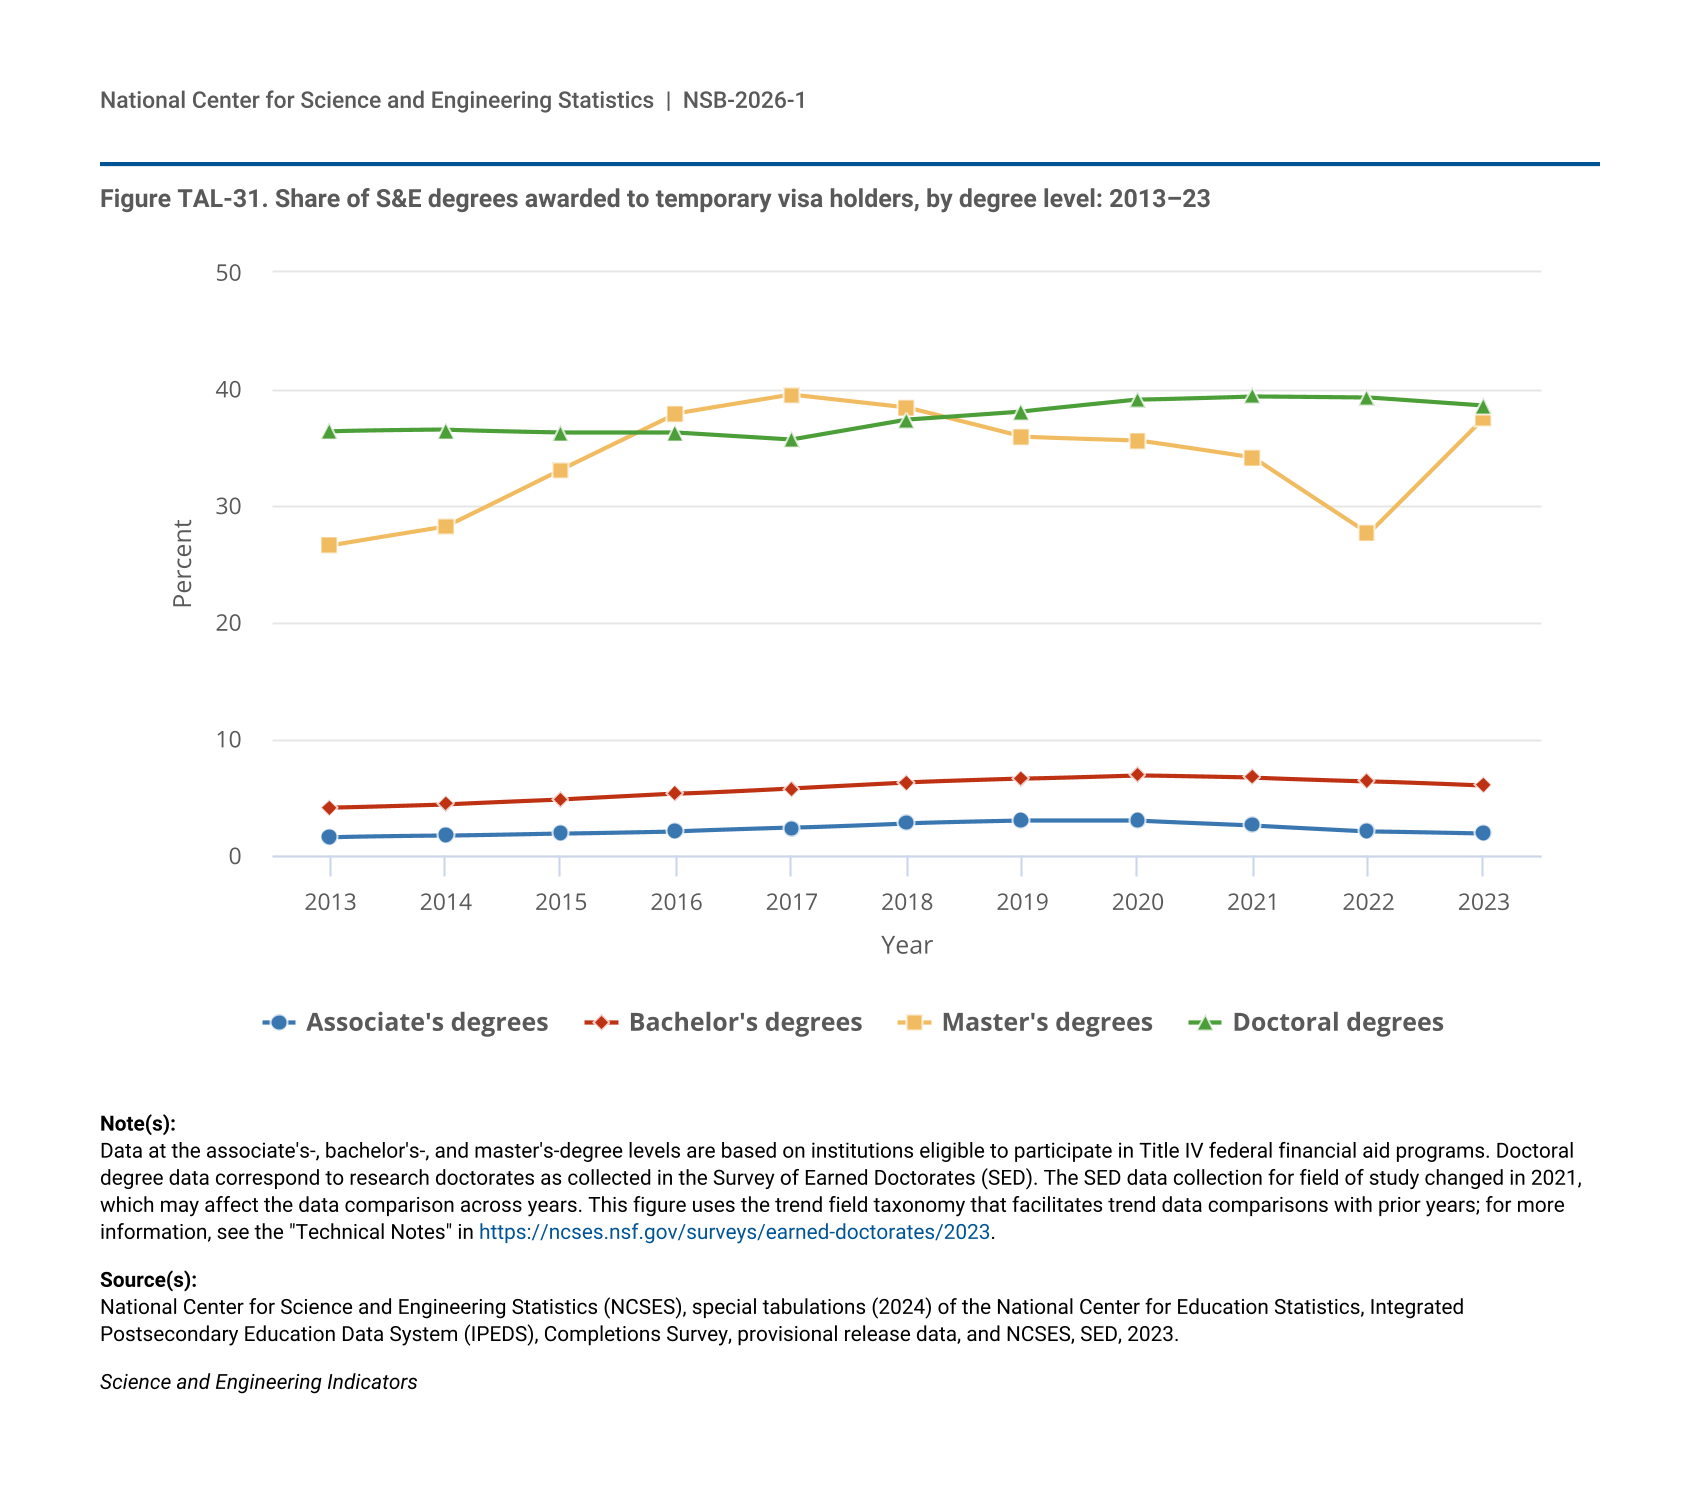
International students in the United States earn low shares of S&E postsecondary degrees at the associate’s and bachelor’s levels but much higher shares of S&E advanced degrees (Figure TAL-31). In 2023, temporary visa holders earned 2% of S&E associate’s degrees, 6% of S&E bachelor’s degrees, 38% of S&E master’s degrees, and 39% of S&E doctoral degrees. The share of S&E master’s degrees awarded to temporary visa holders fluctuated between 2013 and 2023; it peaked at 40% in 2017, declined to 28% in 2022, and increased to 38% in 2023. International students earn a low proportion of the associate’s, bachelor’s, and master’s degrees awarded in S&E-related fields (1%, 2%, and 6%, respectively) (Table STAL-20).
| Year | Associate's degrees | Bachelor's degrees | Master's degrees | Doctoral degrees |
|---|---|---|---|---|
| 2013 | 1.6 | 4.1 | 26.6 | 36.4 |
| 2014 | 1.7 | 4.4 | 28.2 | 36.5 |
| 2015 | 1.9 | 4.8 | 33.1 | 36.3 |
| 2016 | 2.1 | 5.3 | 37.9 | 36.3 |
| 2017 | 2.4 | 5.8 | 39.5 | 35.7 |
| 2018 | 2.8 | 6.3 | 38.4 | 37.4 |
| 2019 | 3.0 | 6.6 | 35.9 | 38.1 |
| 2020 | 3.0 | 6.9 | 35.6 | 39.1 |
| 2021 | 2.6 | 6.7 | 34.1 | 39.4 |
| 2022 | 2.1 | 6.4 | 27.6 | 39.3 |
| 2023 | 1.9 | 6.0 | 37.5 | 38.6 |
Data at the associate's-, bachelor's-, and master's-degree levels are based on institutions eligible to participate in Title IV federal financial aid programs. Doctoral degree data correspond to research doctorates as collected in the Survey of Earned Doctorates (SED). The SED data collection for field of study changed in 2021, which may affect the data comparison across years. This figure uses the trend field taxonomy that facilitates trend data comparisons with prior years; for more information, see the "Technical Notes" in https://ncses.nsf.gov/surveys/earned-doctorates/2023.
National Center for Science and Engineering Statistics (NCSES), special tabulations (2024) of the National Center for Education Statistics, Integrated Postsecondary Education Data System (IPEDS), Completions Survey, provisional release data, and NCSES, SED, 2023.
Science and Engineering Indicators
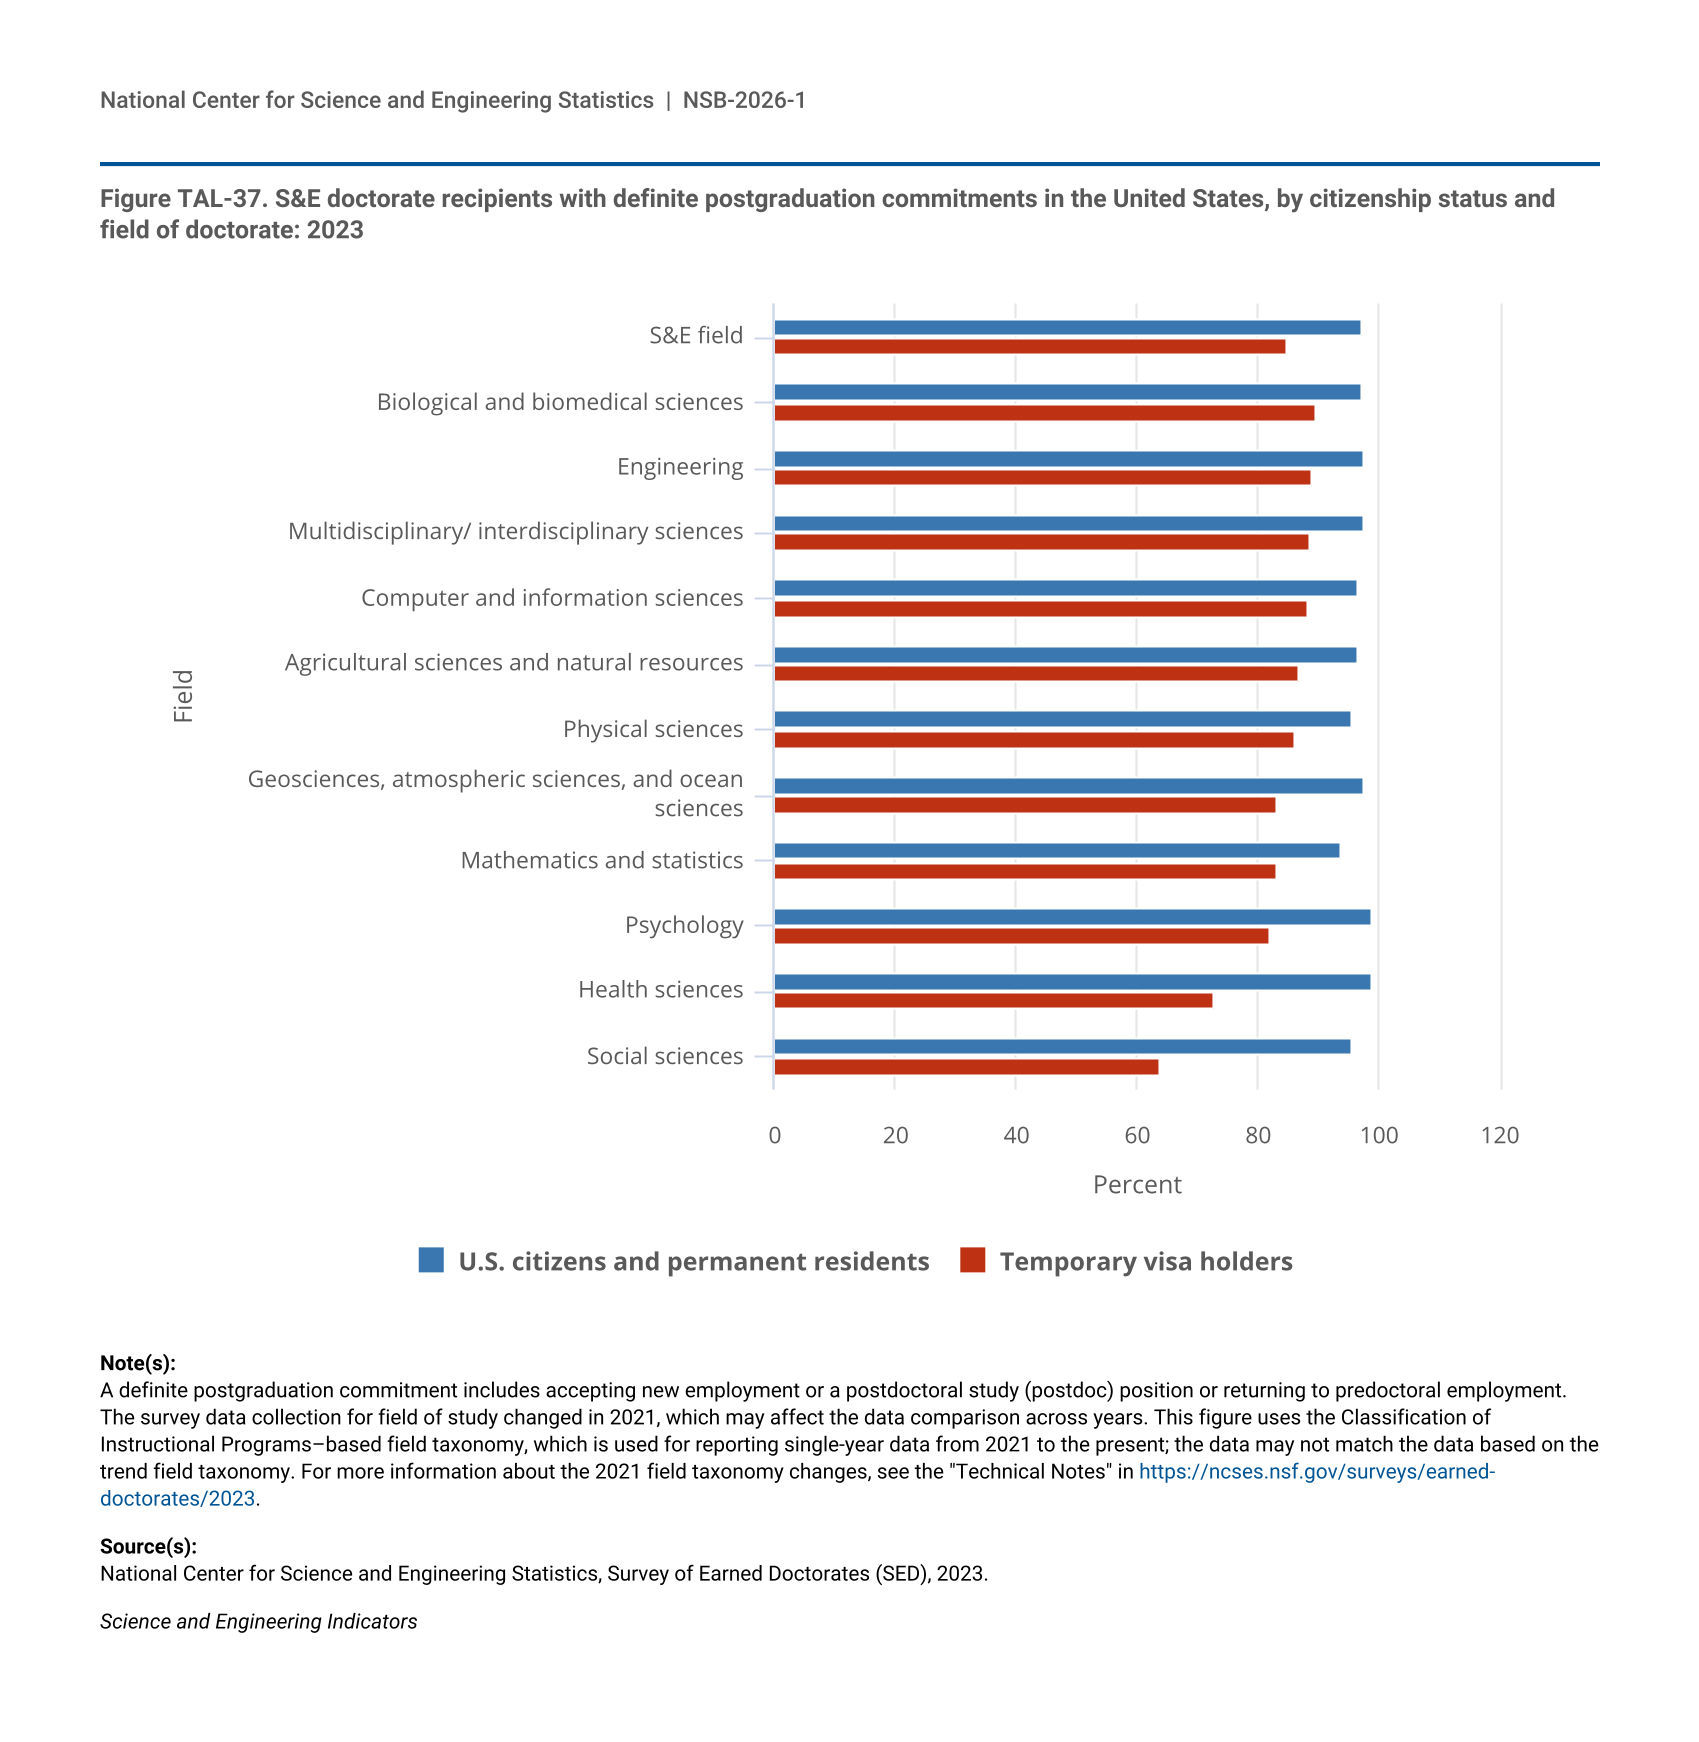
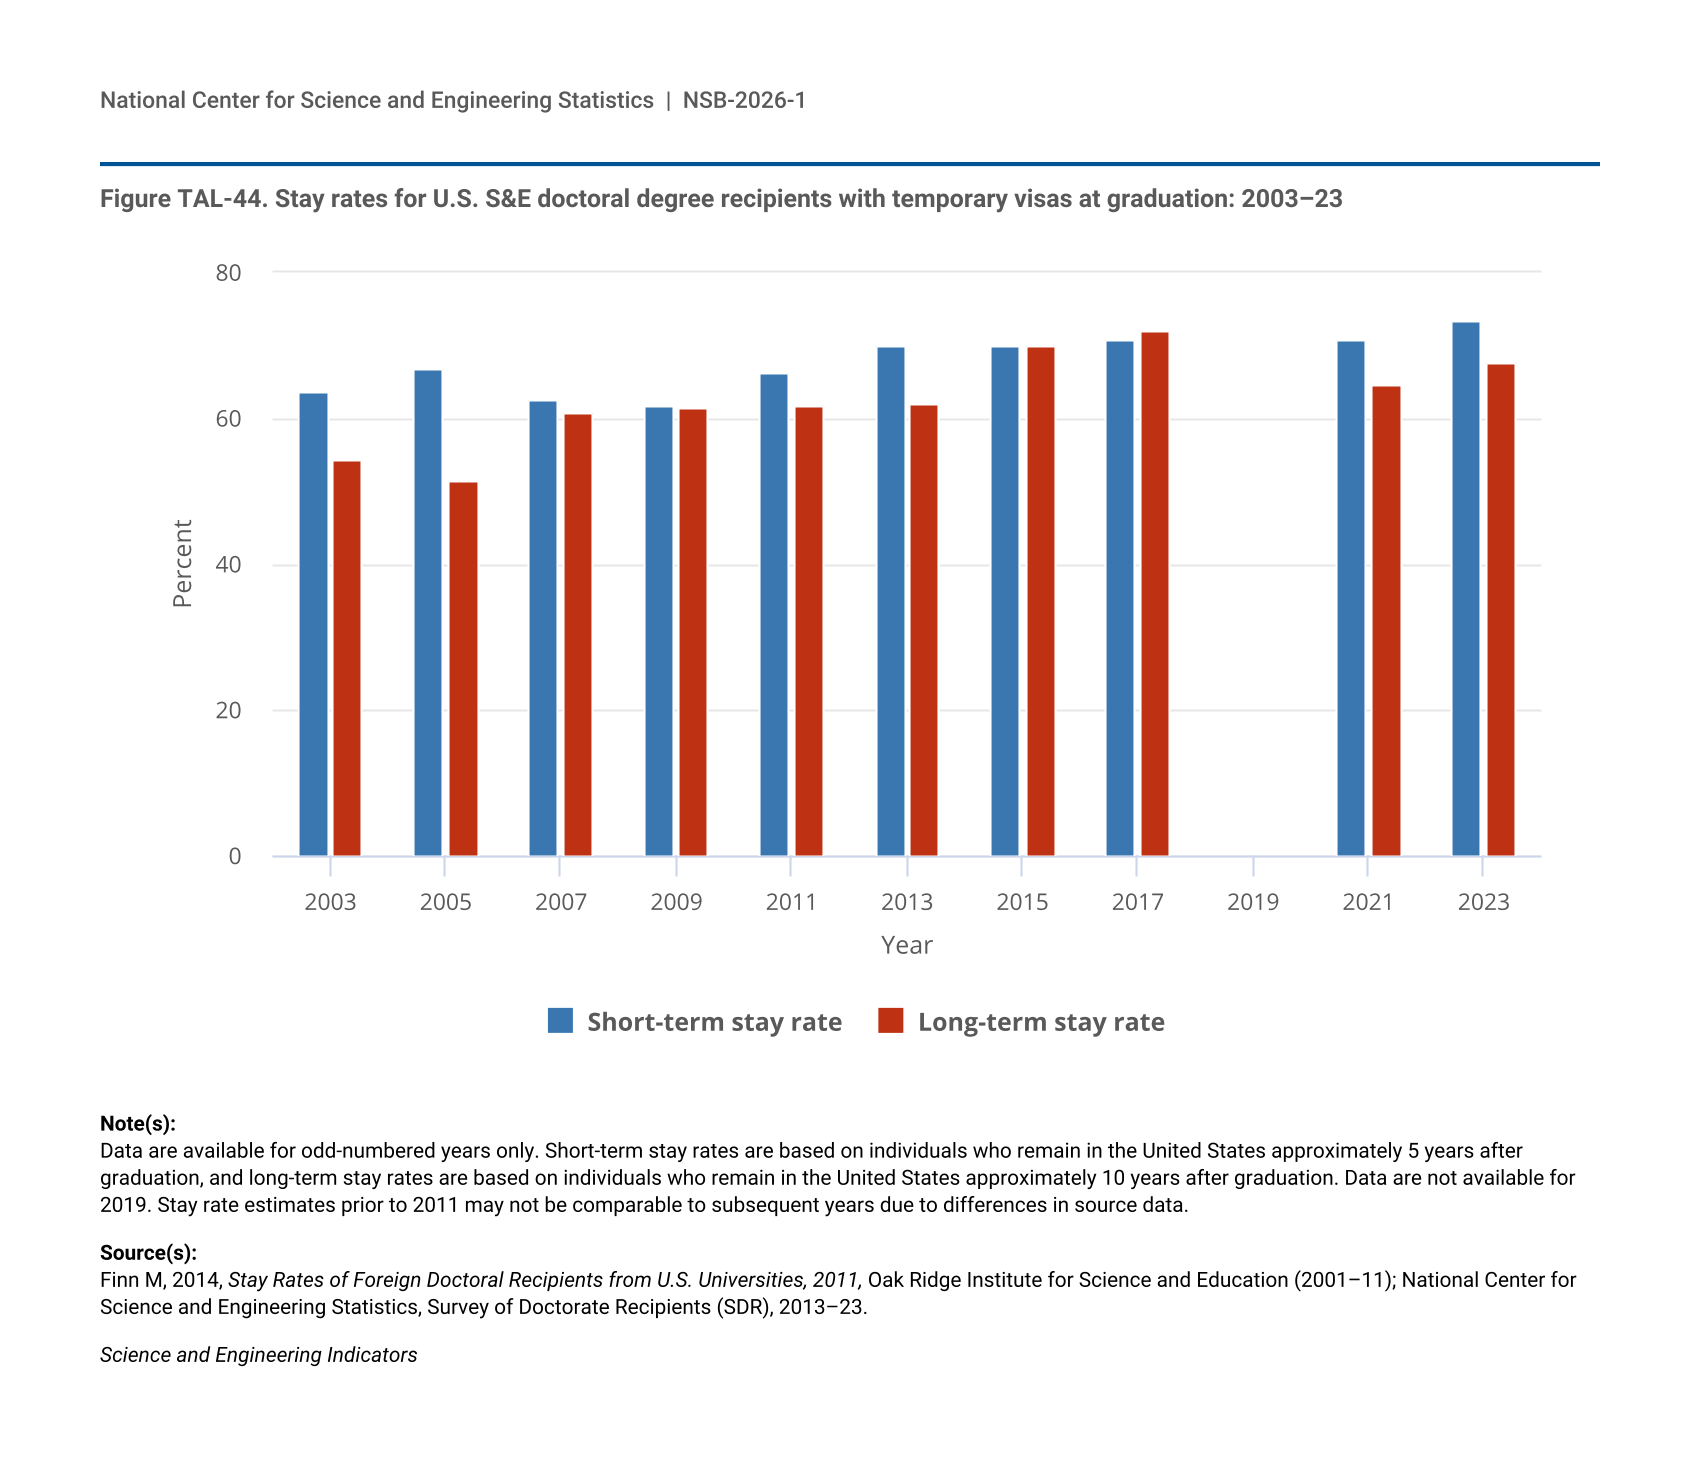
The proportion of temporary visa holders among master’s degree and doctoral degree recipients varied greatly by field (Table STAL-20). In 2023, temporary visa holders earned 10% of the doctoral degrees in psychology and 24% of those in the health sciences but received more than half of the doctoral degrees in computer and information sciences (62%), engineering (55%), and mathematics and statistics (53%), fields that are particularly important in critical and emerging technologies. Temporary visa holders also accounted for about half of the master’s degrees awarded in each of these three fields. Surveys of S&E research doctorate recipients who were temporary visa holders have shown that most of these individuals intend to and ultimately do remain in the United States after graduation (see the section STEM Doctoral Degrees, Stay Rates, and Internationally Mobile Students).
STEM Degrees by Type of Institution
Community Colleges
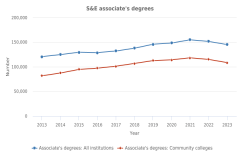
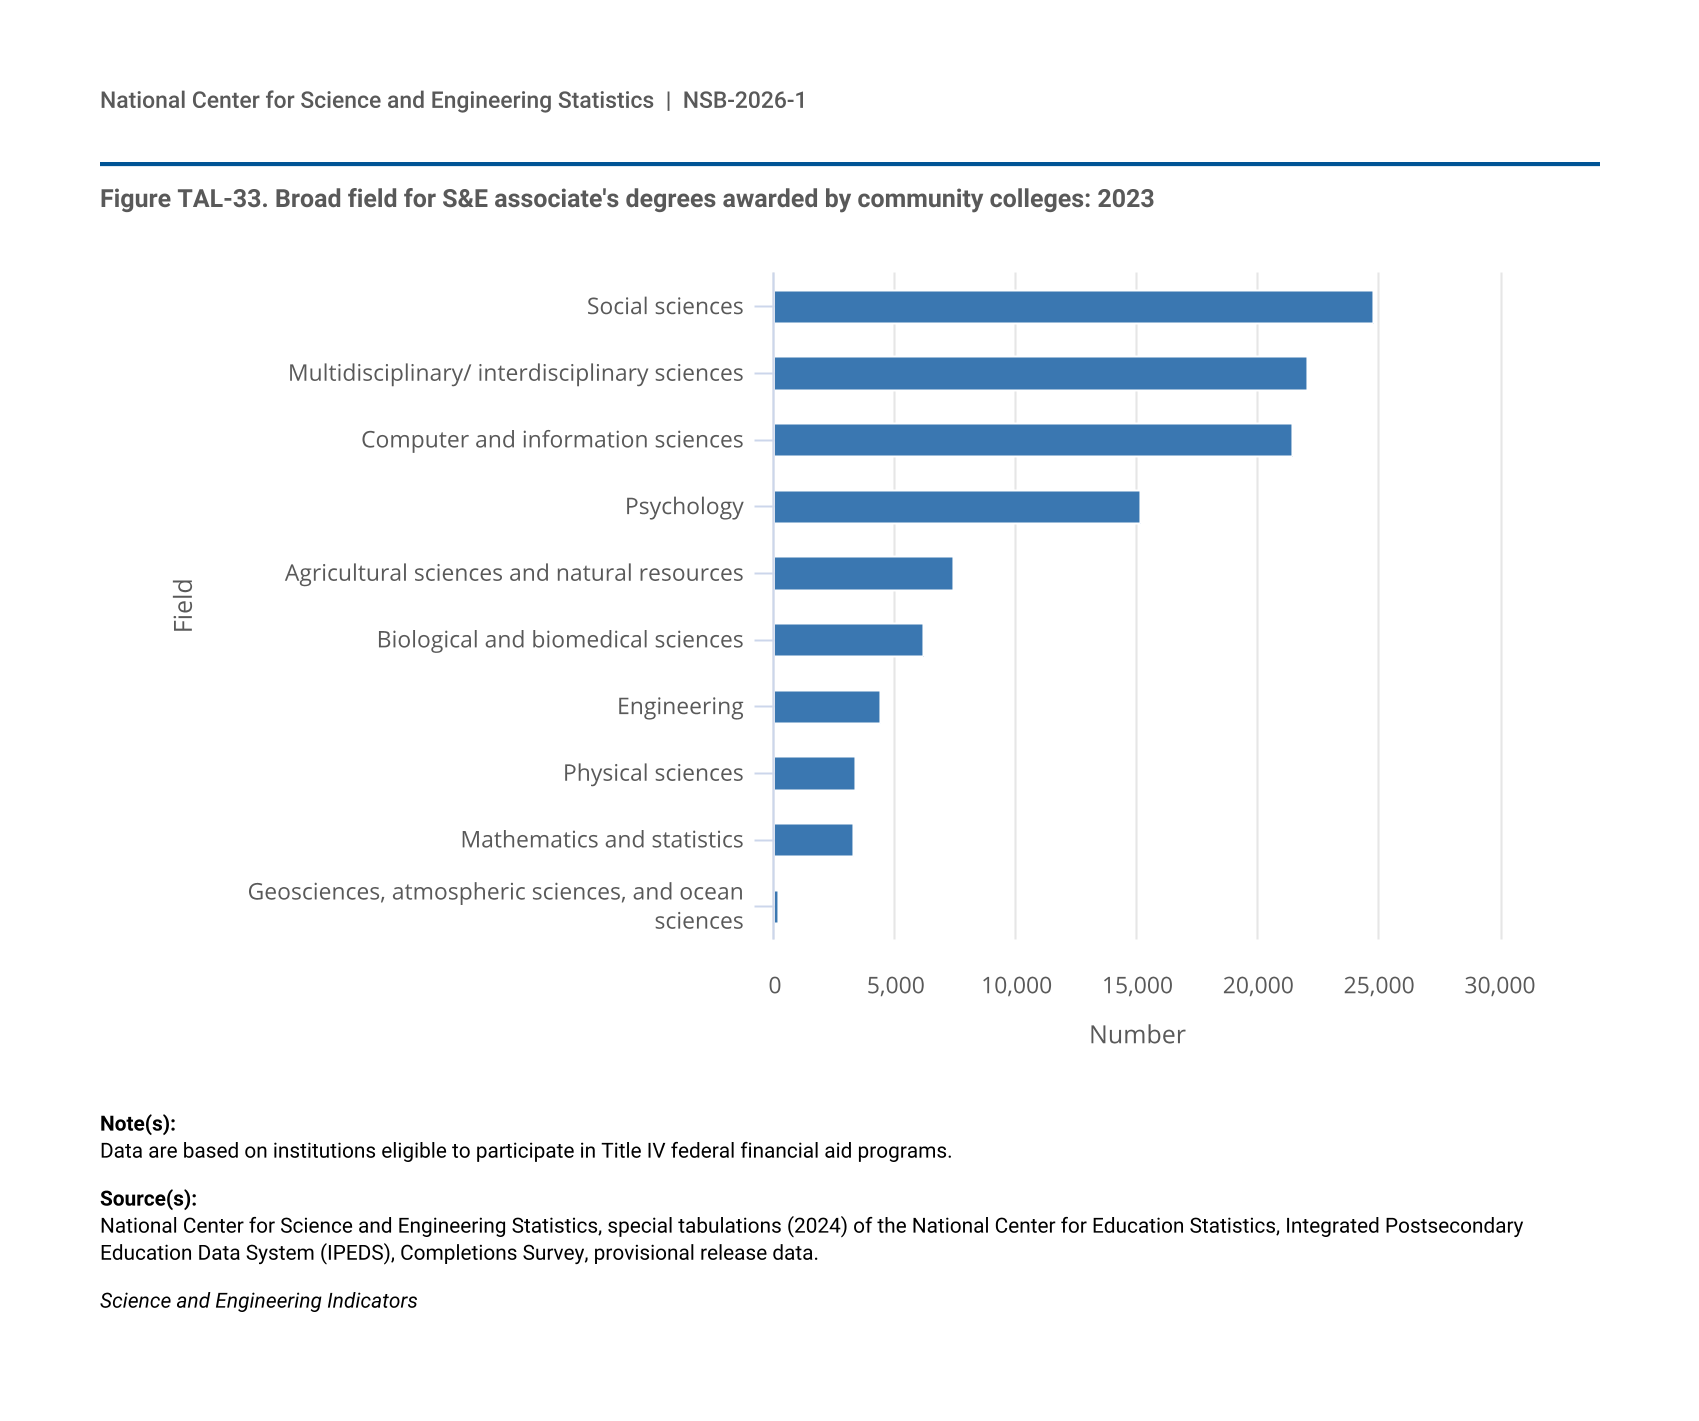
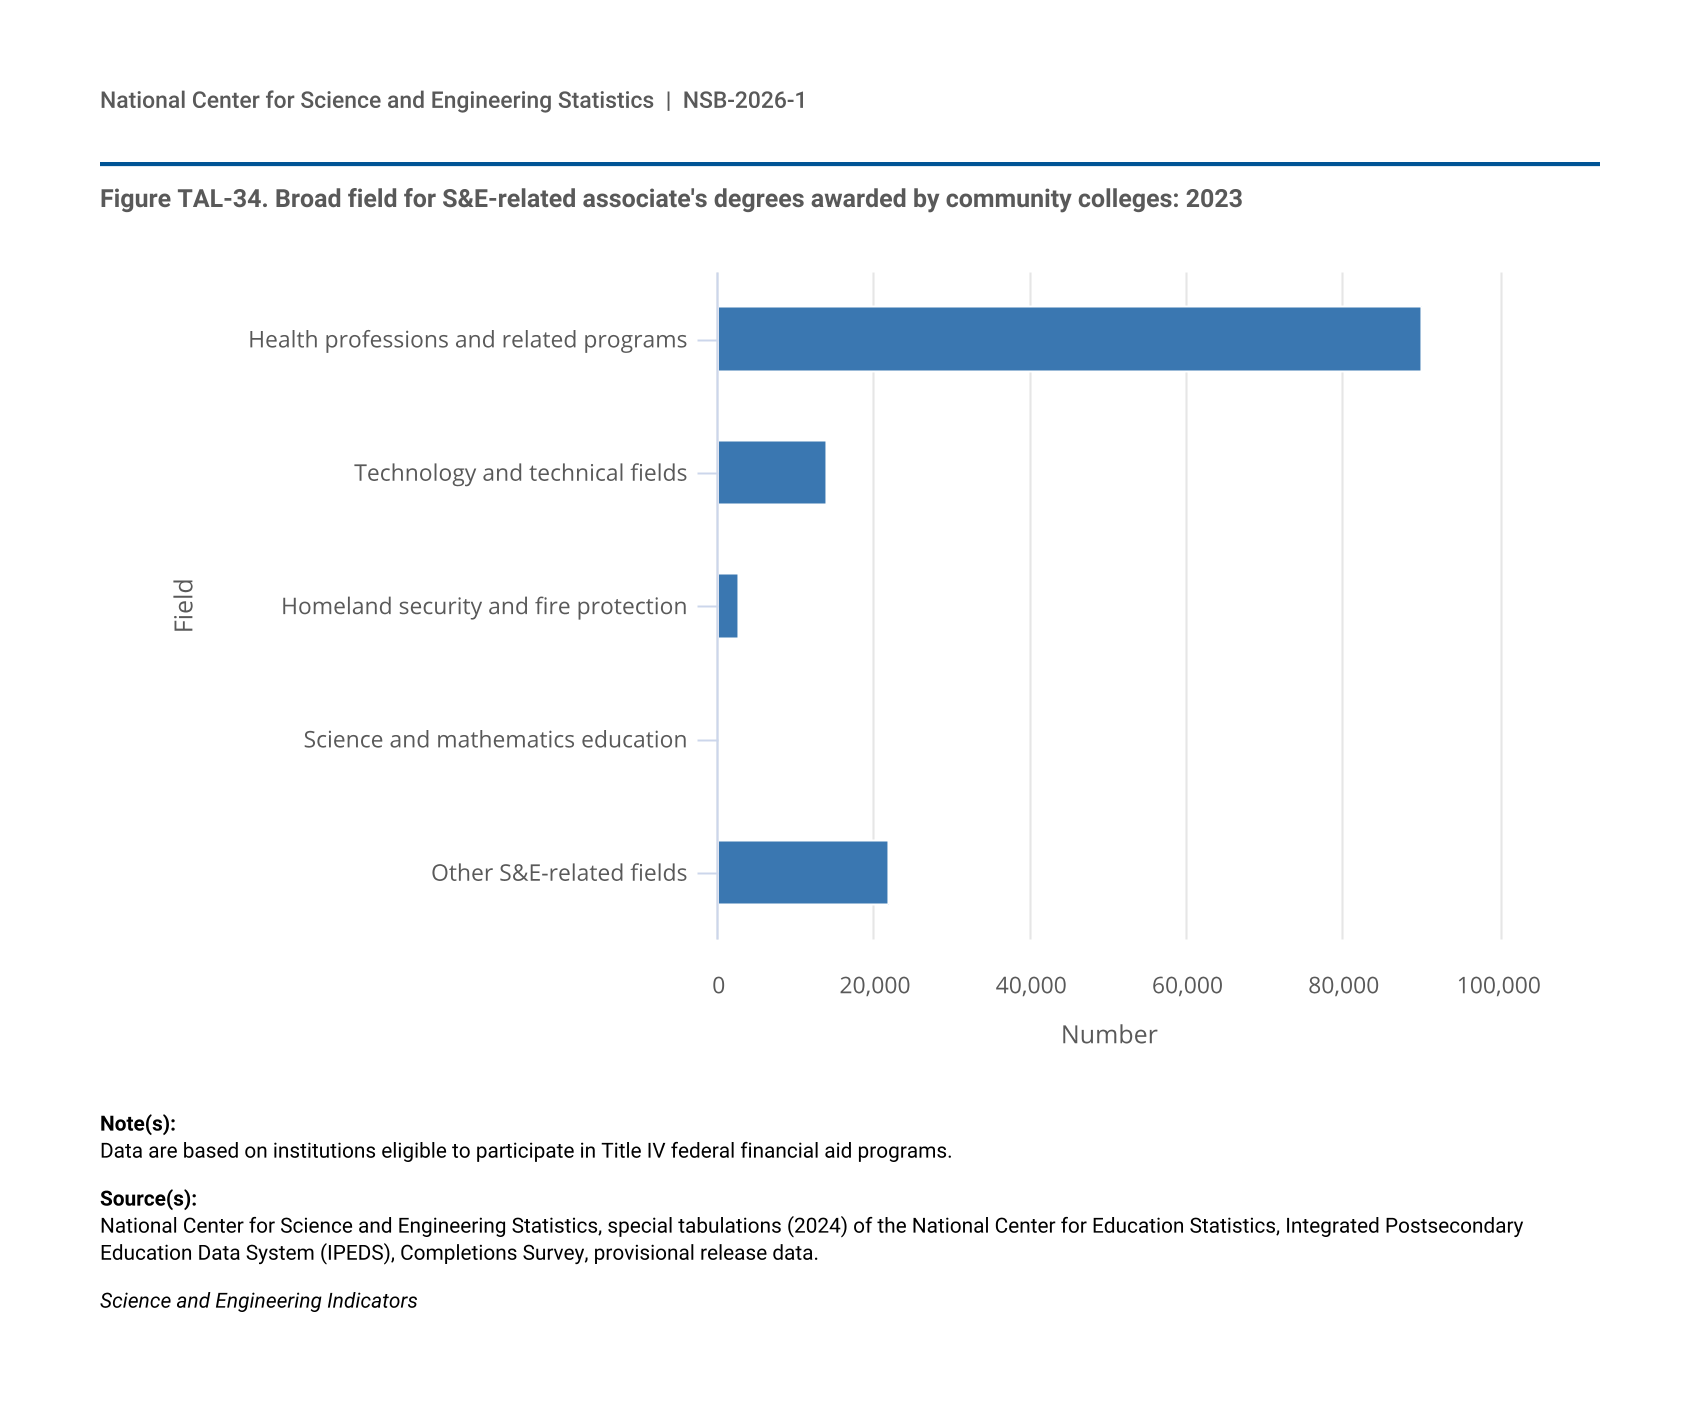
A variety of institutions provide the education necessary to maintain and enhance the U.S. S&E enterprise. Community colleges are public colleges that offer associate’s degree programs that require 2 years or less to complete. They specialize in providing relatively affordable programs of study, including in S&E and S&E-related fields. In 2023, about a third of the associate’s degree holders were in STEM occupations (Table STAL-1). Community colleges awarded 75% of the S&E associate’s degrees and 52% of the S&E-related associate’s degrees conferred in 2023 (Figure TAL-32). Among S&E fields, community colleges awarded the largest number of associate’s degrees in social sciences (23%), followed by multidisciplinary/interdisciplinary sciences (20%), then computer and information sciences (20%) (Figure TAL-33); among S&E-related fields, they awarded the largest number of associate’s degrees in health professions and related programs (Figure TAL-34).
| Year | Associate's degrees: All institutions | Associate's degrees: Community colleges |
|---|---|---|
| 2013 | 120,346 | 81,745 |
| 2014 | 124,916 | 87,768 |
| 2015 | 129,468 | 95,015 |
| 2016 | 128,526 | 97,155 |
| 2017 | 132,433 | 100,876 |
| 2018 | 137,984 | 106,582 |
| 2019 | 145,685 | 112,618 |
| 2020 | 148,449 | 113,823 |
| 2021 | 155,029 | 118,150 |
| 2022 | 152,024 | 115,376 |
| 2023 | 145,187 | 108,240 |
| Year | Associate's degrees: All institutions | Associate's degrees: Community colleges |
|---|---|---|
| 2013 | 288,495 | 152,063 |
| 2014 | 281,774 | 150,750 |
| 2015 | 273,943 | 149,926 |
| 2016 | 261,833 | 145,619 |
| 2017 | 258,048 | 145,242 |
| 2018 | 253,585 | 143,204 |
| 2019 | 255,426 | 143,261 |
| 2020 | 245,644 | 135,593 |
| 2021 | 253,005 | 138,088 |
| 2022 | 250,987 | 134,507 |
| 2023 | 249,738 | 128,686 |
Data are based on institutions eligible to participate in Title IV federal financial aid programs.
National Center for Science and Engineering Statistics, special tabulations (2024) of the National Center for Education Statistics, Integrated Postsecondary Education Data System (IPEDS), Completions Survey, provisional release data.
Science and Engineering Indicators
| Field | Associate's degrees |
|---|---|
| Social sciences | 24,853 |
| Multidisciplinary/ interdisciplinary sciences | 22,070 |
| Computer and information sciences | 21,482 |
| Psychology | 15,146 |
| Agricultural sciences and natural resources | 7,373 |
| Biological and biomedical sciences | 6,173 |
| Engineering | 4,403 |
| Physical sciences | 3,346 |
| Mathematics and statistics | 3,255 |
| Geosciences, atmospheric sciences, and ocean sciences | 139 |
Data are based on institutions eligible to participate in Title IV federal financial aid programs.
National Center for Science and Engineering Statistics, special tabulations (2024) of the National Center for Education Statistics, Integrated Postsecondary Education Data System (IPEDS), Completions Survey, provisional release data.
Science and Engineering Indicators
| Field | Associate's degrees |
|---|---|
| Health professions and related programs | 90,169 |
| Technology and technical fields | 13,949 |
| Homeland security and fire protection | 2,663 |
| Science and mathematics education | 18 |
| Other S&E-related fields | 21,887 |
Data are based on institutions eligible to participate in Title IV federal financial aid programs.
National Center for Science and Engineering Statistics, special tabulations (2024) of the National Center for Education Statistics, Integrated Postsecondary Education Data System (IPEDS), Completions Survey, provisional release data.
Science and Engineering Indicators
In addition to offering certificates and associate’s degrees, community colleges can be the first stop on the road to a bachelor’s or an advanced degree (Foley, Milan, and Hamrick 2020). According to the 2023 NSCG, about 3.1 million of the 5.6 million college graduates who had earned their first bachelor’s degree between 2019 and 2021 (55%) reported attending a community college; this was true for 63% of those who earned degrees in S&E-related fields and 51% of those who earned degrees in S&E fields (Table TAL-12). Among the 1.1 million S&E bachelor’s degree recipients who attended community college, about 518,000 (45%) indicated that they took courses after high school and before enrolling in college, 429,000 (37%) while in college and before receiving their first bachelor’s degree, and 81,000 (7%) after leaving college without receiving their first bachelor’s degree. Among the bachelor’s degree recipients with S&E degrees who indicated they had attended community college, 882,000 (77%) reported attending during one of these three periods after high school and before earning their first bachelor’s degree. Among the 555,000 bachelor’s degree recipients with S&E-related degrees who reported attending community college, about 60% said they attended after high school and before enrolling in college, 44% while in college and before receiving a bachelor’s degree, 11% after leaving college without receiving their first bachelor’s degree, and 86% any time after high school and before earning their first bachelor’s degree.
a This percentage is based on the number of respondents who earned their first bachelor's degree in 2019-21.
b This percentage is based on the number of respondents who earned their first bachelor's degree in 2019-21 and reported attending community college at any point in time.
Numbers are rounded to the nearest 1,000. Detail may not add to total because of rounding and because respondents could have attended community college at more than one point in time. Recent recipients are those who earned their bachelor's degrees in 2019–21.
National Center for Science and Engineering Statistics, National Survey of College Graduates (NSCG), 2023.
Science and Engineering Indicators
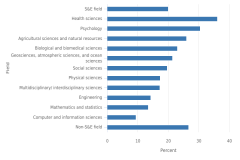
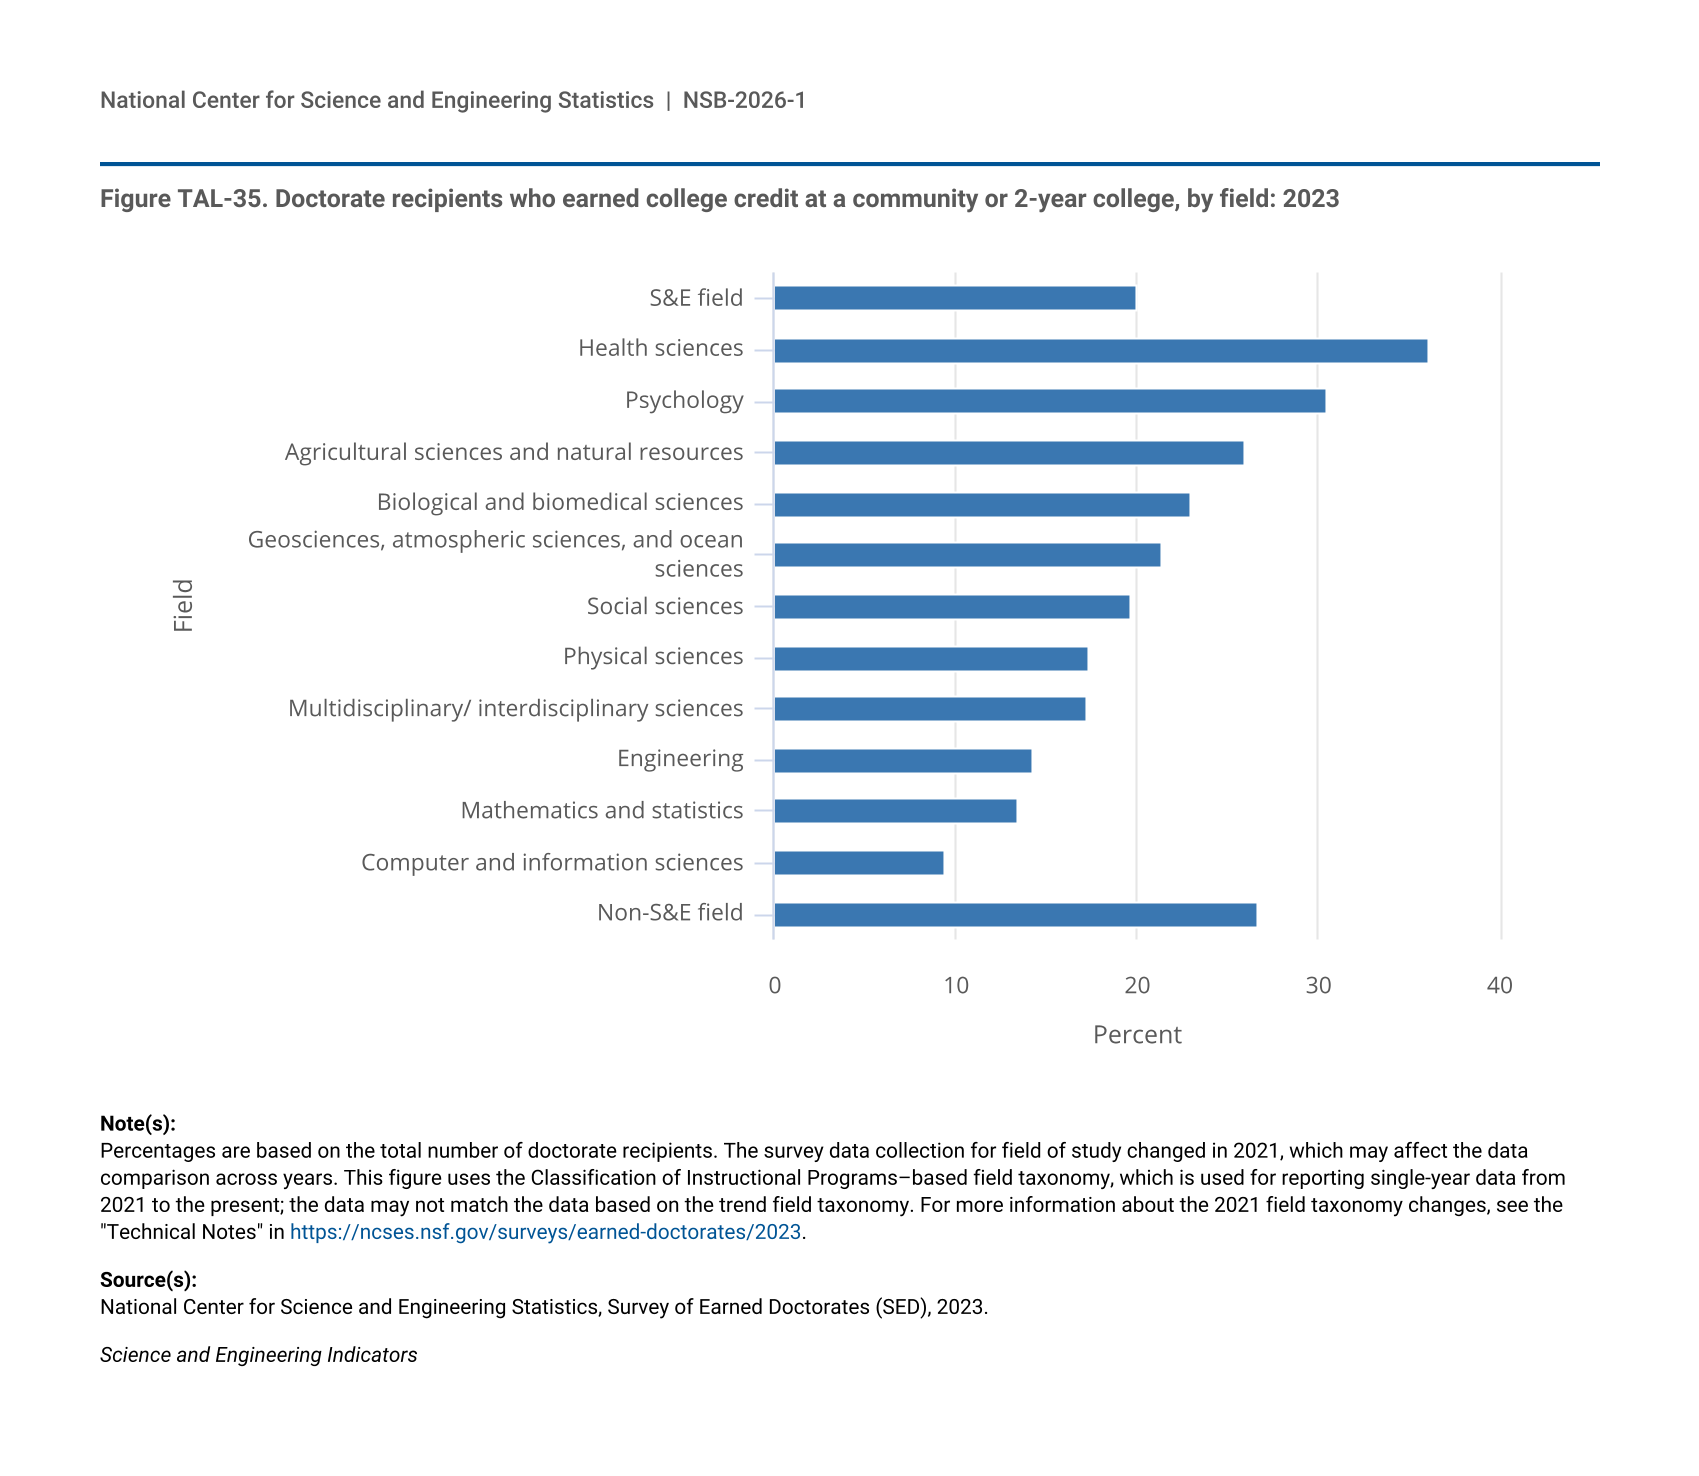
Education at the associate’s level, predominantly offered by community colleges, also plays a role in the preparation of S&E doctorate recipients. In 2023, 20% of S&E doctorate recipients reported that they had earned college credit at a community college. This proportion was highest among those in the health sciences (36%) and psychology (31%) and lowest among those in computer sciences (9%), mathematics and statistics (13%), and engineering (14%) (Figure TAL-35).
| Field | Attended a community or 2-year college |
|---|---|
| S&E field | 20.0 |
| Health sciences | 36.1 |
| Psychology | 30.5 |
| Agricultural sciences and natural resources | 26.0 |
| Biological and biomedical sciences | 23.0 |
| Geosciences, atmospheric sciences, and ocean sciences | 21.4 |
| Social sciences | 19.6 |
| Physical sciences | 17.3 |
| Multidisciplinary/ interdisciplinary sciences | 17.2 |
| Engineering | 14.2 |
| Mathematics and statistics | 13.4 |
| Computer and information sciences | 9.4 |
| Non-S&E field | 26.7 |
Percentages are based on the total number of doctorate recipients. The survey data collection for field of study changed in 2021, which may affect the data comparison across years. This figure uses the Classification of Instructional Programs–based field taxonomy, which is used for reporting single-year data from 2021 to the present; the data may not match the data based on the trend field taxonomy. For more information about the 2021 field taxonomy changes, see the "Technical Notes" in https://ncses.nsf.gov/surveys/earned-doctorates/2023.
National Center for Science and Engineering Statistics, Survey of Earned Doctorates (SED), 2023.
Science and Engineering Indicators
Tribally Controlled and Historically Black Colleges and Universities
All U.S. institutions of higher education foster talent development. In 2023, there were 35 tribally controlled colleges and universities (TCCUs) and 100 historically Black colleges and universities (HBCUs), as defined by the Higher Education Act of 1965 (P.L. 89-329) based on the populations of students they have served since their founding. These legislatively defined institutions are part of the overall system of degree-granting U.S. institutions of higher education discussed above. HBCUs and TCCUs award a small number of the overall degrees awarded by all institutions in the United States but play an important role, especially at the associate’s and bachelor’s degree levels, in producing STEM graduates (Table TAL-13). In 2023, 67% of the S&E degrees (267 out of 398) and 80% of the S&E-related degrees (178 out of 222) that TCCUs awarded were associate’s degrees. In 2023, 86% of the S&E degrees (12,836 out of 14,868) and 55% of the S&E-related degrees (4,158 out of 7,519) awarded by HBCUs were bachelor’s degrees. Although HBCUs awarded fewer than 500 doctoral degrees in 2023, more than two-thirds of these doctoral degrees were in S&E fields.
na = not applicable; no research doctorates were awarded.
HBCU = historically Black college or university; TCCU = tribally controlled college or university.
Data at the associate's-, bachelor's-, and master's-degree levels are based on institutions eligible to participate in Title IV federal financial aid programs. Doctoral degree data correspond to research doctorates as collected in the Survey of Earned Doctorates (SED). The survey data collection for field of study changed in 2021, which may affect the data comparison across years. This figure uses the Classification of Instructional Programs–based field taxonomy, which is used for reporting single-year data from 2021 to the present; the data may not match the data based on the trend field taxonomy. For more information about the 2021 field taxonomy changes, see the "Technical Notes" in https://ncses.nsf.gov/surveys/earned-doctorates/2023.
National Center for Education Statistics, Integrated Postsecondary Education Data System (IPEDS) completions; National Center for Science and Engineering Statistics, SED, 2023.
Science and Engineering Indicators


