 An official website of the United States government
 International Comparisons and Global Competitiveness
International comparisons of U.S. STEM talent help illustrate the competitiveness of the U.S. S&E enterprise. Comparative indicators of K–12 STEM education and STEM doctoral degrees, as well as stay rates of international STEM doctoral students in the United States and the enrollment of internationally mobile students in select countries, highlight the current state of U.S. competitiveness on important dimensions of STEM talent.
K–12 STEM Education
The United States participates in two international assessments that are used to describe how the mathematics and science performance of students in the United States compares with that of students in other nations. The Trends in International Mathematics and Science Study (TIMSS) is administered to fourth- and eighth-grade students every 4 years and focuses on foundational mathematics and science content knowledge (NCES 2024c). The Programme for International Student Assessment (PISA) is administered to 15-year-olds in Organisation for Economic Co-operation and Development (OECD) countries every 3 years and focuses on students’ mathematics and science literacy as measured by their ability to apply skills to real-world contexts.
TIMSS and PISA Scores
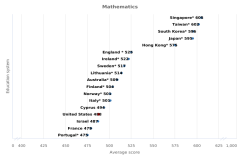
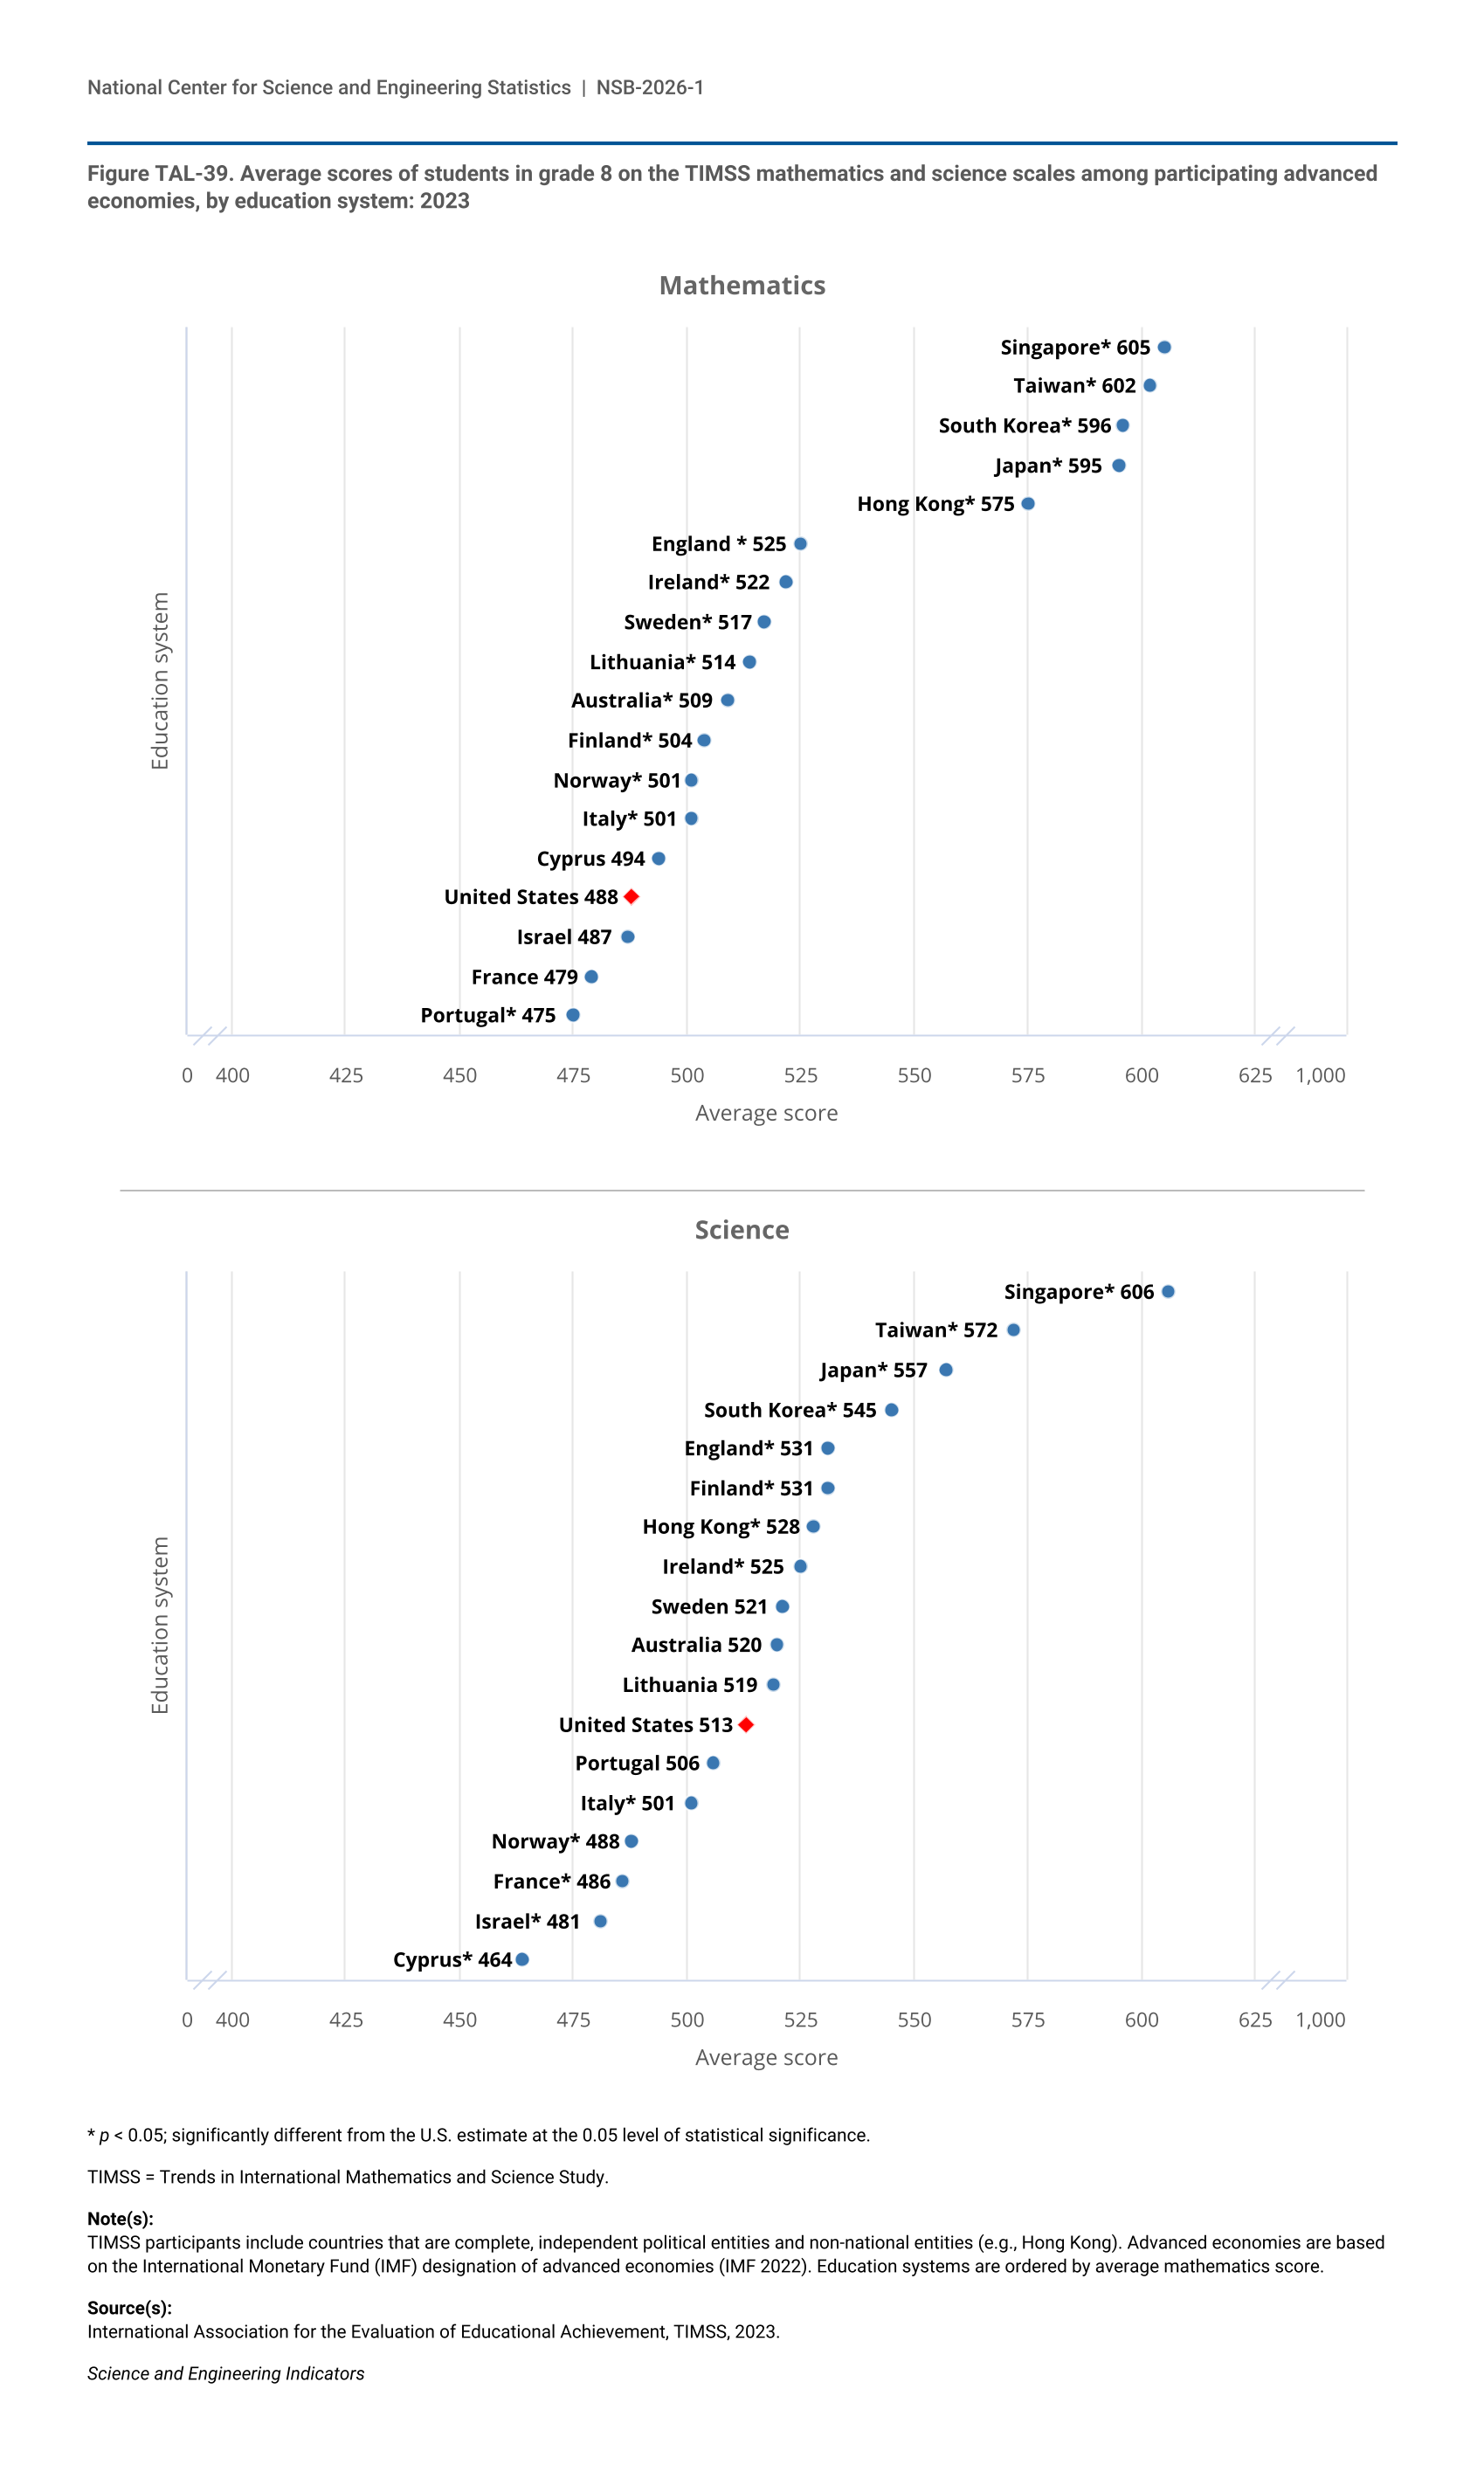
U.S. scores on the TIMSS 2023 assessment show that U.S. eighth graders perform better in science than they do in mathematics on international assessments (Figure TAL-39). Among the 18 advanced economies that participated in TIMSS 2023 at the eighth-grade level, 13 had average mathematics scores that were higher than the average U.S. score, and 8 had average science scores that were higher than the average U.S. score. Singapore and Taiwan scored highest on both assessments.
| Education system | Average score |
|---|---|
| Singapore* | 605 |
| Taiwan* | 602 |
| South Korea* | 596 |
| Japan* | 595 |
| Hong Kong* | 575 |
| England* | 525 |
| Ireland* | 522 |
| Sweden* | 517 |
| Lithuania* | 514 |
| Australia* | 509 |
| Finland* | 504 |
| Norway* | 501 |
| Italy* | 501 |
| Cyprus | 494 |
| United States | 488 |
| Israel | 487 |
| France | 479 |
| Portugal* | 475 |
| Education system | Average score |
|---|---|
| Singapore* | 606 |
| Taiwan* | 572 |
| Japan* | 557 |
| South Korea* | 545 |
| England* | 531 |
| Finland* | 531 |
| Hong Kong* | 528 |
| Ireland* | 525 |
| Sweden | 521 |
| Australia | 520 |
| Lithuania | 519 |
| United States | 513 |
| Portugal | 506 |
| Italy* | 501 |
| Norway* | 488 |
| France* | 486 |
| Israel* | 481 |
| Cyprus* | 464 |
* p < 0.05; significantly different from the U.S. estimate at the 0.05 level of statistical significance.
TIMSS = Trends in International Mathematics and Science Study.
TIMSS participants include countries that are complete, independent political entities and non-national entities (e.g., Hong Kong). Advanced economies are based on the International Monetary Fund (IMF) designation of advanced economies (IMF 2022). Education systems are ordered by average mathematics score.
International Association for the Evaluation of Educational Achievement, TIMSS, 2023.
Science and Engineering Indicators
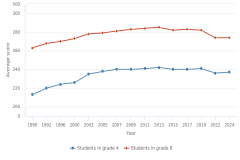
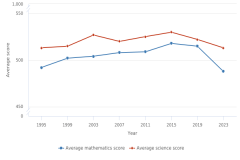
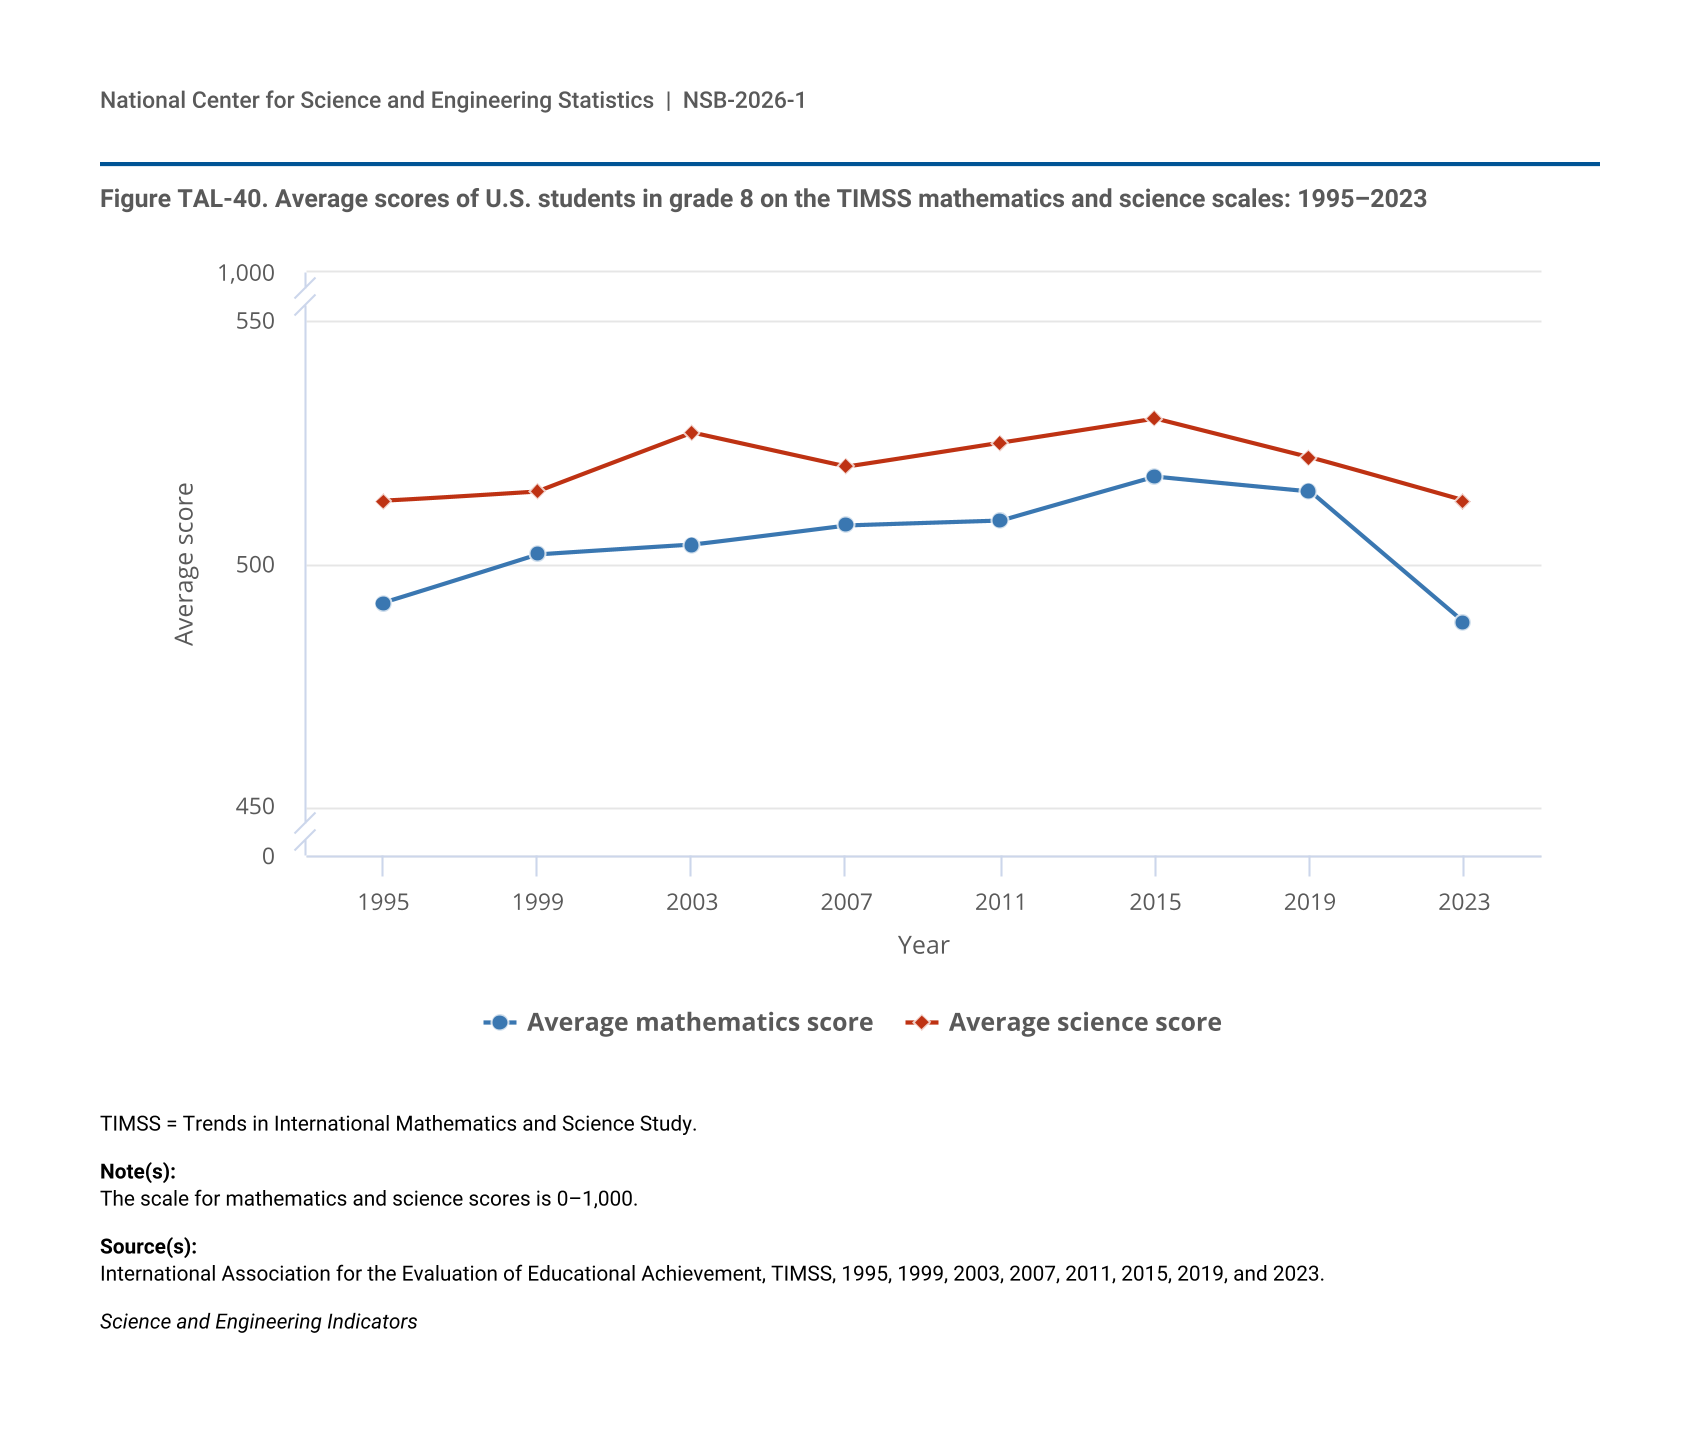
Between 2019 (before the COVID-19 pandemic) and 2023, the average mathematics scores of eighth-grade U.S. students decreased by 27 points (Figure TAL-40). The average science scores for eighth-grade students in the United States in 2023 did not exhibit a statistically significant difference from the average science scores observed in 2019. As with TIMSS, the 2022 PISA results show that U.S. 15-year-olds performed better in science than in mathematics on international assessments. In 2022, 37 OECD countries participated in PISA. Of those, 21 scored higher than the United States in mathematics, and 6 scored higher than the United States in science. Japan, South Korea, Estonia, and Switzerland were the highest-scoring OECD countries in mathematics in 2022, and Japan and South Korea were the highest scoring in science (Table STAL-22).
| Year | Average mathematics score | Average science score |
|---|---|---|
| 1995 | 492 | 513 |
| 1999 | 502 | 515 |
| 2003 | 504 | 527 |
| 2007 | 508 | 520 |
| 2011 | 509 | 525 |
| 2015 | 518 | 530 |
| 2019 | 515 | 522 |
| 2023 | 488 | 513 |
TIMSS = Trends in International Mathematics and Science Study.
The scale for mathematics and science scores is 0–1,000.
International Association for the Evaluation of Educational Achievement, TIMSS, 1995, 1999, 2003, 2007, 2011, 2015, 2019, and 2023.
Science and Engineering Indicators
International Comparisons of Computer Science Performance
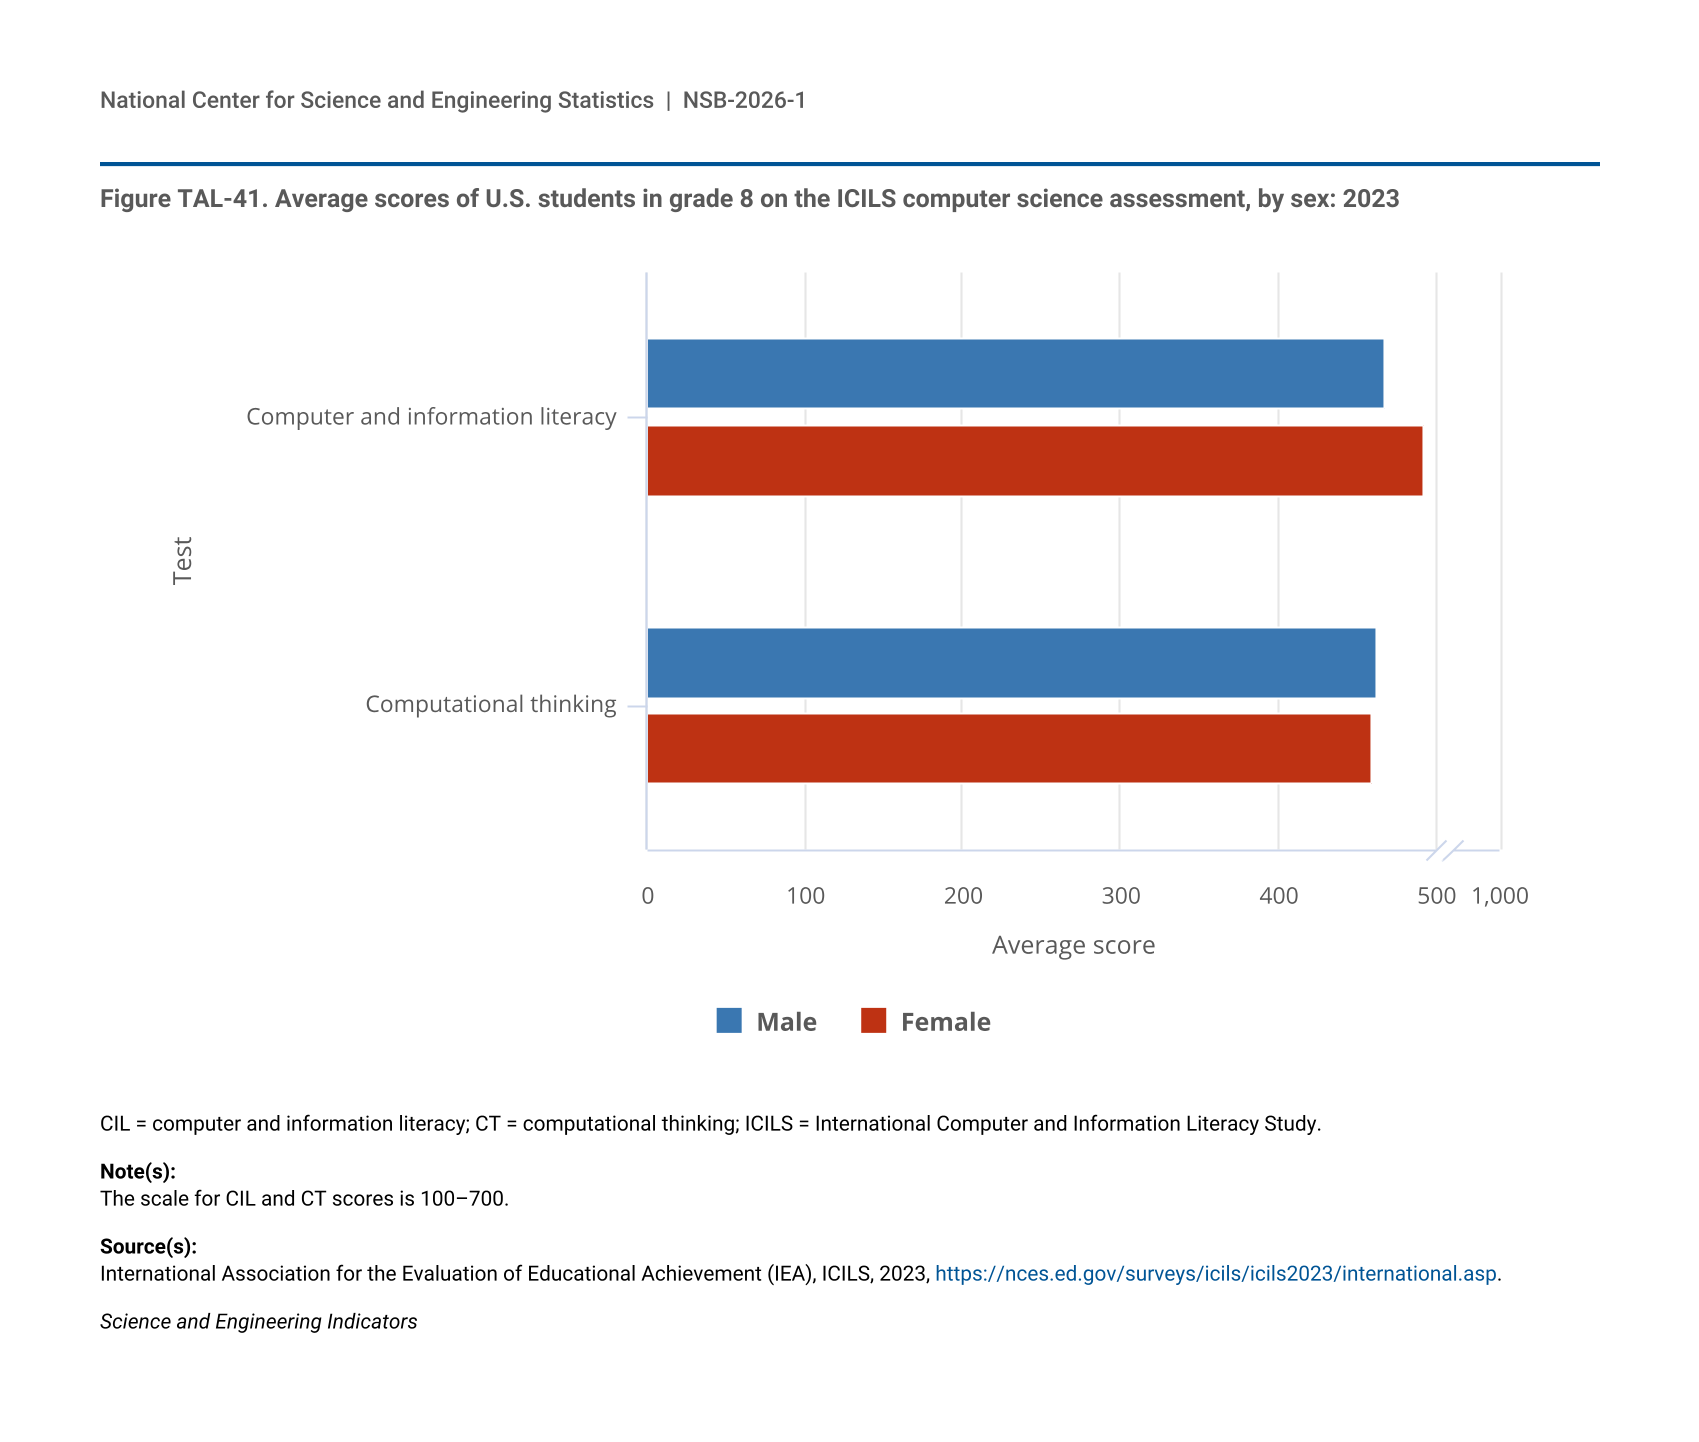
The International Computer and Information Literacy Study (ICILS) is a computer-based international assessment sponsored by the International Association for the Evaluation of Educational Achievement. It measures eighth-grade student performance in computer and information literacy (the ability to use computers effectively in everyday life at home, work, and school) and in computational thinking (the use of computers to solve problems; this includes such skills as programming). In 2023, 16 of the 33 education systems participating in the computer and information literacy assessment scored higher than the United States, and 14 of the 23 education systems participating in the computational thinking assessment scored higher than the United States. South Korea, Taiwan, and Czechia were among the highest-scoring countries across both assessments (Table STAL-23).
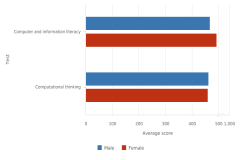
ICILS also provides insight into variations in computer science knowledge and ability among U.S. students by sex, race or ethnicity, and school poverty level. Female students scored higher than male students in computer and information literacy; there was no measurable difference in scores between male students and female students in computational thinking (Figure TAL-41).
| Test | Male | Female |
|---|---|---|
| Computer and information literacy | 468 | 493 |
| Computational thinking | 462 | 459 |
CIL = computer and information literacy; CT = computational thinking; ICILS = International Computer and Information Literacy Study.
The scale for CIL and CT scores is 100–700.
International Association for the Evaluation of Educational Achievement (IEA), ICILS, 2023, https://nces.ed.gov/surveys/icils/icils2023/international.asp.
Science and Engineering Indicators
Asian students had the highest scores in both domains, followed by White, Hispanic, and Black students. U.S. eighth-grade students in schools with less than 25% of students eligible for free or reduced-price lunch outscored students in schools with 75% or more students eligible in both domains (Table TAL-16). For more detailed ICILS data, please refer to National Center for Education Statistics (NCES 2024b).
NA = not available.
CIL = computer and information literacy; CT = computational thinking.
The scale of CIL and CT scores is 100–700. School poverty level is the percentage of students eligible for free or reduced-price lunch.
International Association for the Evaluation of Educational Achievement (IEA), International Computer and Information Literacy Study (ICILS), 2023, https://nces.ed.gov/surveys/icils/icils2023/international.asp.
Science and Engineering Indicators
STEM Doctoral Degrees, Stay Rates, and Internationally Mobile Students
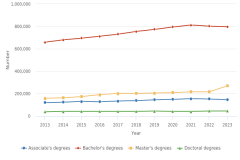
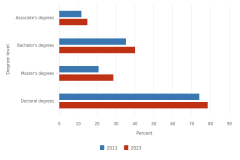
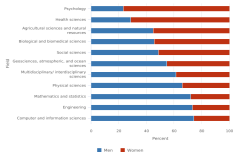
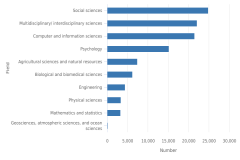
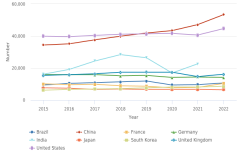
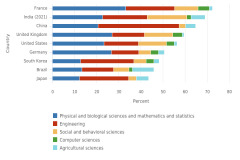
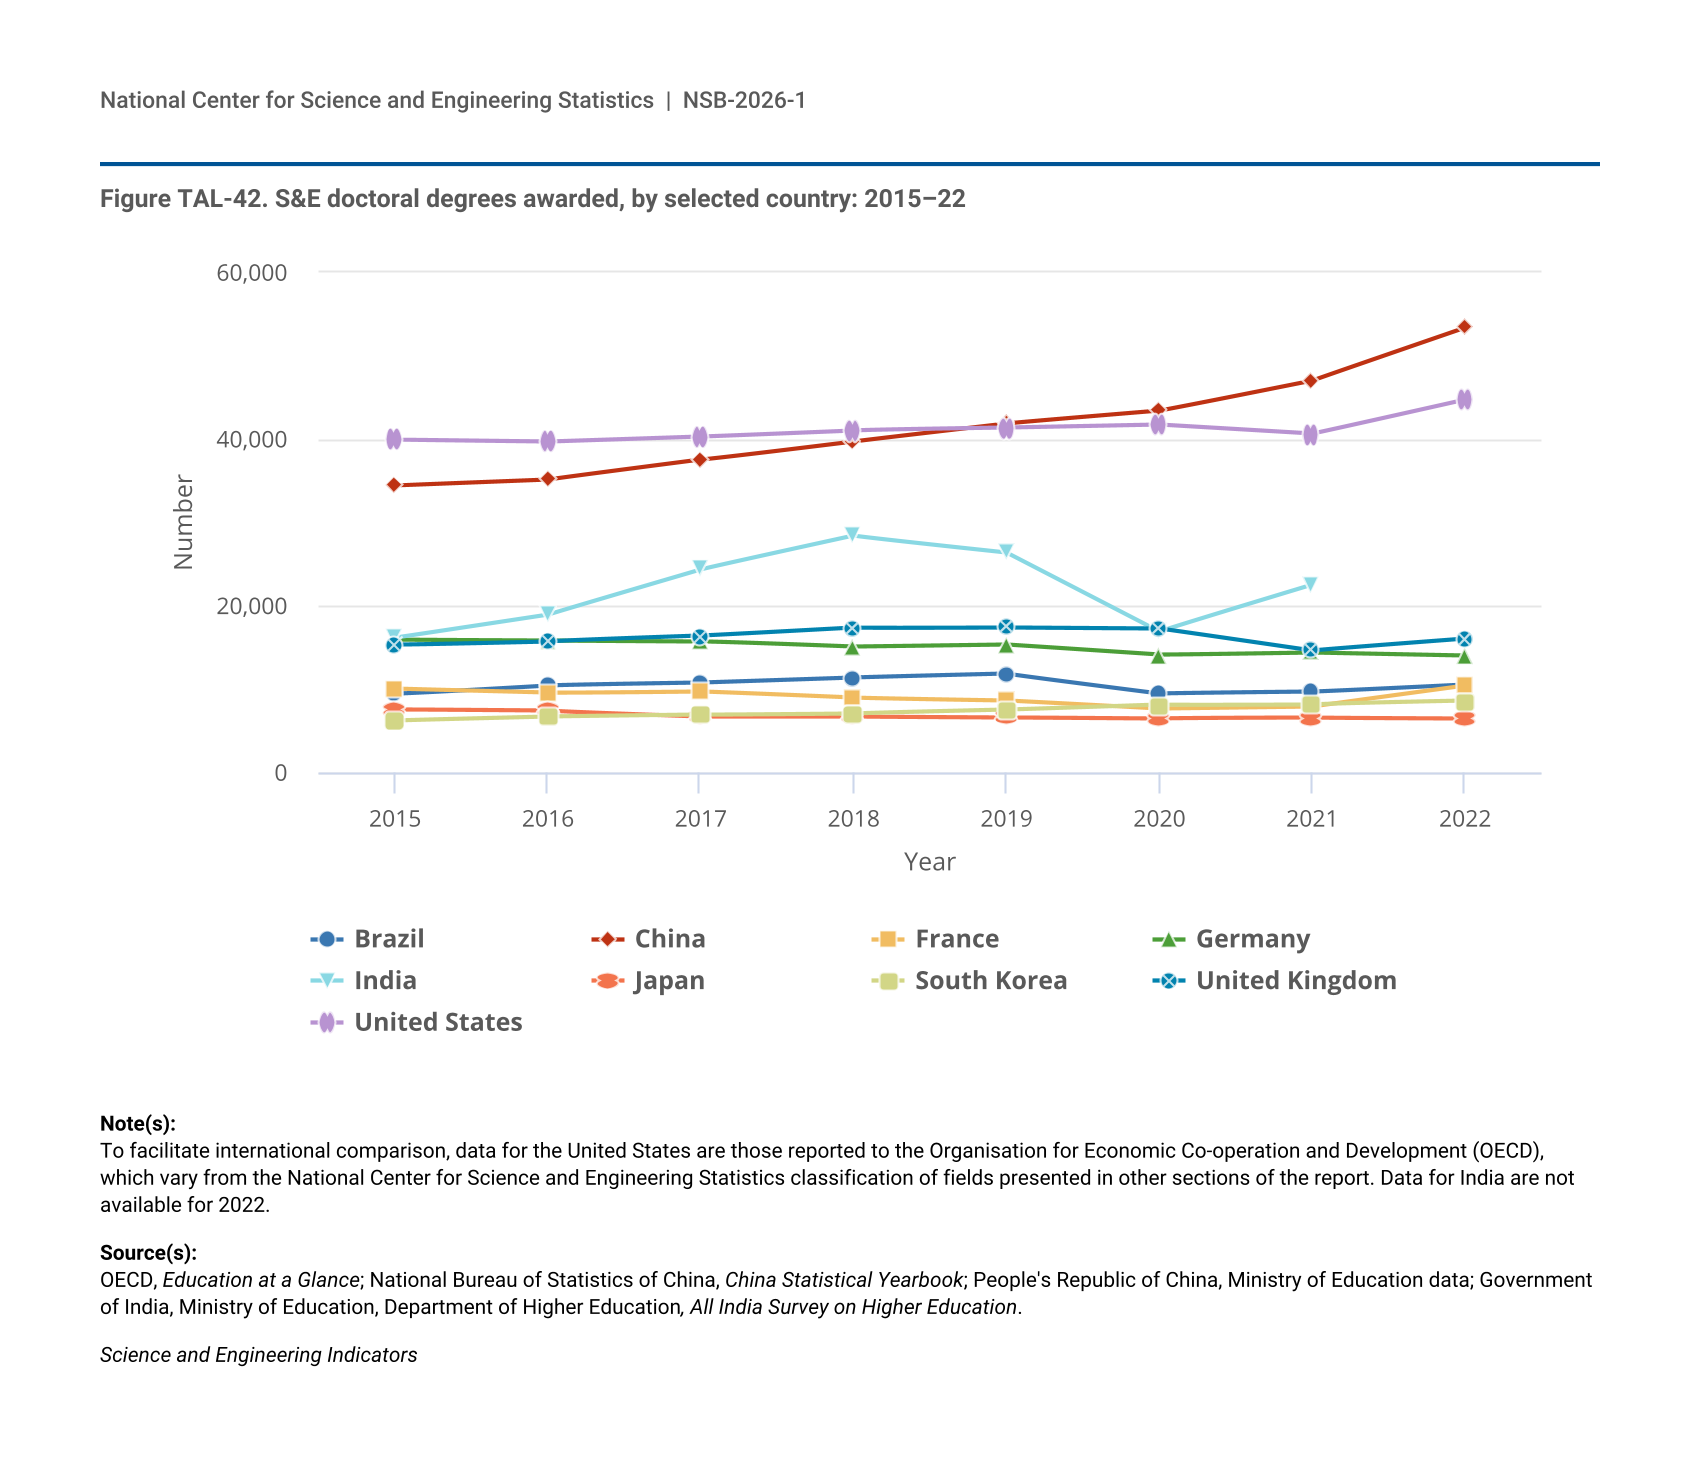
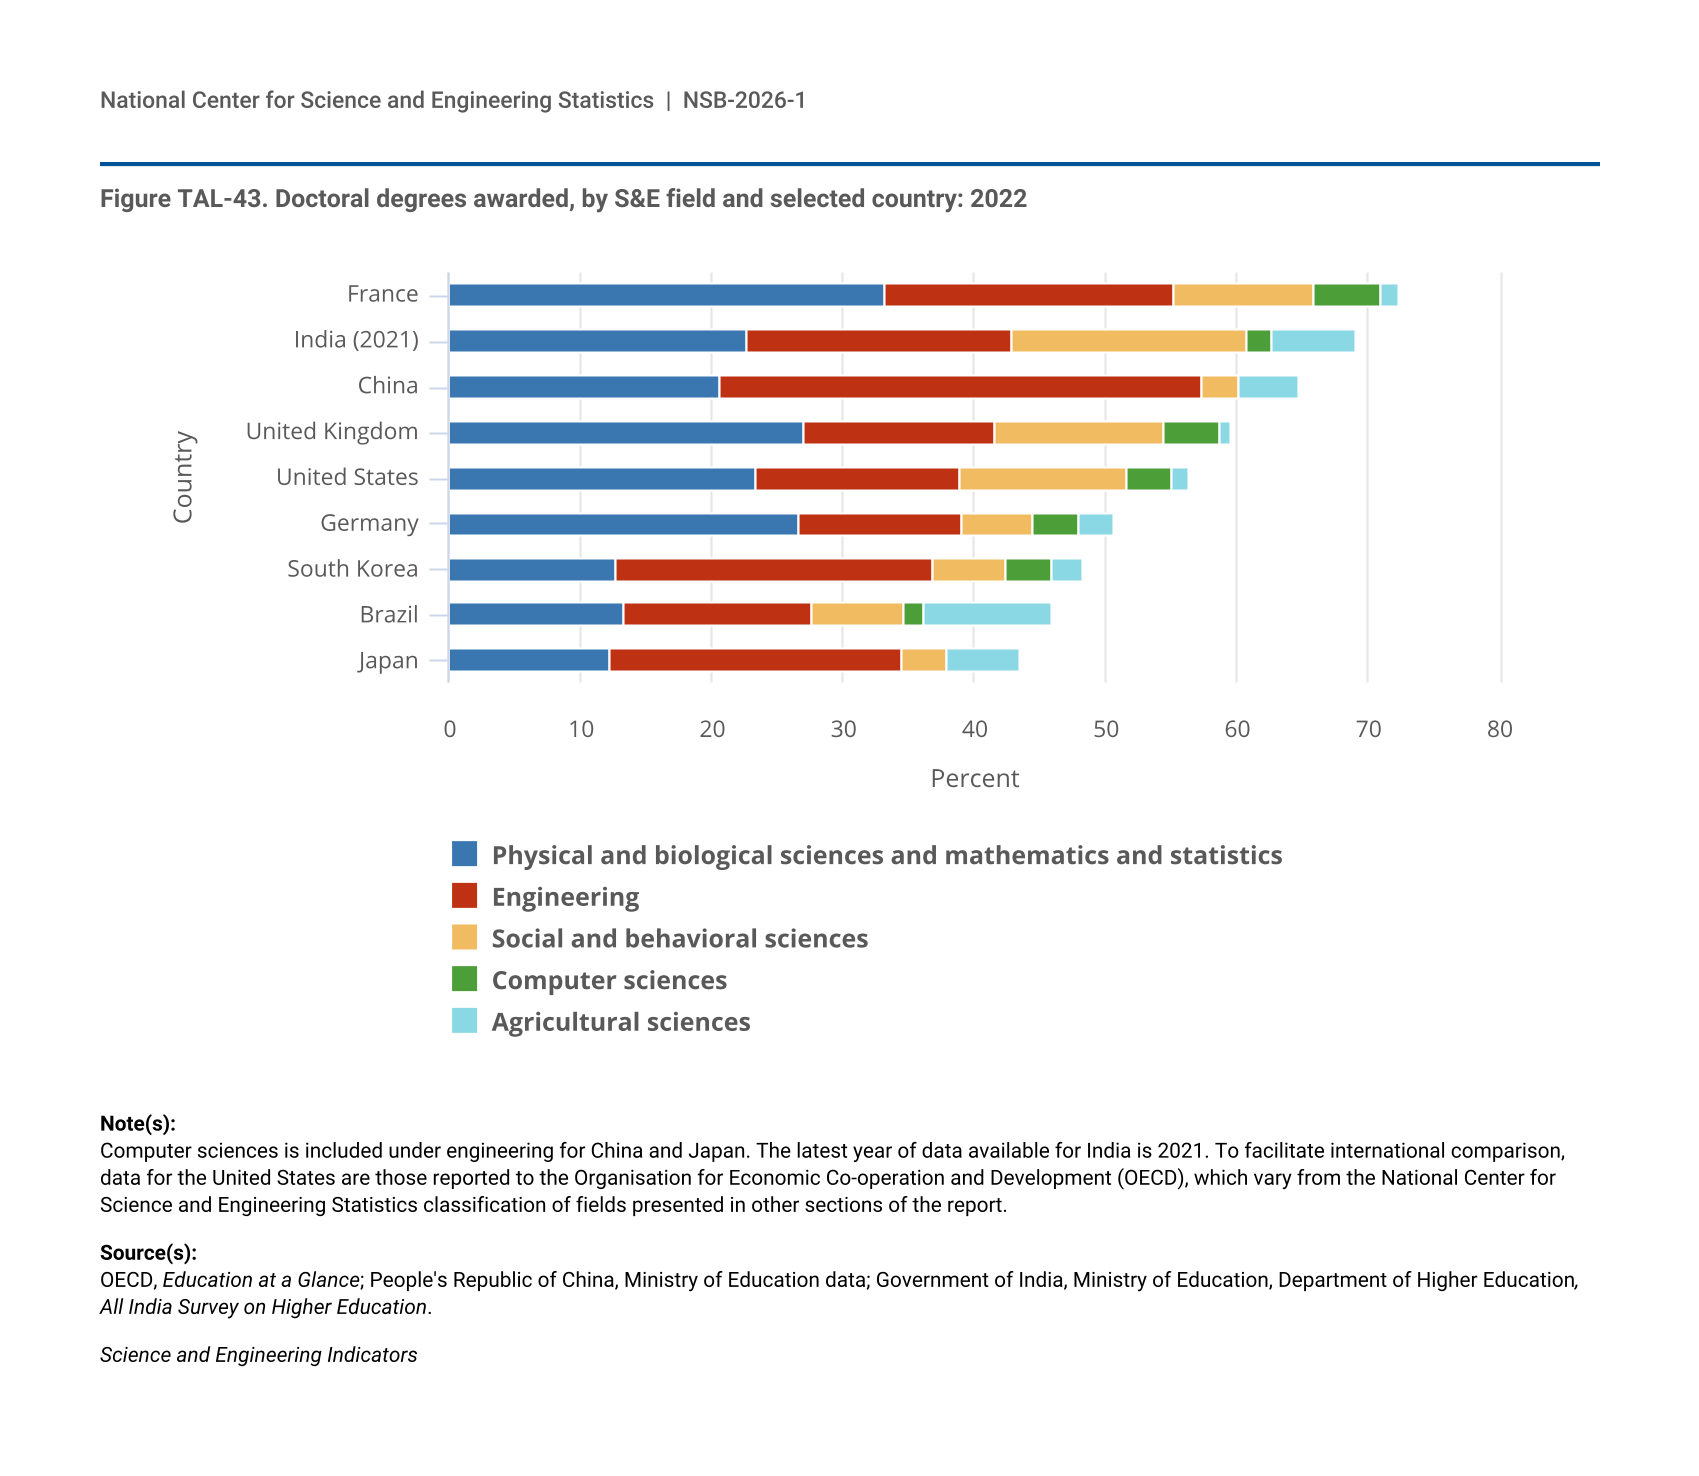
Doctoral education trains scientists, engineers, researchers, and scholars, all of whom are critical for countries’ innovation capacity and progress. Doctorate recipients create and share new knowledge and new ways of thinking that lead to new products and services. China awarded the highest number of S&E doctoral degrees (53,400) in 2022, followed by the United States (44,700), which China surpassed in 2019 (Figure TAL-42). After experiencing rapid growth in the mid-2010s, the number of S&E doctoral degrees awarded in India dropped to 17,000 in 2020 but increased again to 22,500 in 2021 (the latest data available). In 2022, other top awarders of S&E doctoral degrees included the United Kingdom (16,000), Germany (14,000), Brazil (10,600), France (10,400), South Korea (8,600), and Japan (6,500). Among these countries, in 2022, the proportion of S&E doctoral degrees of all doctoral degrees awarded among the top awarders of S&E degrees ranged from 44% in Japan to 72% in France (Figure TAL-43), but the composition of S&E degrees varied.
| Year | Brazil | China | France | Germany | India | Japan | South Korea | United Kingdom | United States |
|---|---|---|---|---|---|---|---|---|---|
| 2015 | 9,414 | 34,440 | 10,020 | 15,957 | 16,216 | 7,540 | 6,240 | 15,338 | 39,933 |
| 2016 | 10,469 | 35,147 | 9,564 | 15,871 | 19,001 | 7,391 | 6,689 | 15,757 | 39,710 |
| 2017 | 10,752 | 37,506 | 9,755 | 15,761 | 24,383 | 6,745 | 6,903 | 16,372 | 40,319 |
| 2018 | 11,365 | 39,768 | 8,987 | 15,061 | 28,394 | 6,754 | 7,077 | 17,366 | 41,071 |
| 2019 | 11,817 | 41,890 | 8,683 | 15,309 | 26,443 | 6,646 | 7,504 | 17,439 | 41,333 |
| 2020 | 9,492 | 43,399 | 7,691 | 14,092 | 16,968 | 6,506 | 8,125 | 17,312 | 41,701 |
| 2021 | 9,683 | 47,069 | 7,934 | 14,380 | 22,515 | 6,554 | 8,201 | 14,640 | 40,615 |
| 2022 | 10,571 | 53,385 | 10,411 | 14,019 | NA | 6,474 | 8,571 | 16,017 | 44,739 |
To facilitate international comparison, data for the United States are those reported to the Organisation for Economic Co-operation and Development (OECD), which vary from the National Center for Science and Engineering Statistics classification of fields presented in other sections of the report. Data for India are not available for 2022.
OECD, Education at a Glance; National Bureau of Statistics of China, China Statistical Yearbook; People's Republic of China, Ministry of Education data; Government of India, Ministry of Education, Department of Higher Education, All India Survey on Higher Education.
Science and Engineering Indicators
| Country | Physical and biological sciences and mathematics and statistics | Engineering | Social and behavioral sciences | Computer sciences | Agricultural sciences |
|---|---|---|---|---|---|
| France | 33.2 | 22.0 | 10.7 | 5.1 | 1.4 |
| India (2021) | 22.7 | 20.2 | 17.9 | 1.9 | 6.3 |
| China | 20.7 | 36.6 | 2.9 | NA | 4.6 |
| United Kingdom | 27.0 | 14.6 | 12.9 | 4.3 | 0.8 |
| United States | 23.3 | 15.6 | 12.7 | 3.5 | 1.3 |
| Germany | 26.7 | 12.4 | 5.3 | 3.6 | 2.7 |
| South Korea | 12.7 | 24.1 | 5.6 | 3.5 | 2.3 |
| Brazil | 13.4 | 14.2 | 7.0 | 1.6 | 9.6 |
| Japan | 12.3 | 22.2 | 3.5 | NA | 5.5 |
Computer sciences is included under engineering for China and Japan. The latest year of data available for India is 2021. To facilitate international comparison, data for the United States are those reported to the Organisation for Economic Co-operation and Development (OECD), which vary from the National Center for Science and Engineering Statistics classification of fields presented in other sections of the report.
OECD, Education at a Glance; People's Republic of China, Ministry of Education data; Government of India, Ministry of Education, Department of Higher Education, All India Survey on Higher Education.
Science and Engineering Indicators
Degrees in physical and biological sciences and in mathematics and statistics accounted for the largest share of doctoral degrees in S&E fields in most of these countries. However, engineering degrees were more common in East Asian countries, especially China, where 37% of all doctoral degrees were awarded in engineering in 2022, compared with 21% in physical and biological sciences and in mathematics and statistics. Doctoral degrees in computer sciences and agricultural sciences typically account for the lowest shares of S&E degrees, but agricultural sciences doctoral degrees were comparatively more common in Brazil (10% of all doctoral degrees awarded in 2022) and in India (6% of all doctoral degrees awarded in 2021) than in the other countries.
Stay Rates of U.S.-Trained Scientists and Engineers on Temporary Visas
Stay rates of U.S.-trained scientists and engineers provide insights into whether international students remain in the United States after earning their degrees. The National Science Board’s (NSB’s) Vision 2030 report suggested that attracting and retaining global talent are necessary for the United States to remain competitive in S&E fields and that stay rates are critical indicators for understanding how well the United States is retaining global talent (NSB 2020b).
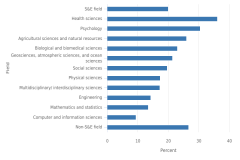
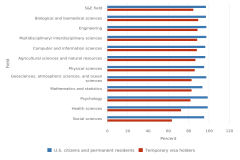
The rate at which S&E doctorate recipients with temporary visas intended to stay in the United States at the time of graduation remained relatively stable between 2012 and 2023 at about 73%–76% (Table TAL-17). Among the most recent S&E doctorate recipients with temporary visas who earned their degree between 2020 and 2023, plans to stay in the United States were highest for those in biological and biomedical sciences (81%), computer and information sciences (81%), engineering (80%), and physical sciences (79%) and lowest for those in the social sciences (57%), health sciences (67%), and psychology (68%). Among S&E doctorate recipients with temporary visas from the four countries with the highest number of recipients between 2020 and 2023 (China, India, South Korea, and Iran), intentions to stay in the United States ranged from 92% (Iran) to 69% (South Korea).
a Includes Hong Kong.
Data include doctorate recipients who are on temporary resident visas. Percentages are based on the total number of S&E doctorate recipients on temporary resident visas, including those who did not report their postgraduate location plans or employment plans. Recipients who plan to stay report intending to locate in the United States; definite commitments include doctorate recipients reporting having a definite commitment for a postdoctoral appointment or employment in the United States. The Survey of Earned Doctorates (SED) data collection for field of study changed in 2021, which may affect the data comparison across years. This figure uses the trend field taxonomy that facilitates trend data comparisons with prior years; for more information, see the "Technical Notes" in https://ncses.nsf.gov/surveys/earned-doctorates/2024. See also Table 3-4, https://ncses.nsf.gov/pubs/nsf25349/table/3-4.
National Center for Science and Engineering Statistics, SED.
Science and Engineering Indicators
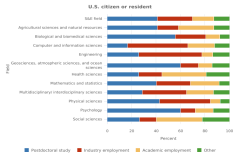
The proportion of S&E research doctorate recipients with temporary visas who had definite commitments to stay in the United States at the time of responding to the survey (e.g., those with postdoctoral appointments or employment commitments) was 45% for those who earned their doctorate between 2012 and 2015 and 57% for those who earned their doctorate between 2020 and 2023 (Table TAL-17). For the most recent cohort of doctorate recipients (2020–23), the proportion of doctorate recipients with temporary visas and definite commitments to stay was highest among those in computer and information sciences (65%), biological and biomedical sciences (60%), mathematics and statistics (59%), physical sciences (59%), and engineering (58%). The highest proportions of doctorate recipients with temporary visas and definite commitments to stay in the United States (about two-thirds) were among those from Bangladesh, Iran, India, and Nepal; proportions were lower among those from China (60%), Taiwan (59%), and South Korea (54%).
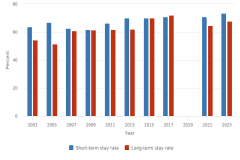
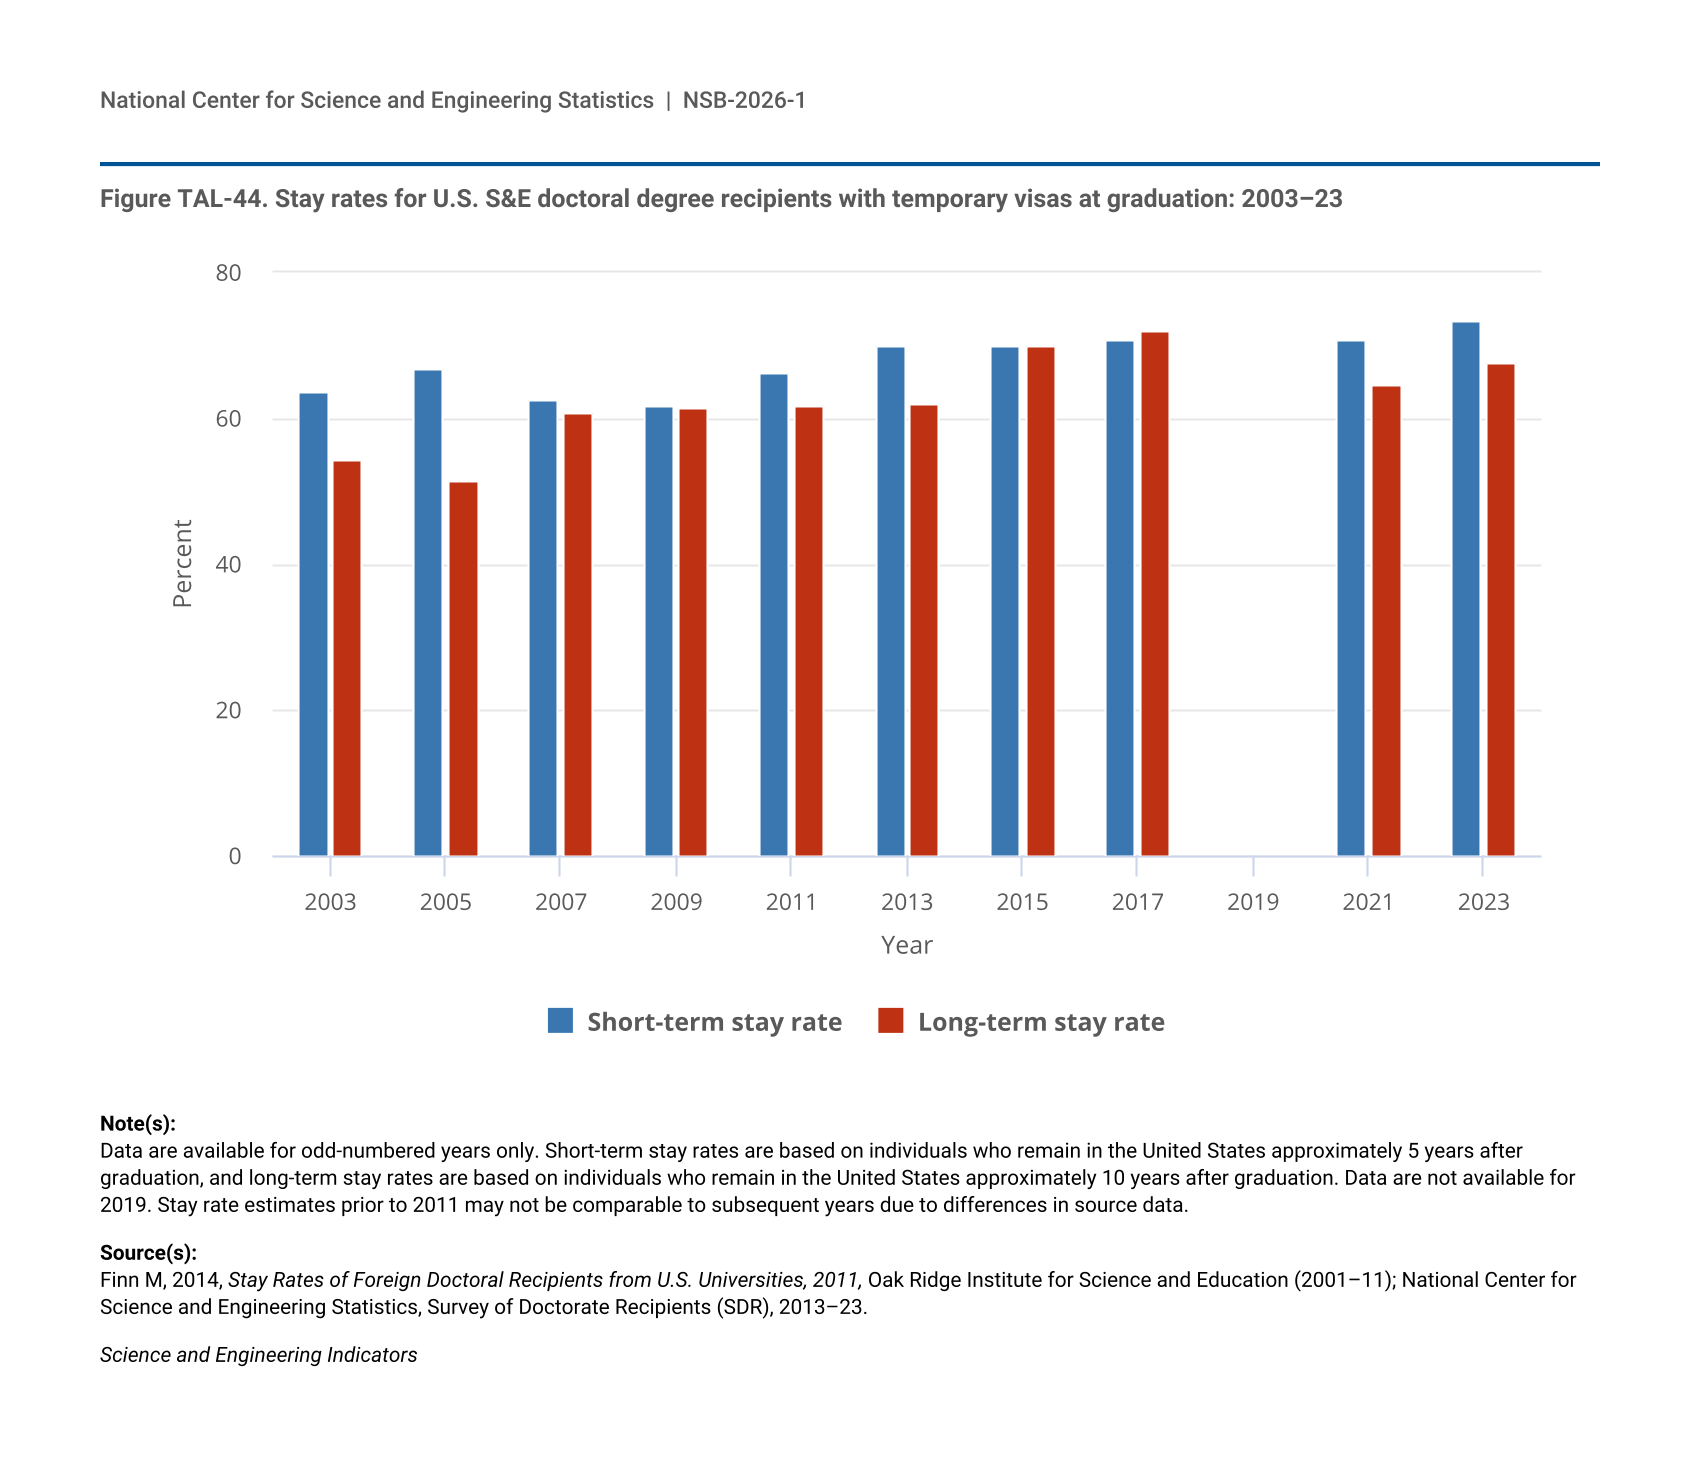
Long-Term Stay Rates of S&E Doctorate Holders
Although intentions to stay provide insight at the time of degree completion, the short- and long-term stay rates for S&E research doctorate recipients with temporary visas from earlier graduation cohorts show the longer-term retention of doctorate-holding scientists and engineers in the United States. Across the 44,450 temporary visa holders from all countries of citizenship and S&E degree fields who earned their doctorate between academic years 2017 and 2019, the short-term stay rate (approximately 5 years after graduation) was 73% in 2023. Among the 42,250 temporary visa holders from all countries of citizenship and S&E degree fields who earned their doctorate between academic years 2012 and 2014, the long-term stay rate (approximately 10 years after graduation) was 68% (Figure TAL-44; Table TAL-18). Although the short-term stay rate in 2023 (73%) increased slightly from 2021 (71%), there was no statistically significant difference in the long-term stay rate between 2021 and 2023.
| Year | Short-term stay rate | Long-term stay rate |
|---|---|---|
| 2003 | 63.7 | 54.3 |
| 2005 | 66.9 | 51.4 |
| 2007 | 62.6 | 60.9 |
| 2009 | 61.6 | 61.4 |
| 2011 | 66.4 | 61.8 |
| 2013 | 70.0 | 62.0 |
| 2015 | 70.0 | 70.0 |
| 2017 | 71.0 | 72.0 |
| 2019 | NA | NA |
| 2021 | 70.8 | 64.7 |
| 2023 | 73.4 | 67.8 |
Data are available for odd-numbered years only. Short-term stay rates are based on individuals who remain in the United States approximately 5 years after graduation, and long-term stay rates are based on individuals who remain in the United States approximately 10 years after graduation. Data are not available for 2019. Stay rate estimates prior to 2011 may not be comparable to subsequent years due to differences in source data.
Finn M, 2014, Stay Rates of Foreign Doctoral Recipients from U.S. Universities, 2011, Oak Ridge Institute for Science and Education (2001–11); National Center for Science and Engineering Statistics, Survey of Doctorate Recipients (SDR), 2013–23.
Science and Engineering Indicators
a U.S.-trained S&E doctorate recipients holding temporary U.S. visas at graduation, degrees awarded between 1 July 2016 and 30 June 2019.
b U.S.-trained S&E doctorate recipients holding temporary U.S. visas at graduation, degrees awarded between 1 July 2011 and 30 June 2014.
c North America excludes the United States.
d Other regions include the Caribbean, Central America, Oceania, and abroad, region not specified.
The National Center for Science and Engineering Statistics (NCSES) estimates short-term and long-term stay rates. Short-term stay rates are based on individuals who remain in the United States approximately 5 years after graduation, and long-term stay rates are based on individuals who remain in the United States approximately 10 years after graduation. Stay rate is the percentage residing in the United States on 1 February 2023 of U.S.-trained S&E doctorate recipients holding temporary U.S. visas at doctorate graduation. Weighted frequencies are rounded to the nearest 50. Stay rates are rounded to the nearest integer. Due to changes in the NCSES Taxonomy of Disciplines, field of degree numbers and proportions may not be comparable with those from prior years. Detail may not add to total due to rounding.
NCSES, Survey of Doctorate Recipients (SDR), 2023.
Science and Engineering Indicators
Stay rates varied by field of doctoral degree and by country and region of citizenship (Table TAL-18). The short- and long-term stay rates of doctorate recipients with temporary visas were similar in computer and mathematical sciences (about 75%). Yet, for doctorate holders in engineering and in physical sciences, the short-term stay rates were higher than the long-term stay rates. For doctorate holders in engineering, the short-term stay rate was 80%, and the long-term stay rate was 71%; for those in the physical sciences, the short-term stay rate was 75%, and the long-term stay rate was 65%. Doctorate holders with Indian citizenship had greater short-term stay rates (86%) than long-term stay rates (75%).
Internationally Mobile Students Enrolled in Tertiary Education
Global S&E connections and research collaboration, which can be facilitated by the international exchange of students, are areas of substantial interest to the NSB (NSB 2020b). In 2023, the United States was the most popular destination for internationally mobile tertiary (postsecondary) students, enrolling 957,000 of them (see the Glossary section for a definition of internationally mobile students). Other popular destinations for internationally mobile students were the United Kingdom (748,000), Australia (467,000), Germany (423,000), Canada (389,000), and Russia (336,000) (Table TAL-19). From 2017 to 2023, the number of international students in the United States decreased by 3%, whereas it increased in all other top countries of destination between 2017 and 2023 or the latest year of data available.
NA = not available.
Data include only degree-mobile students who have physically crossed an international border to enroll with the objective of graduating with a degree in the country of destination. Students enrolled in short-term, for-credit programs and exchange programs are excluded.
United Nations Educational, Scientific and Cultural Organization (UNESCO), Institute for Statistics (UIS) database.
Science and Engineering Indicators


