 An official website of the United States government
 Persistence and Attrition in STEM Education and Training
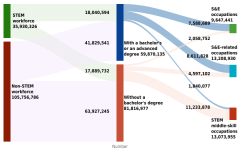
Along the trajectory to STEM employment, talent retention influences the eventual makeup of the STEM workforce. From high school through undergraduate and graduate education and the transition to the STEM workforce, understanding where people exit the pipeline can shed light on attrition from STEM education and the workforce.
Postsecondary Enrollment in STEM
The High School Longitudinal Study of 2009 (HSLS:09) follows a nationally representative sample of students who were ninth graders in fall 2009 from high school into postsecondary education and the workforce (NCES 2024a). Part of the HSLS:09 data includes the Postsecondary Education Administrative Records Collection that was conducted in 2021, approximately 8 years after high school graduation for most of the cohort. Together, these data provide information on whether fall 2009 ninth graders enrolled in STEM postsecondary education completed a STEM degree by June 2021. The data also provide information about enrollment characteristics and STEM degree completion for those students.
Declared STEM Majors Who Completed a STEM Degree
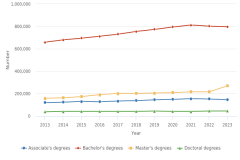
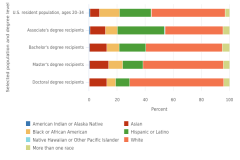
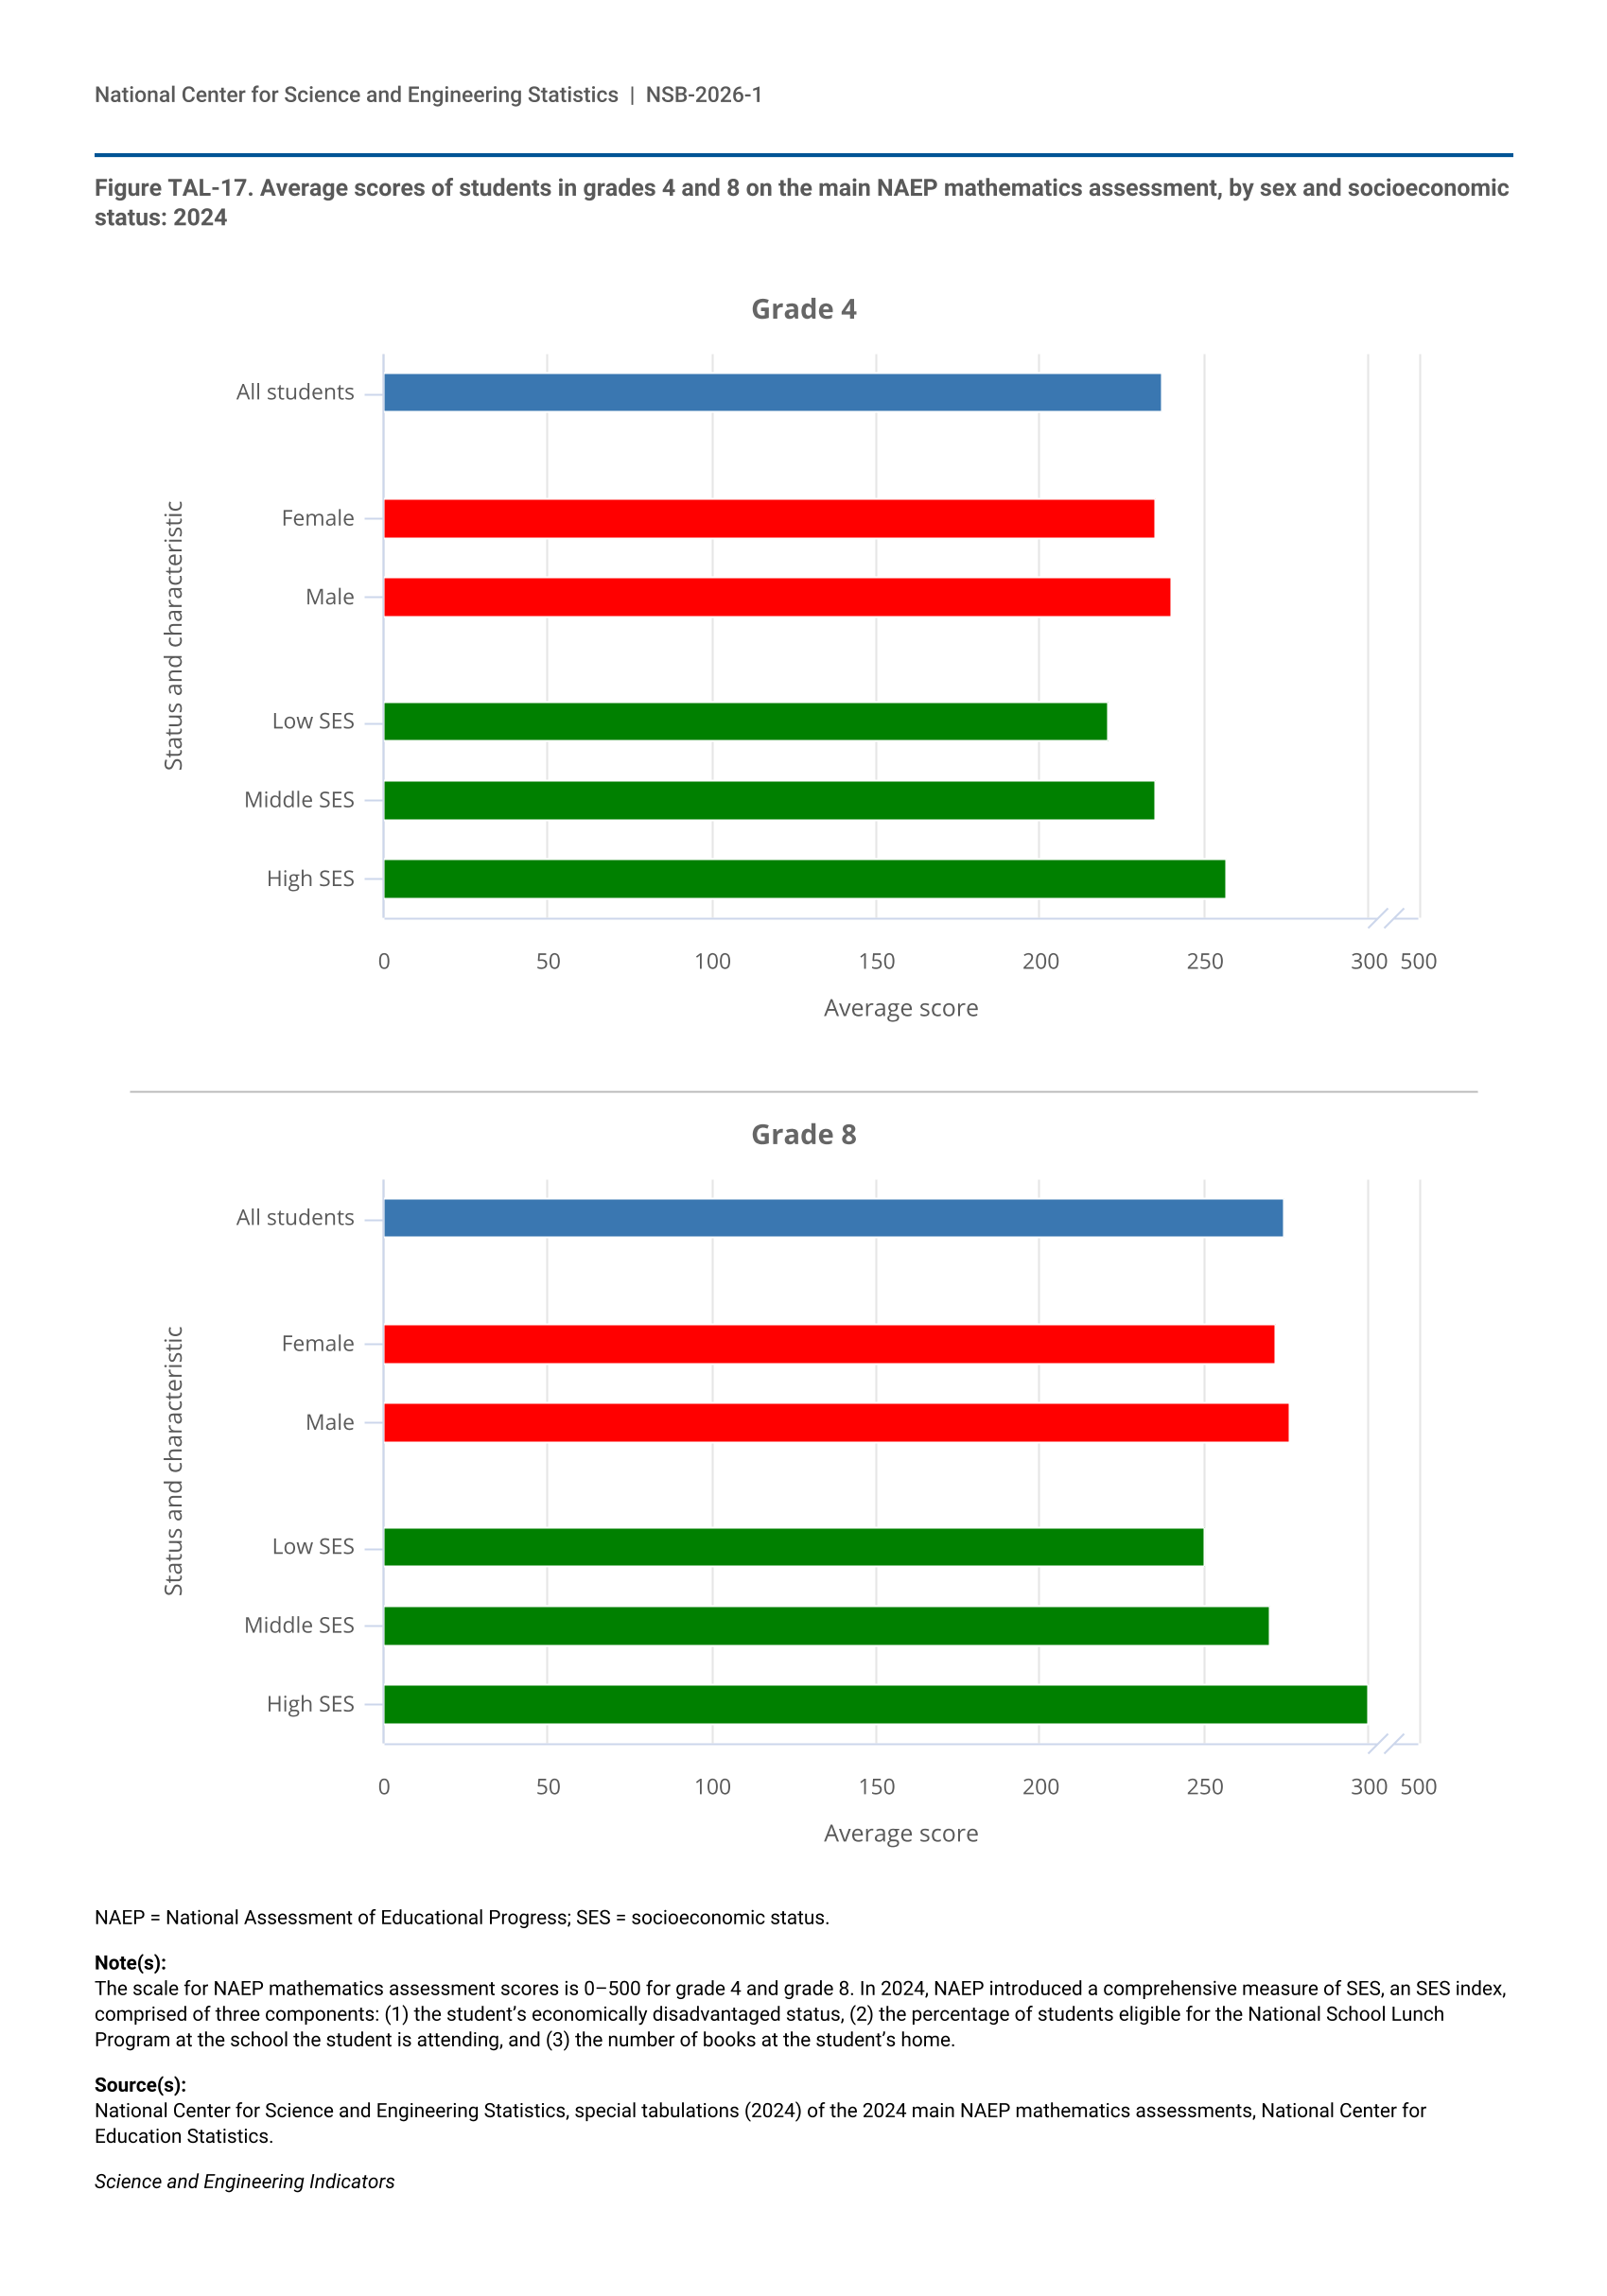
Approximately 1.8 million ninth graders in fall 2009 had enrolled in a postsecondary certificate or degree by 2017 (Table STAL-21). Of these students, 38% entered postsecondary education with a declared STEM major. As of 2021, 55% of students who had started as a STEM major had completed a STEM undergraduate certificate or degree, 16% completed a non-STEM degree, and 29% did not complete any degree (Table TAL-14). A higher proportion of women (57%) who started in STEM completed a STEM degree, compared with men (53%). Of Asian students who started in STEM, 70% completed a STEM degree, and 62% of White students did so. Less than half of Hispanic (44%) and Black (40%) students who started in STEM completed a STEM degree. Students’ mathematics achievement in high school is also associated with postsecondary STEM degree completion. Of students who scored in the highest quintile of a mathematics assessment in grade 11, 71% completed a STEM degree, compared with 34% of students who scored in the lowest quintile.
S = reporting standards not met either because the standard error is greater than 50% of the estimate or because there were too few cases for a reliable estimate.
STEM = science, technology, engineering, and mathematics.
a Interpret data with caution. Estimate is unstable because the standard error is between 30% and 50% of the estimate.
Estimates pertain to fall 2009 ninth-grade students who first enrolled in a STEM major at their primary first institution through 2017 and had degree completion information as of spring 2021. In most cases, the primary first postsecondary record is the institution and associated academic year with the earliest start date after high school. Completed a STEM degree includes any undergraduate certificate, associate's degree, and bachelor's degree earned in the fields of science technologies or technicians; psychology and other social science; and health and medicine. Estimates are weighted using the survey weight "W6W5STU." Detail may not sum to totals because of rounding.
Department of Education, National Center for Education Statistics, High School Longitudinal Study of 2009 (HSLS:09).
Science and Engineering Indicators
Type of Degree Completed by Students Who Declared a STEM Major
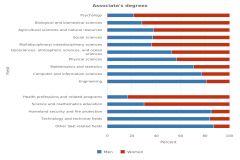
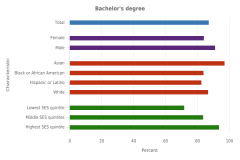
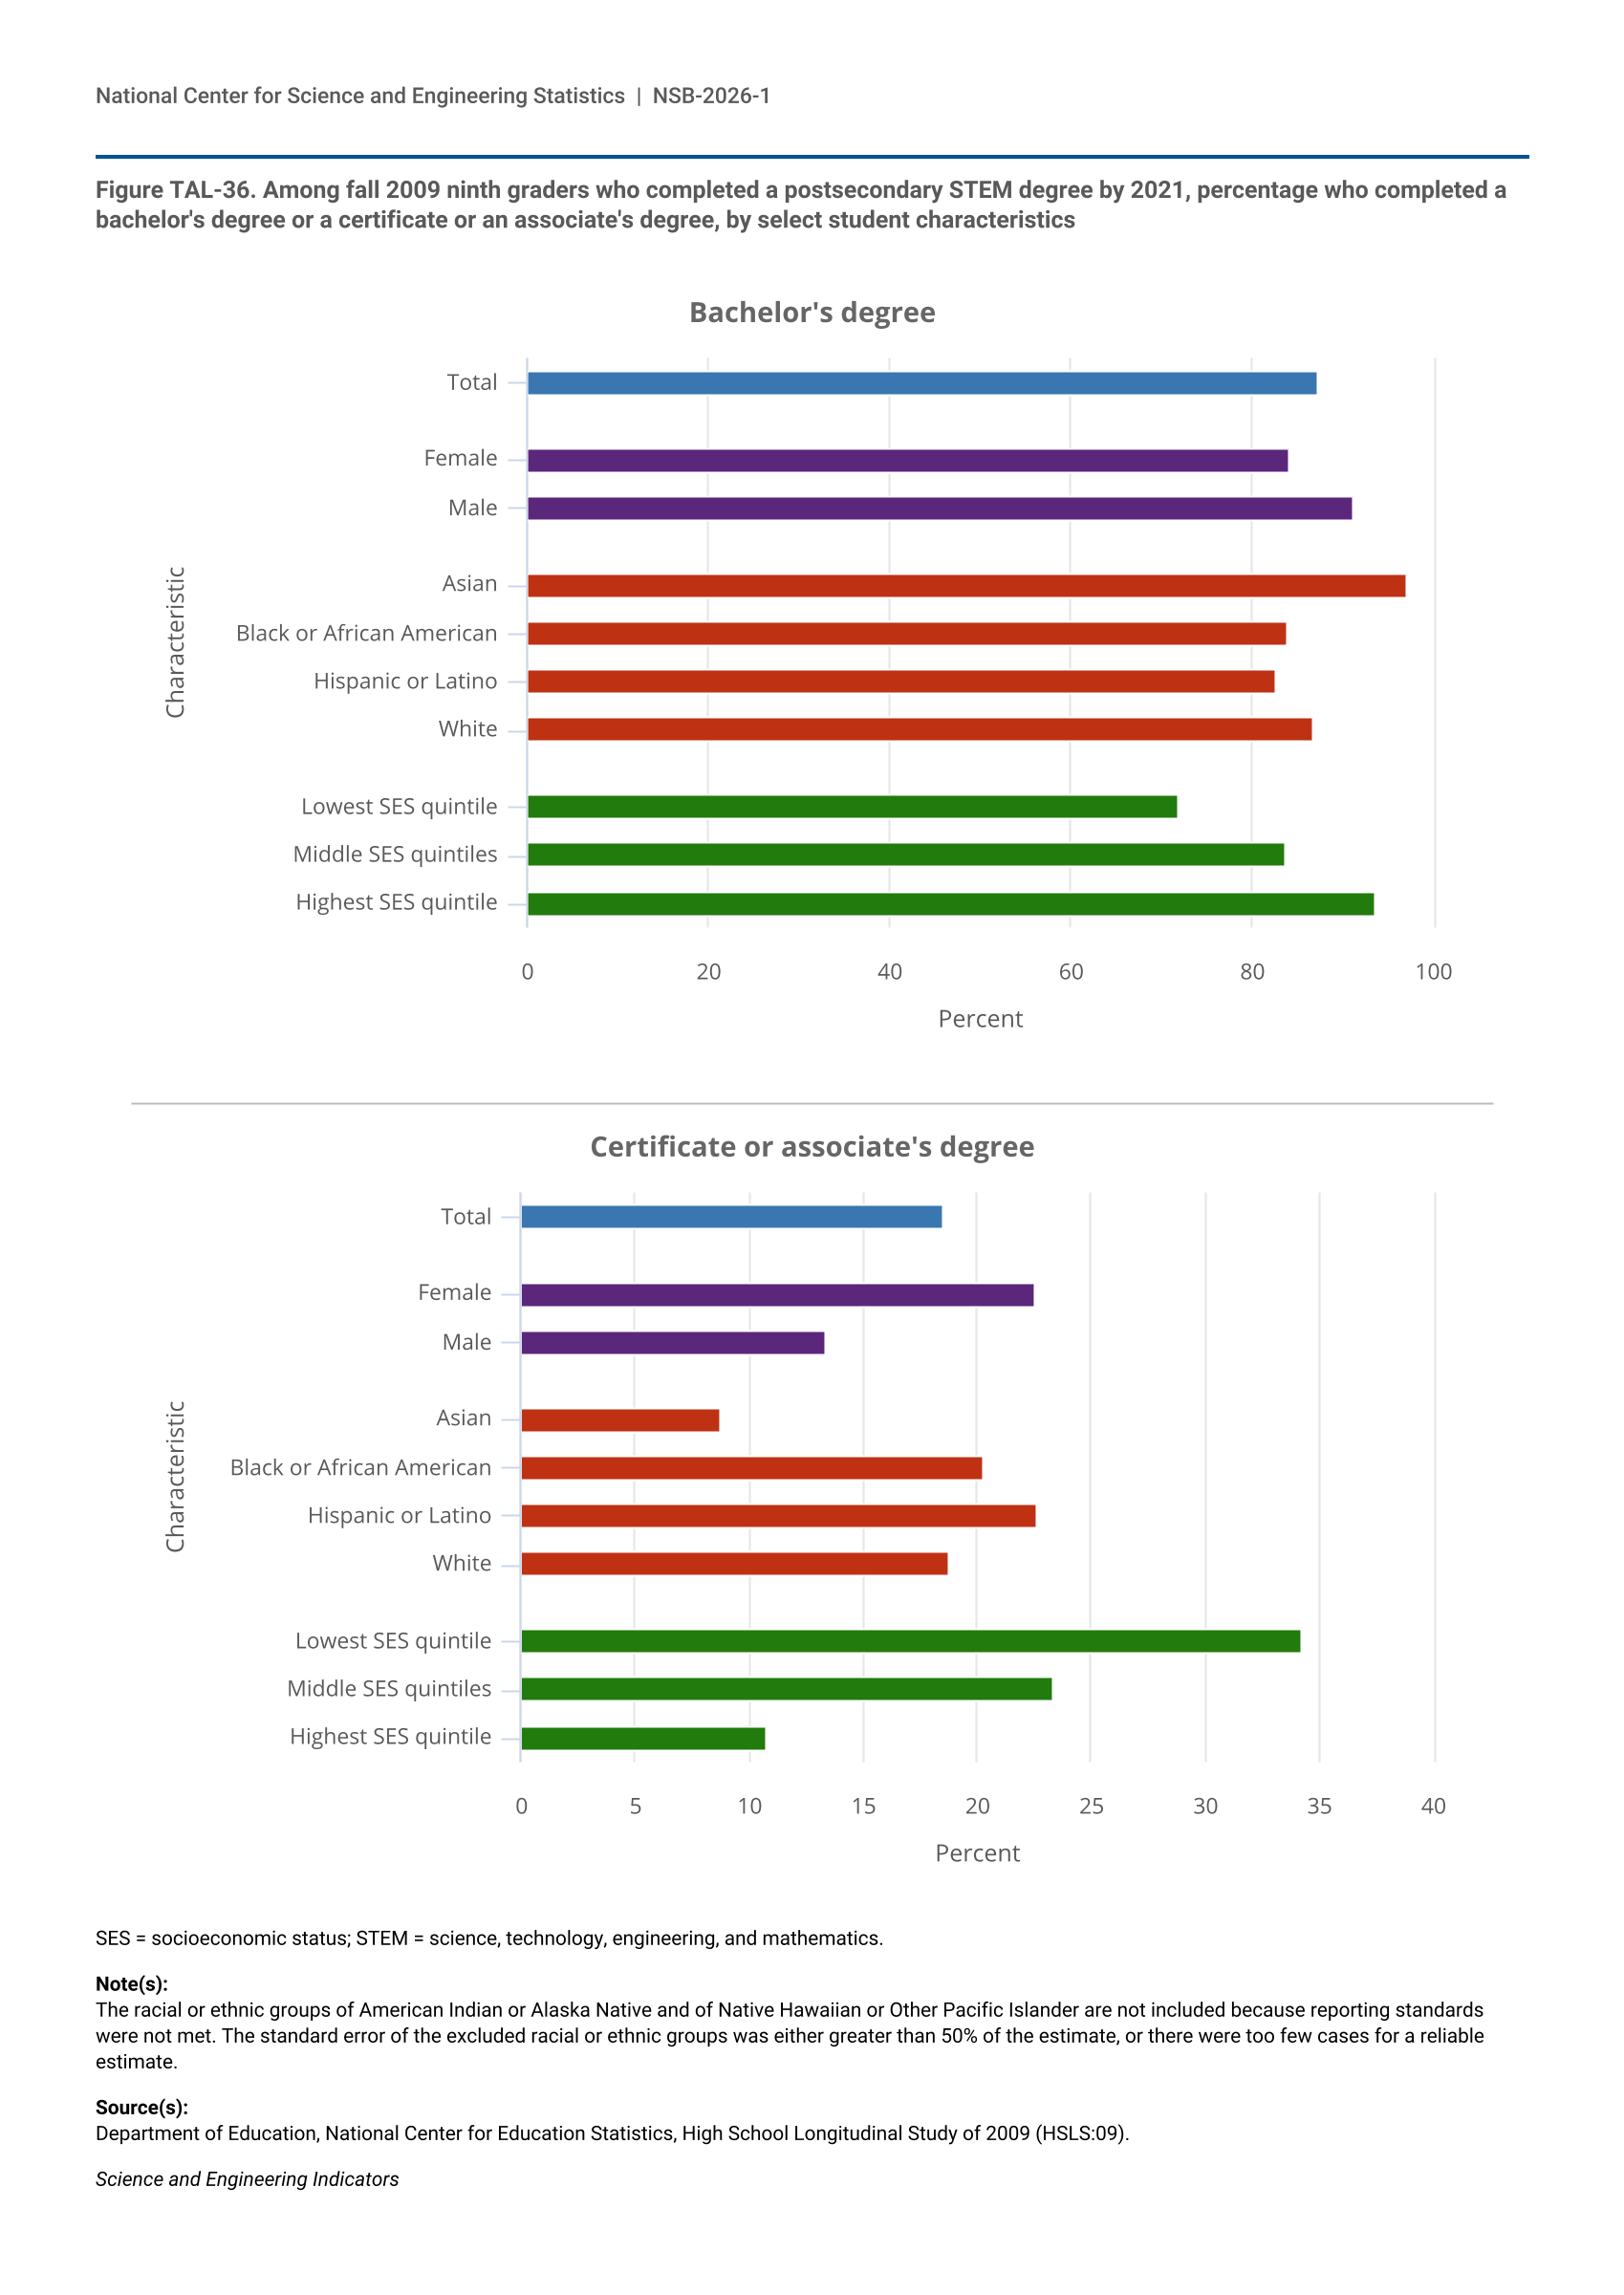
Among those who completed a STEM degree, 87% earned a bachelor’s degree and 19% earned a certificate or an associate’s degree (Figure TAL-36). The percentage of students completing a bachelor’s degree or a certificate or an associate’s degree varied by student characteristics. More men than women completed a bachelor’s degree, whereas more women than men completed a certificate or an associate’s degree. The proportions of Asian students and White students (97% and 87%, respectively) who entered as postsecondary STEM majors and completed a postsecondary STEM bachelor’s degree were higher than the proportions of Hispanic and Black students (83% and 84%, respectively) who did so.
| Characteristic | Bachelor's degree |
|---|---|
| Total | 87.2 |
| Female | 84.2 |
| Male | 91.2 |
| Asian | 97.1 |
| Black or African American | 83.9 |
| Hispanic or Latino | 82.6 |
| White | 86.8 |
| Lowest SES quintile | 71.8 |
| Middle SES quintiles | 83.8 |
| Highest SES quintile | 93.6 |
| Characteristic | Certificate or associate's degree |
|---|---|
| Total | 18.5 |
| Female | 22.5 |
| Male | 13.4 |
| Asian | 8.7 |
| Black or African American | 20.3 |
| Hispanic or Latino | 22.6 |
| White | 18.8 |
| Lowest SES quintile | 34.2 |
| Middle SES quintiles | 23.3 |
| Highest SES quintile | 10.7 |
SES = socioeconomic status; STEM = science, technology, engineering, and mathematics.
The racial or ethnic groups of American Indian or Alaska Native and of Native Hawaiian or Other Pacific Islander are not included because reporting standards were not met. The standard error of the excluded racial or ethnic groups was either greater than 50% of the estimate, or there were too few cases for a reliable estimate.
Department of Education, National Center for Education Statistics, High School Longitudinal Study of 2009 (HSLS:09).
Science and Engineering Indicators
Transition to Employment for Research Doctorate Recipients
In the current global economy, knowledge is an increasingly valuable national asset. When studying abroad, international students broaden their career prospects, and many of them may weigh job opportunities in different countries. This section focuses on research doctorate recipients who studied at U.S. institutions of higher education and had definite employment commitments or postdoctoral study or training positions in the United States at the time of graduation.
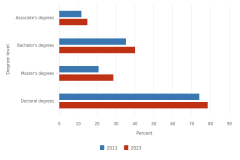
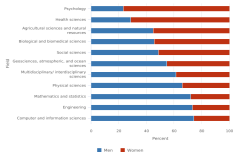
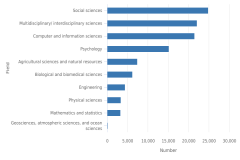
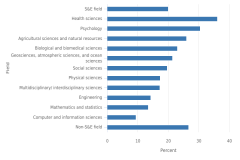
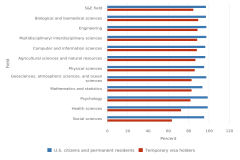
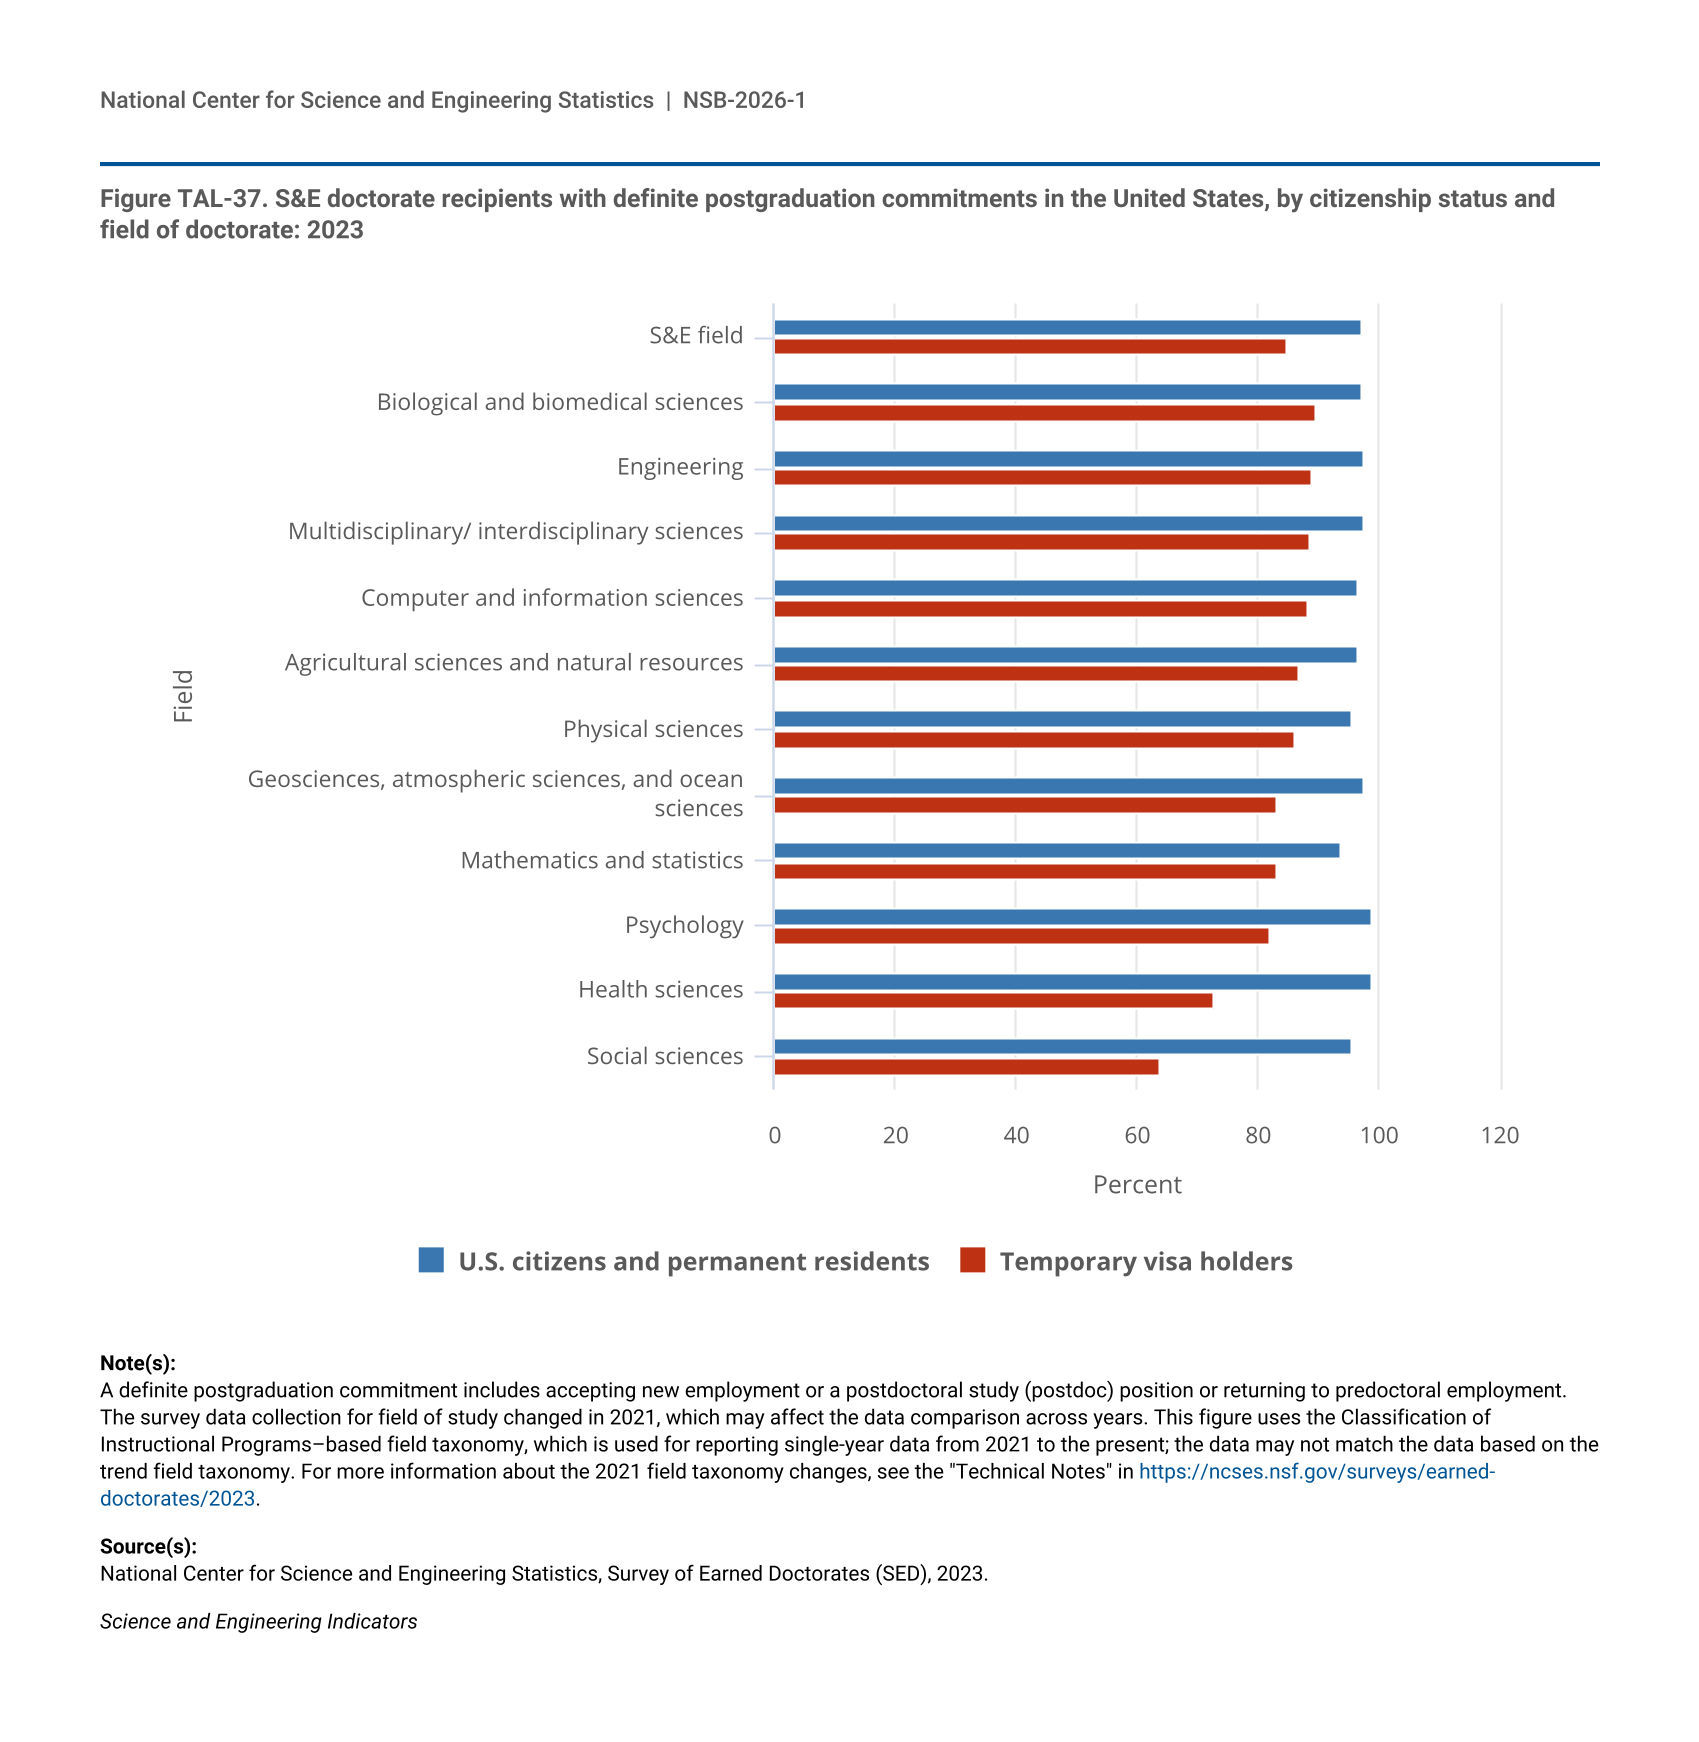
In 2023, of the students awarded S&E doctoral degrees, 27,010 recipients were U.S. citizens and permanent residents and 16,807 were temporary visa holders (Table TAL-15) (NCSES 2024b: Table 6-2, Table 6-3). The majority of S&E doctorate recipients in both groups reported having definite postgraduation commitments at the time they responded to the survey, although this proportion was slightly higher among temporary visa holders (72%) than among U.S. citizens and permanent residents (69%). In both groups, most of the employment commitments were in the United States, but this proportion was higher for U.S. citizens and permanent residents (97%) than for temporary visa holders (85%) (Table TAL-15). Among temporary visa holders reporting definite employment commitments, the proportion with a commitment in the United States were highest for those in biological and biomedical sciences (90%), engineering (89%), multidisciplinary sciences (89%), and computer and information sciences (88%); these proportions were lowest for those in health sciences (73%) and social sciences (64%) (Figure TAL-37).
a Industry employment includes doctorate recipients reporting self-employment.
b Other includes doctorate recipients reporting government, nonprofit, elementary or secondary school, or other employment and those with unknown employment.
A definite postgraduation commitment includes accepting new employment or a postdoctoral study (postdoc) position or returning to predoctoral employment. The survey data collection for field of study changed in 2021, which may affect the data comparison across years. This figure uses the Classification of Instructional Programs–based field taxonomy, which is used for reporting single-year data from 2021 to the present; the data may not match the data based on the trend field taxonomy. For more information about the 2021 field taxonomy changes, see the "Technical Notes" in https://ncses.nsf.gov/surveys/earned-doctorates/2023.
National Center for Science and Engineering Statistics, Survey of Earned Doctorates (SED), 2023.
Science and Engineering Indicators
| Field | U.S. citizens and permanent residents | Temporary visa holders |
|---|---|---|
| S&E field | 97.2 | 84.8 |
| Biological and biomedical sciences | 97.4 | 89.8 |
| Engineering | 97.7 | 89.0 |
| Multidisciplinary/ interdisciplinary sciences | 97.7 | 88.6 |
| Computer and information sciences | 96.5 | 88.3 |
| Agricultural sciences and natural resources | 96.7 | 87.0 |
| Physical sciences | 95.4 | 86.2 |
| Geosciences, atmospheric sciences, and ocean sciences | 97.6 | 83.0 |
| Mathematics and statistics | 93.7 | 83.0 |
| Psychology | 99.1 | 81.9 |
| Health sciences | 98.9 | 72.8 |
| Social sciences | 95.6 | 63.9 |
A definite postgraduation commitment includes accepting new employment or a postdoctoral study (postdoc) position or returning to predoctoral employment. The survey data collection for field of study changed in 2021, which may affect the data comparison across years. This figure uses the Classification of Instructional Programs–based field taxonomy, which is used for reporting single-year data from 2021 to the present; the data may not match the data based on the trend field taxonomy. For more information about the 2021 field taxonomy changes, see the "Technical Notes" in https://ncses.nsf.gov/surveys/earned-doctorates/2023.
National Center for Science and Engineering Statistics, Survey of Earned Doctorates (SED), 2023.
Science and Engineering Indicators
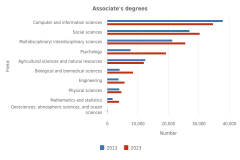
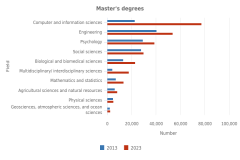
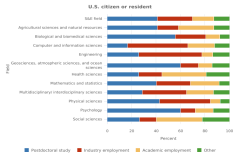
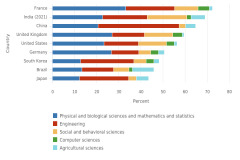
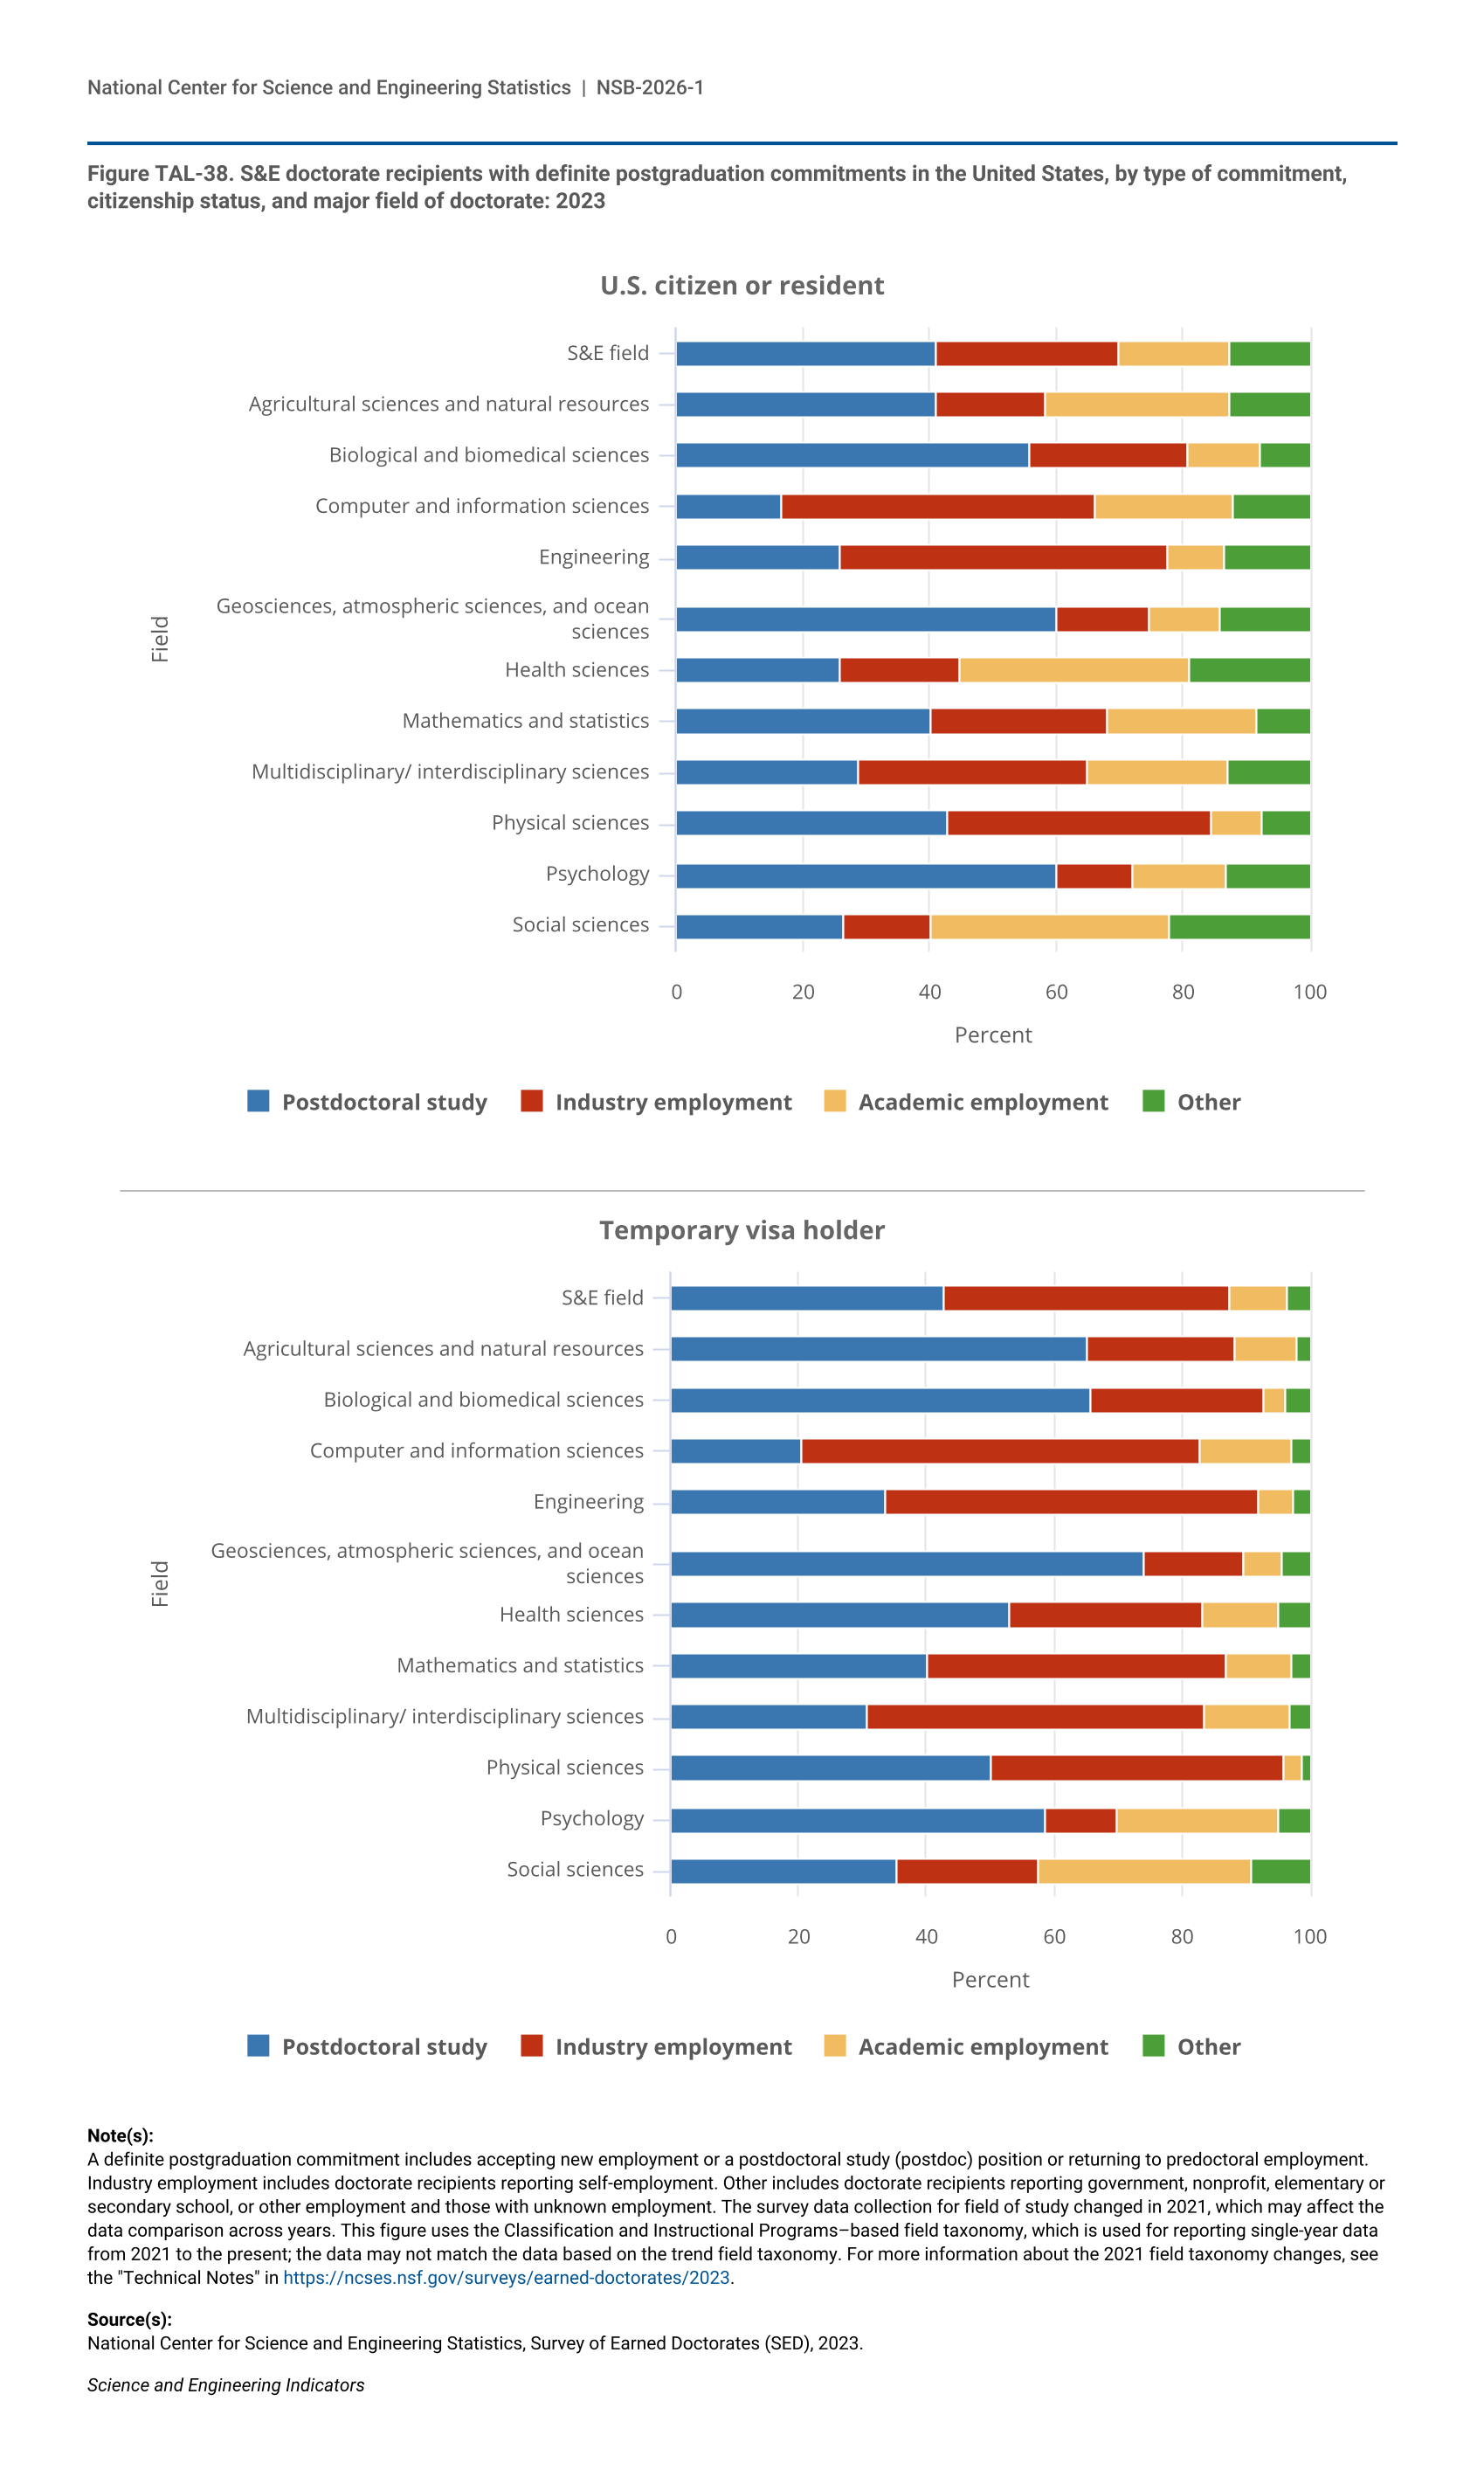
Postdoctoral study or training is a temporary position in which doctorate recipients can gain additional education and training in research, usually awarded in academia, industry, government, or a nonprofit organization. In 2023, among S&E doctorate recipients who reported postgraduation employment in the United States, about 42% reported having secured a postdoctoral training position, regardless of citizenship status. However, larger proportions of temporary visa holders than U.S. citizens reported postdoctoral positions in several S&E fields, particularly health sciences (53% vs. 26%), agricultural sciences and natural resources (65% vs. 41%), and geosciences, atmospheric sciences, and ocean sciences (74% vs. 60%) (Figure TAL-38; Table TAL-15).
Among doctorate recipients with definite postgraduation employment commitments in the United States, a larger proportion of U.S. citizens and permanent residents than temporary visa holders reported academic appointments that were not postdoctoral study (17% vs. 9%), whereas a larger proportion of temporary visa holders (45%) reported an industry position compared with their U.S. citizen and permanent resident counterparts (29%). This pattern can be observed in most fields of study (Figure TAL-38; Table TAL-15).
| Field | Postdoctoral study | Industry employment | Academic employment | Other |
|---|---|---|---|---|
| S&E field | 41.1 | 28.8 | 17.3 | 12.7 |
| Agricultural sciences and natural resources | 41.1 | 17.3 | 28.8 | 12.7 |
| Biological and biomedical sciences | 55.7 | 25.1 | 11.4 | 7.8 |
| Computer and information sciences | 16.6 | 49.6 | 21.6 | 12.2 |
| Engineering | 25.8 | 52.0 | 8.9 | 13.4 |
| Geosciences, atmospheric sciences, and ocean sciences | 60.0 | 14.9 | 11.2 | 14.0 |
| Health sciences | 26.0 | 18.9 | 36.1 | 19.0 |
| Mathematics and statistics | 40.4 | 27.7 | 23.7 | 8.3 |
| Multidisciplinary/ interdisciplinary sciences | 28.8 | 36.1 | 22.2 | 12.9 |
| Physical sciences | 42.9 | 41.6 | 8.0 | 7.5 |
| Psychology | 60.0 | 12.1 | 14.7 | 13.2 |
| Social sciences | 26.3 | 13.9 | 37.8 | 22.0 |
| Field | Postdoctoral study | Industry employment | Academic employment | Other |
|---|---|---|---|---|
| S&E field | 42.6 | 44.9 | 9.1 | 3.3 |
| Agricultural sciences and natural resources | 65.1 | 23.1 | 9.8 | 2.0 |
| Biological and biomedical sciences | 65.8 | 27.1 | 3.6 | 3.6 |
| Computer and information sciences | 20.5 | 62.5 | 14.1 | 2.9 |
| Engineering | 33.7 | 58.2 | 5.3 | 2.7 |
| Geosciences, atmospheric sciences, and ocean sciences | 74.0 | 15.7 | 6.0 | 4.3 |
| Health sciences | 52.9 | 30.2 | 12.0 | 4.9 |
| Mathematics and statistics | 40.3 | 46.7 | 10.1 | 2.9 |
| Multidisciplinary/ interdisciplinary sciences | 30.7 | 52.8 | 13.3 | 3.2 |
| Physical sciences | 50.3 | 45.8 | 2.8 | 1.2 |
| Psychology | 58.6 | 11.3 | 25.3 | 4.8 |
| Social sciences | 35.3 | 22.2 | 33.3 | 9.1 |
A definite postgraduation commitment includes accepting new employment or a postdoctoral study (postdoc) position or returning to predoctoral employment. Industry employment includes doctorate recipients reporting self-employment. Other includes doctorate recipients reporting government, nonprofit, elementary or secondary school, or other employment and those with unknown employment. The survey data collection for field of study changed in 2021, which may affect the data comparison across years. This figure uses the Classification and Instructional Programs–based field taxonomy, which is used for reporting single-year data from 2021 to the present; the data may not match the data based on the trend field taxonomy. For more information about the 2021 field taxonomy changes, see the "Technical Notes" in https://ncses.nsf.gov/surveys/earned-doctorates/2023.
National Center for Science and Engineering Statistics, Survey of Earned Doctorates (SED), 2023.
Science and Engineering Indicators


