 An official website of the United States government
 Notes
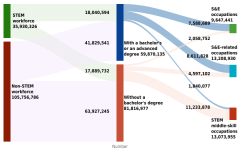
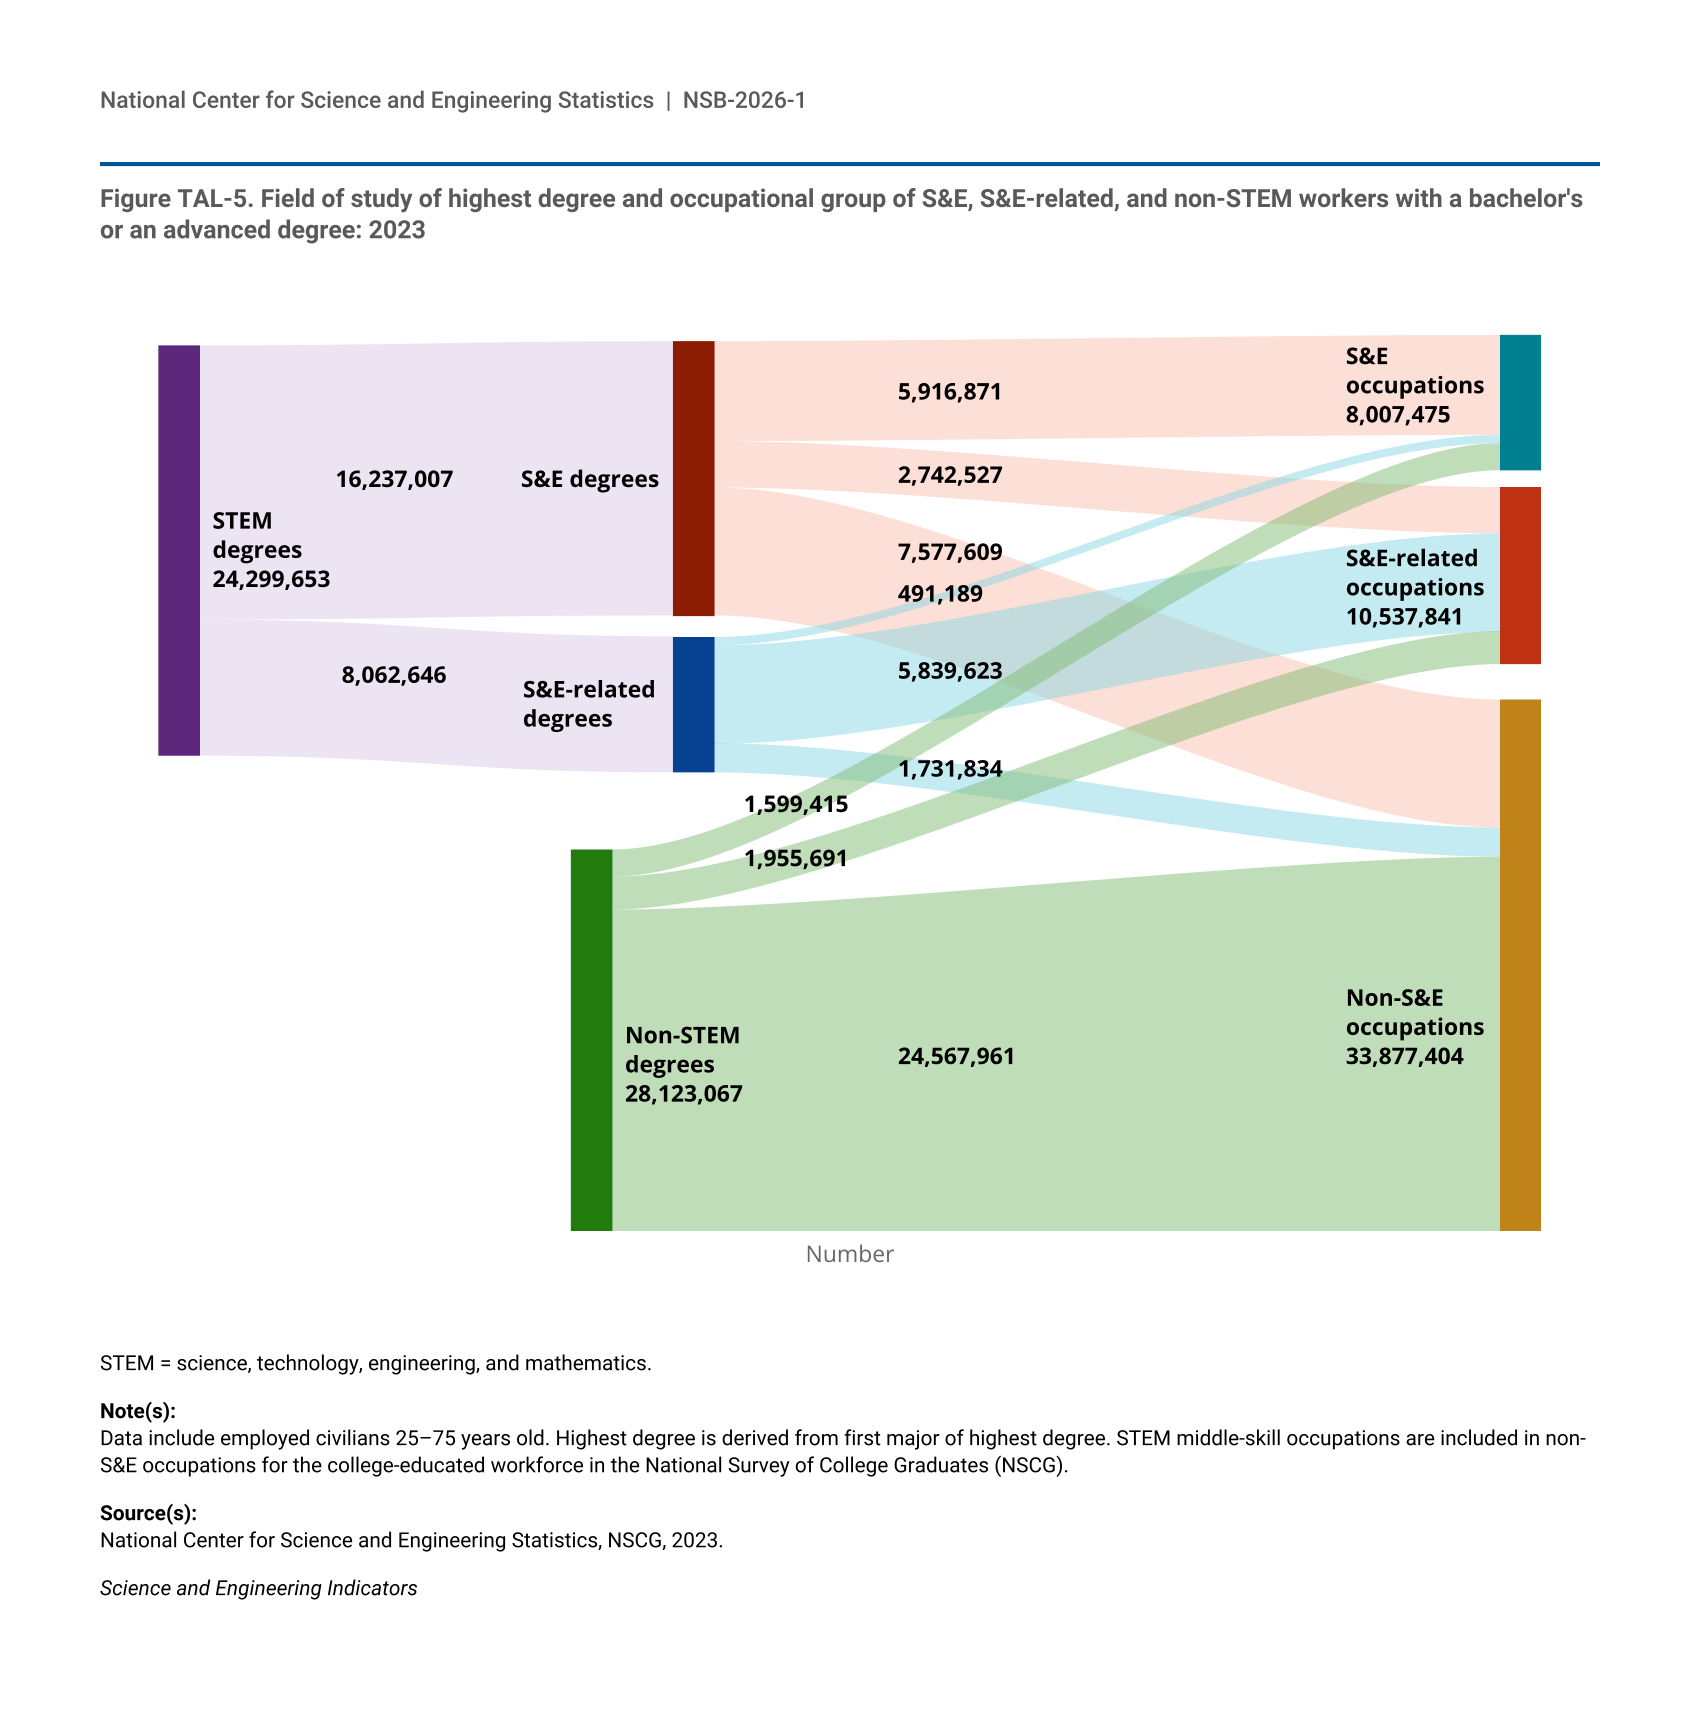
1 STEM fields include S&E and S&E-related fields.
2 The NSCG is a survey of respondents who earned a bachelor’s or an advanced degree. The 2023 NSCG continued a rotating panel design, with a sample selected from multiple American Community Survey (ACS) annual samples (2015, 2017, 2019, and 2021 ACS). As a result, the 2023 NSCG reports the 2023 outcomes of the 2021 U.S. population still eligible for the NSCG. It does not account for people who earned a degree after 2021. In contrast, the 2023 ACS reports the 2023 outcomes of the 2023 U.S. population. Given the coverage and other methodological differences between the two surveys, the size of the STEM workforce derived from each is different. Caution should be used when comparing the estimates presented using the ACS and the NSCG. In the NSCG and the Integrated Postsecondary Education Data (IPEDS), fields of study for STEM degrees are aggregated to S&E and S&E-related fields for all degree levels. In the Survey of Earned Doctorates (SED), all STEM fields of study at the doctoral level are aggregated to S&E fields. Doctoral degrees in health fields are classified as health sciences under S&E for the SED, whereas these fields are classified as health professions and related programs under S&E-related at all degree levels in the IPEDS and NSCG. The STEM degree classification in the IPEDS data in this report was created and recoded by NCSES and is available in the NCSES version of IPEDS through NCSES Data Tools. For more information, see (NSCG 2023: Table A-1; SDR 2023: Table A-1; SED 2023: Table B-2); see also the Indicators 2024 report “Higher Education in Science and Engineering”: Revisions to Classification of IPEDS Degree Data under the NCSES Taxonomy of Disciplines (NSB 2023). For NCSES Data Tools, see https://ncses.nsf.gov/explore-data.
3 Given the coverage and other methodological differences between the American Community Survey (ACS) and the NSCG, the estimates using the NSCG differ from the estimates using the ACS. The ACS estimates that there were 7.6 million college-educated workers in S&E occupations and 8.6 million college-educated workers in S&E-related occupations in 2023, compared with 8.0 million and 10.5 million college-educated workers in S&E and S&E-related occupations, respectively, using the NSCG (Figure TAL-1, Figure TAL-5).
4 The increase in earnings from the associate’s level to the bachelor’s level was the smallest for workers in middle-skill occupations (5%). All other occupational fields had at least a 25% increase in earnings.
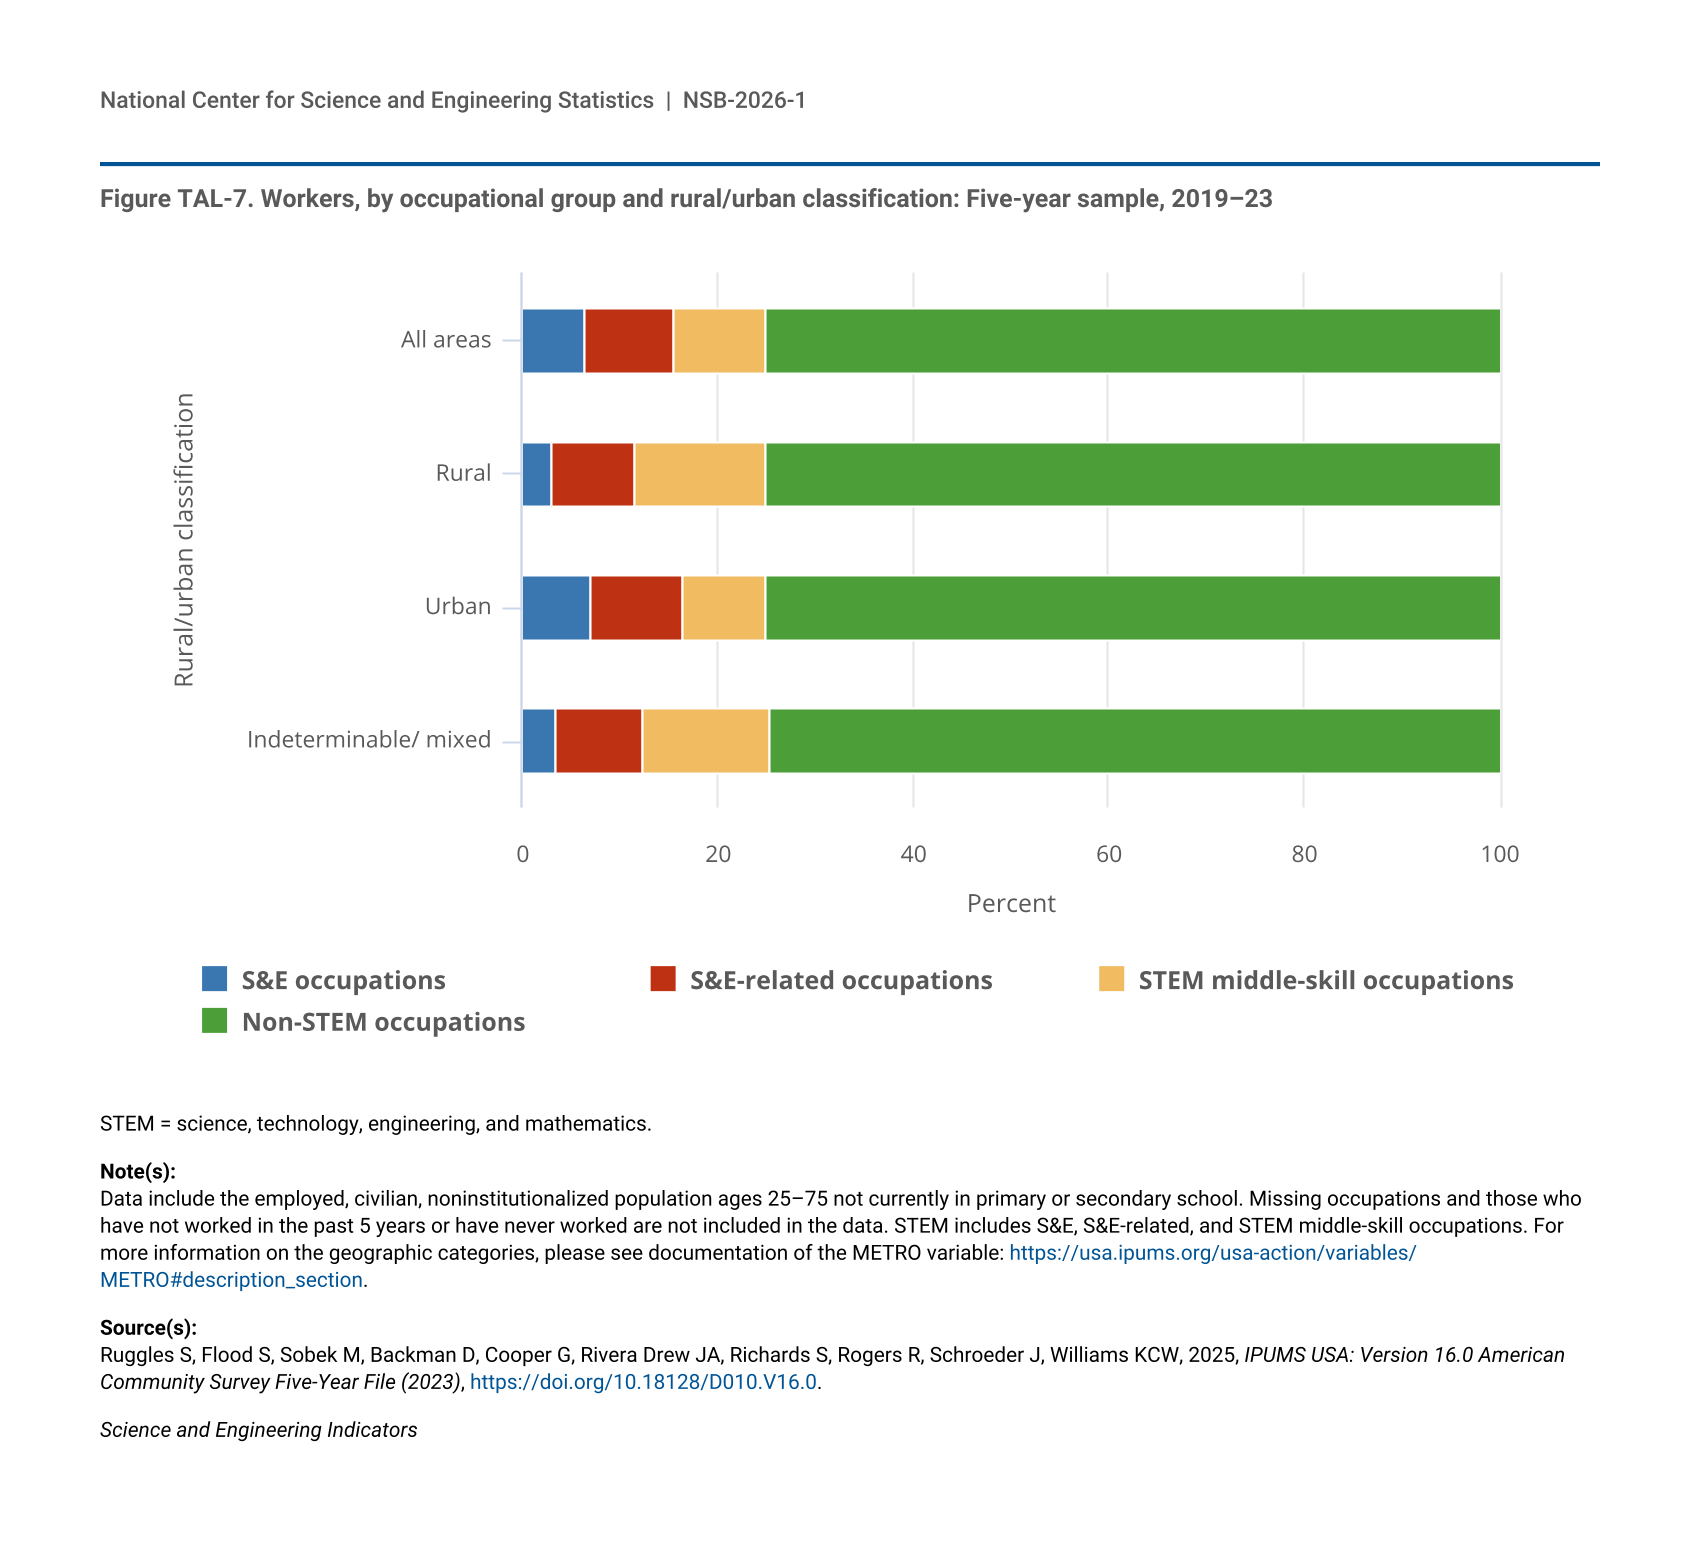
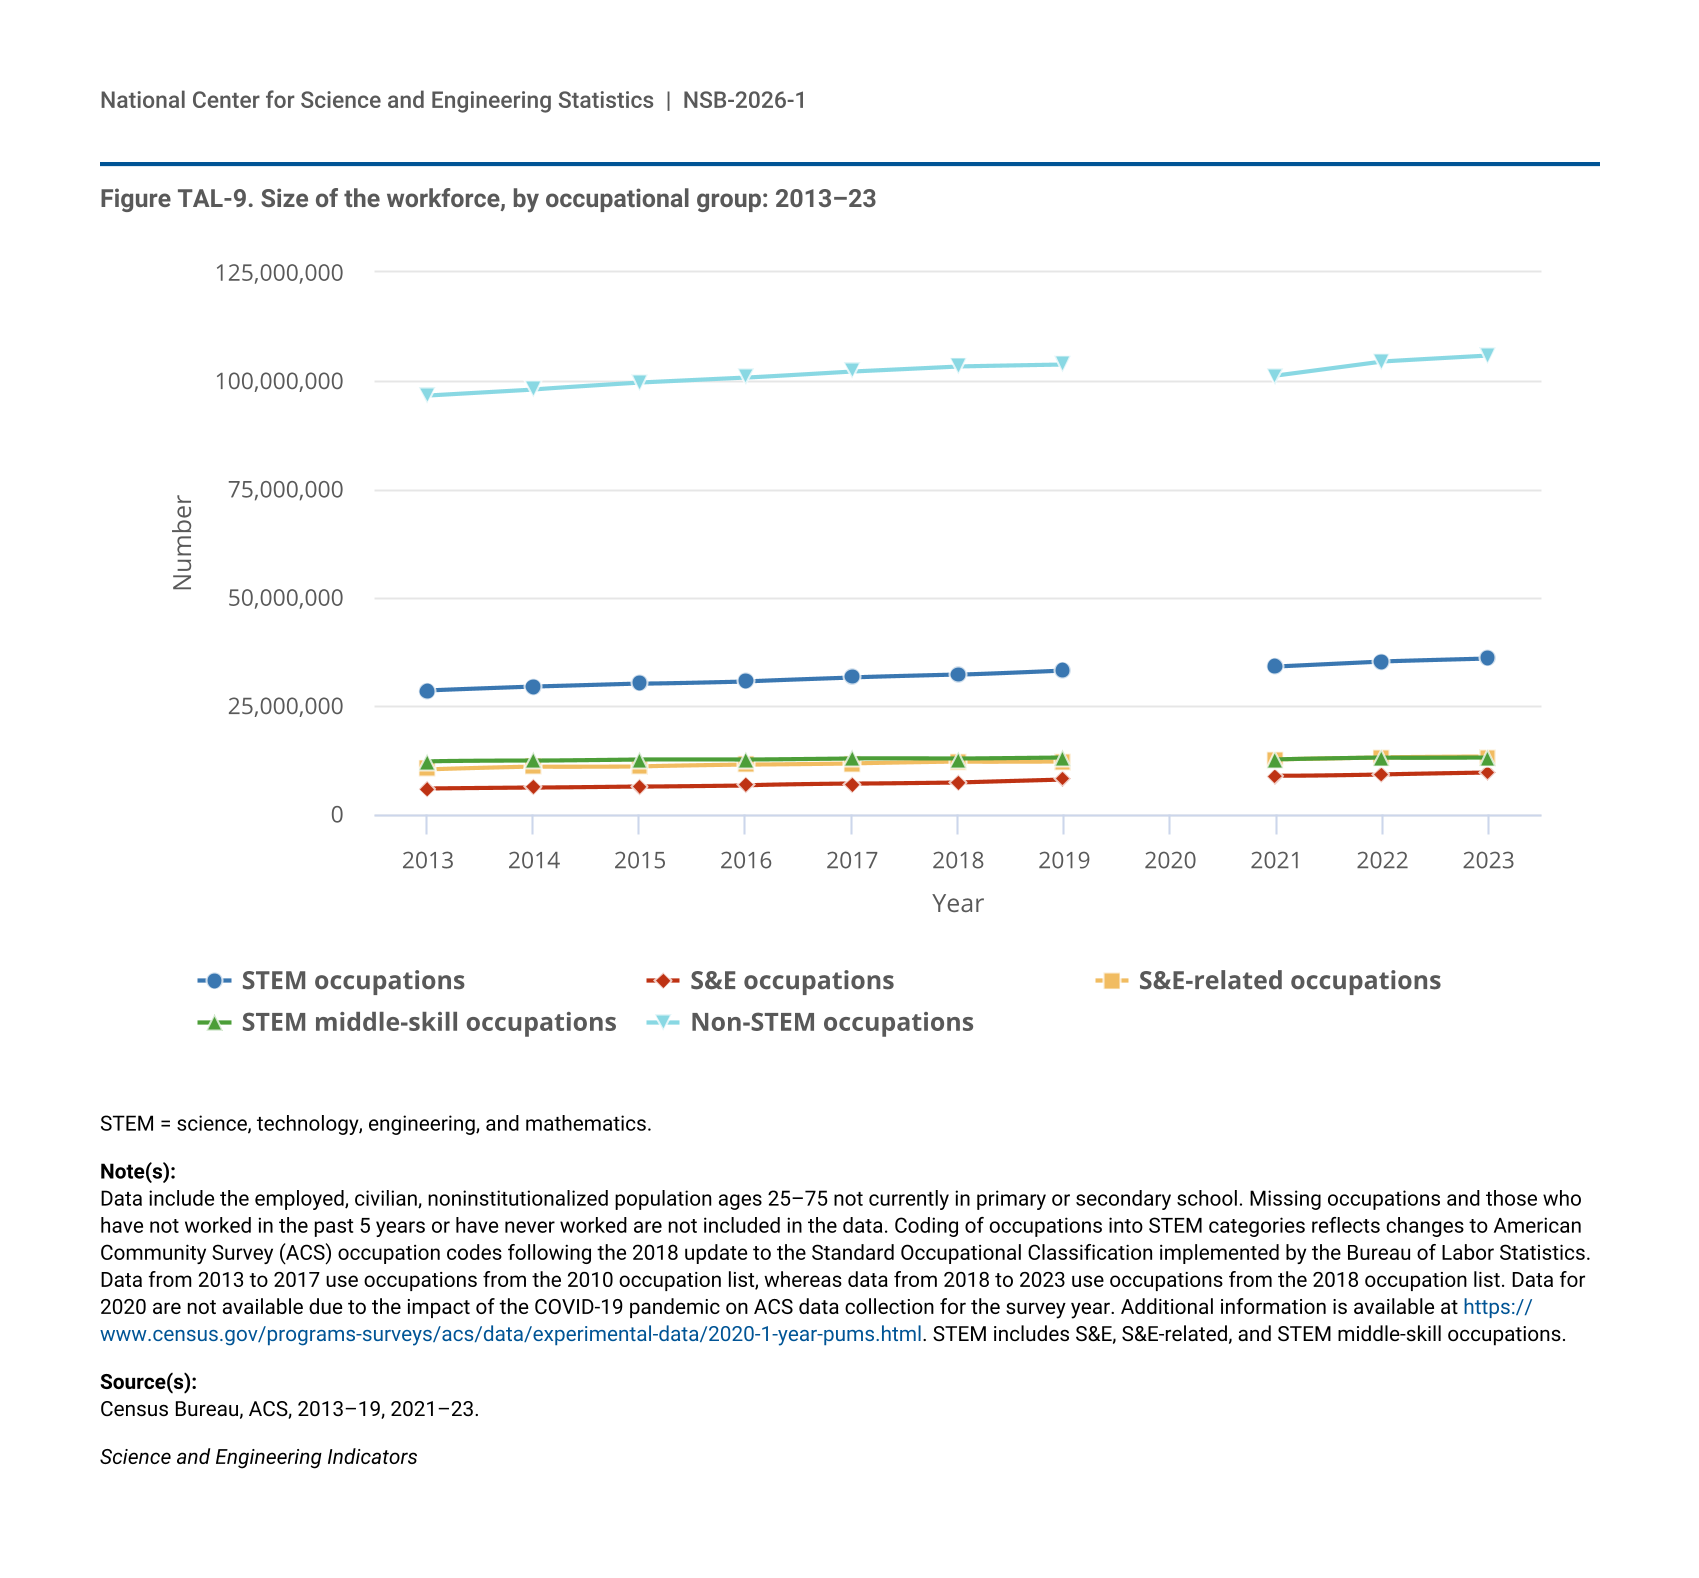
5 The working-age population consists of noninstitutionalized civilians ages 25–75 years who are currently not in primary or secondary school. The total workforce is defined as the employed working-age population.
6 Rural-urban classification is derived using the METRO variable in IPUMS. The METRO variable indicates whether a respondent resides in a metropolitan area or not in a metropolitan area. In this report, rural areas are defined as nonmetropolitan; urban areas are defined as metropolitan. Metropolitan and nonmetropolitan areas are not directly identified in the American Community Survey. Therefore, IPUMS uses other geographic variables to impute the categorization of the METRO variable. Public Use Microdata Areas (PUMAs) are defined as “nonoverlapping, statistical geographic areas that partition each state or equivalent entity into geographic areas containing no fewer than 100,000 people each.” If a PUMA is partially within a metropolitan area, then that PUMA is categorized as “indeterminable.” For more information, please see the description of the METRO variable.
7 Estimates of current and projected employment for 2023–33 are from the BLS National Employment Matrix; estimates in the matrix are developed using data from the Occupational Employment and Wage Statistics (OEWS) program and the Current Population Survey (CPS). Together, these sources cover paid workers and self-employed workers in all industries, agriculture, and private households. Because data are derived from multiple sources, they can often differ from employment data provided by OEWS, CPS, or other employment surveys alone. BLS neither makes projections for S&E occupations as a group nor does it do so for some of the S&E and S&E-related occupational categories as defined by the National Center for Science and Engineering Statistics (NCSES); numbers in the figure are based on the sum of BLS projections for occupations that NCSES includes in the respective categories. The STEM classifications used here differ slightly from those used in the American Community Survey due to additional occupation detail in the projection tabulations. A crosswalk will be provided upon request. For more information on BLS employment projections methods, please see https://www.bls.gov/emp/methods-overview.htm.
8 Origin is defined by place of birth. Respondents born outside of the United States and its territories, regardless of citizenship status, are considered foreign-born.
9 For more information, see https://www.census.gov/programs-surveys/sipp/tech-documentation/info-data-users.html.
10 In the NSCG and the IPEDS, fields of study for STEM degrees are aggregated to S&E and S&E-related fields for all degree levels. In the SED, all STEM fields of study at the doctoral level are aggregated to S&E fields. Doctoral degrees in health fields are classified as health sciences under S&E for the SED, whereas these fields are classified as health professions and related programs under S&E-related at all degree levels in the IPEDS and NSCG. For more information, see (NSCG 2023: Table A-1; SDR 2023: Table A-1; SED 2023: Table B-2); see also the Indicators 2024 report “Higher Education in Science and Engineering”: Revisions to Classification of IPEDS Degree Data under the NCSES Taxonomy of Disciplines (NSB 2023).
11 The intensity of employment in an occupational field is defined as the proportion of an industry’s total employment in that occupational field. See the Indicators 2020 report “Science and Engineering Labor Force” (NSB 2019).
12 Predecessors to BERD were the Survey of Industrial Research and Development (SIRD) (1953–2007), the Business R&D and Innovation Survey (BRDIS) (2008–16), and the Business Research and Development Survey (BRDS) (2017–18). Note that SIRD and BRDIS collected statistics for businesses with five or more employees. BRDS produced (and the BERD survey produces) statistics for businesses.
13 For the universe of industries that were considered, see https://ncses.nsf.gov/pubs/nsf20311/table/17 for 2017 and https://ncses.nsf.gov/pubs/nsf24335/table/17 for 2022. American Community Survey years in the analysis correspond to BERD/Business Research and Development Survey years.
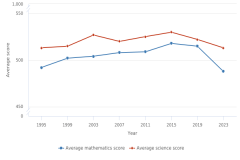
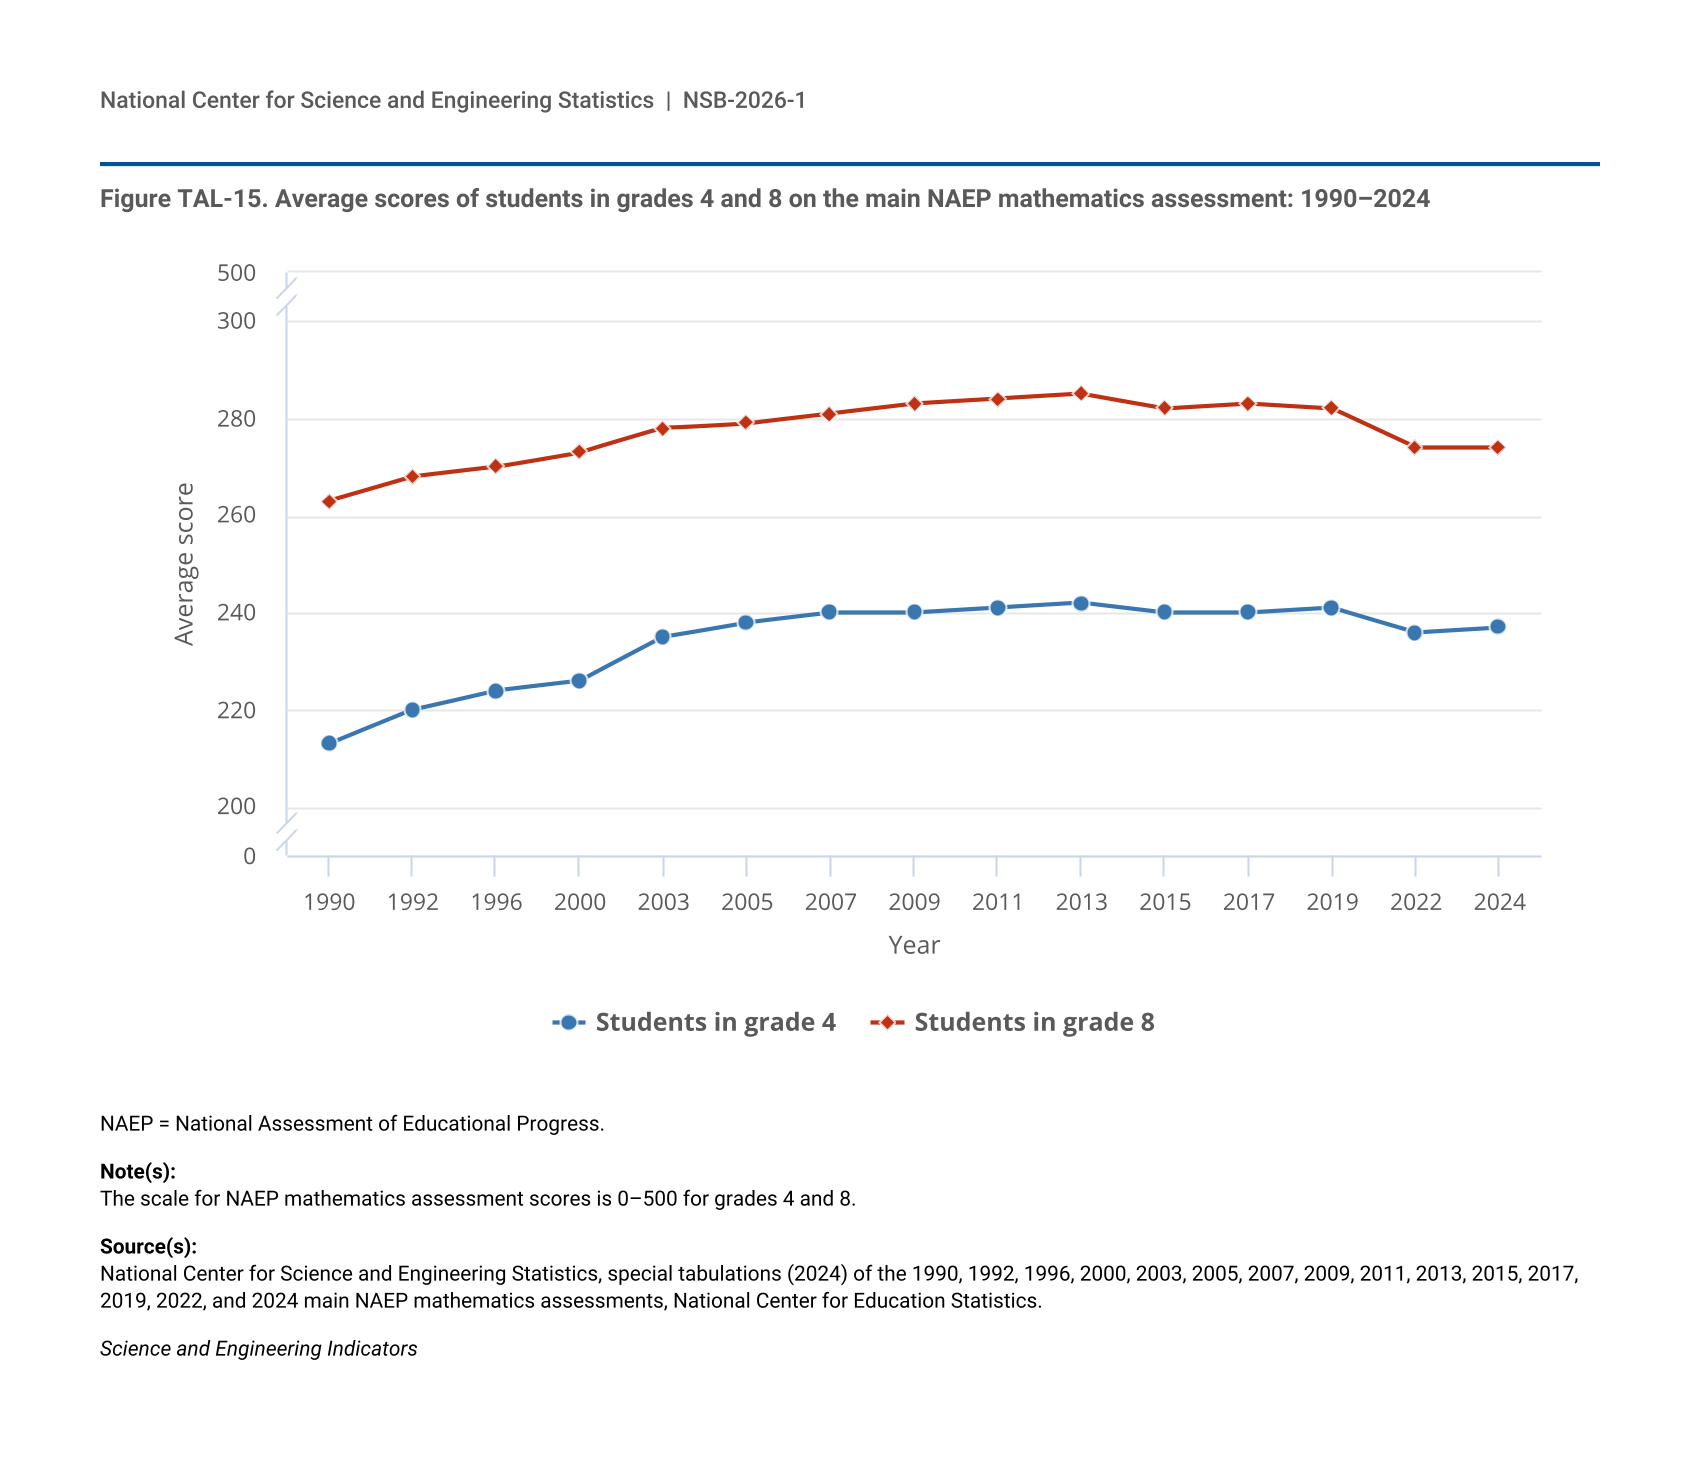
14 In 2024, the NAEP mathematics assessment was also conducted for 12th-grade students, and the NAEP science assessment was administered to eighth-grade students. However, the results from both assessments were published too late for a full analysis in this volume of Indicators. This volume provides a brief overview of 12th-grade mathematics results. Typically, the 12th-grade assessment would have occurred in 2023, 4 years after the 2019 assessment. Because of the pandemic, the NAEP mathematics assessment shifted by 1 year, with the original 2021 assessment occurring in 2022. NAEP assessments now occur every other even year. The 12th-grade assessment was administered at the same time as the fourth- and eighth-grade assessments in January–March 2024. Analysis of the Grade 8 science results is available in The State of U.S. Science and Engineering 2026. A comprehensive analysis of the 2024 NAEP assessments scores is available on the Nation’s Report Card website for mathematics and science.
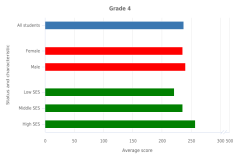
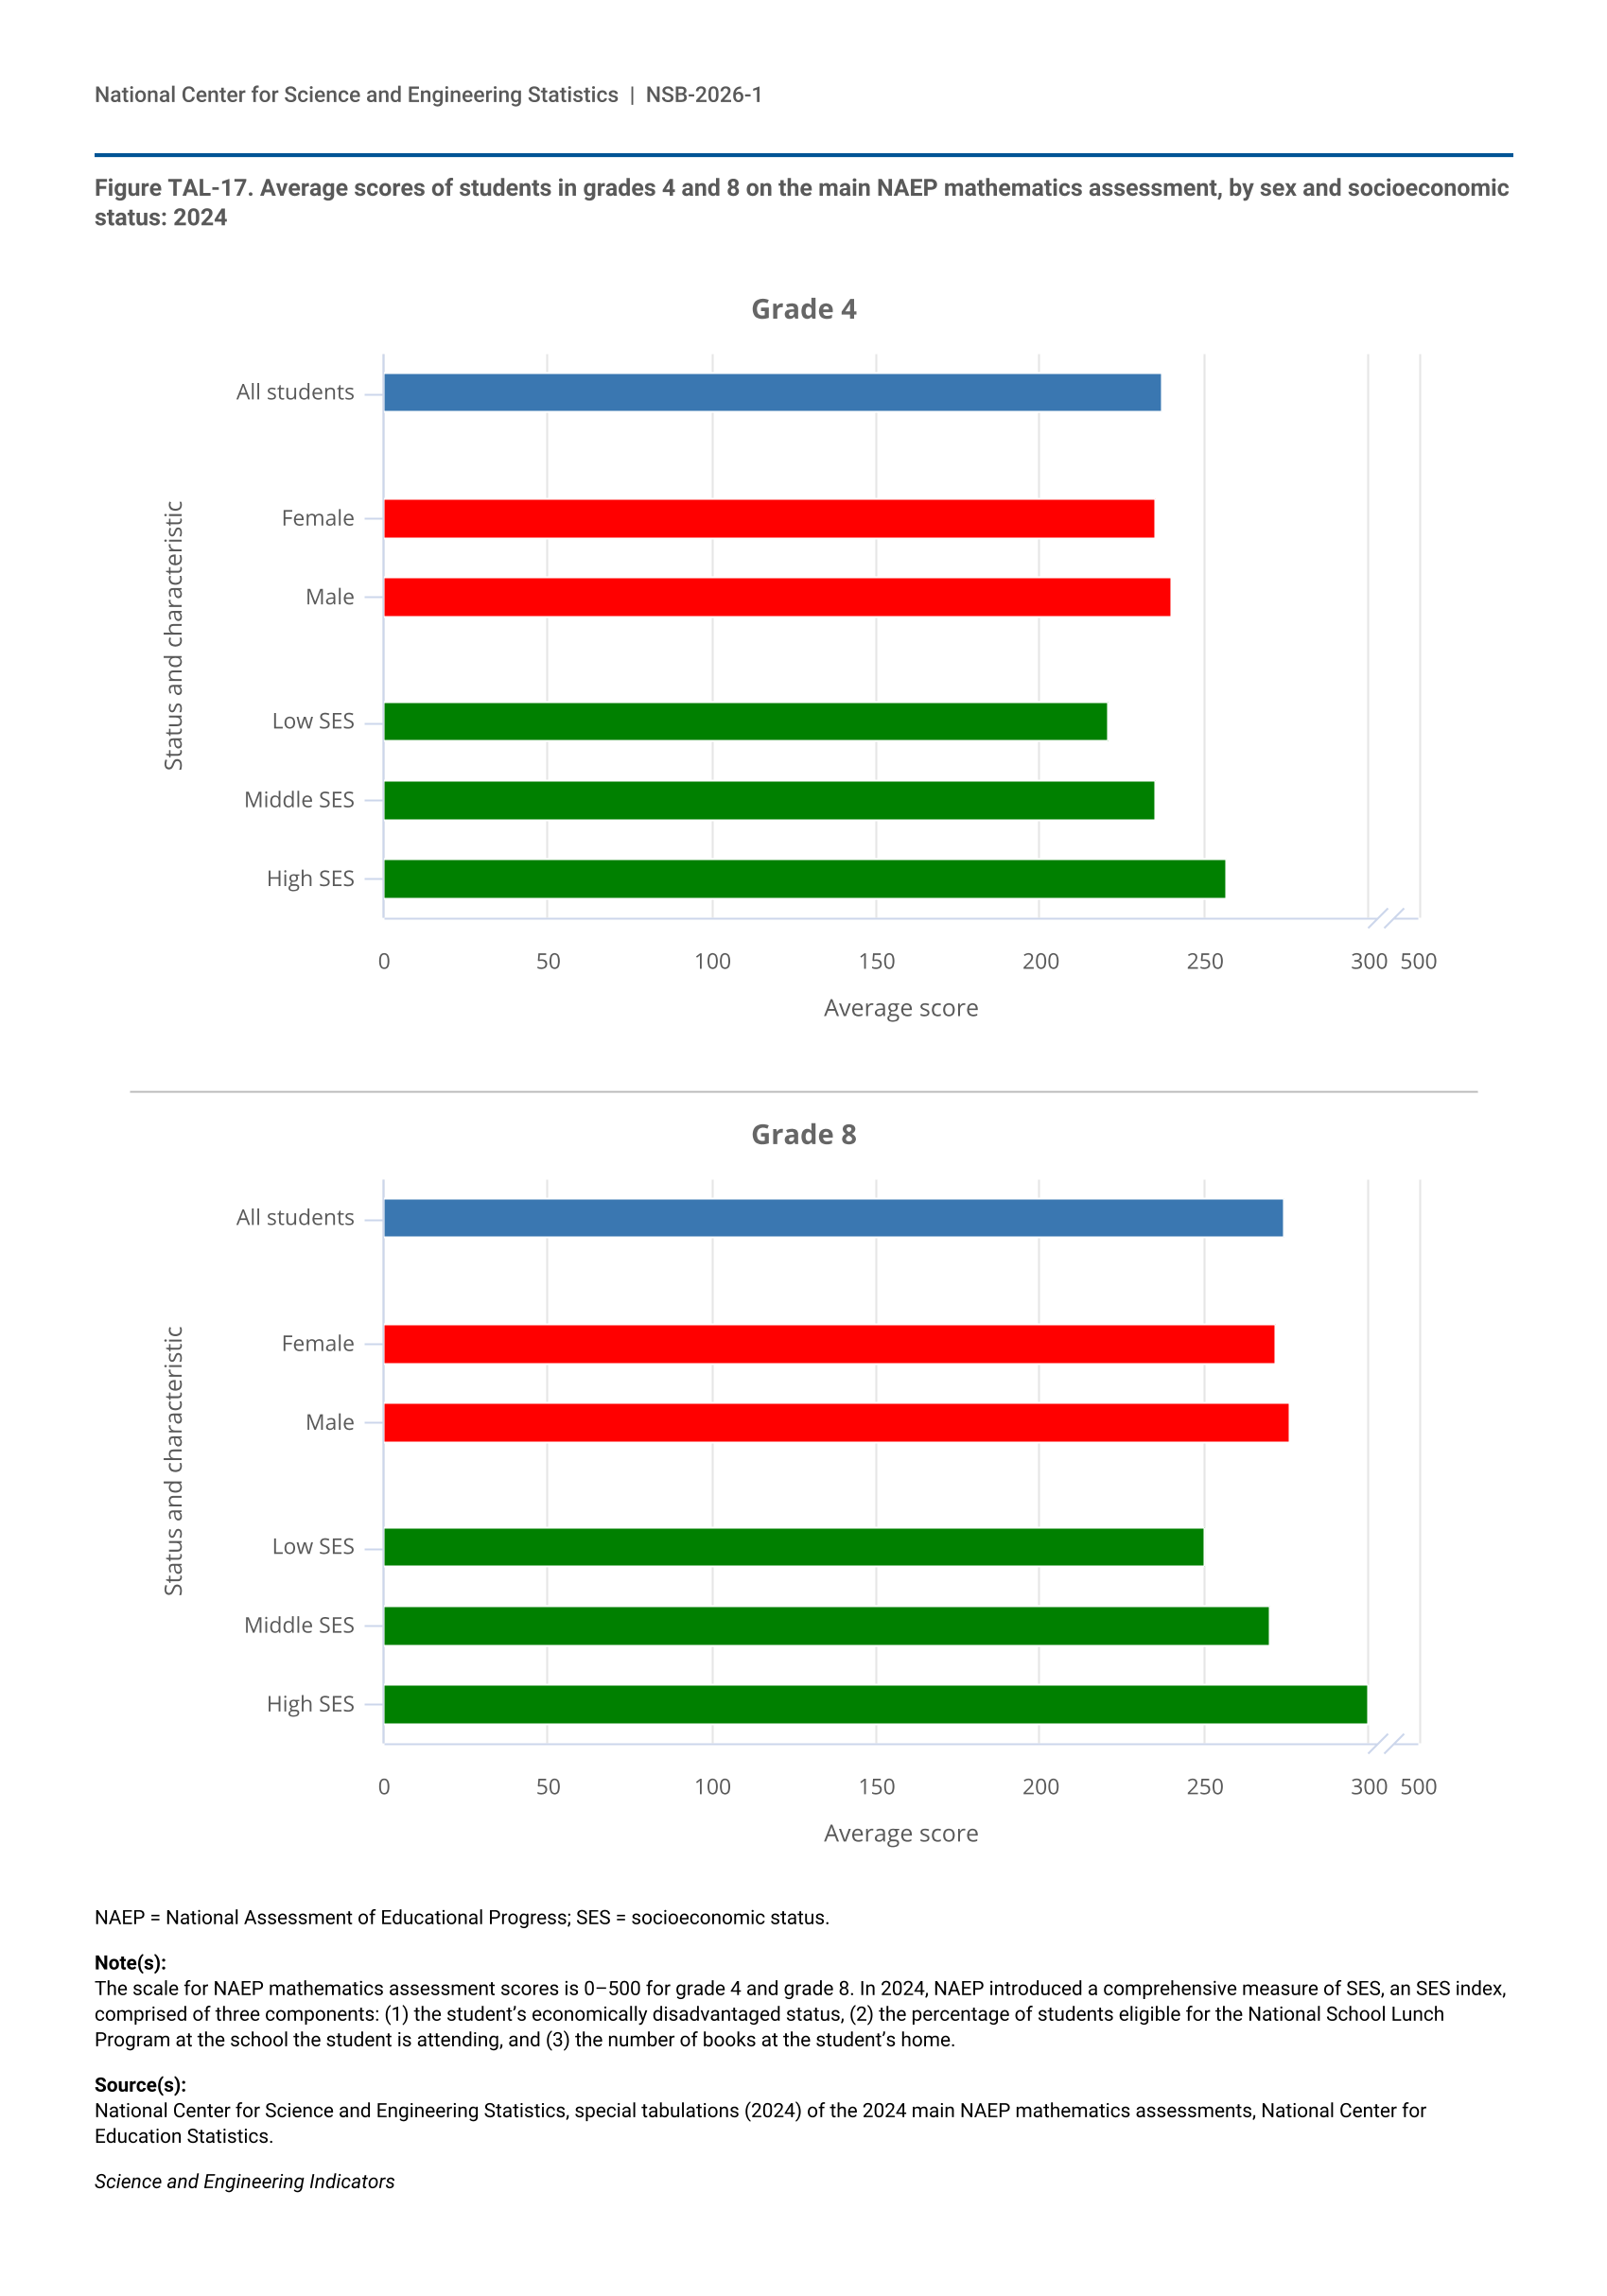
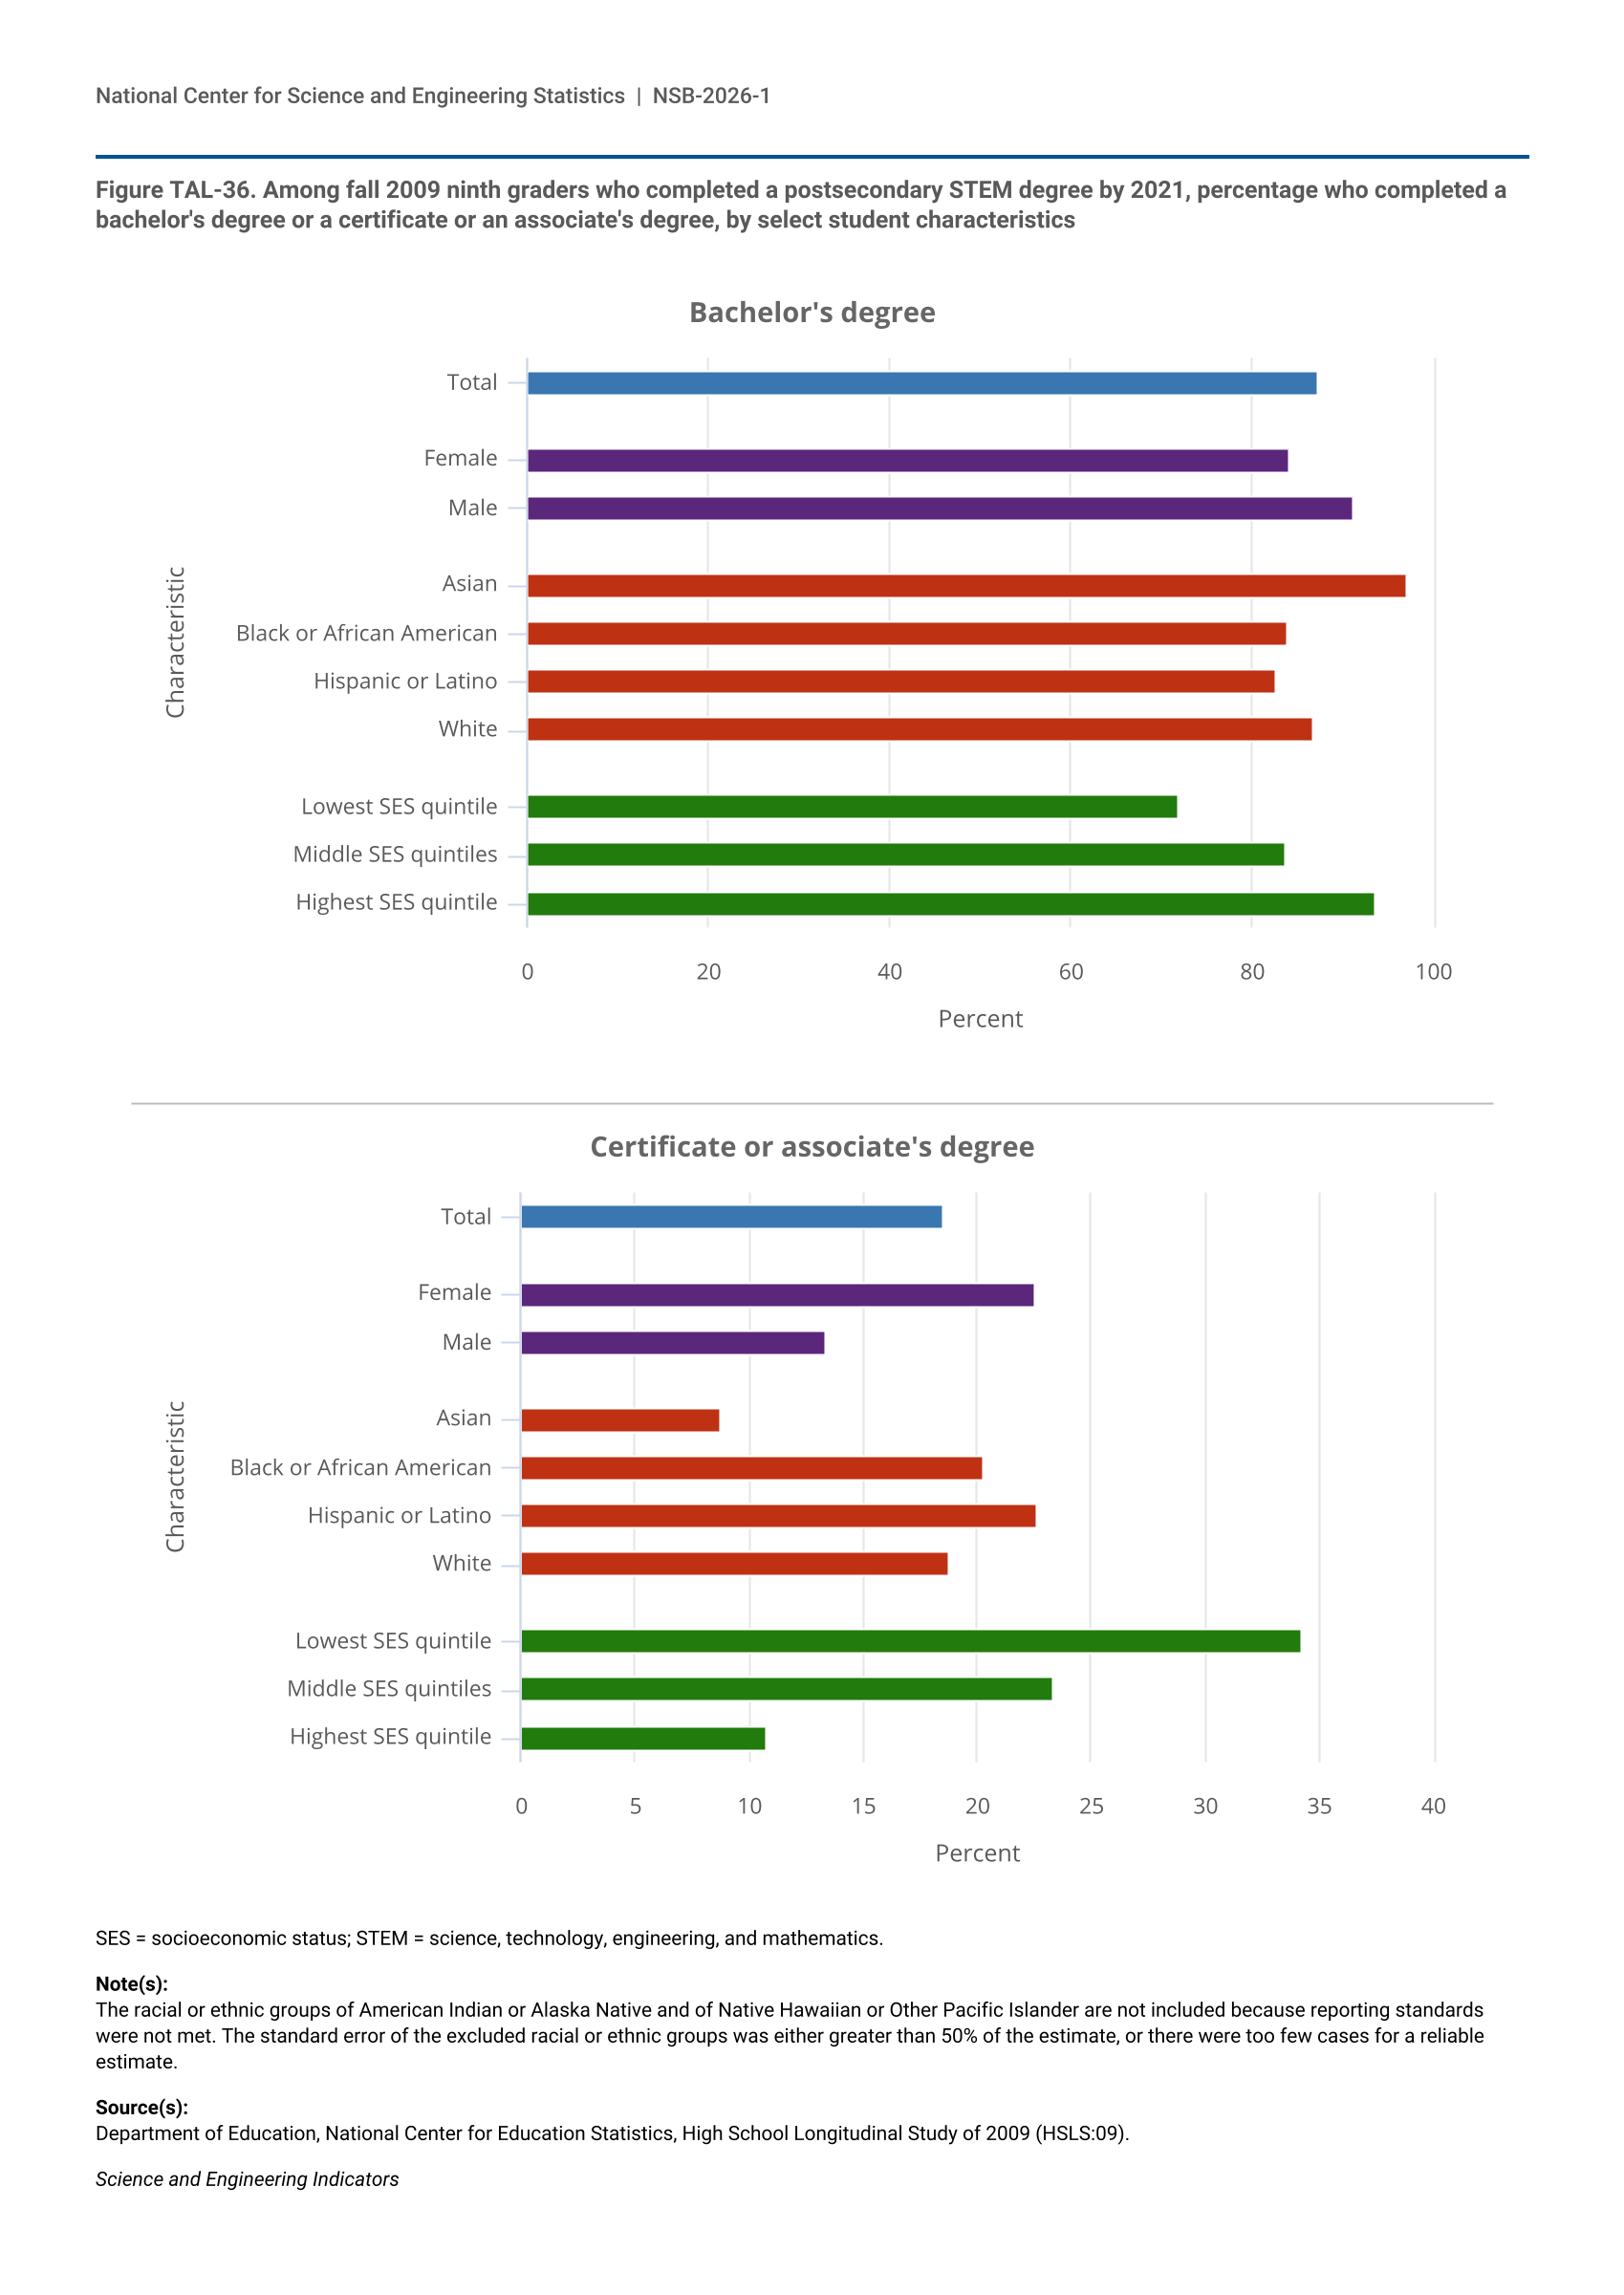
15 SES is indicated by a student’s SES index score, which ranges from 0 to 9. Scores are categorized as Low SES (0–2), Middle SES (3–6), and High SES (7–9). Before 2024, a student’s eligibility for the National School Lunch Program (NSLP) was used in NAEP assessments as a proxy variable to measure SES. In 2024, NAEP introduced a more comprehensive measure of SES comprising four components: (1) the student’s NSLP eligibility status, (2) the percentage of students eligible for NSLP at the school the student is attending, (3) the number of books at the student’s home, and (4) the highest level of education of either parent.
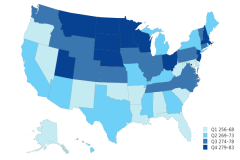
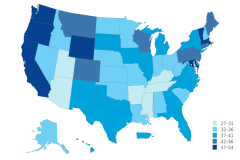
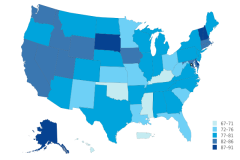
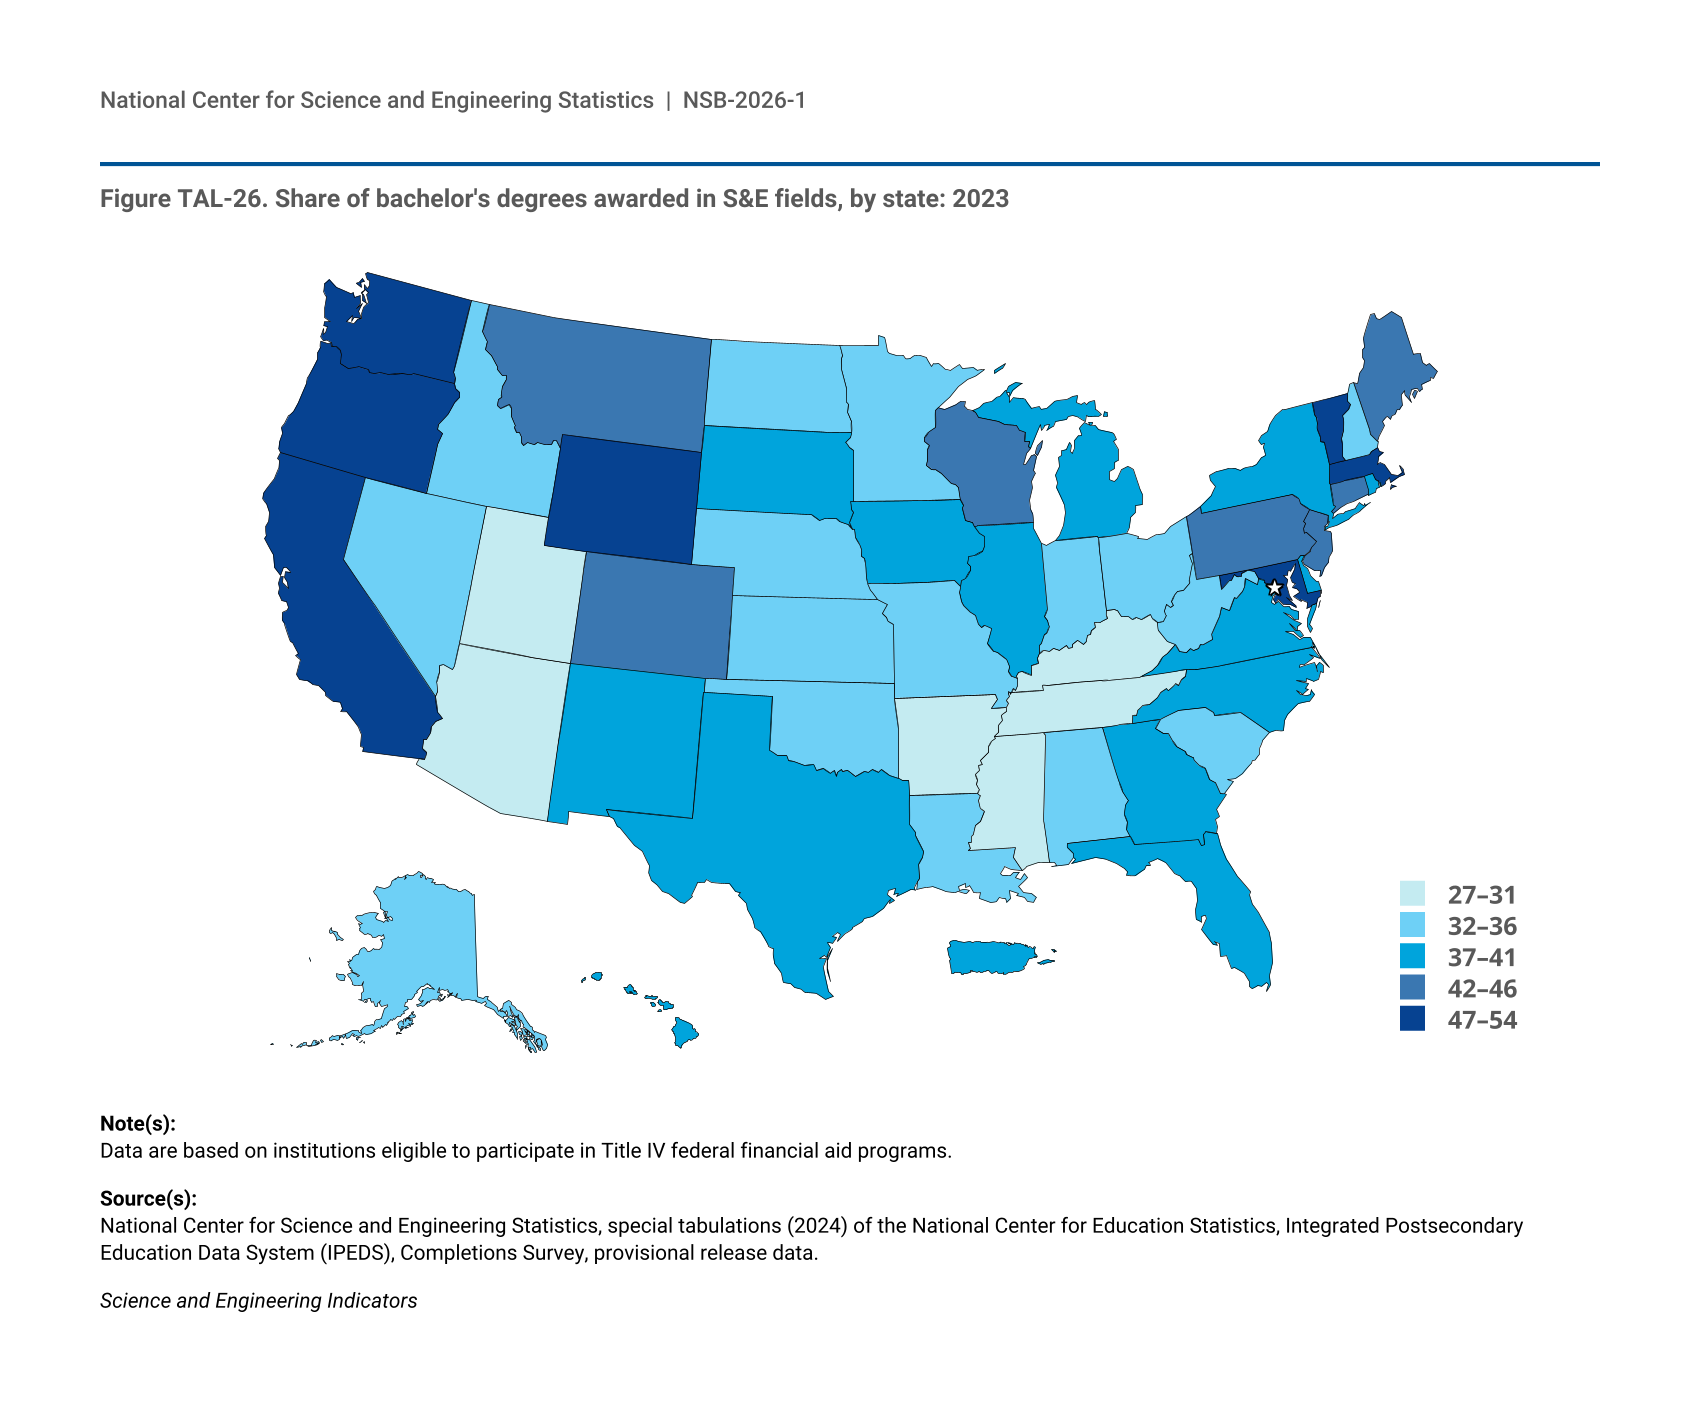
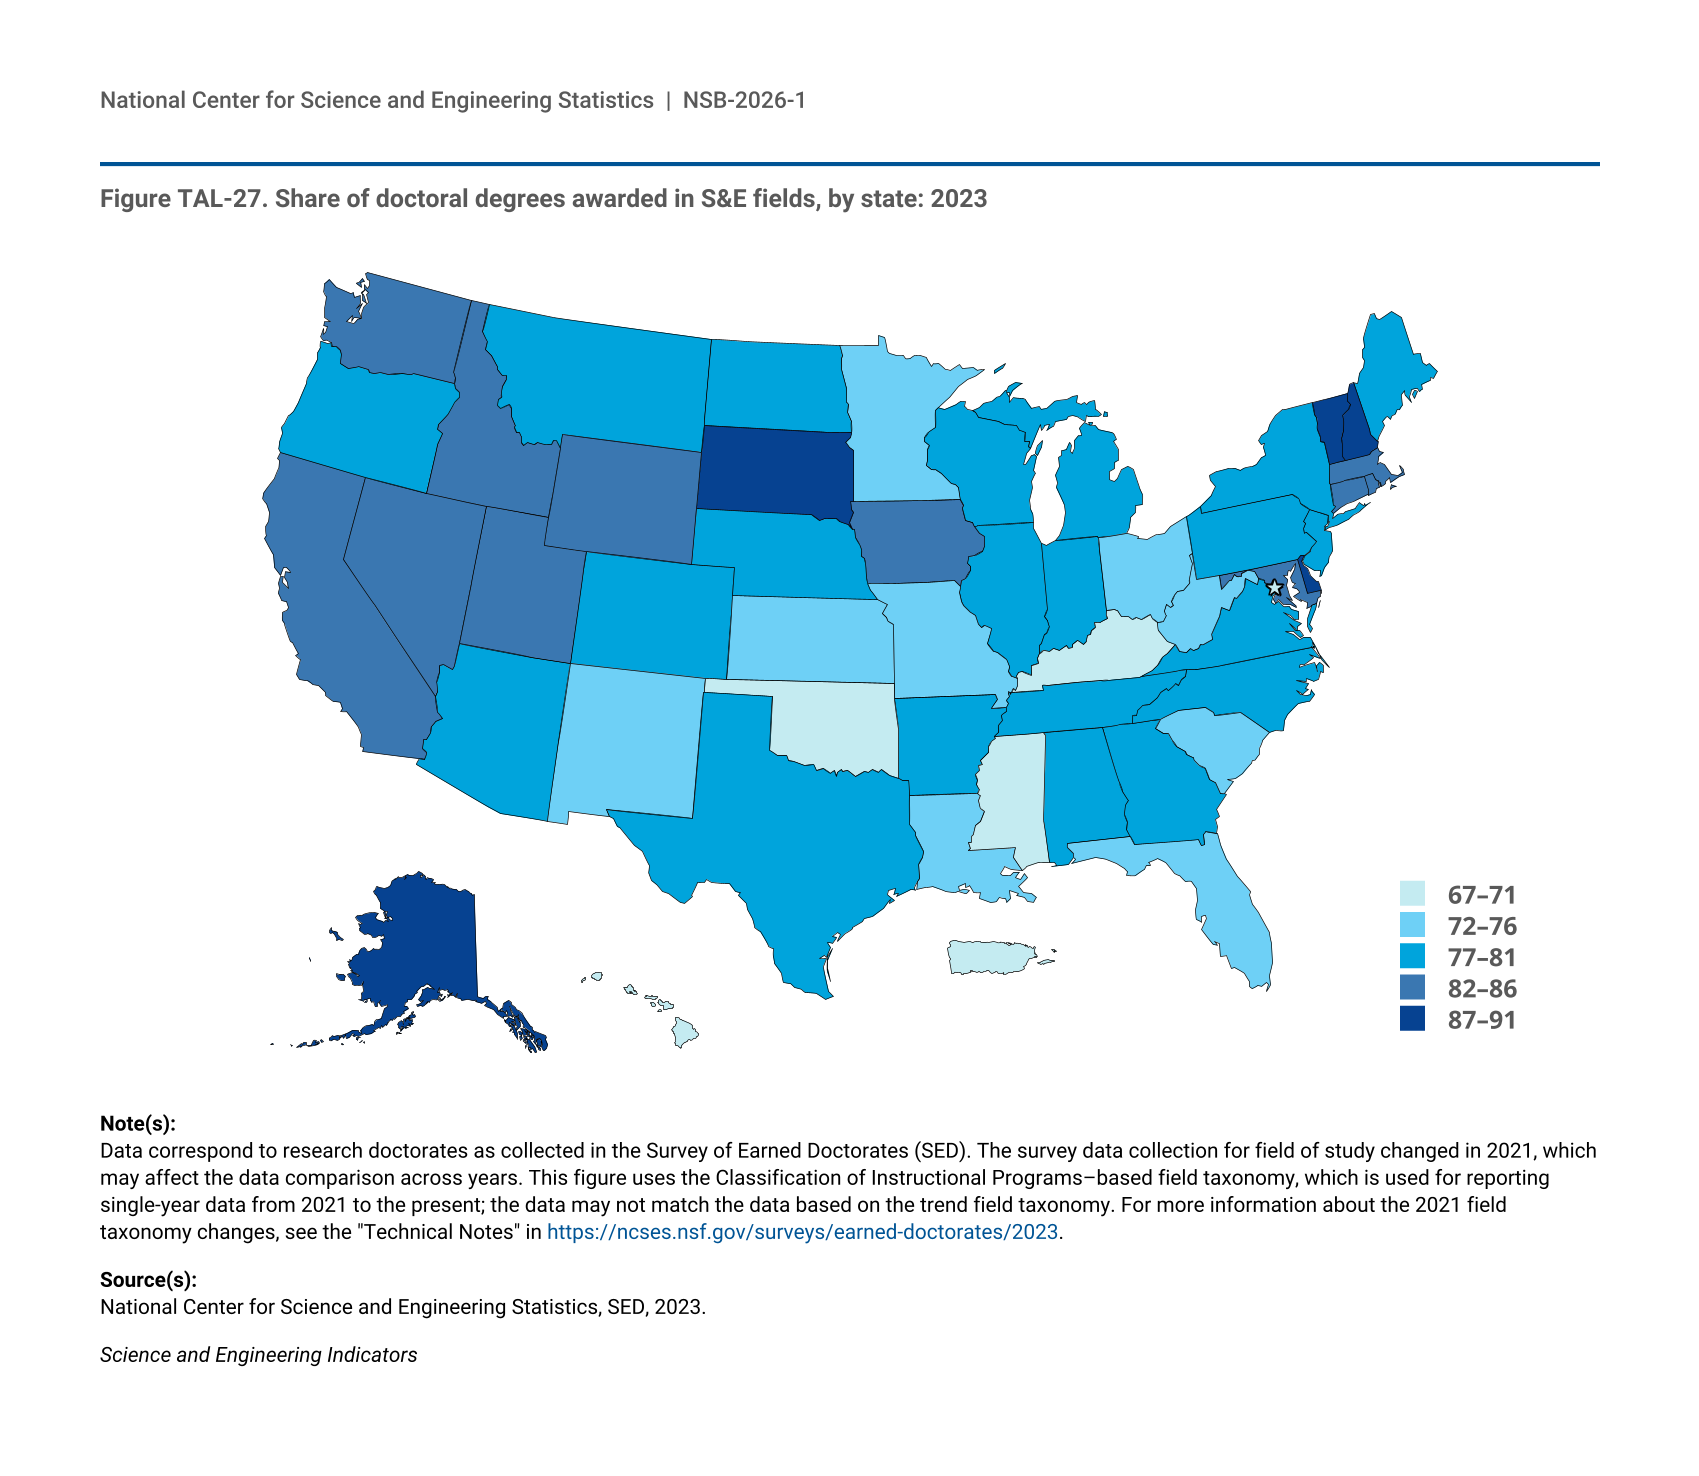
16 Starting with the Indicators 2024 report “Higher Education in Science and Engineering” (NSB 2023), the degree data from the Integrated Postsecondary Education Data System (IPEDS) are classified into the National Center for Science and Engineering Statistics (NCSES) Taxonomy of Disciplines, which aggregates fields of study into S&E, S&E-related, and non-S&E field areas. The numbers of S&E-related fields vary considerably by degree level, with the greatest differences observed at lower degree levels; for more details, see (NSB 2023: Revisions to Classification of IPEDS Degree Data under the NCSES Taxonomy of Disciplines). This section starts by presenting data on S&E and S&E-related fields but focuses on S&E fields when looking at differences by state. At the doctoral level, data in this report come from the Survey of Earned Doctorates, a census of all research doctoral degrees awarded in the United States; for the doctoral-level data, S&E-related fields are included under S&E.
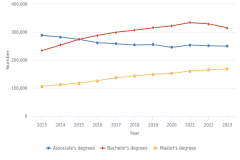
17 According to the U.S. Census Bureau, the U.S. population ages 18–24 years declined by 3% between 2013 and 2023, and the population ages 25–34 years increased by 6% during this period (Census Bureau 2024, 2025a).
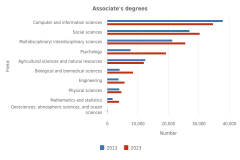
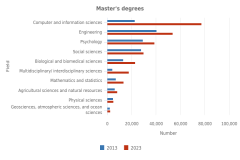
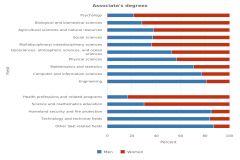
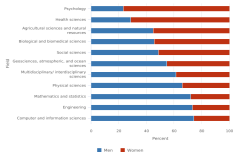
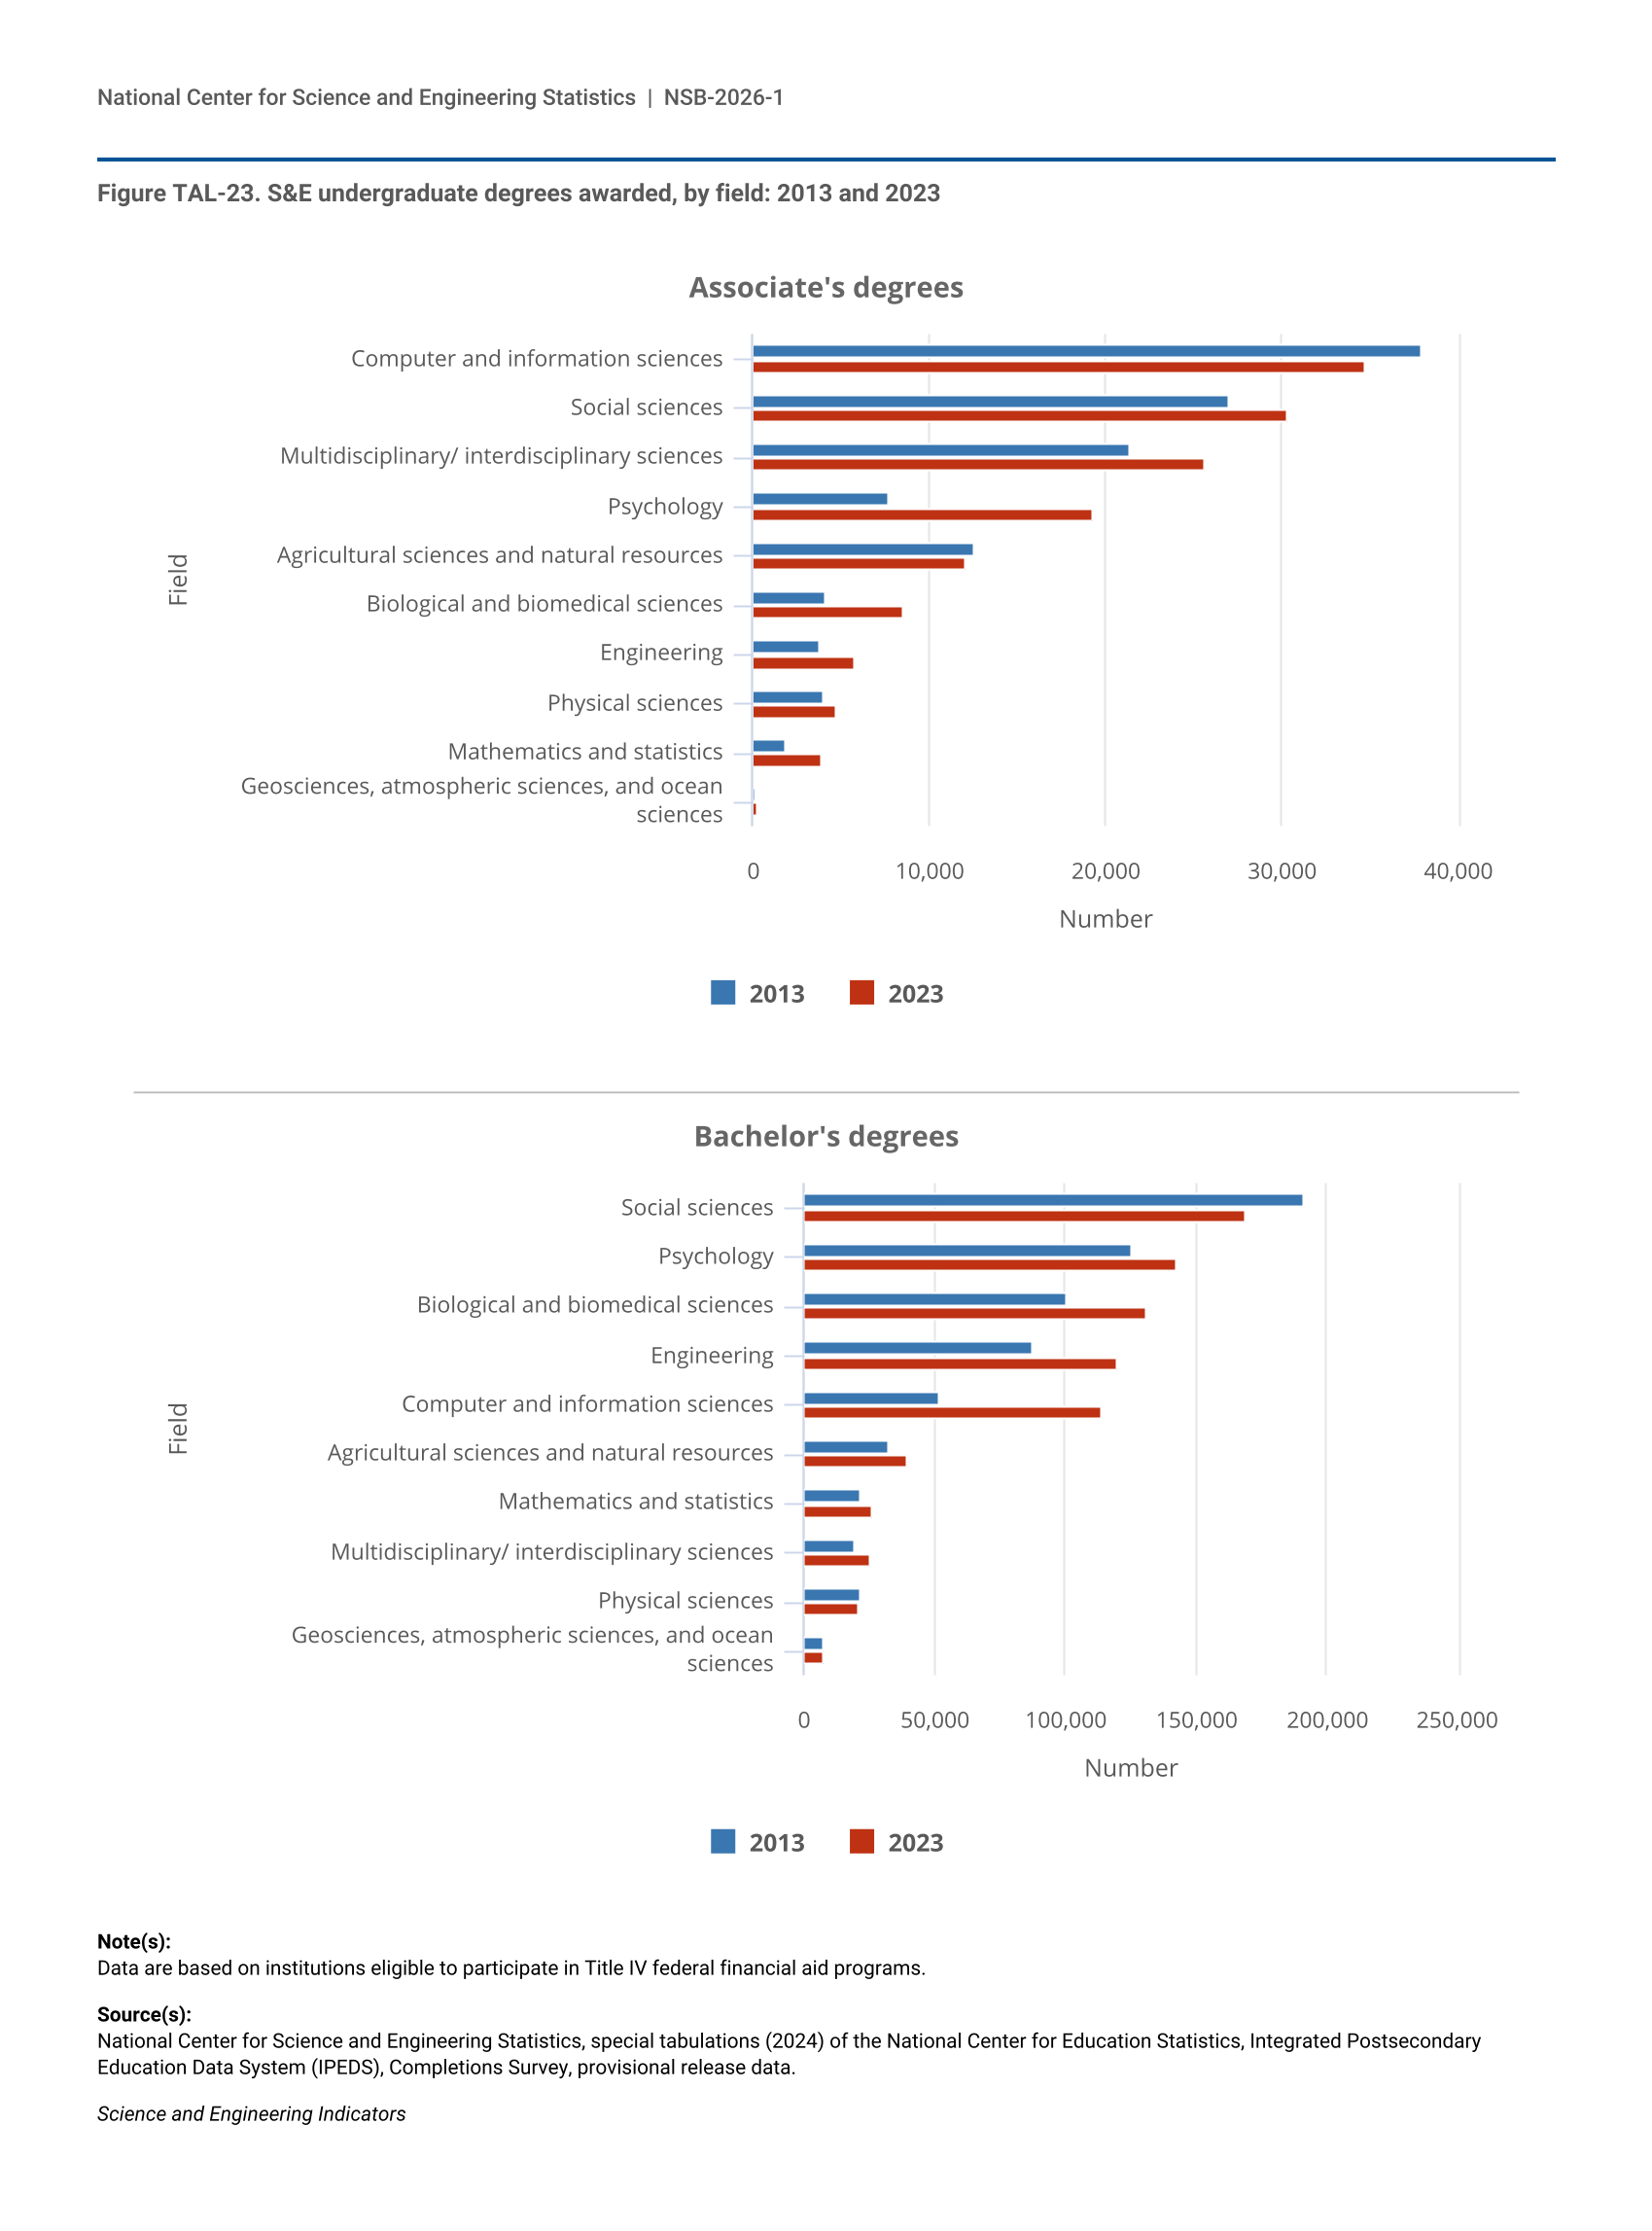
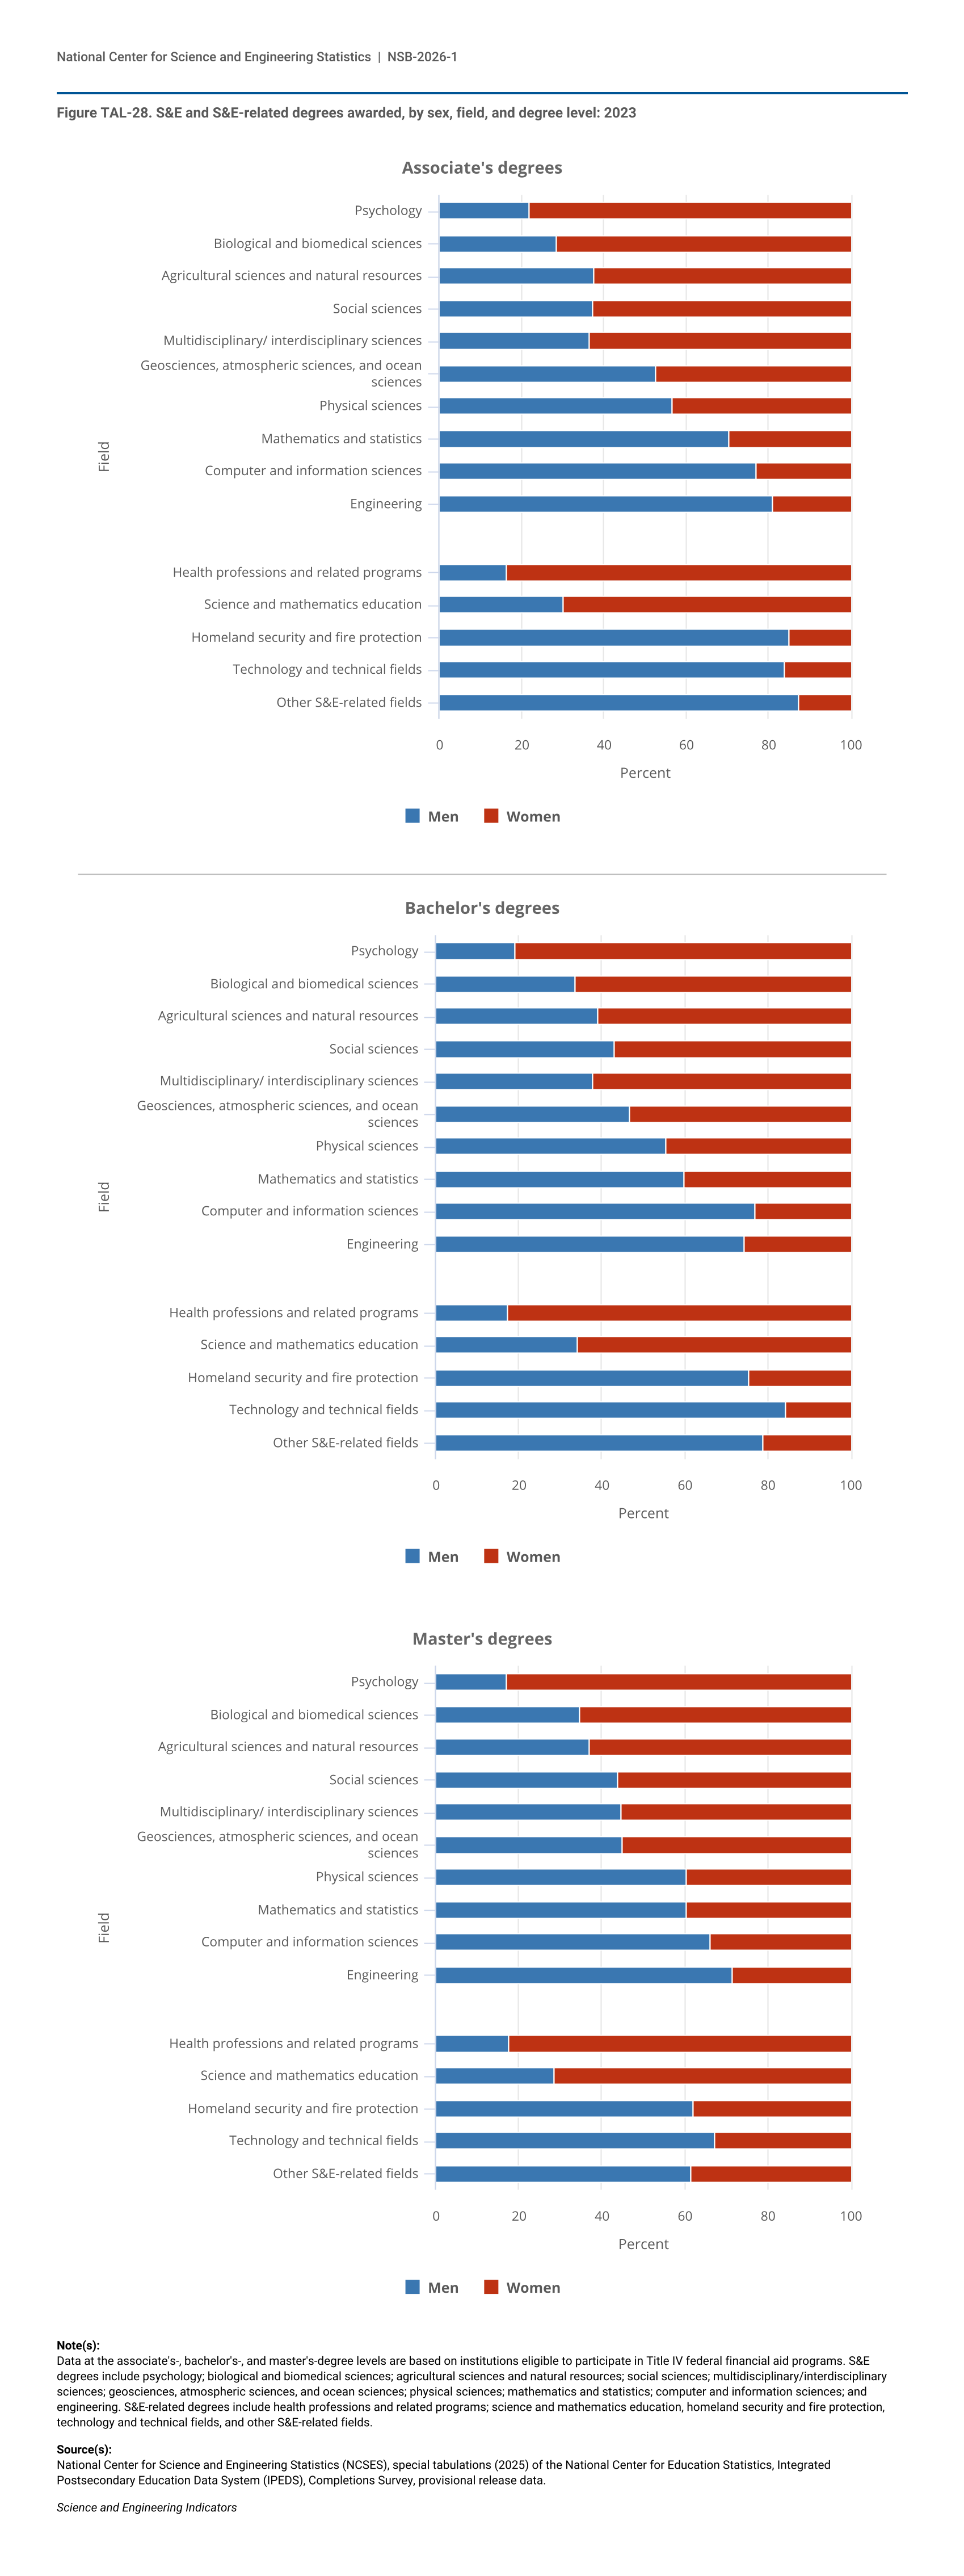
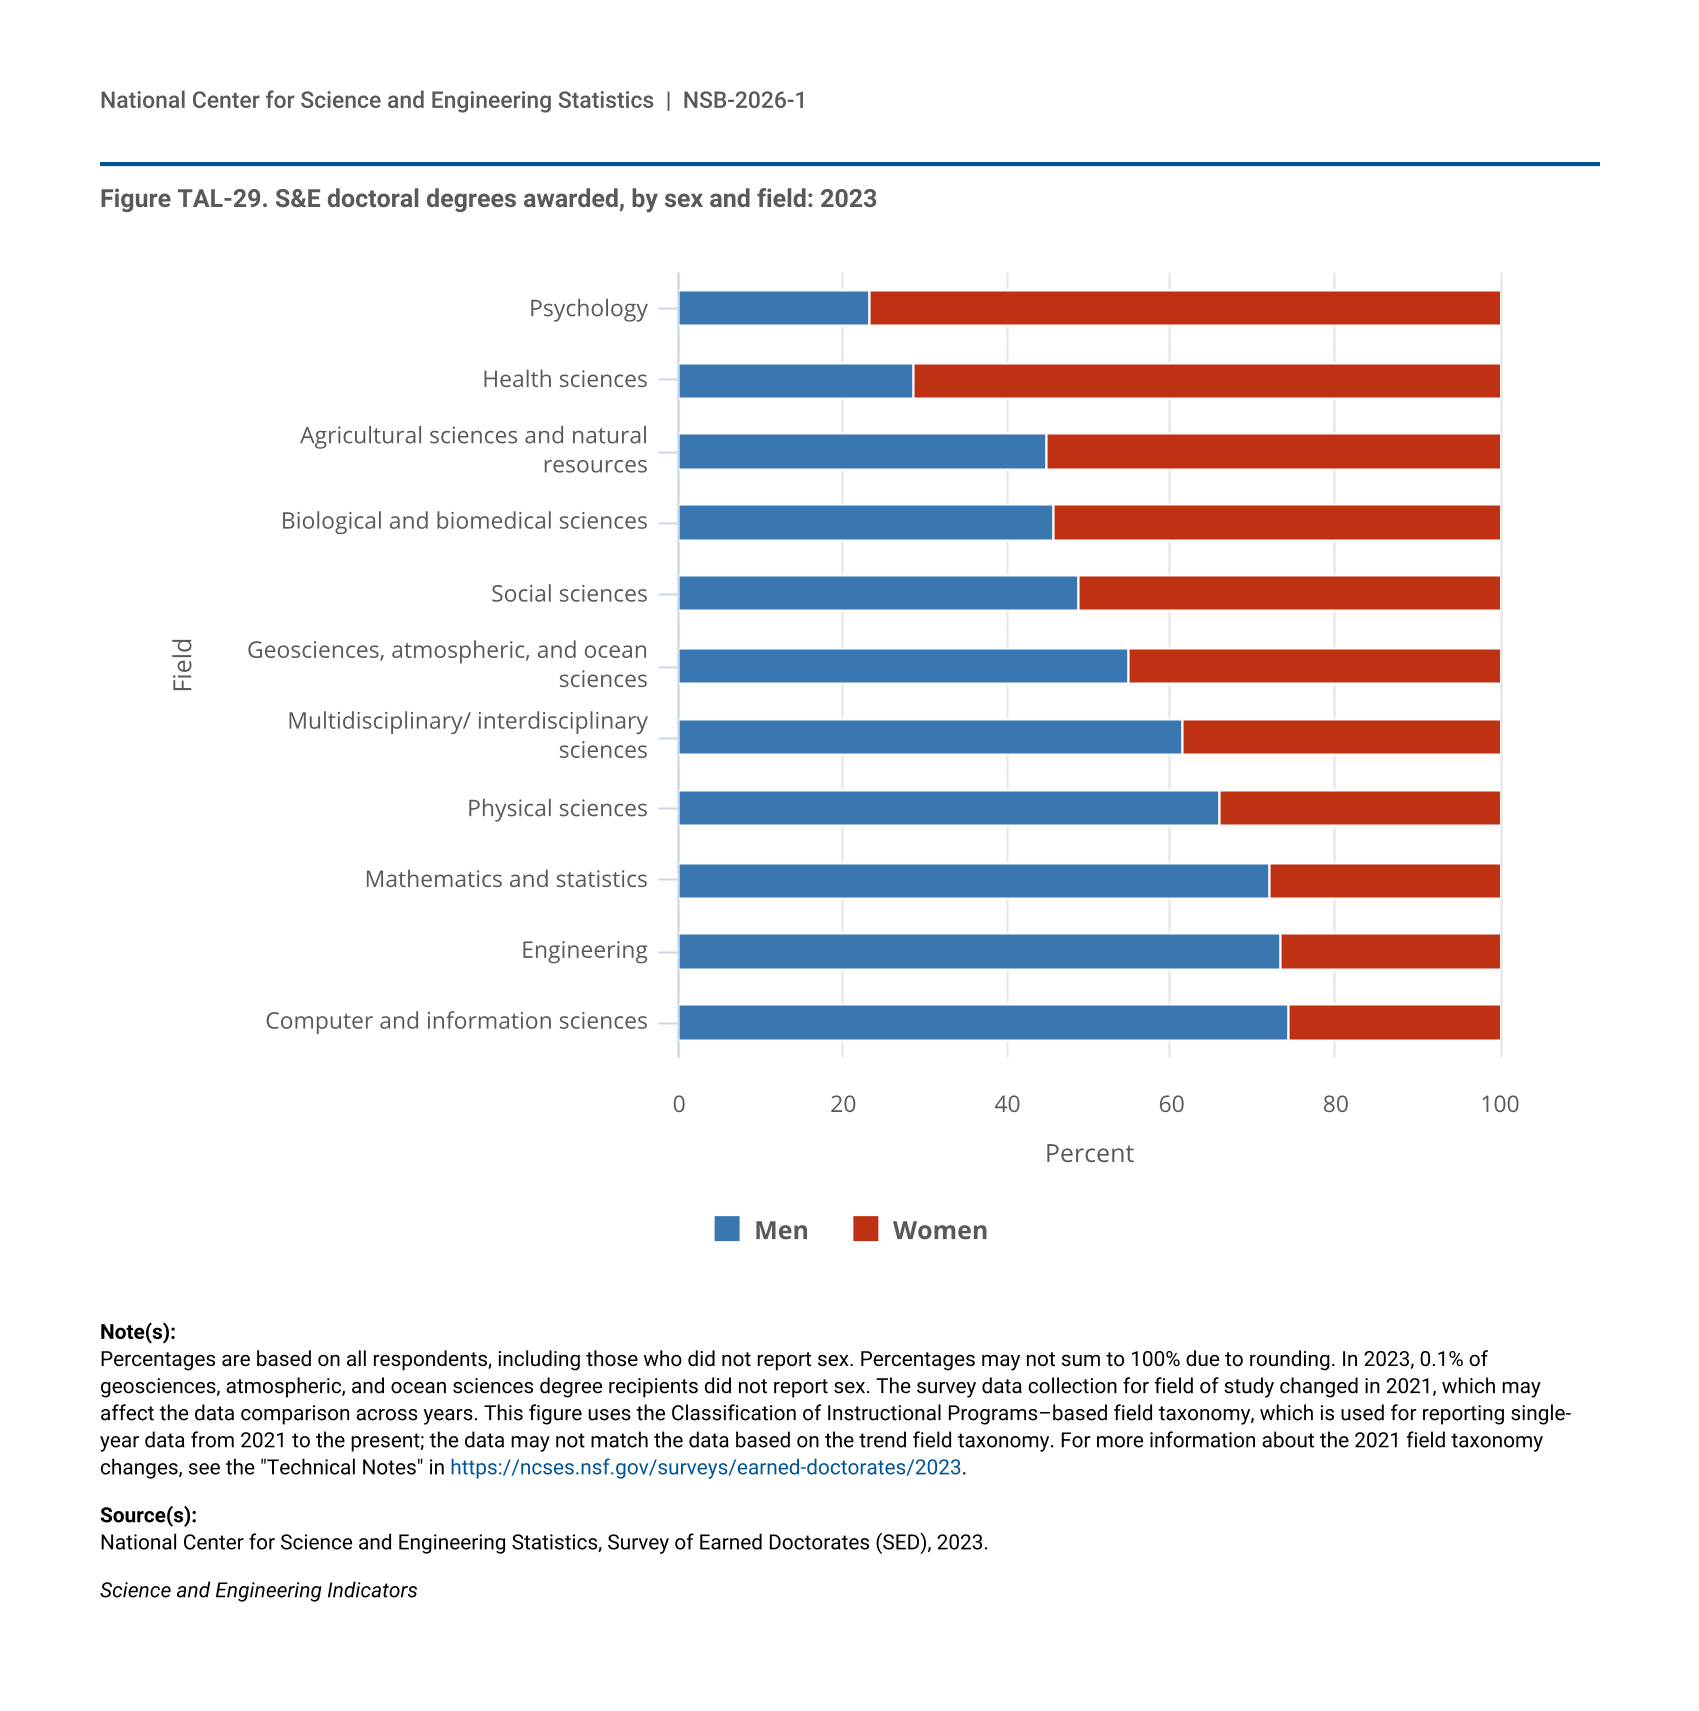
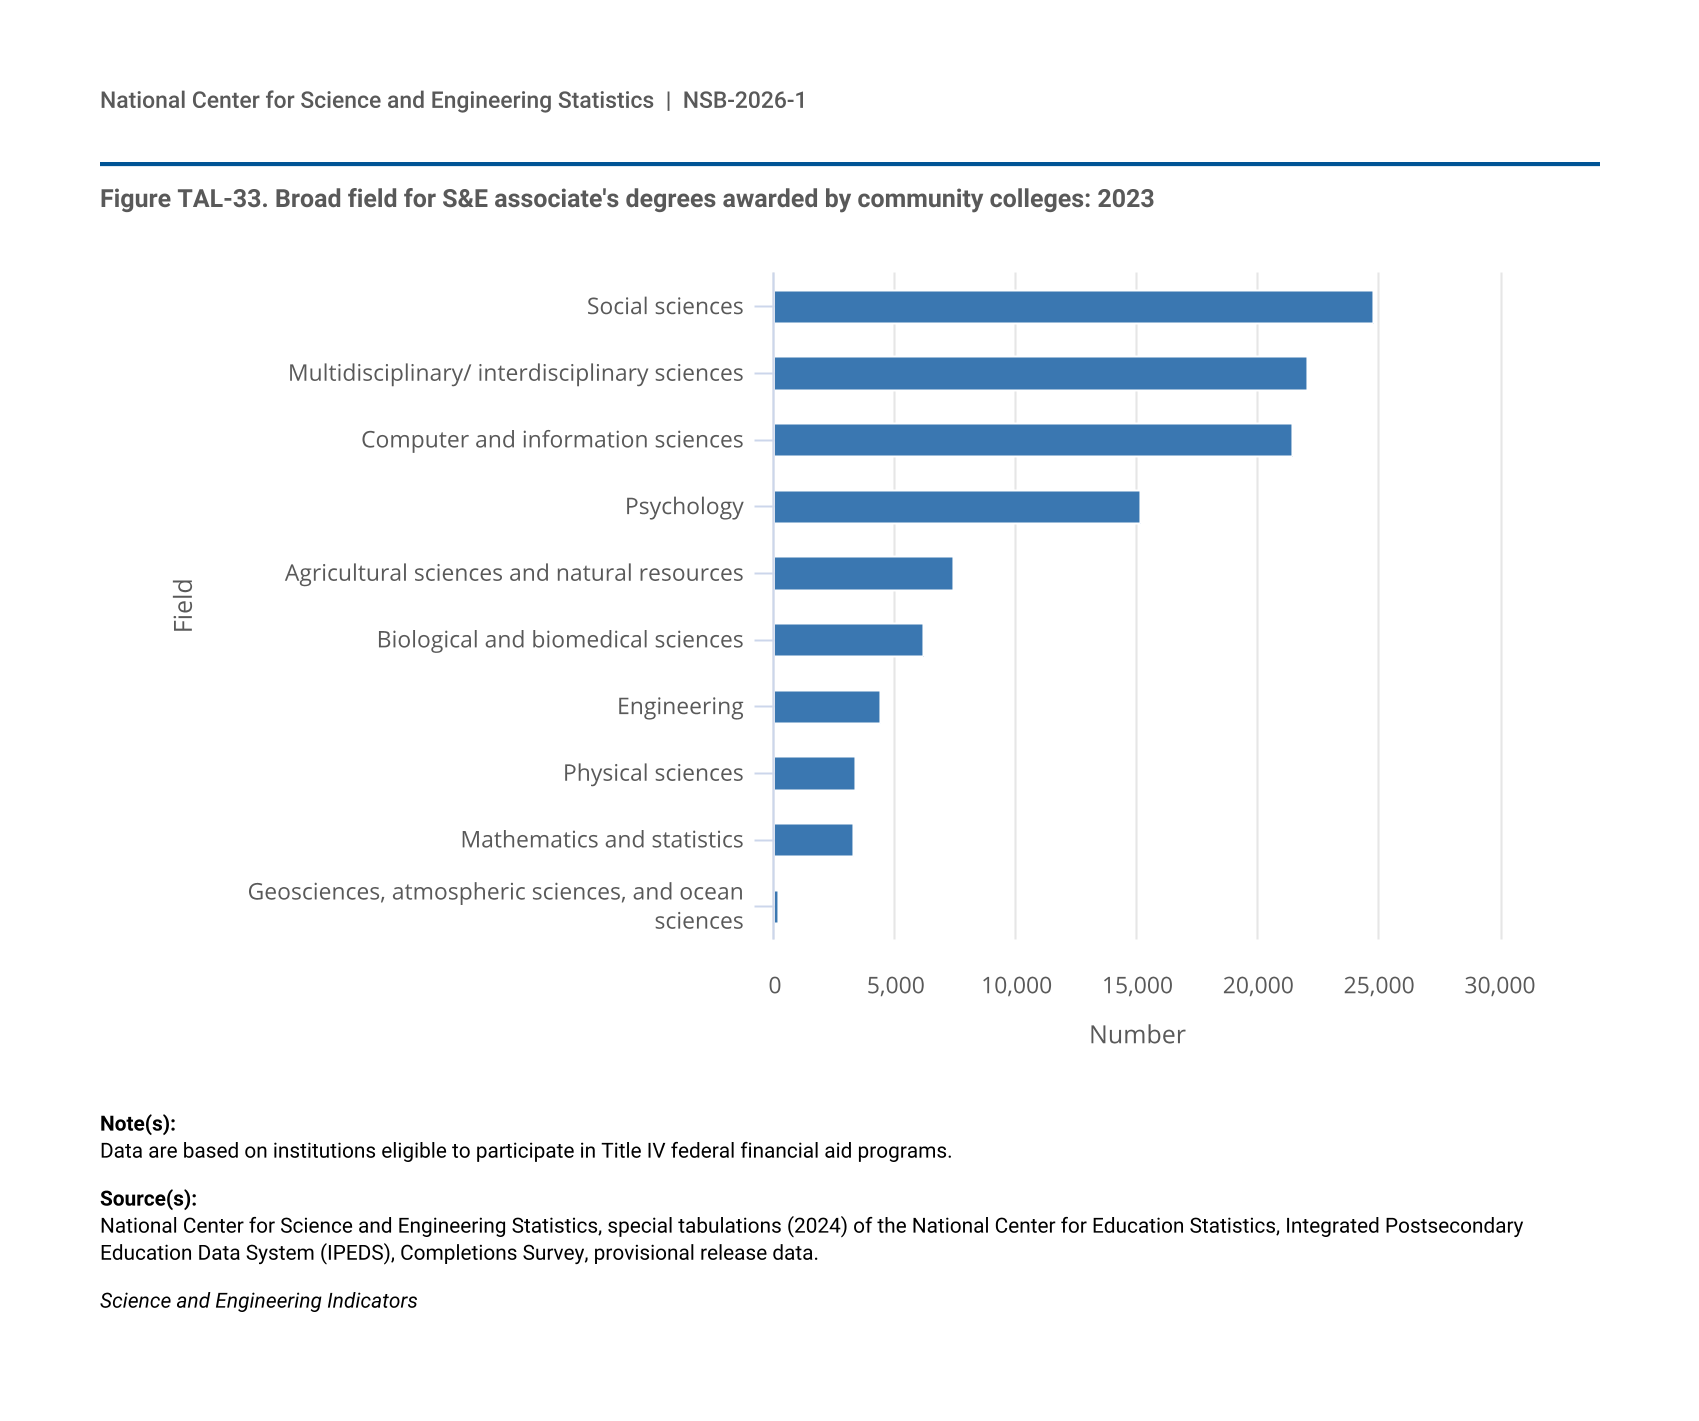
18 The multidisciplinary/interdisciplinary sciences field includes the following fields of study: interdisciplinary computer science; behavioral and cognitive sciences; computational science and engineering; data analytics; history and philosophy of science, technology, and society; nutrition science; and multidisciplinary fields not elsewhere classified.
19 S&E degrees discussed here are categorized by institution location and include postsecondary degrees awarded to all students, regardless of their residence or where they earned a high school credential.
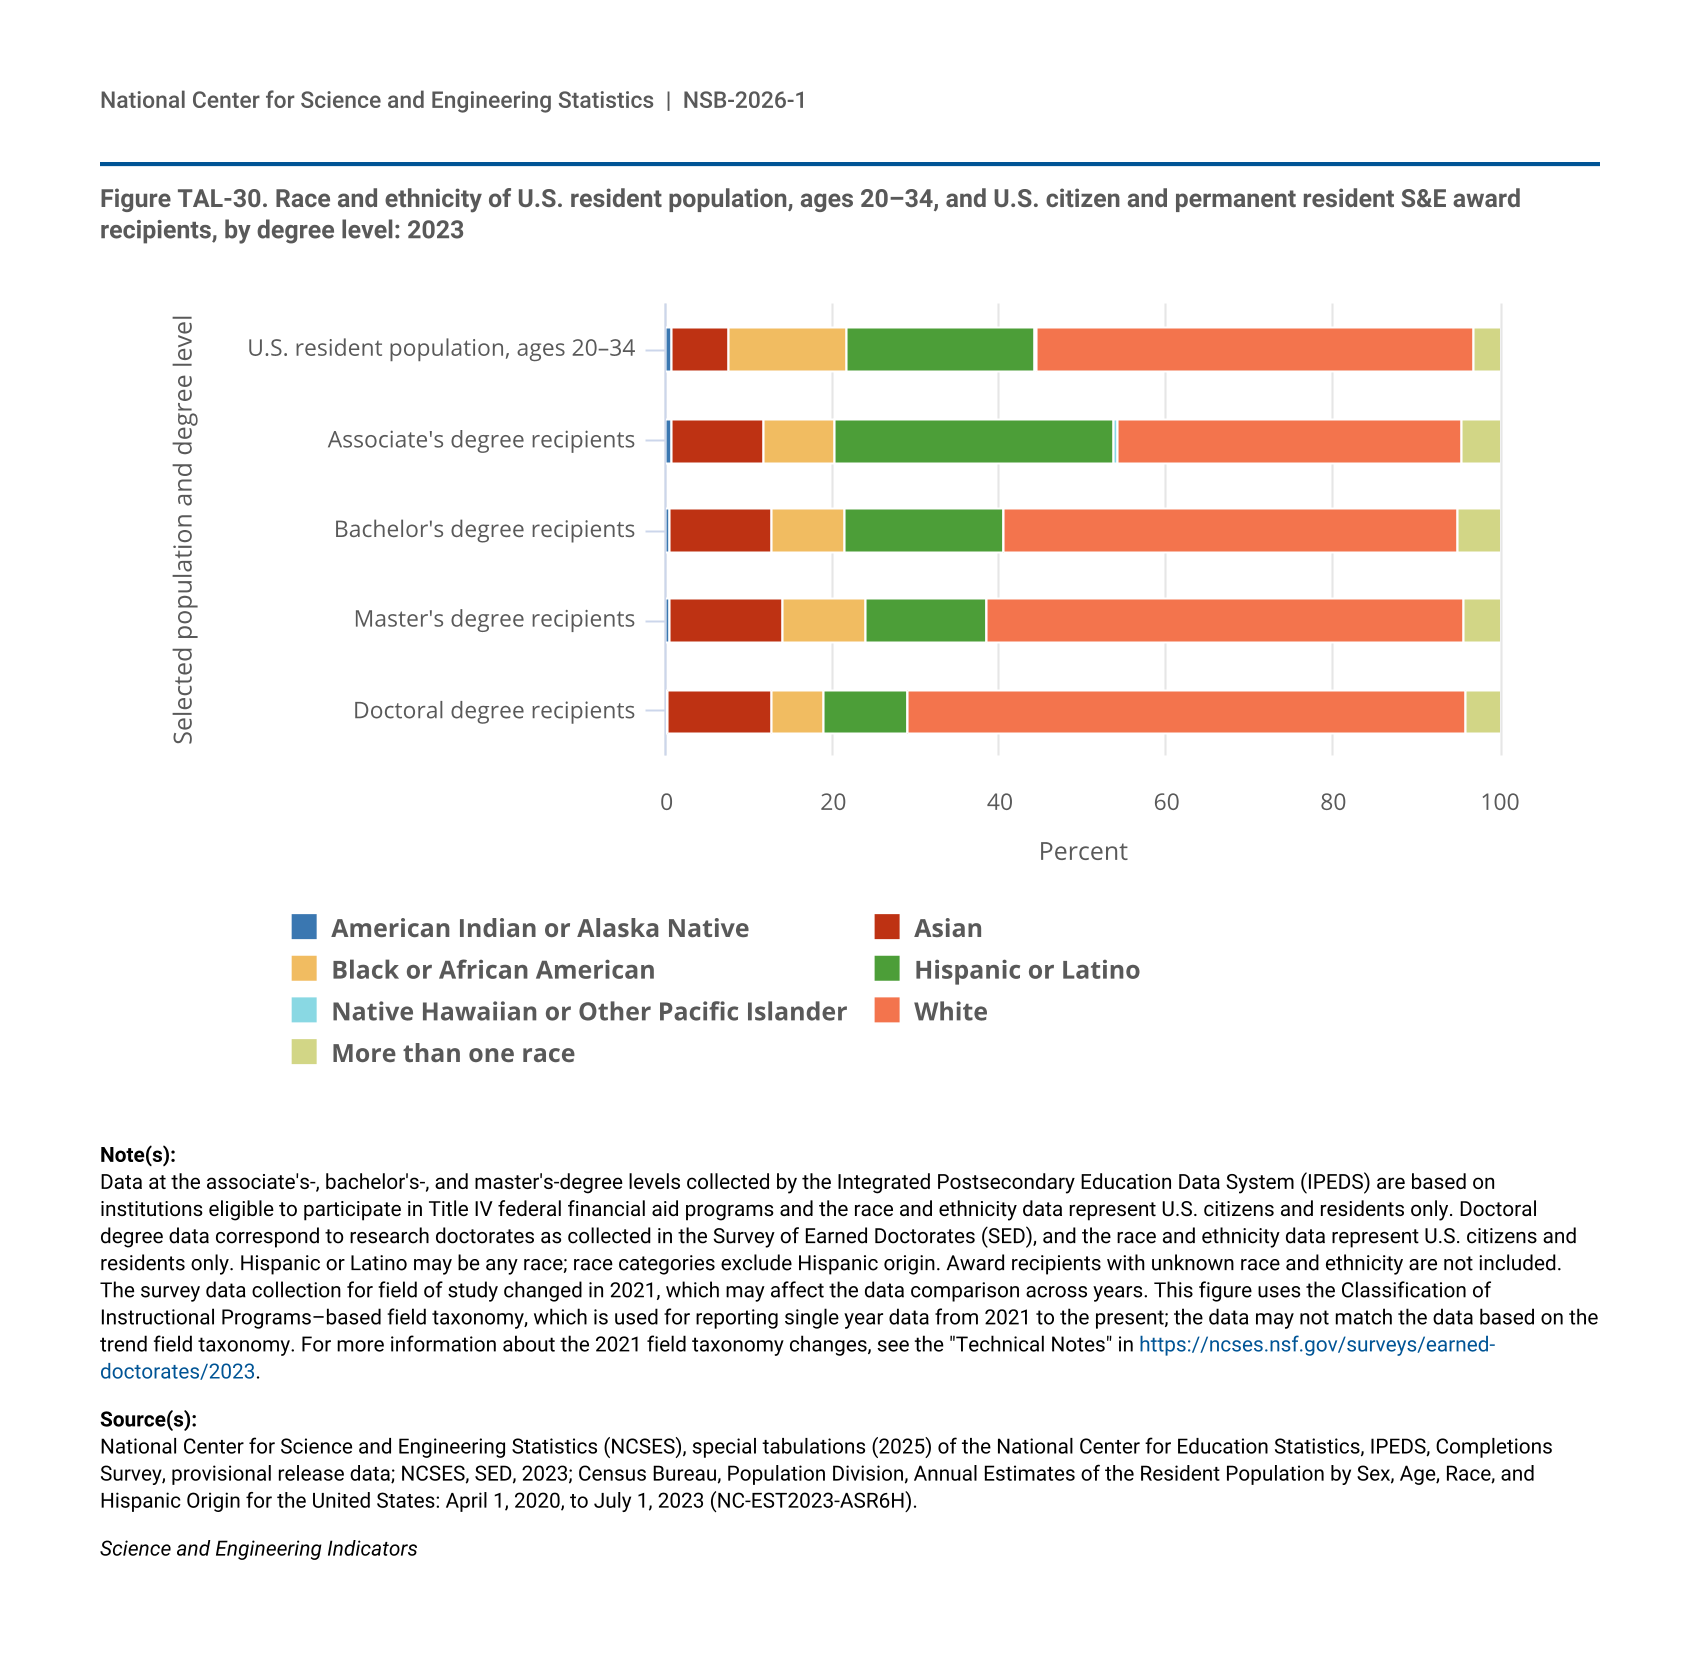
20 In 2023, a total of 5,703 S&E doctoral degrees were awarded in California, and 3,495 were awarded in Texas. In contrast, 32 S&E doctoral degrees were awarded in Alaska, 104 in South Dakota, 171 in New Hampshire, and 237 in Delaware.
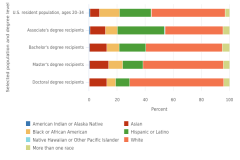
21 The comparisons are based on unrounded percentages. In 2023, the proportion of S&E bachelor’s degrees earned by Native Hawaiian or Other Pacific Islanders was 0.183781331830459 when unrounded, and their proportion in the 20- to 34-year-old U.S. population was 0.214033967008794.
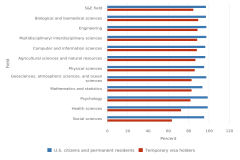
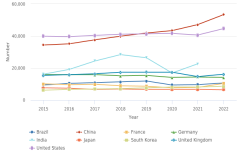
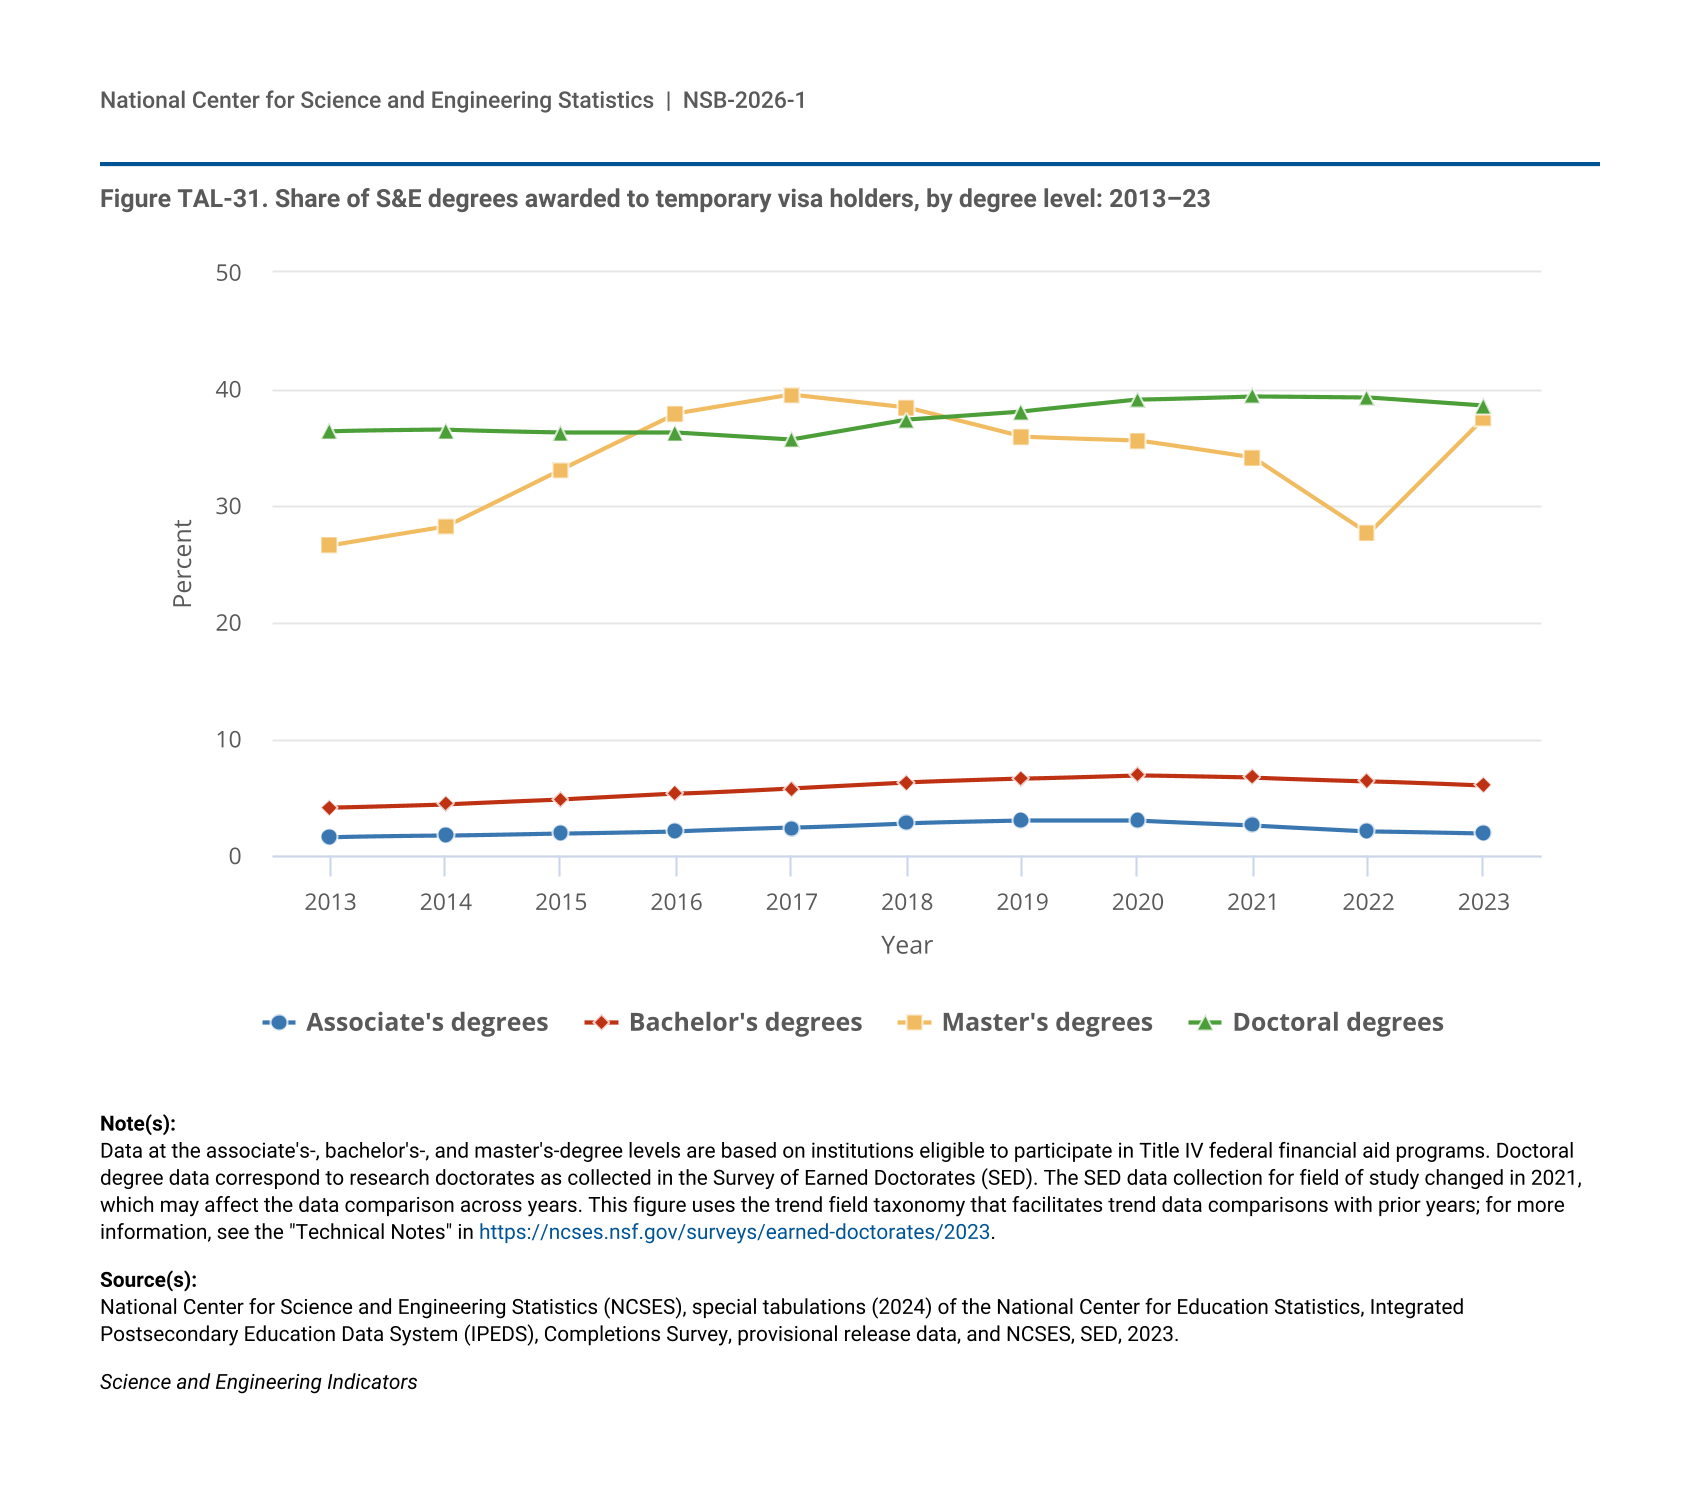
22 In 2023, 51% of U.S. S&E doctorate recipients on temporary visas were from China or India (for more details, see NCSES [2025a]).
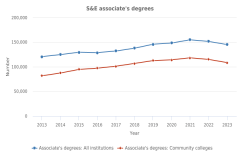
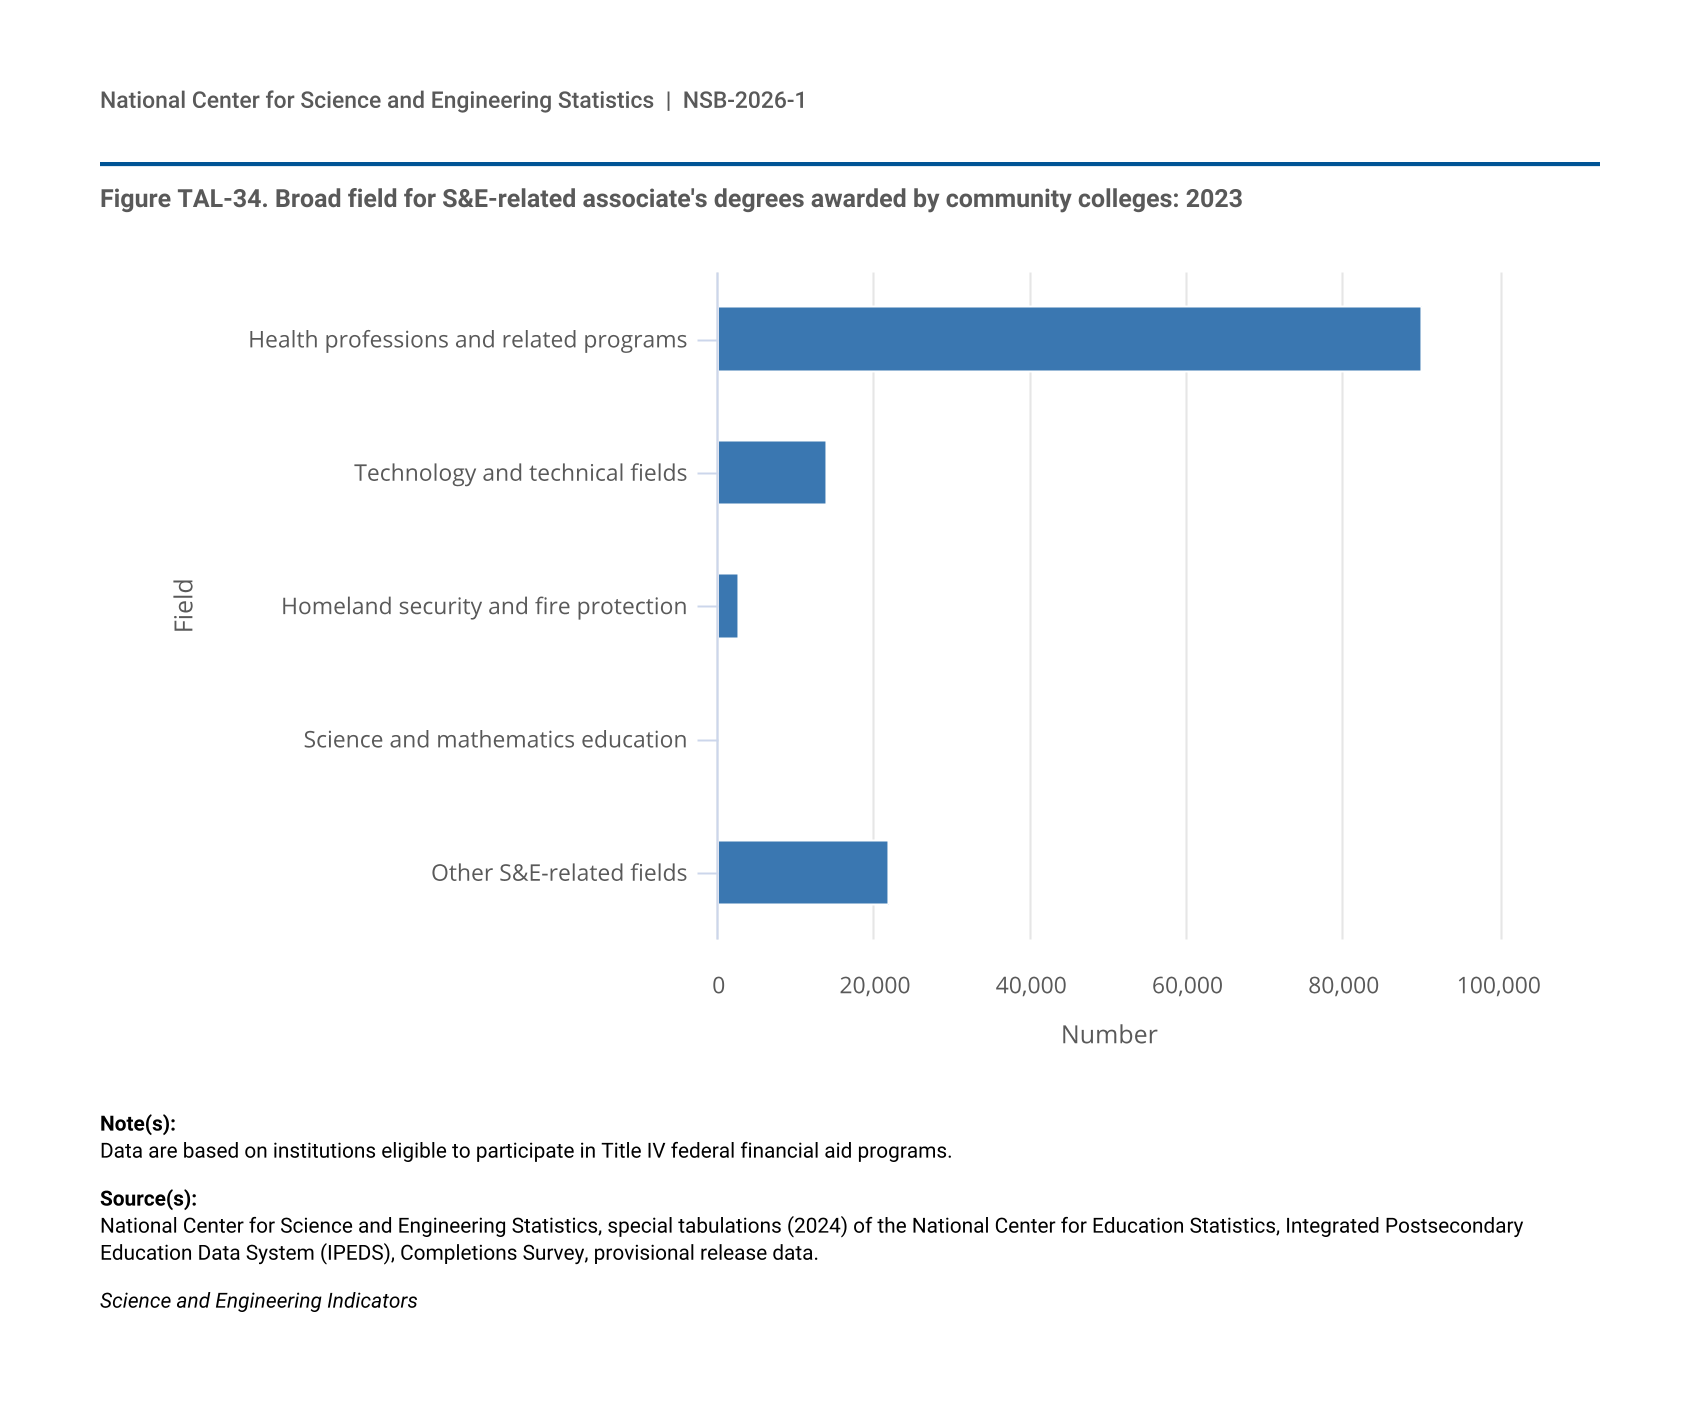
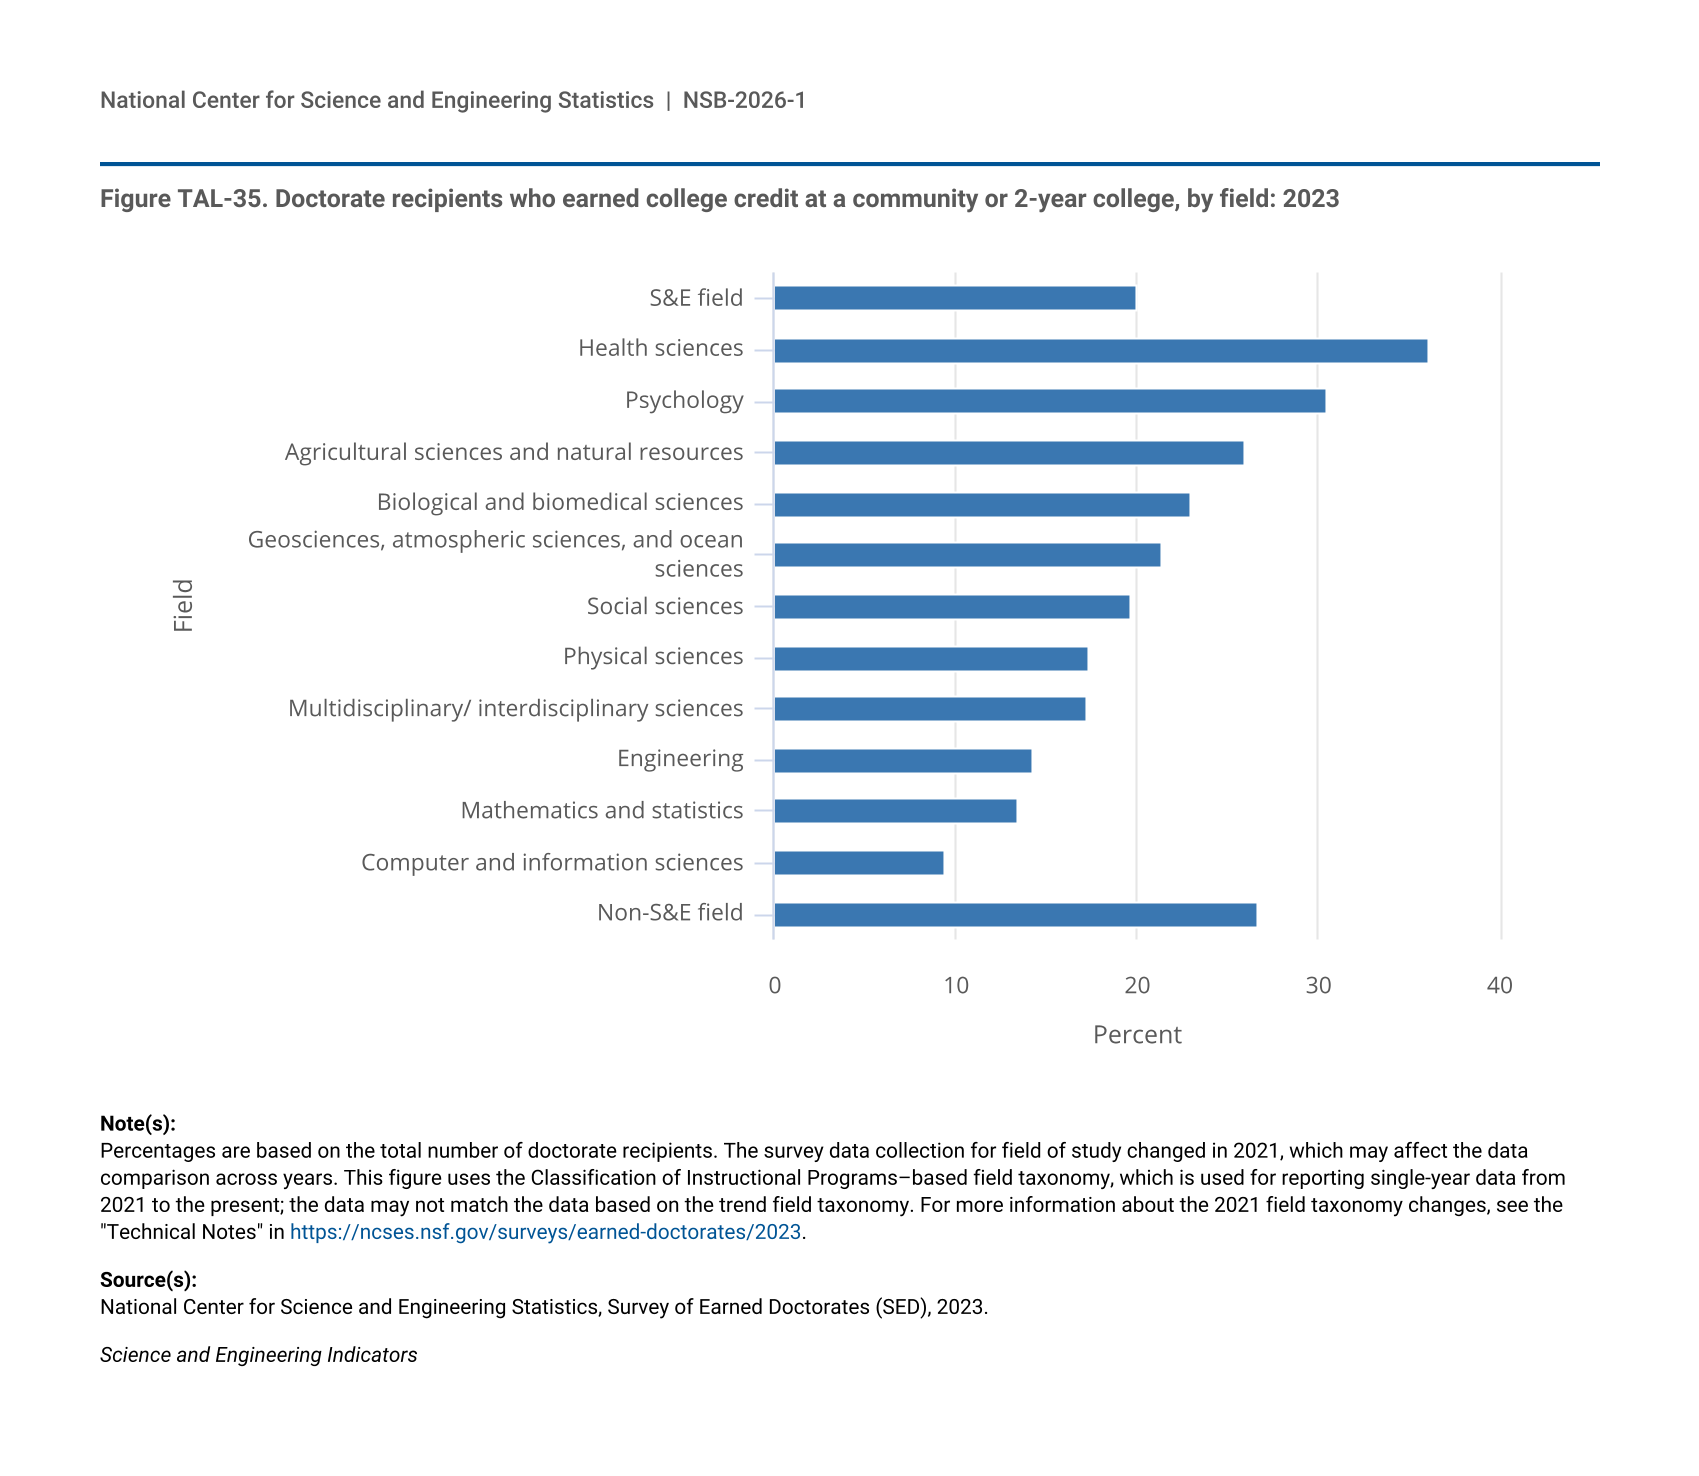
23 Community colleges are defined here as publicly controlled institutions that confer awards up to at least the 2-year level but less than the 4-year level. Community colleges primarily award associate's degrees and certificates below the bachelor's degree level.
24 All comparative statements derived from sample surveys in this report have undergone statistical testing; unless otherwise noted, all comparisons are statistically significant at the 0.10 significance level.
25 Respondents could have attended community college at more than one point in time.
26 For additional data on doctorate recipients who earned college credit at a community or 2-year college, see (NCSES SED 2023: Table 5-1).
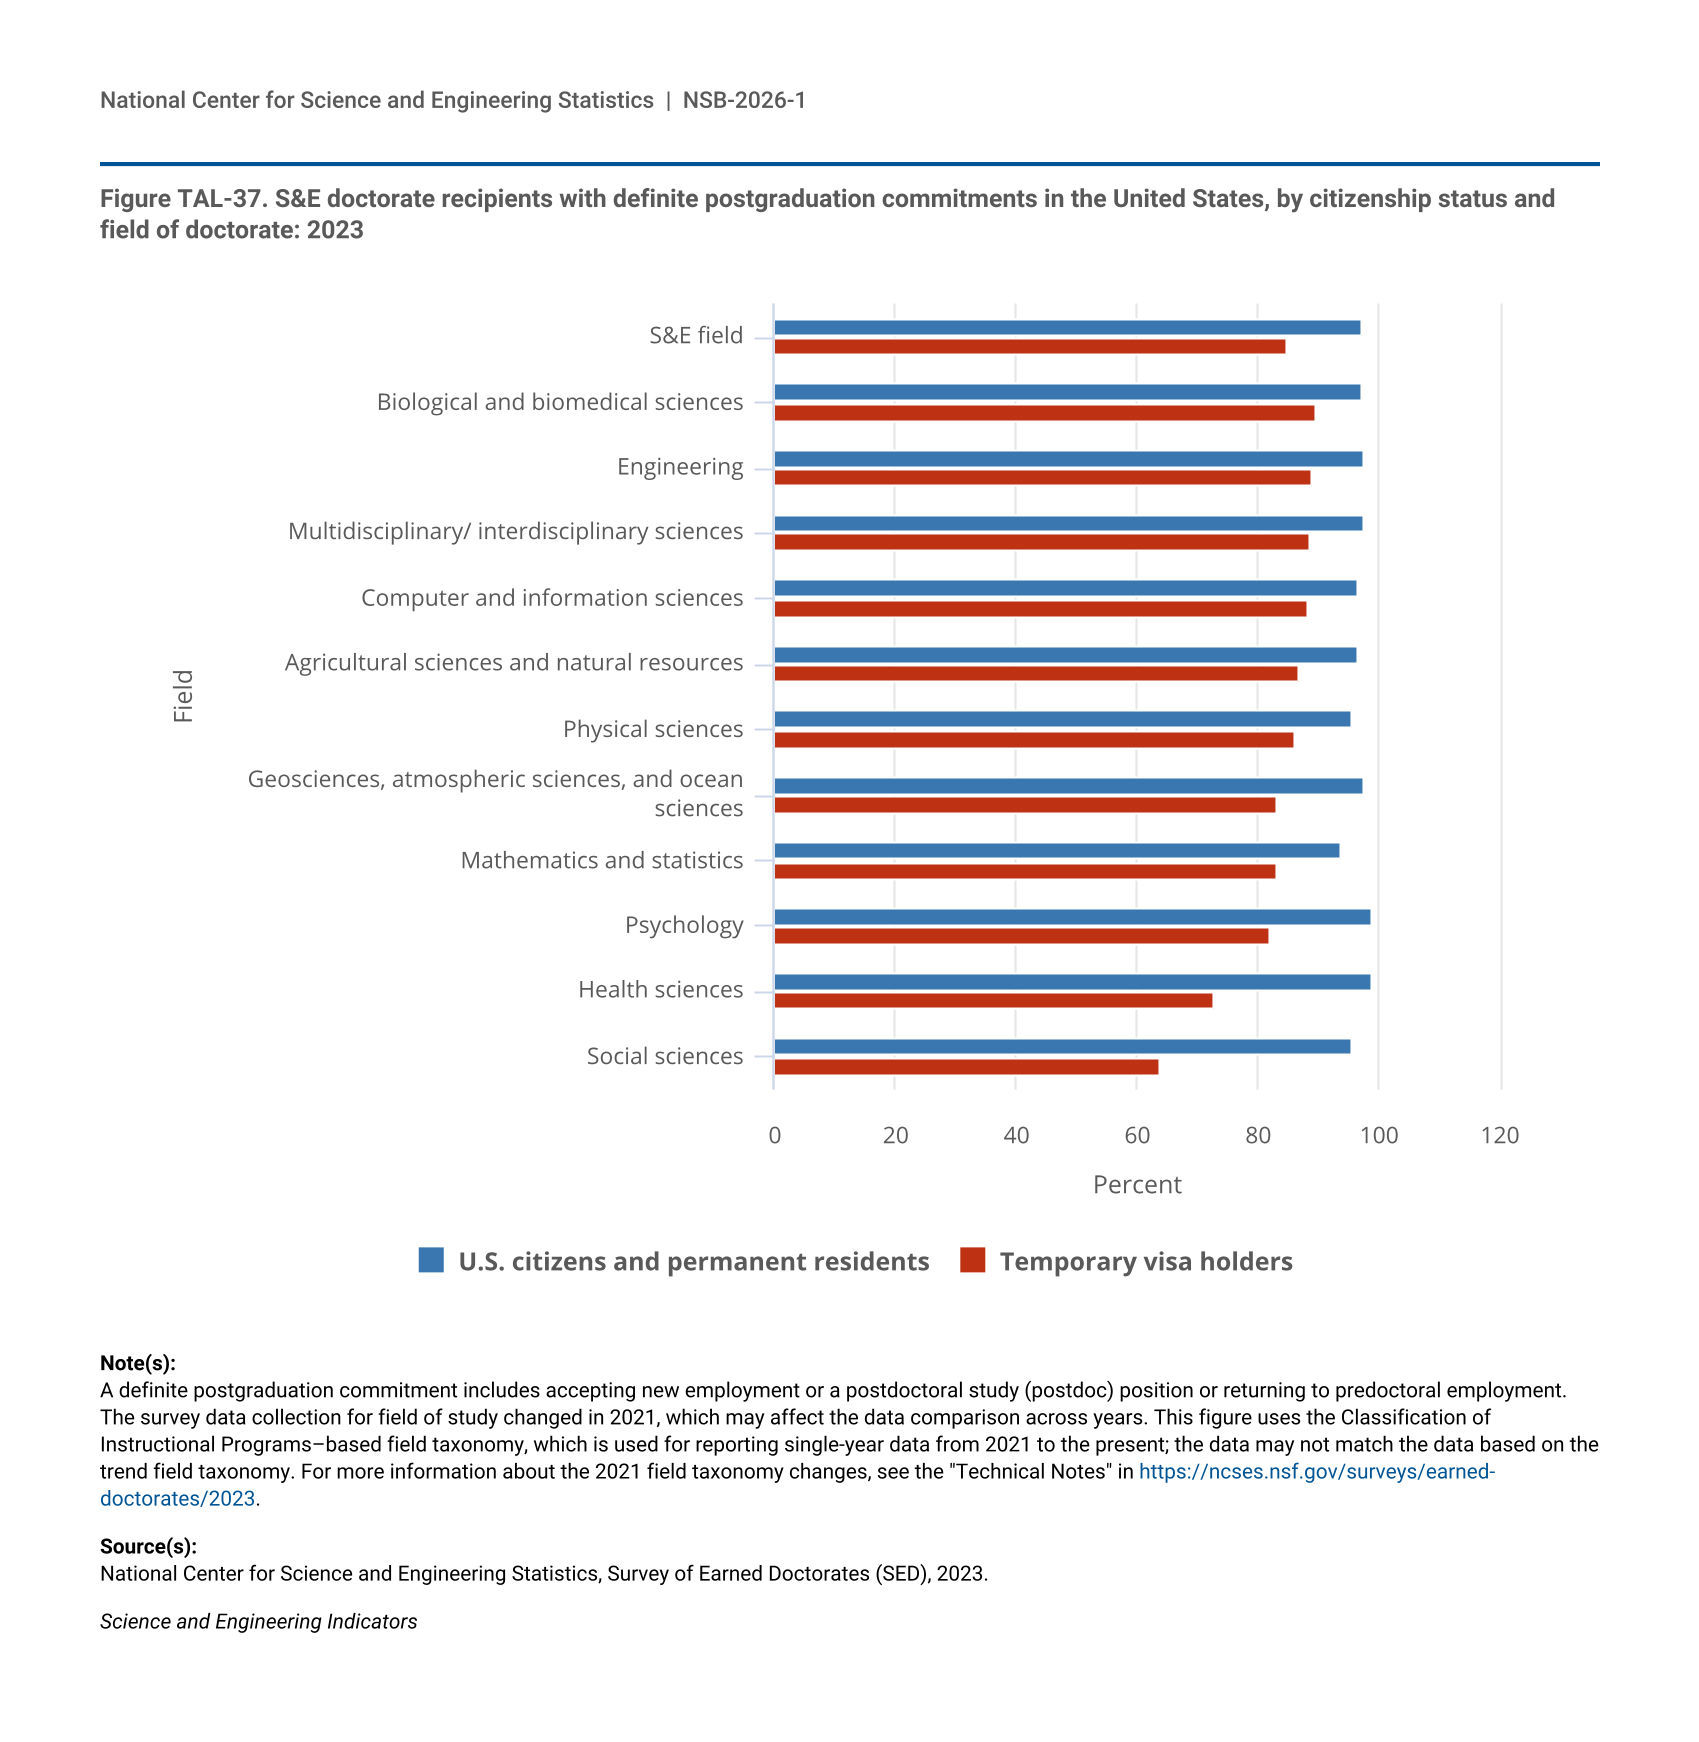
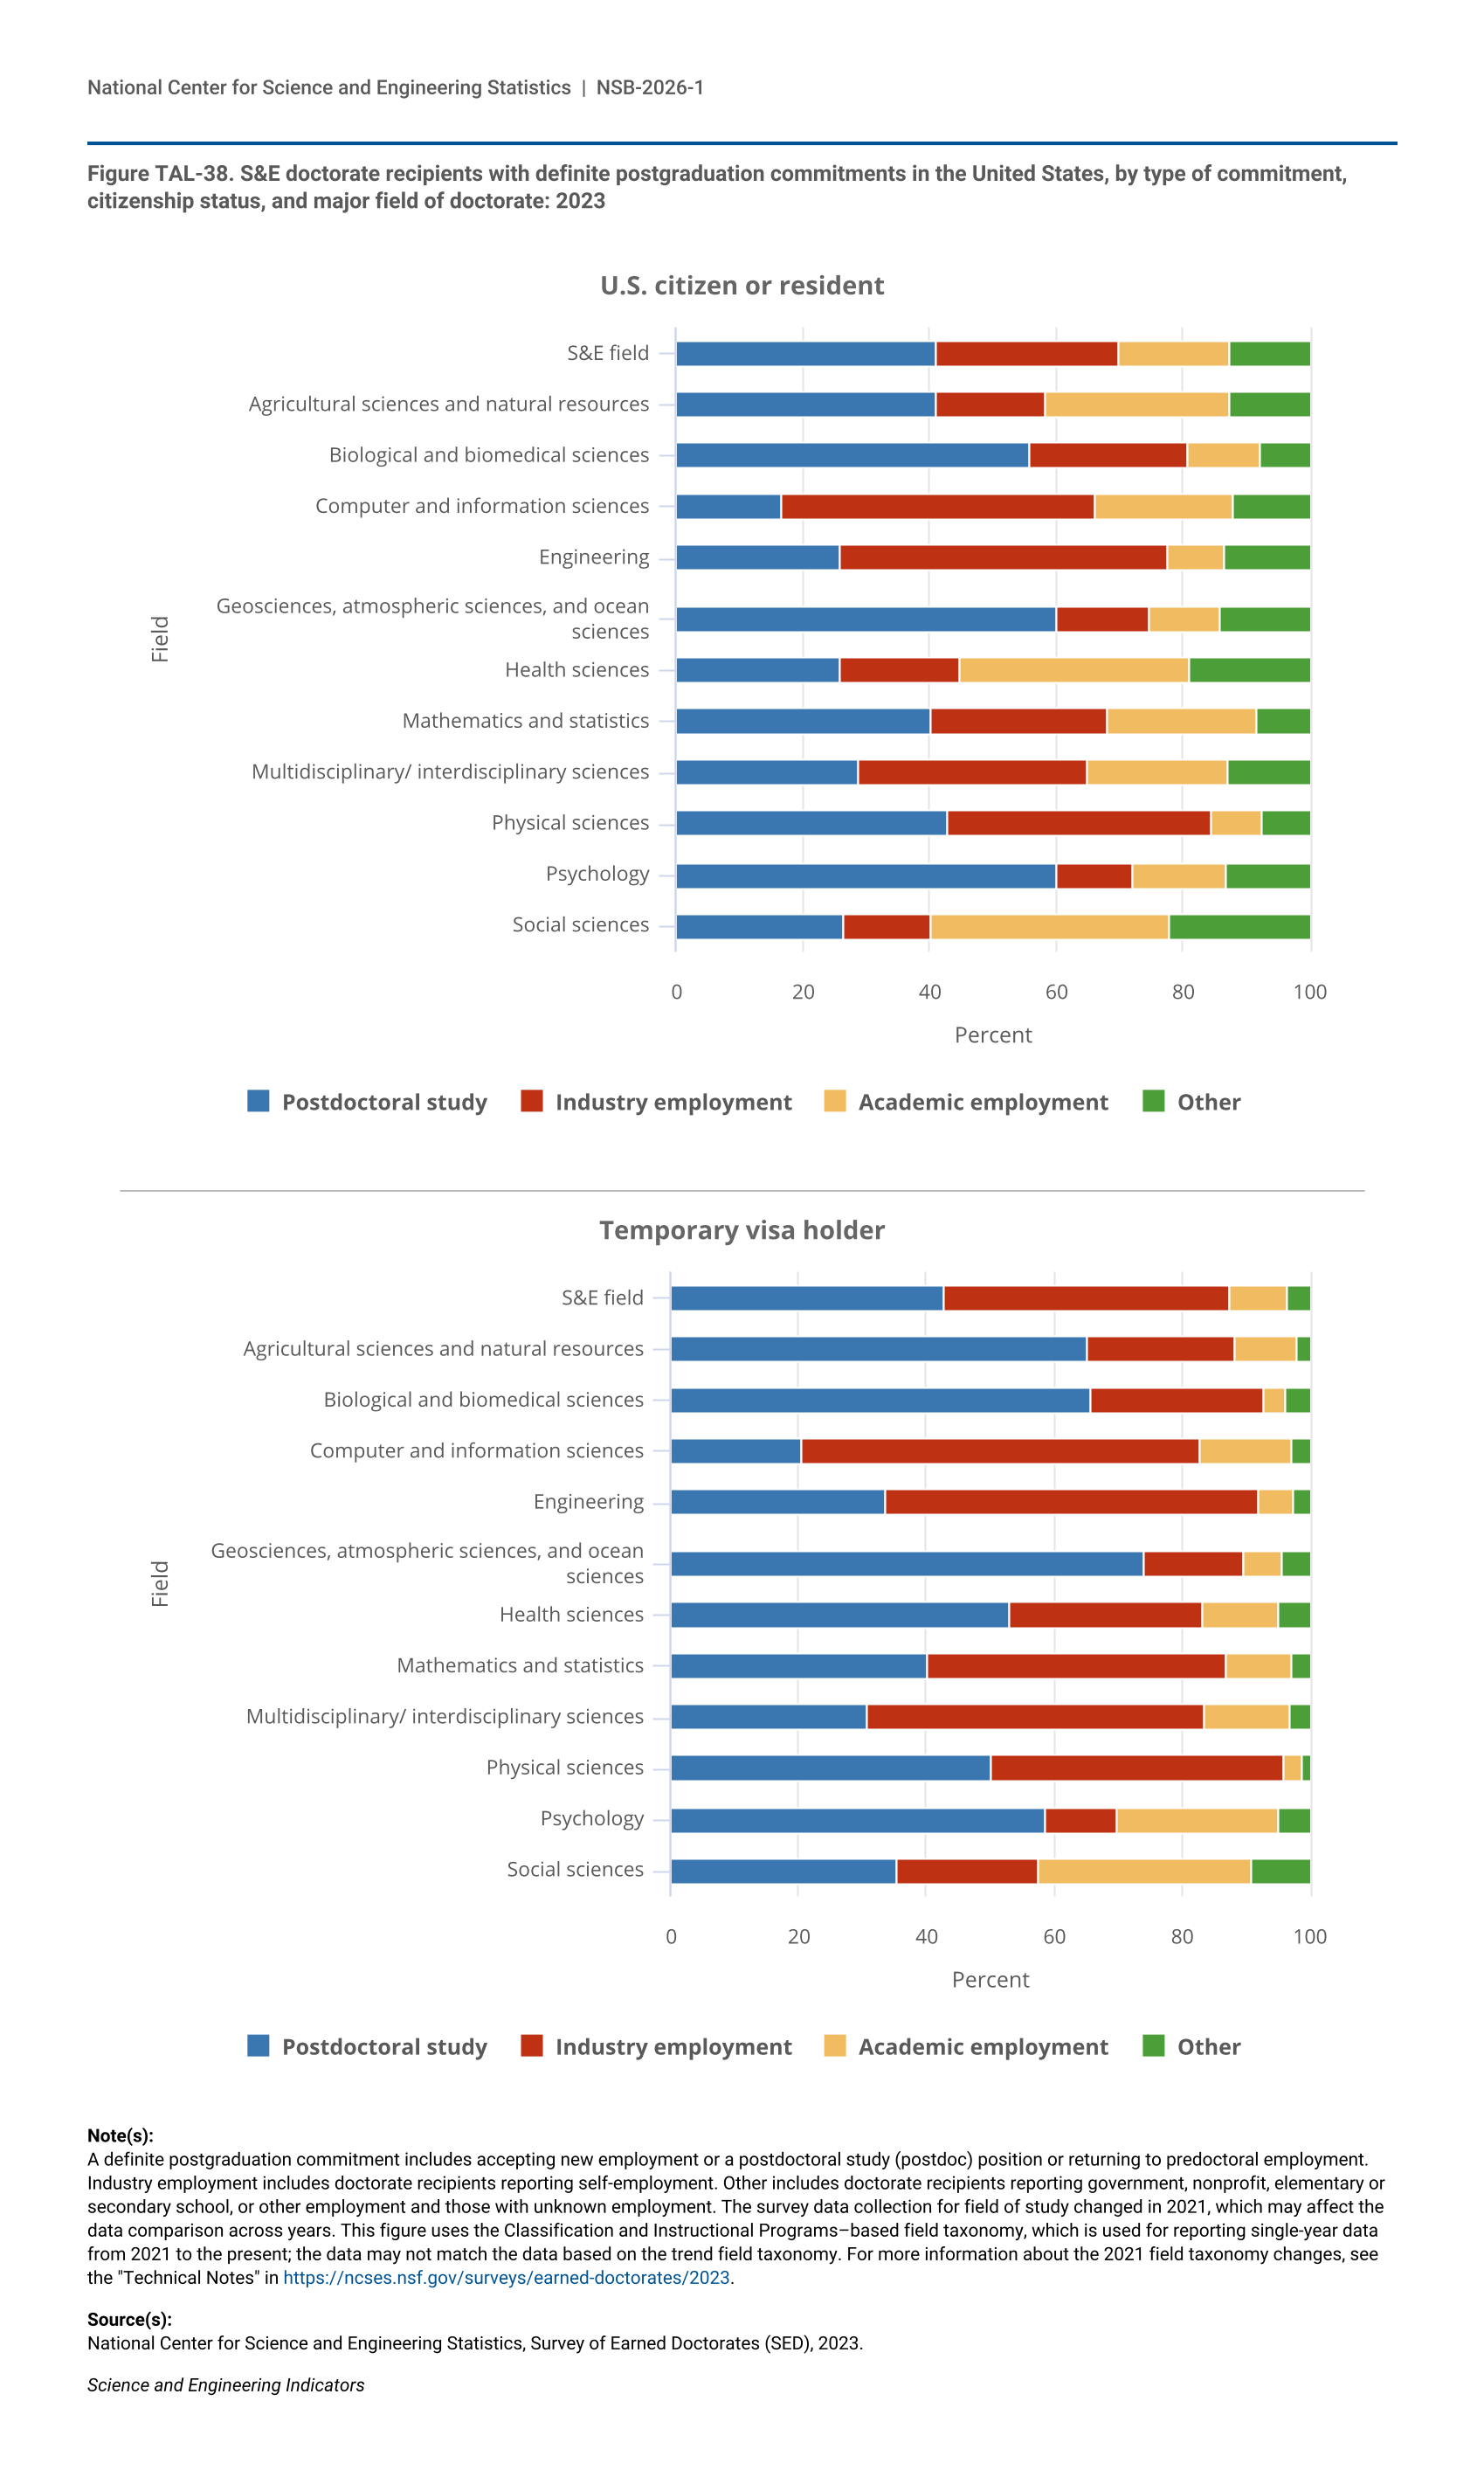
27 Examples of other types of institutions whose designation varies from year to year depending on enrollment include Alaska Native and Native Hawaiian–serving institutions, Asian American and Native American or Other Pacific Islander–serving institutions, Hispanic-serving institutions, Native American–serving nontribal institutions, and predominantly Black institutions (see the Indicators 2024 report “Higher Education in Science and Engineering” [NSB 2023]; especially see the section Institutions in S&E Higher Education for more details).
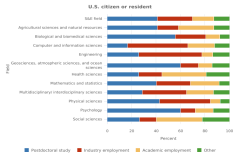
28 Research doctorate recipients complete the Survey of Earned Doctorates as they approach graduation toward the end of their program. This statistic provides data on those who had a definite employment commitment at the time they took the survey. Respondents who indicated that they did not have a definite commitment at that time could have ended up having a definite commitment by the time they graduated. In 2023, 26% of doctorate recipients who responded to this question had no definite commitment for employment or postdoctoral training at the time they completed the survey (NCSES SED 2023: Table 2-1).
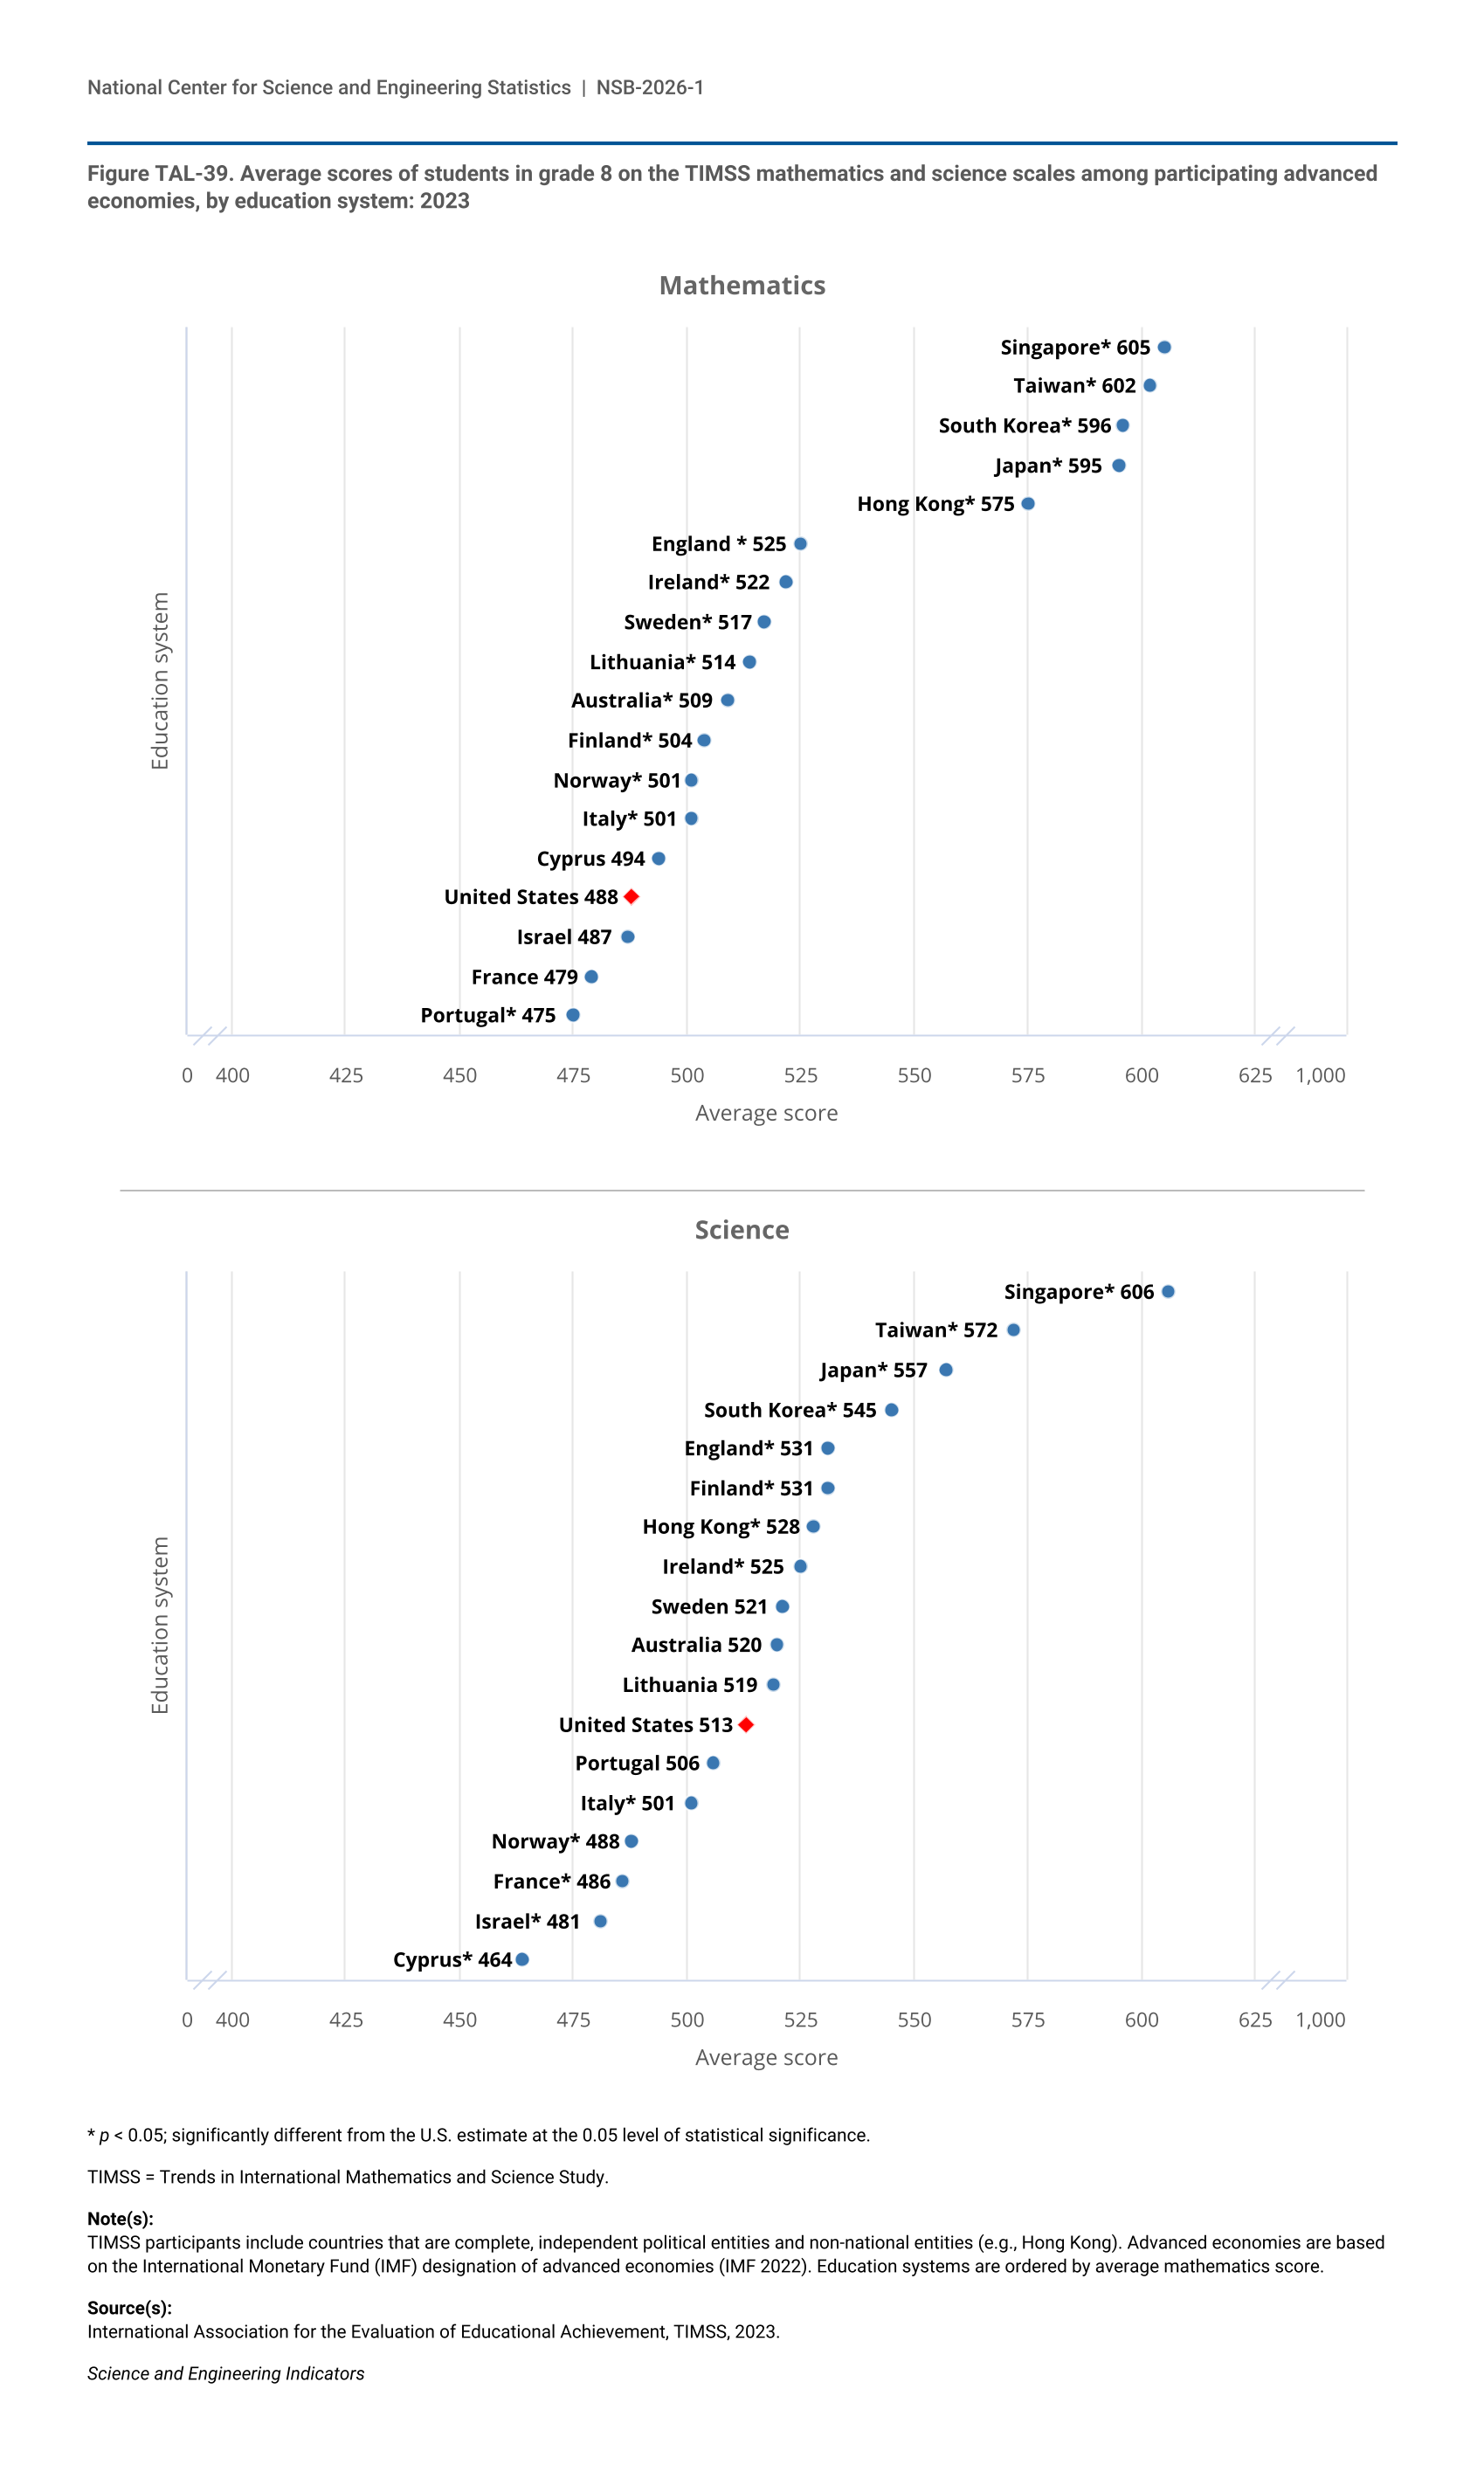
29 Doctorate recipients with definite postgraduation commitments in national laboratories such as, for example, the National Institute of Standards and Technology, the Department of Defense, Federal Funded Research, and Development Centers, etc. may have reported their position under any of the categories in Table TAL-15, depending on the type of position they accepted (postdoctoral study or employment) and on whether the center or institute is affiliated with a university, the government, or a nonprofit.
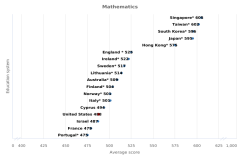
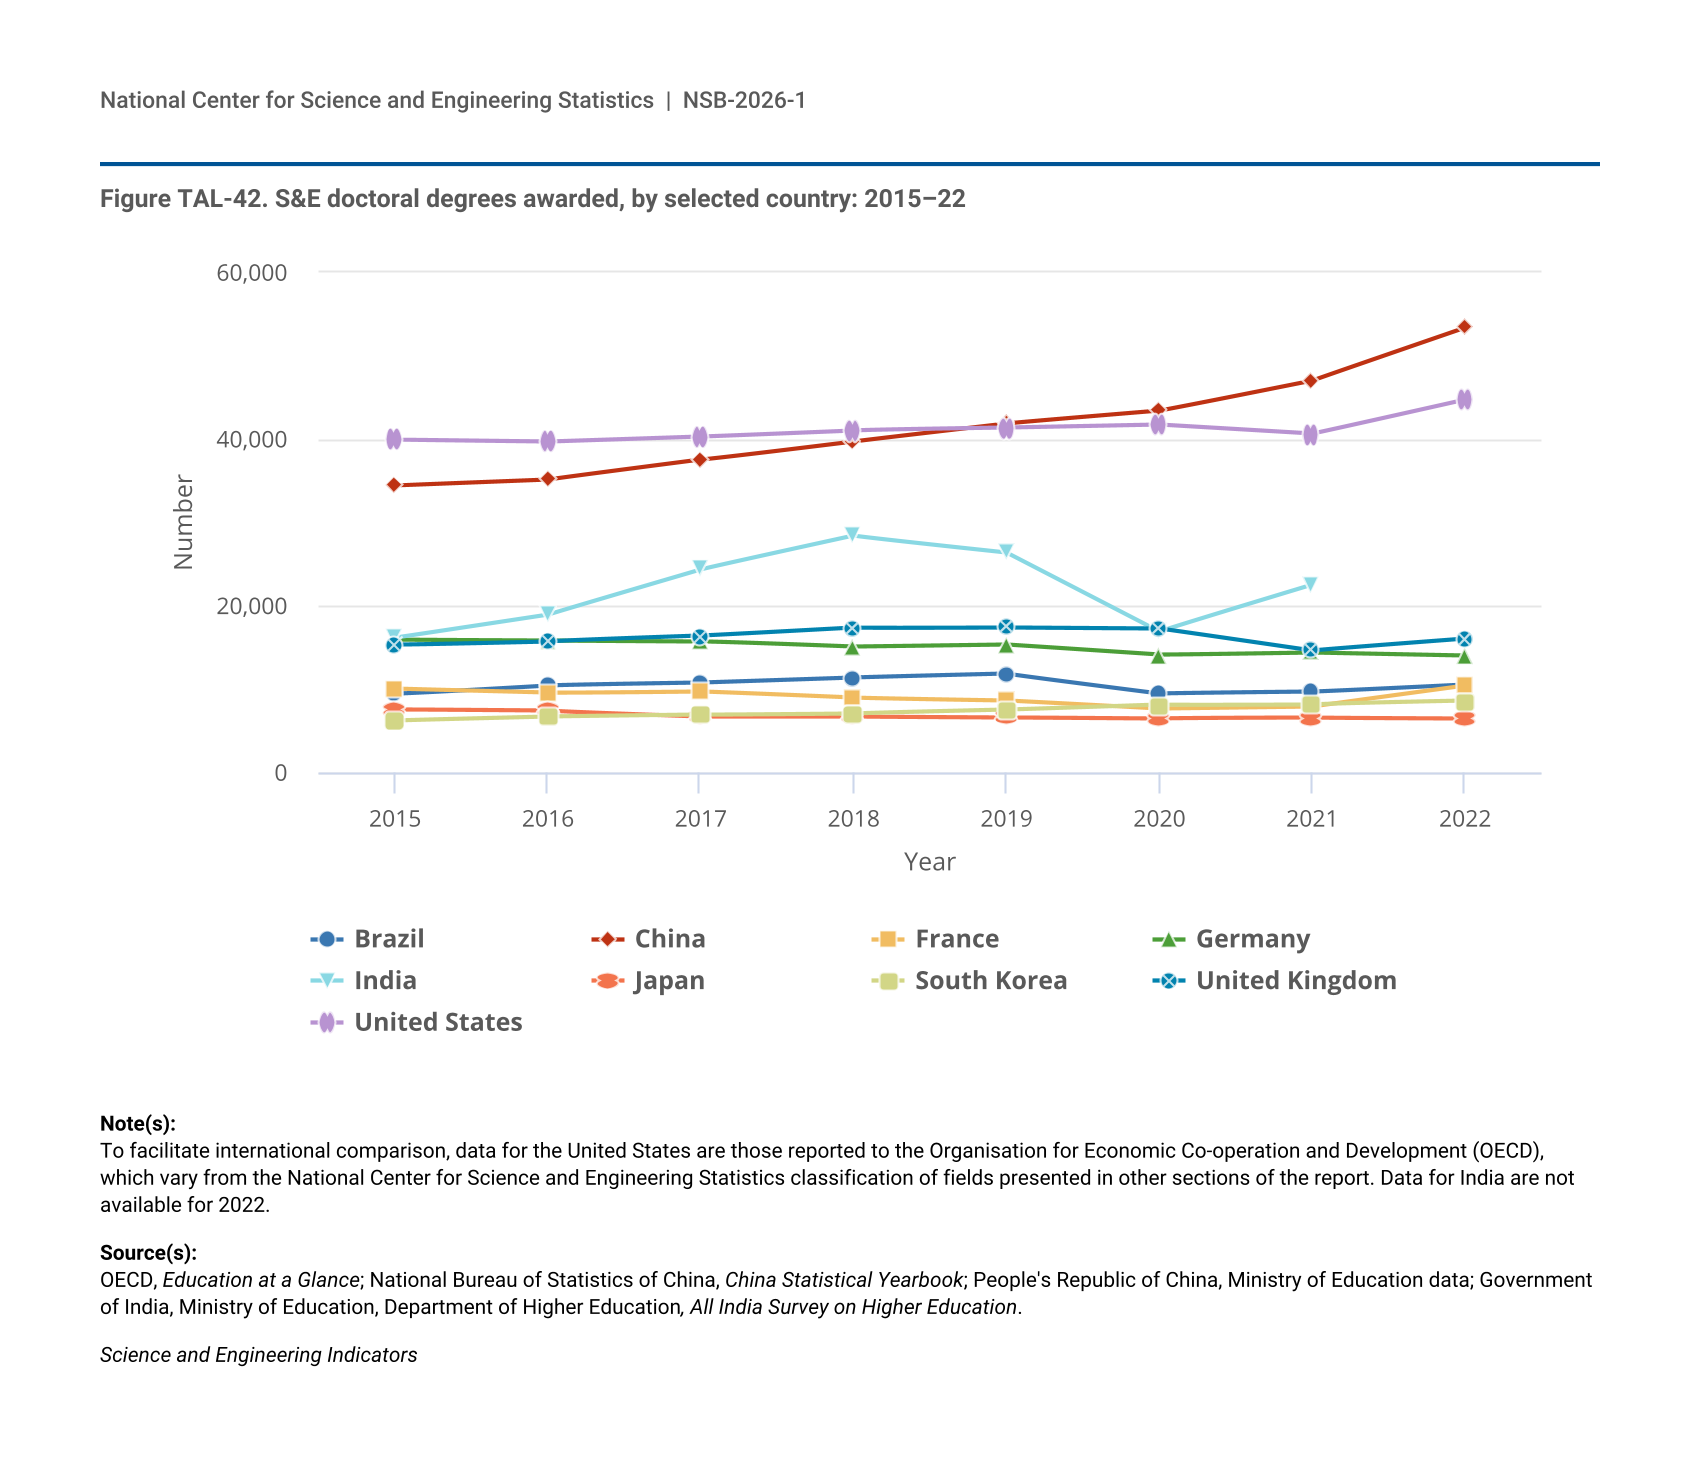
30 Our analysis focuses on U.S. performance when compared with the advanced economies participating in the assessment because those are the major economic competitors for the United States. A total of 42 countries participated in both assessments (Table STAL-24).
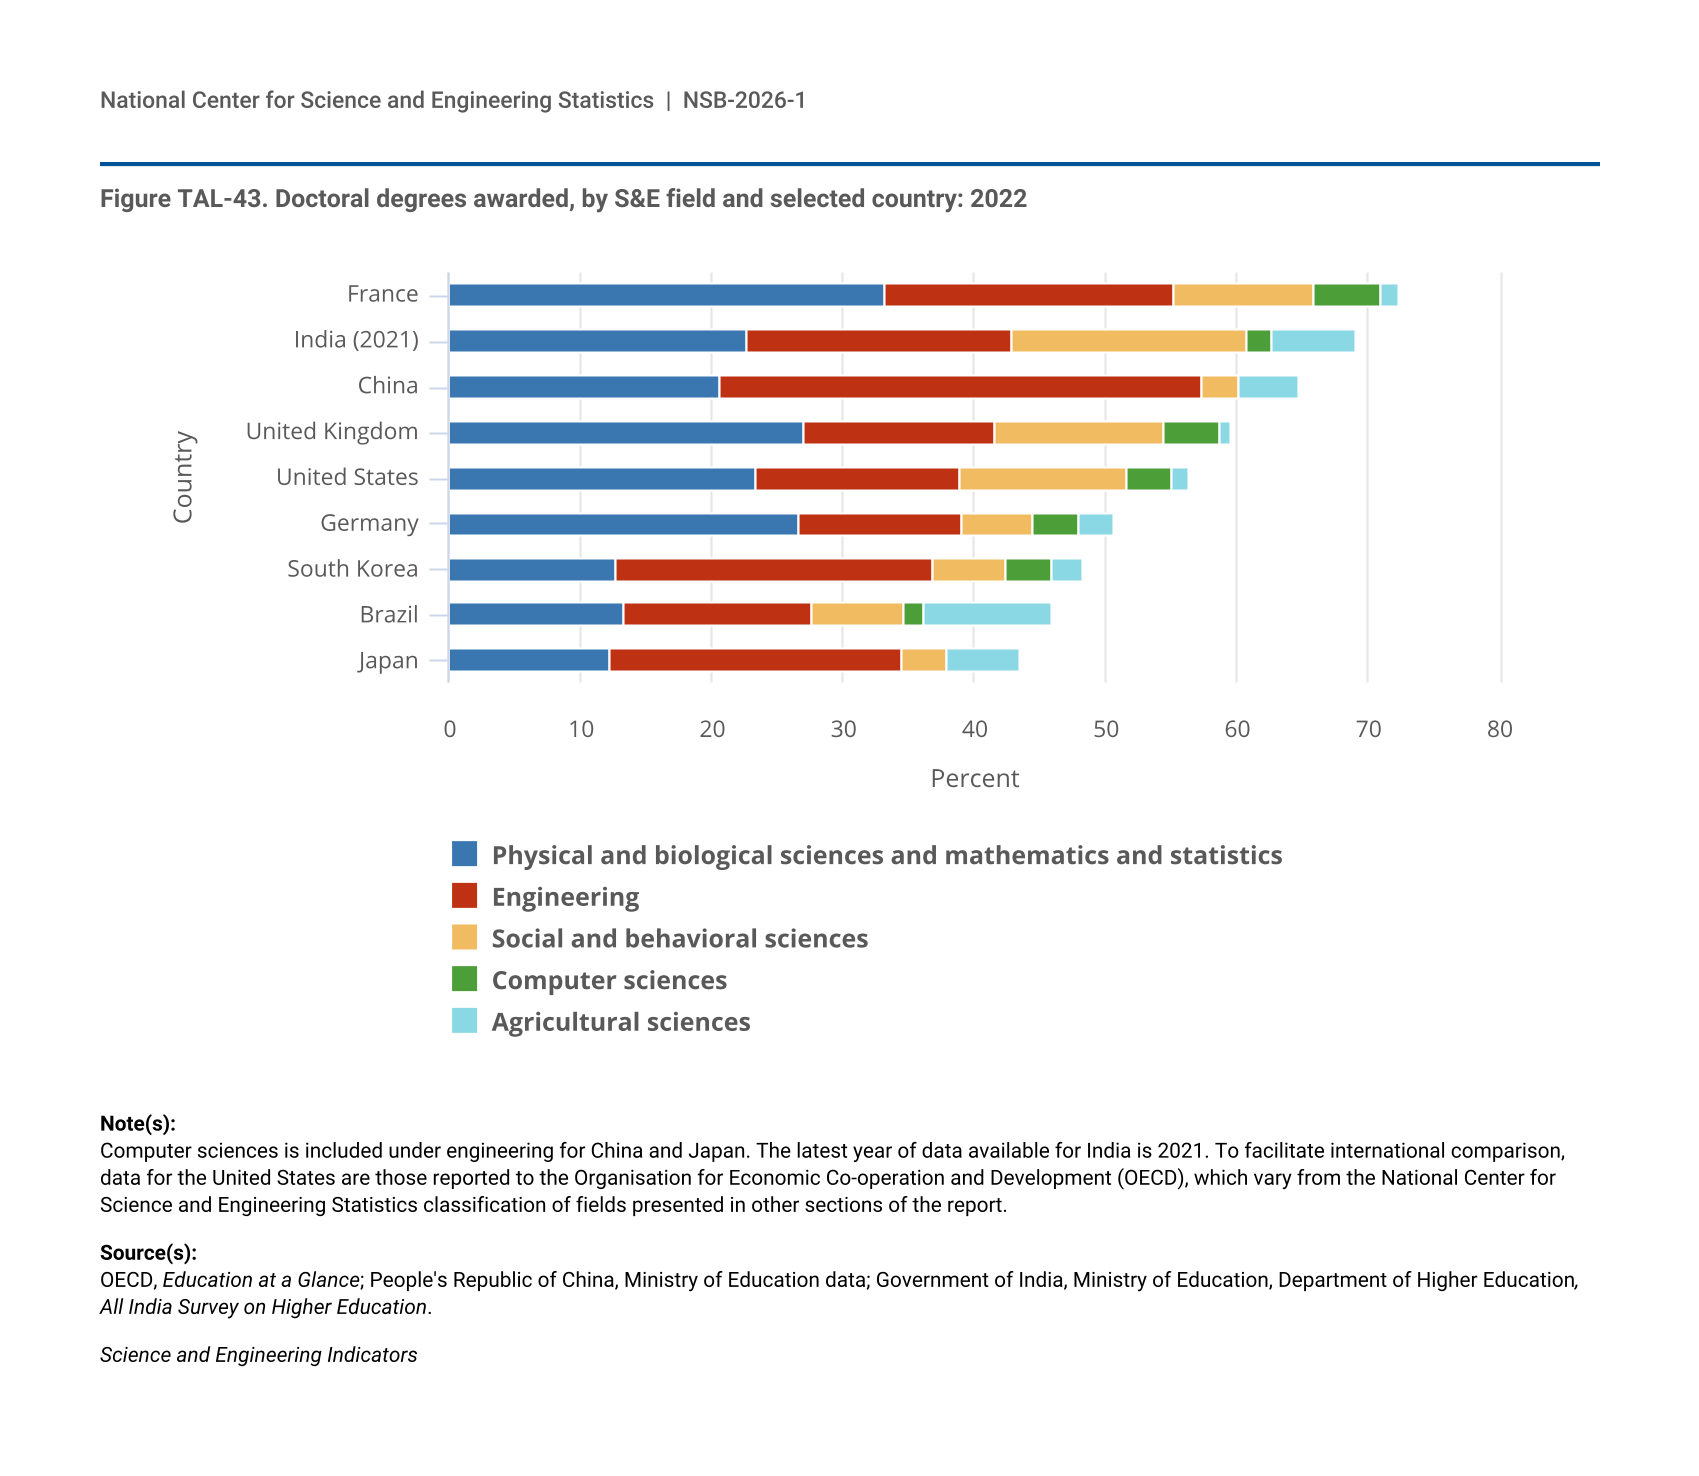
31 Given the proximity of the United States and China on this indicator, see discussion on the comparability of the data in the sidebar Considerations for International Comparisons of S&E Doctoral Degrees in the Indicators 2024 report “Higher Education in Science and Engineering” (NSB 2023).
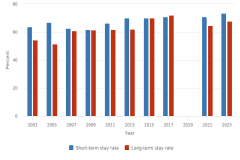
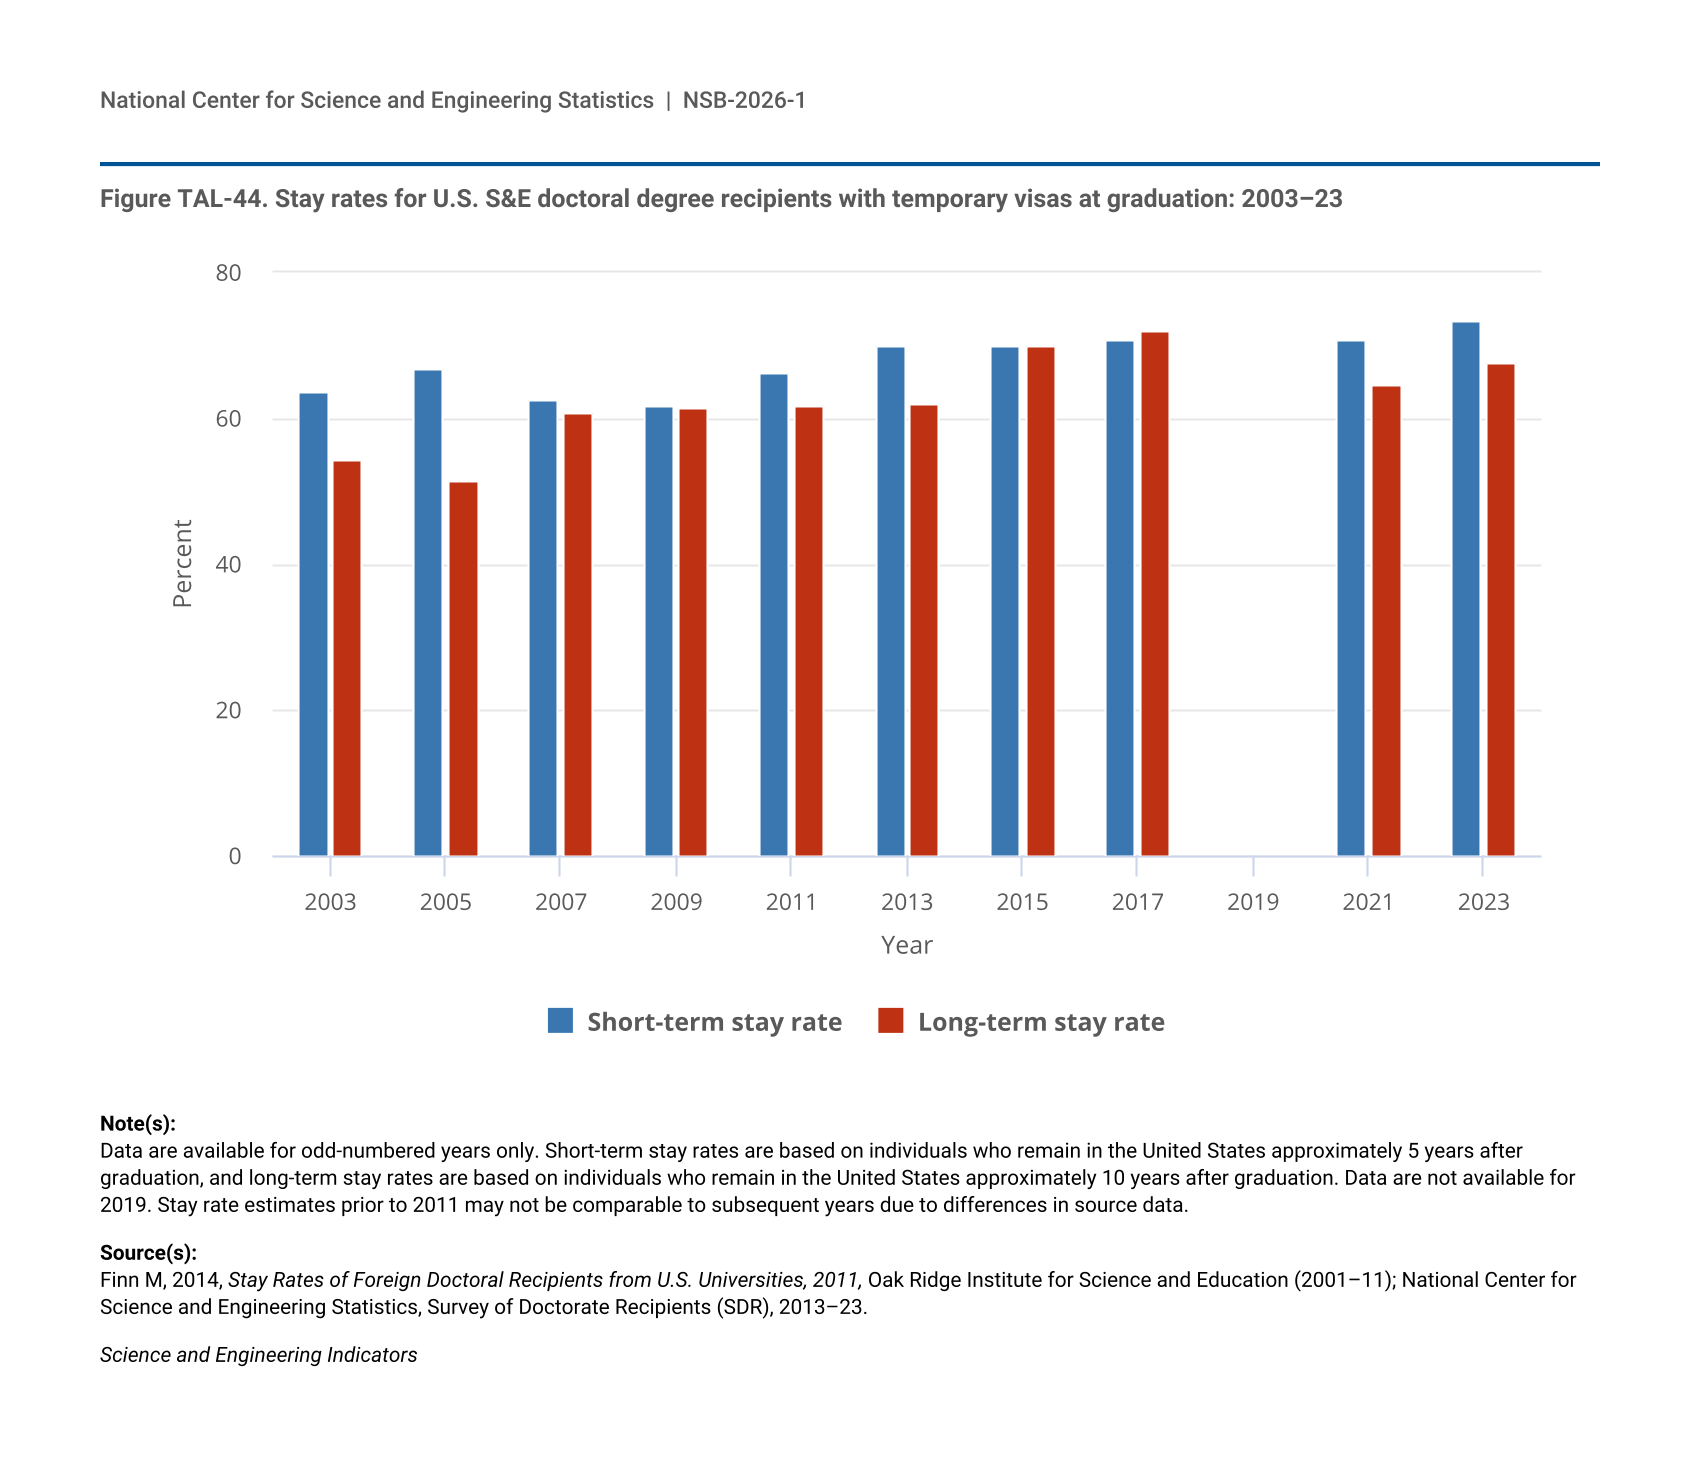
32 The proportion of doctorate recipients who have definite employment commitments to stay in the United States is not strictly comparable over time because doctorate recipients complete the survey at different times as they approach their graduation, and some of them may have obtained an employment commitment after they responded to the survey.
33 Short-term stay rates are based on individuals who remain in the United States approximately 5 years after graduation, and long-term stay rates are based on individuals who remain in the United States approximately 10 years after graduation.
34 Citizenship represents country of citizenship at the time of graduation as reported in the Survey of Earned Doctorates. Noncitizen respondents were asked the country of which they are a citizen. This information is used to produce stay rate estimates by citizenship.


