 An official website of the United States government
 Global Trade by KTI Industries
International trade has long been recognized as a key conduit for knowledge and technology spillovers (Coe and Helpman 1995; Criscuolo, Haskel, and Slaughter 2010) as well as a factor in a country’s international competitiveness and productivity growth (Aghion and Howitt 2009; Baily, Bosworth, and Doshi 2020). Further, the trade patterns in KTI industries examined in this section reflect some of the output patterns examined in the previous section. Together, KTI output and trade patterns reflect and impact innovation activities in the business sector (Ambos et al. 2021; Autor et al. 2020; Ito et al. 2023; Jaax and Miroudot 2021).
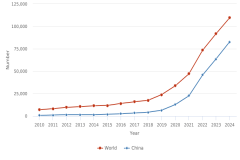
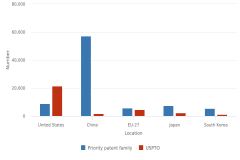
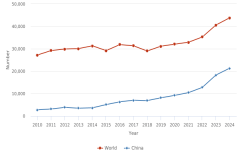
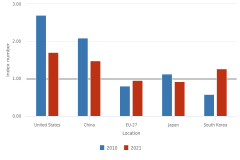
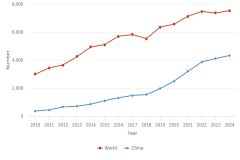
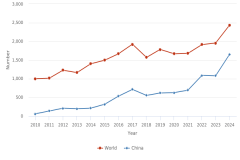
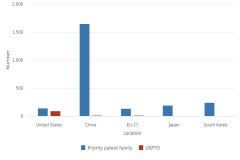
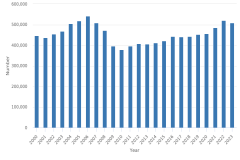
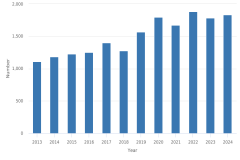
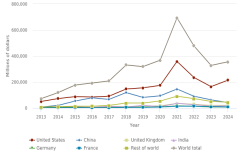
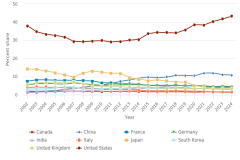
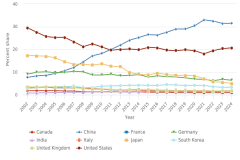
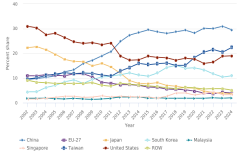
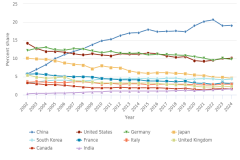
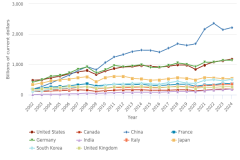
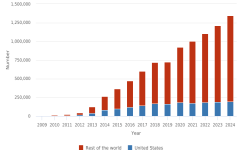
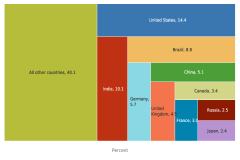
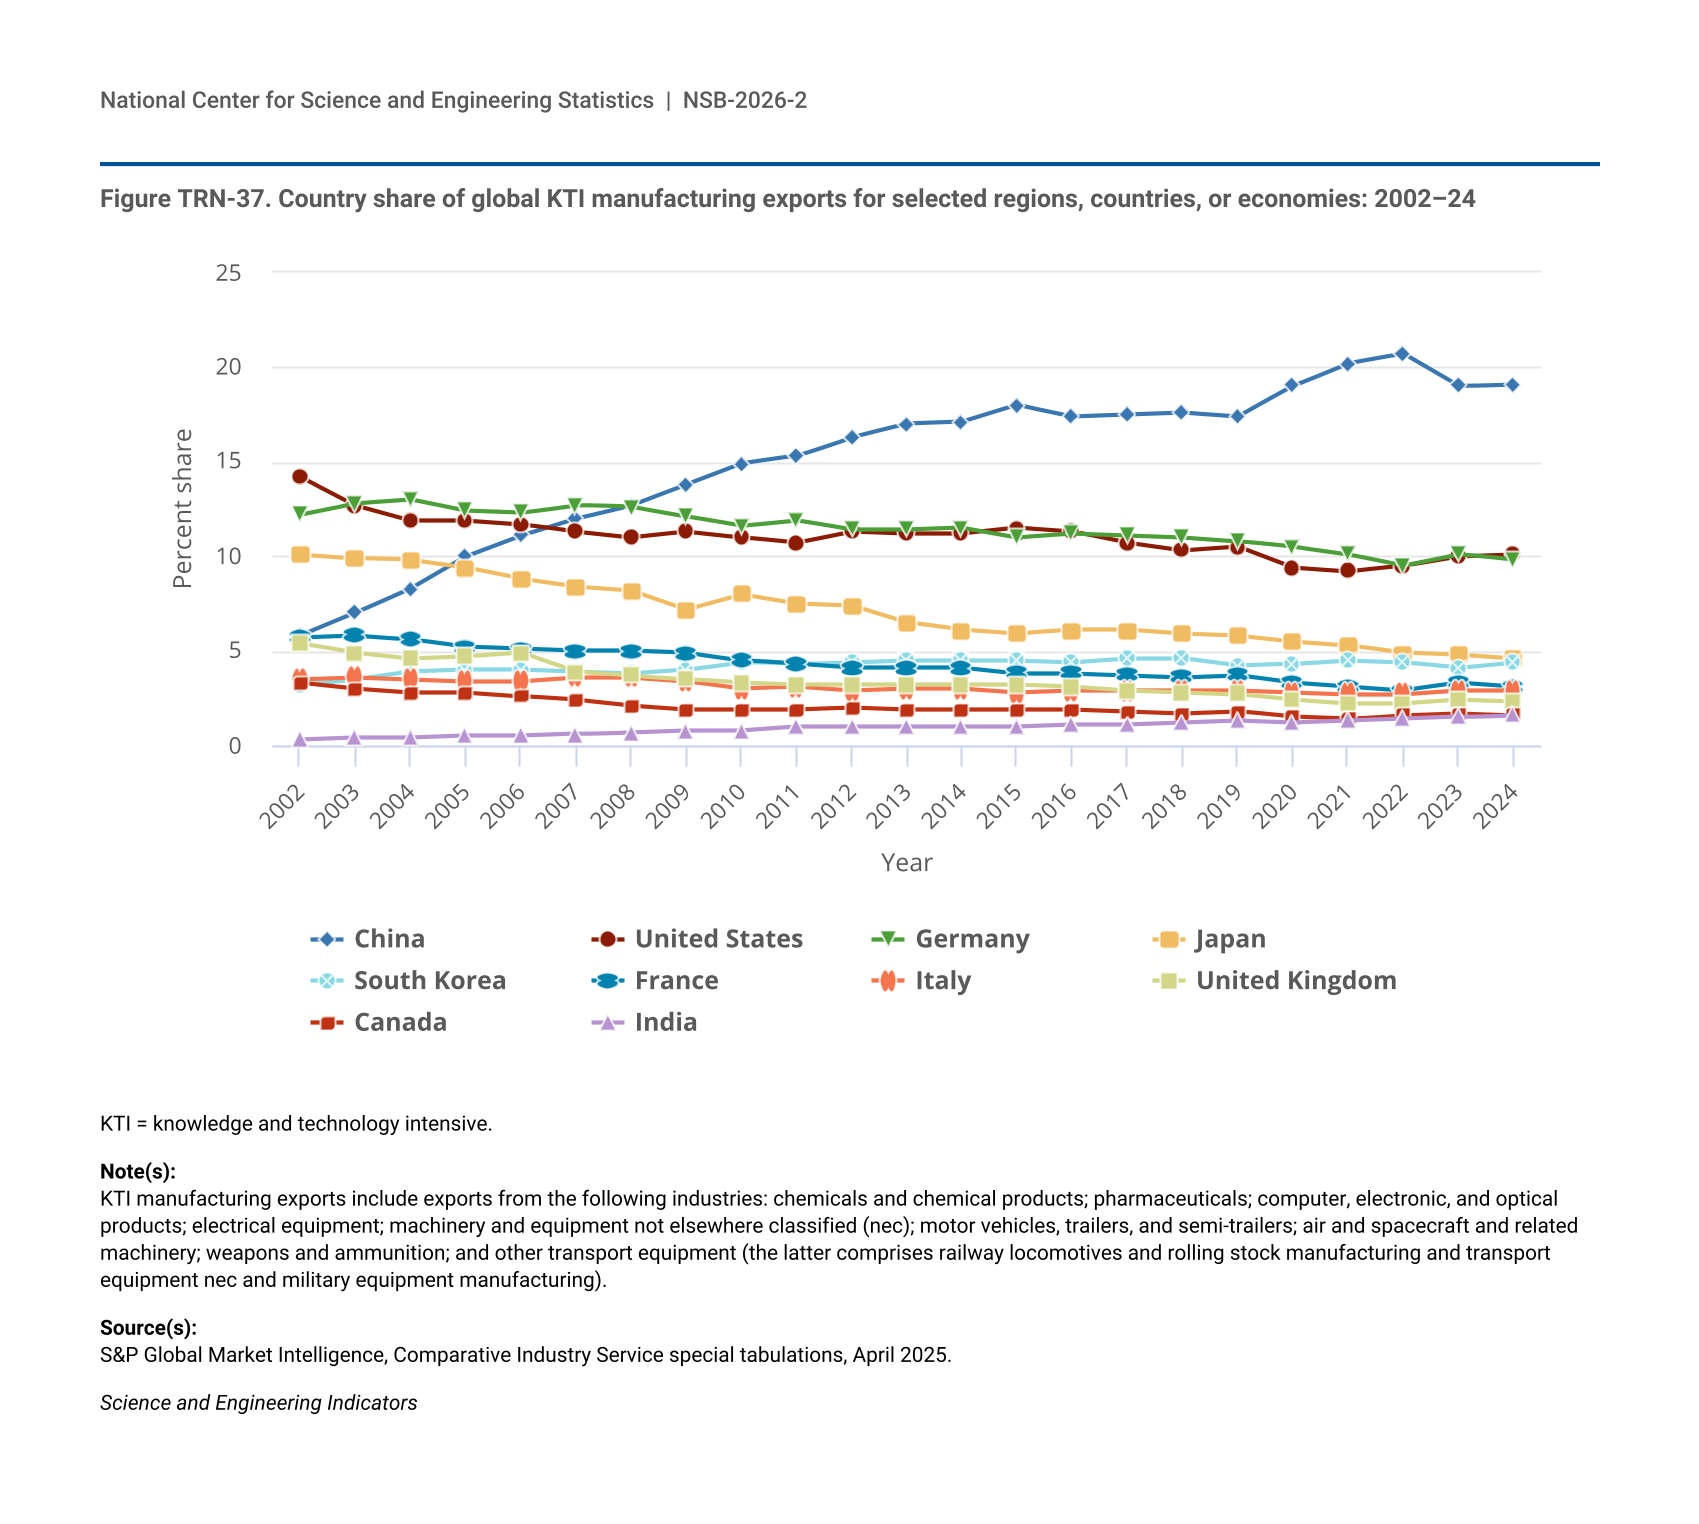
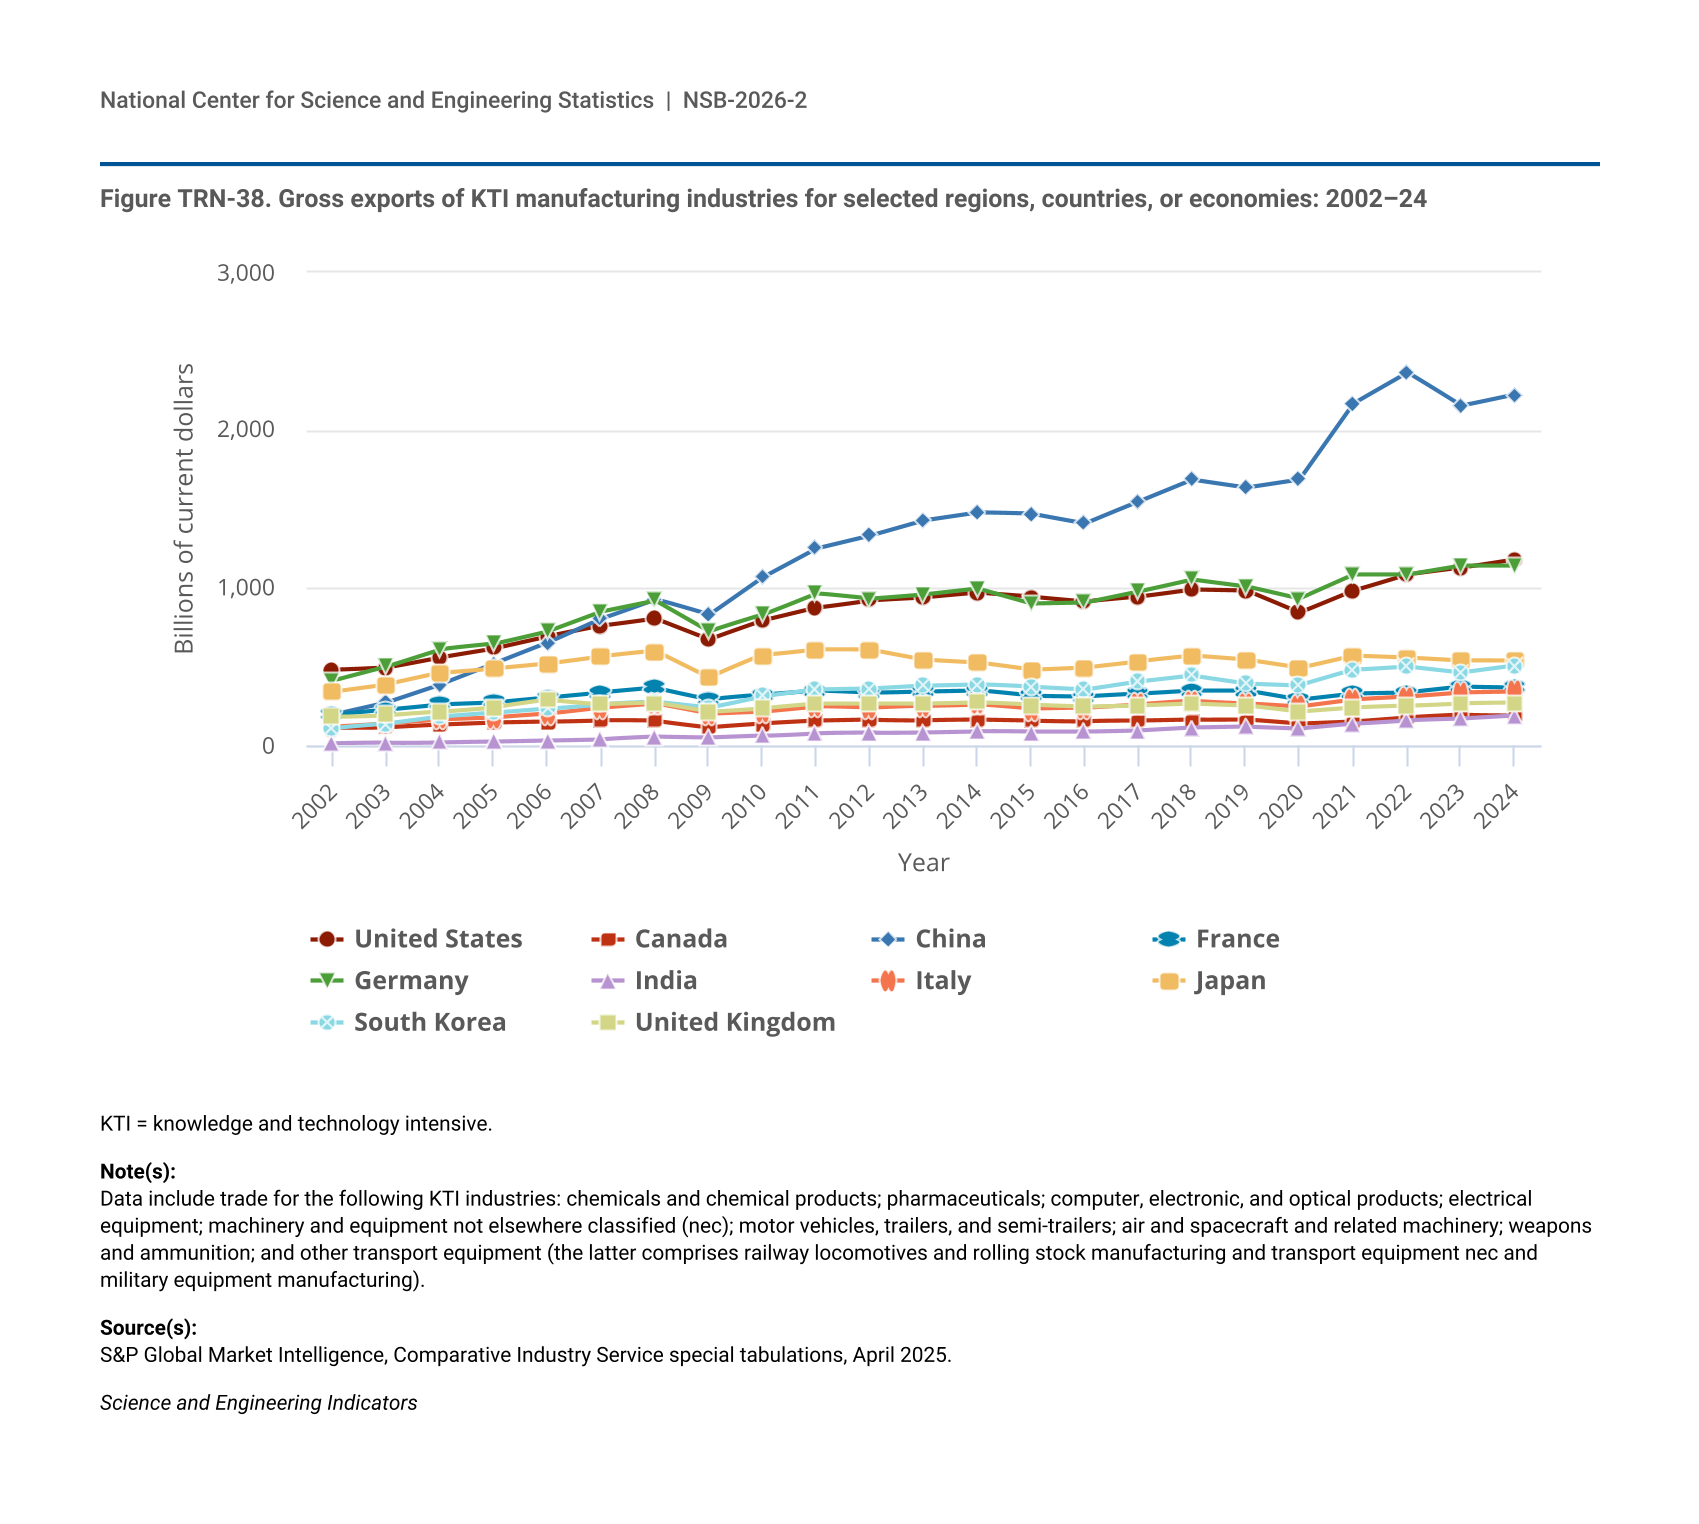
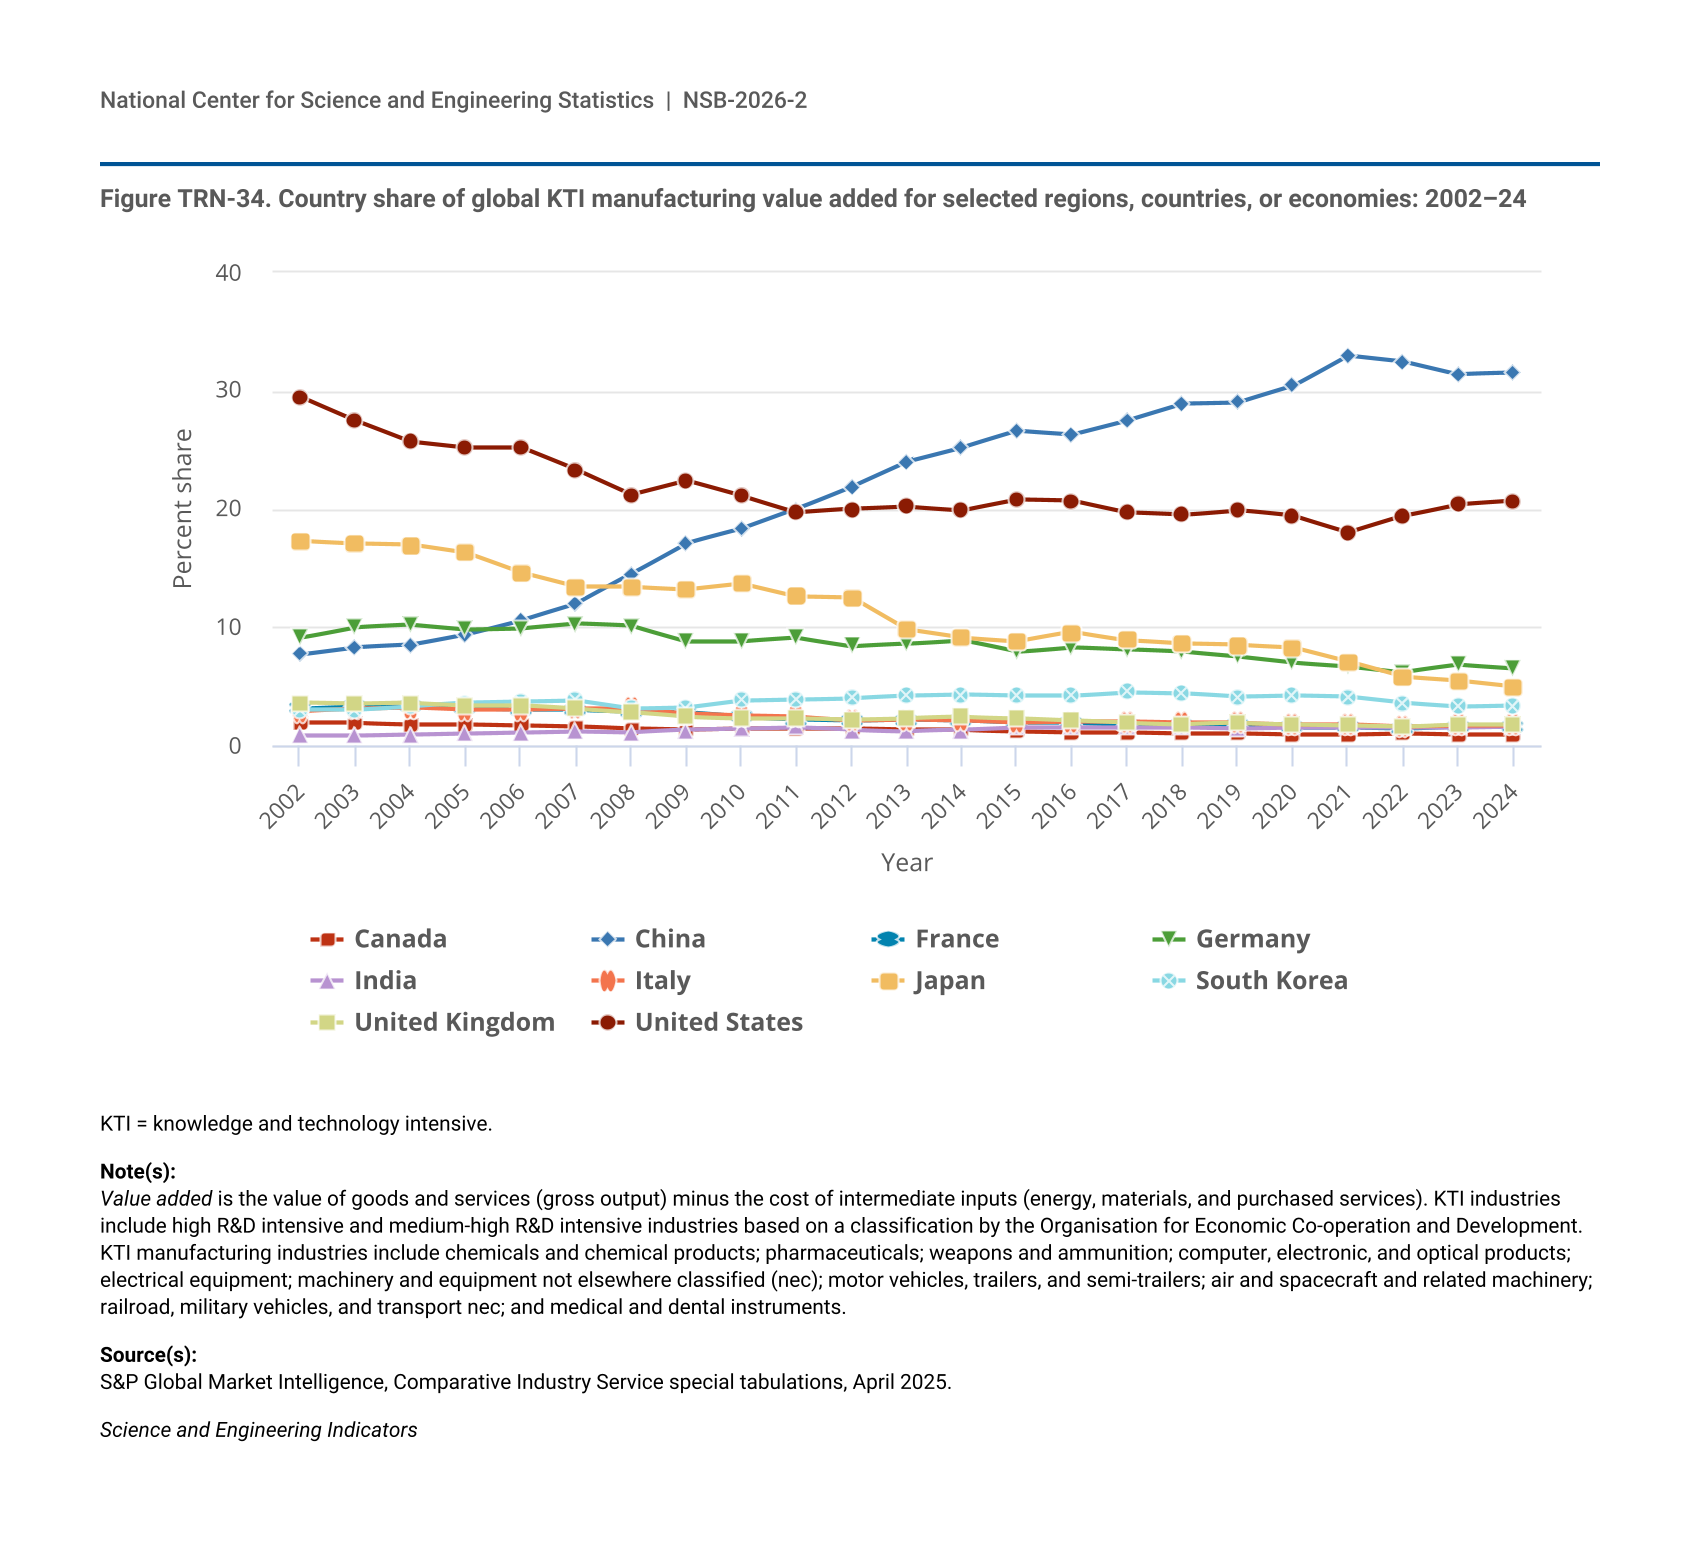
Global goods exports rebounded by 2.2% in 2024, following a 3.7% decline in 2023. However, global KTI manufacturing goods exports were more resilient in 2023, declining by less than 1% and increasing by 3% in 2024 to $11.7 trillion in current U.S. dollars (Table STRN-43). Since 2008, China has been the largest KTI manufacturing exporter globally, based on current U.S. dollars, with $2.2 trillion and a global KTI goods share of 19.1% in 2024 (Figure TRN-37, Figure TRN-38). The United States and Germany were the next-largest KTI manufacturing exporters in 2024, with $1.2 trillion and $1.1 trillion in exports, respectively (Figure TRN-38; Table STRN-43). KTI manufacturing exports from China, Japan, and South Korea all declined in 2023 relative to exports in 2022, with India being the only major KTI manufacturing exporter in Asia to increase exports that year. In 2023, major KTI manufacturing exporters outside of Asia, including the United States, saw exports grow above 2022 levels.
| Year | China | United States | Germany | Japan | South Korea | France | Italy | United Kingdom | Canada | India |
|---|---|---|---|---|---|---|---|---|---|---|
| 2002 | 5.8 | 14.2 | 12.2 | 10.1 | 3.2 | 5.7 | 3.5 | 5.4 | 3.3 | 0.3 |
| 2003 | 7.0 | 12.7 | 12.8 | 9.9 | 3.5 | 5.8 | 3.6 | 4.9 | 3.0 | 0.4 |
| 2004 | 8.3 | 11.9 | 13.0 | 9.8 | 3.9 | 5.6 | 3.5 | 4.6 | 2.8 | 0.4 |
| 2005 | 10.0 | 11.9 | 12.4 | 9.4 | 4.0 | 5.2 | 3.4 | 4.7 | 2.8 | 0.5 |
| 2006 | 11.1 | 11.7 | 12.3 | 8.8 | 4.0 | 5.1 | 3.4 | 4.9 | 2.6 | 0.5 |
| 2007 | 12.0 | 11.3 | 12.7 | 8.4 | 3.9 | 5.0 | 3.6 | 3.9 | 2.4 | 0.6 |
| 2008 | 12.7 | 11.0 | 12.6 | 8.2 | 3.8 | 5.0 | 3.6 | 3.7 | 2.1 | 0.7 |
| 2009 | 13.8 | 11.3 | 12.1 | 7.2 | 4.0 | 4.9 | 3.4 | 3.5 | 1.9 | 0.8 |
| 2010 | 14.9 | 11.0 | 11.6 | 8.0 | 4.4 | 4.5 | 3.0 | 3.3 | 1.9 | 0.8 |
| 2011 | 15.3 | 10.7 | 11.9 | 7.5 | 4.3 | 4.3 | 3.1 | 3.2 | 1.9 | 1.0 |
| 2012 | 16.3 | 11.3 | 11.4 | 7.4 | 4.4 | 4.1 | 2.9 | 3.2 | 2.0 | 1.0 |
| 2013 | 17.0 | 11.2 | 11.4 | 6.5 | 4.5 | 4.1 | 3.0 | 3.2 | 1.9 | 1.0 |
| 2014 | 17.1 | 11.2 | 11.5 | 6.1 | 4.5 | 4.1 | 3.0 | 3.2 | 1.9 | 1.0 |
| 2015 | 18.0 | 11.5 | 11.0 | 5.9 | 4.5 | 3.8 | 2.8 | 3.2 | 1.9 | 1.0 |
| 2016 | 17.4 | 11.3 | 11.2 | 6.1 | 4.4 | 3.8 | 2.9 | 3.1 | 1.9 | 1.1 |
| 2017 | 17.5 | 10.7 | 11.1 | 6.1 | 4.6 | 3.7 | 2.9 | 2.9 | 1.8 | 1.1 |
| 2018 | 17.6 | 10.3 | 11.0 | 5.9 | 4.6 | 3.6 | 2.9 | 2.8 | 1.7 | 1.2 |
| 2019 | 17.4 | 10.5 | 10.8 | 5.8 | 4.2 | 3.7 | 2.9 | 2.7 | 1.8 | 1.3 |
| 2020 | 19.0 | 9.4 | 10.5 | 5.5 | 4.3 | 3.3 | 2.8 | 2.4 | 1.5 | 1.2 |
| 2021 | 20.2 | 9.2 | 10.1 | 5.3 | 4.5 | 3.1 | 2.7 | 2.2 | 1.4 | 1.3 |
| 2022 | 20.7 | 9.5 | 9.5 | 4.9 | 4.4 | 2.9 | 2.7 | 2.2 | 1.6 | 1.4 |
| 2023 | 19.0 | 10.0 | 10.1 | 4.8 | 4.1 | 3.3 | 2.9 | 2.4 | 1.7 | 1.5 |
| 2024 | 19.1 | 10.1 | 9.8 | 4.6 | 4.4 | 3.1 | 2.9 | 2.3 | 1.6 | 1.6 |
KTI = knowledge and technology intensive.
KTI manufacturing exports include exports from the following industries: chemicals and chemical products; pharmaceuticals; computer, electronic, and optical products; electrical equipment; machinery and equipment not elsewhere classified (nec); motor vehicles, trailers, and semi-trailers; air and spacecraft and related machinery; weapons and ammunition; and other transport equipment (the latter comprises railway locomotives and rolling stock manufacturing and transport equipment nec and military equipment manufacturing).
S&P Global Market Intelligence, Comparative Industry Service special tabulations, April 2025.
Science and Engineering Indicators
| Year | United States | Canada | China | France | Germany | India | Italy | Japan | South Korea | United Kingdom |
|---|---|---|---|---|---|---|---|---|---|---|
| 2002 | 479 | 113 | 197 | 194 | 413 | 12 | 119 | 340 | 110 | 181 |
| 2003 | 495 | 116 | 274 | 227 | 502 | 15 | 140 | 386 | 136 | 192 |
| 2004 | 560 | 132 | 388 | 261 | 611 | 20 | 166 | 459 | 181 | 214 |
| 2005 | 615 | 145 | 518 | 272 | 643 | 25 | 177 | 489 | 206 | 243 |
| 2006 | 691 | 151 | 651 | 303 | 724 | 32 | 200 | 520 | 233 | 289 |
| 2007 | 757 | 160 | 805 | 336 | 850 | 39 | 240 | 565 | 262 | 261 |
| 2008 | 804 | 155 | 928 | 365 | 920 | 53 | 266 | 599 | 275 | 269 |
| 2009 | 672 | 116 | 827 | 294 | 725 | 48 | 200 | 432 | 239 | 212 |
| 2010 | 790 | 138 | 1,066 | 321 | 828 | 60 | 215 | 573 | 312 | 235 |
| 2011 | 872 | 155 | 1,249 | 348 | 966 | 78 | 249 | 611 | 353 | 264 |
| 2012 | 920 | 162 | 1,331 | 334 | 930 | 80 | 237 | 608 | 359 | 265 |
| 2013 | 937 | 160 | 1,428 | 343 | 958 | 84 | 250 | 545 | 379 | 266 |
| 2014 | 967 | 163 | 1,478 | 350 | 996 | 90 | 262 | 527 | 387 | 273 |
| 2015 | 942 | 157 | 1,469 | 313 | 900 | 85 | 231 | 480 | 370 | 257 |
| 2016 | 913 | 154 | 1,408 | 310 | 906 | 86 | 237 | 495 | 353 | 247 |
| 2017 | 943 | 155 | 1,546 | 327 | 977 | 94 | 259 | 534 | 405 | 255 |
| 2018 | 990 | 162 | 1,686 | 348 | 1,054 | 112 | 282 | 568 | 443 | 267 |
| 2019 | 983 | 164 | 1,637 | 349 | 1,010 | 118 | 268 | 542 | 394 | 255 |
| 2020 | 840 | 137 | 1,689 | 290 | 931 | 107 | 247 | 491 | 382 | 215 |
| 2021 | 981 | 151 | 2,170 | 330 | 1,082 | 138 | 291 | 572 | 479 | 240 |
| 2022 | 1,084 | 177 | 2,365 | 336 | 1,081 | 160 | 308 | 560 | 501 | 251 |
| 2023 | 1,126 | 193 | 2,153 | 372 | 1,138 | 169 | 334 | 541 | 463 | 267 |
| 2024 | 1,179 | 191 | 2,226 | 367 | 1,139 | 188 | 339 | 539 | 507 | 270 |
KTI = knowledge and technology intensive.
Data include trade for the following KTI industries: chemicals and chemical products; pharmaceuticals; computer, electronic, and optical products; electrical equipment; machinery and equipment not elsewhere classified (nec); motor vehicles, trailers, and semi-trailers; air and spacecraft and related machinery; weapons and ammunition; and other transport equipment (the latter comprises railway locomotives and rolling stock manufacturing and transport equipment nec and military equipment manufacturing).
S&P Global Market Intelligence, Comparative Industry Service special tabulations, April 2025.
Science and Engineering Indicators
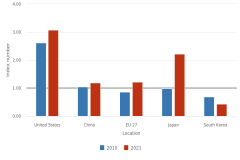
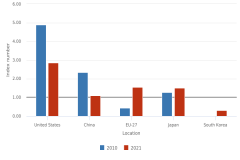
By 2024, all economies except China and Japan exceeded their 2022 KTI manufacturing exports in current U.S. dollars, and all economies except for China, Japan, and South Korea exceeded the average global growth rate during this period (Table STRN-43).Global KTI manufacturing exports have accounted for a majority (between 58% and 62%) of total global manufacturing exports since 2002 (Table STRN-43). In 2024, KTI manufacturing exports as a share of all national manufacturing exports exceeded 70% in Japan, South Korea, and Germany (73%, 73%, and 71%, respectively), followed by the United States (67%) and China (64%) (Table STRN-44).
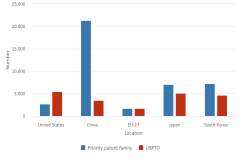
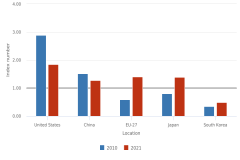
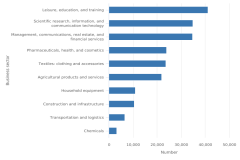
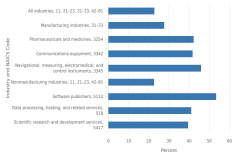
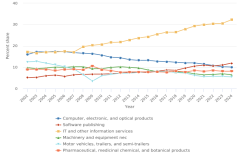
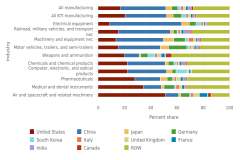
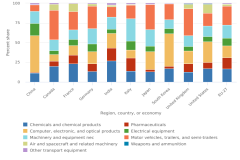
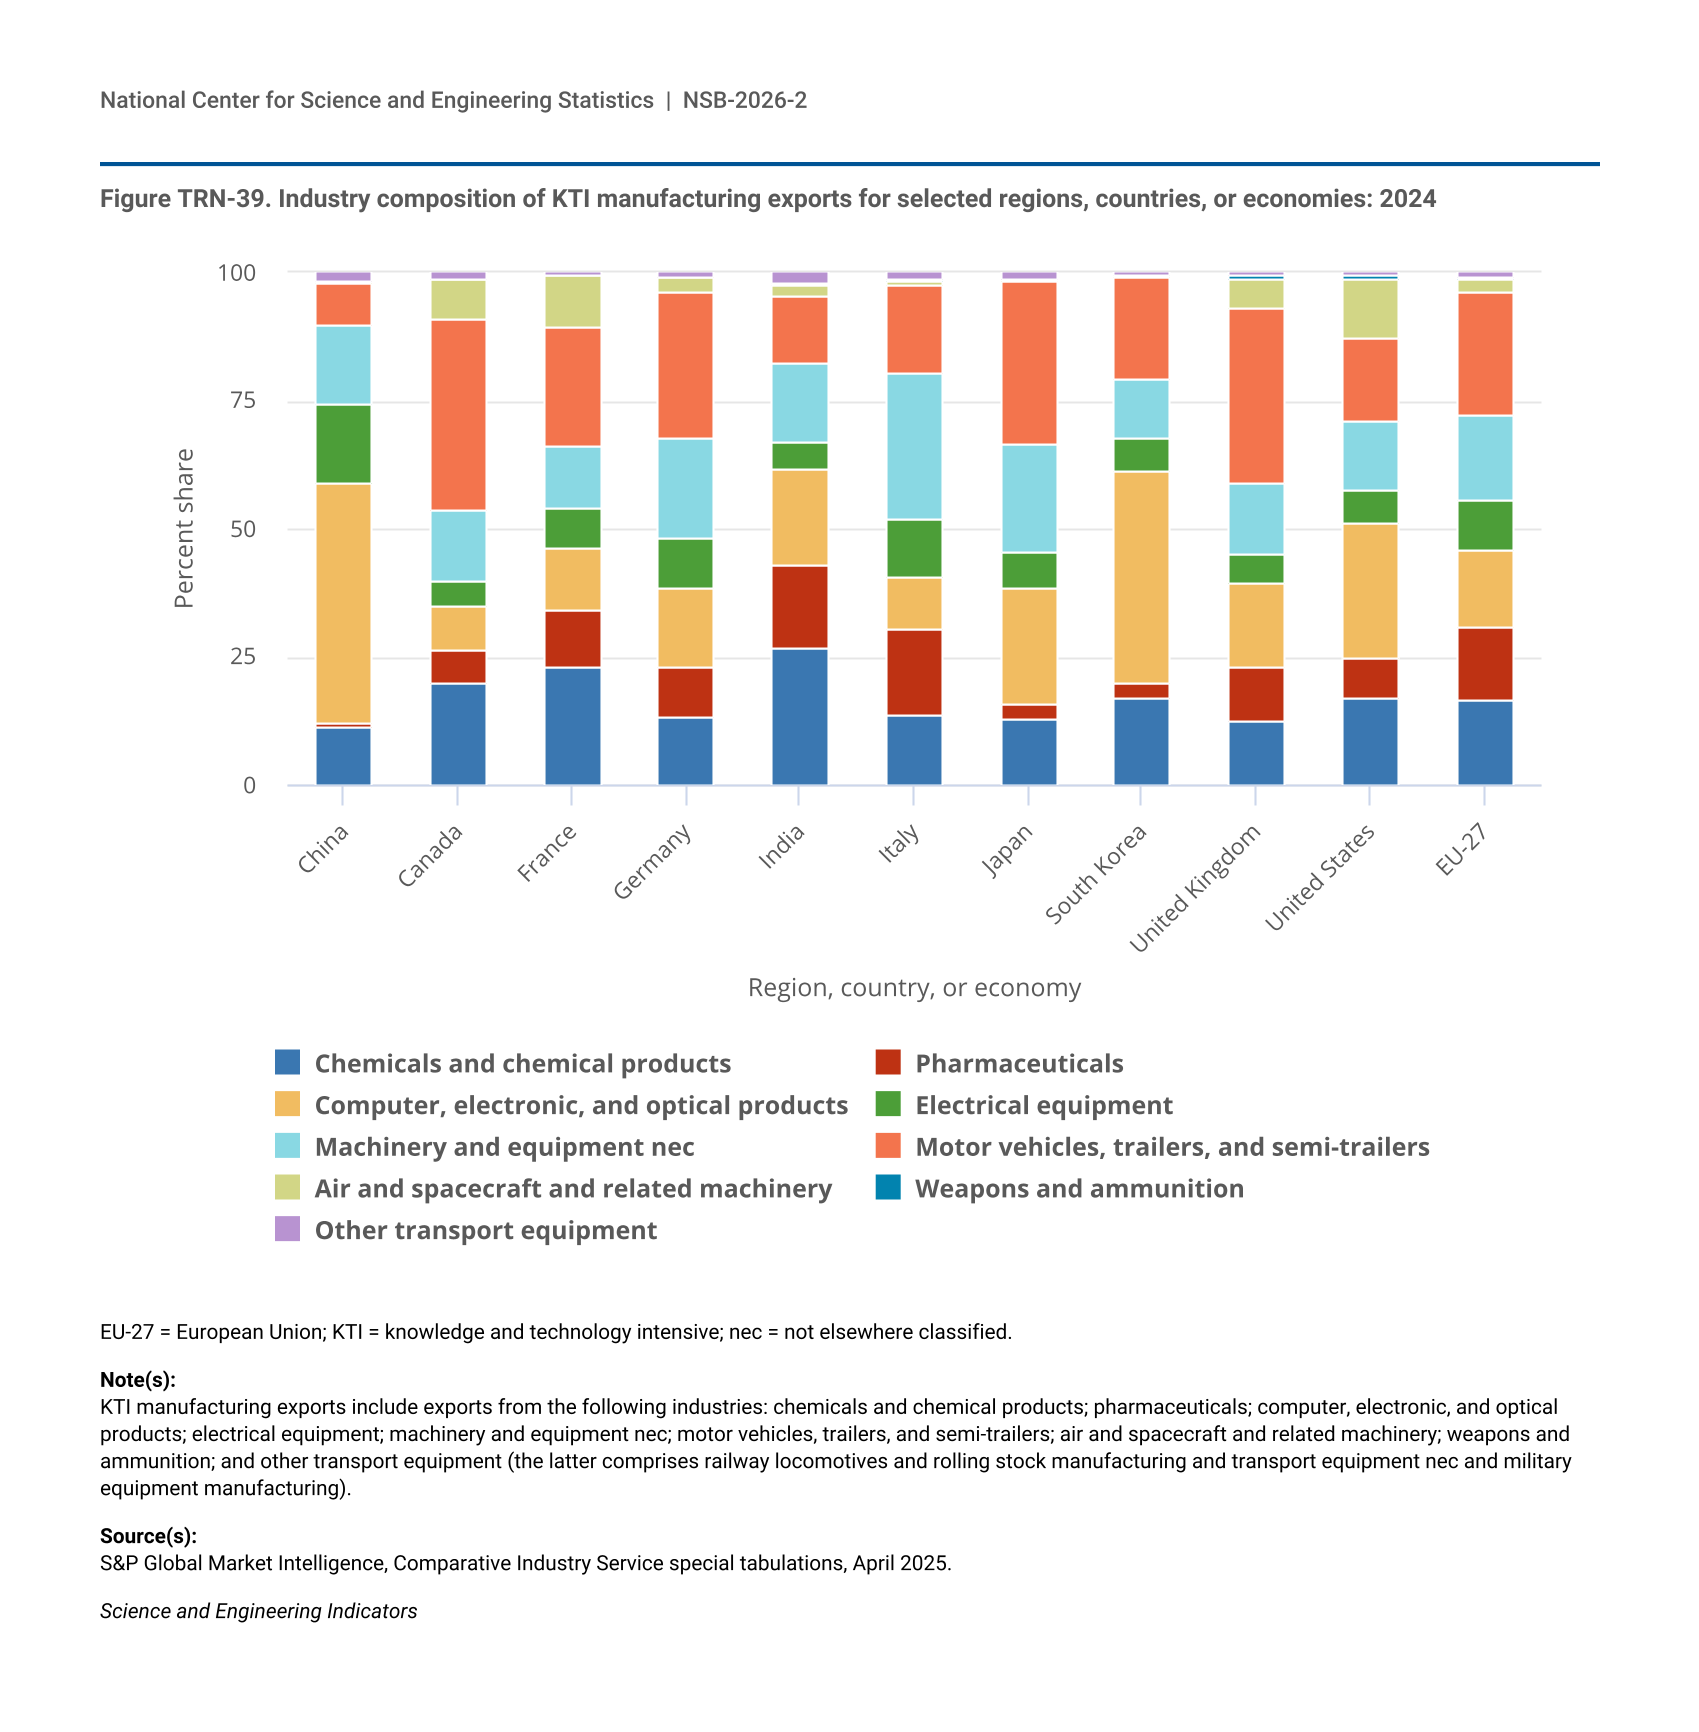
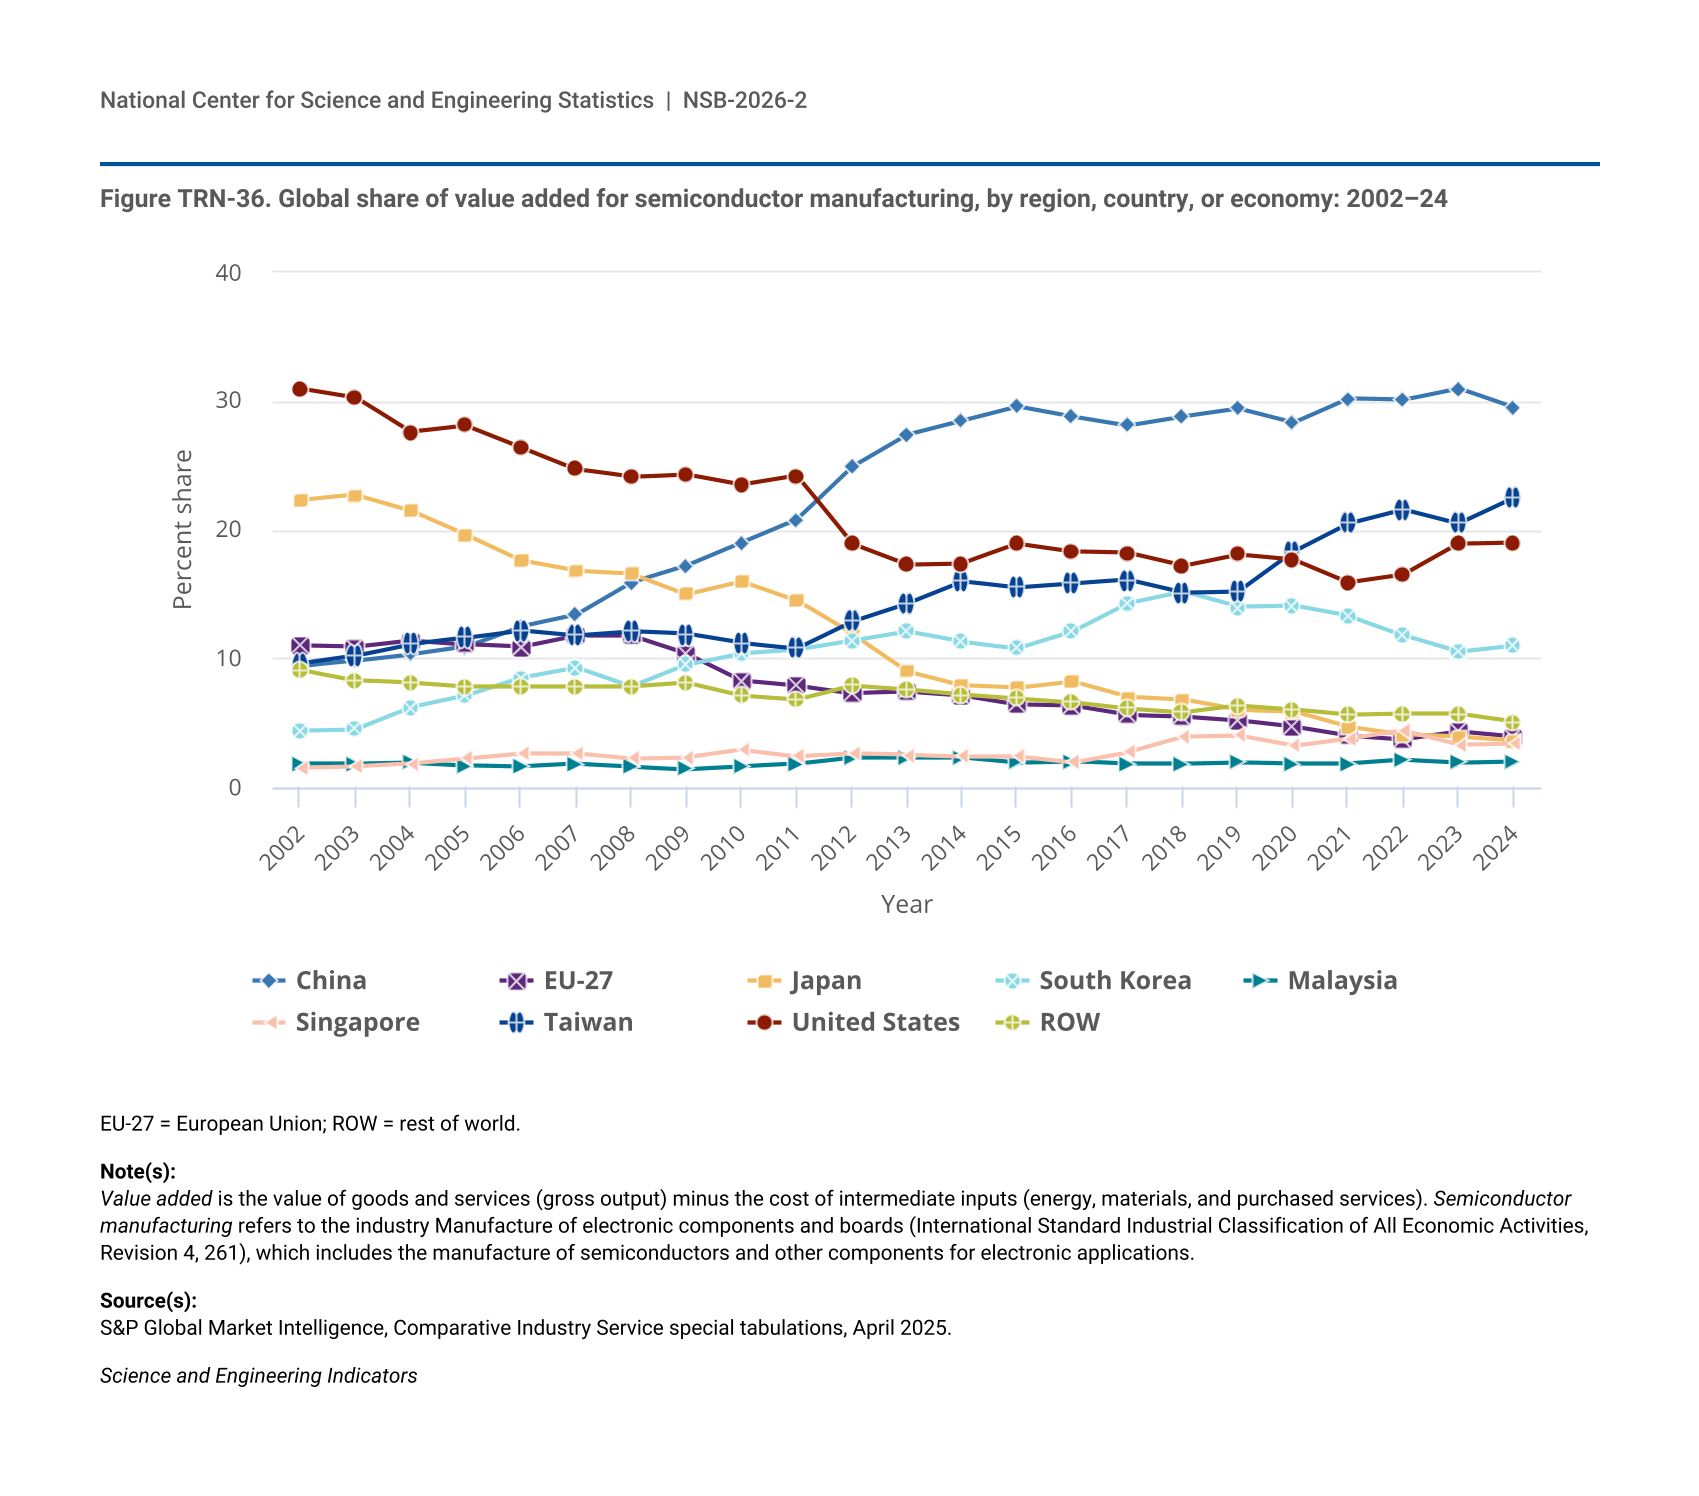
The distribution of KTI manufacturing industries within global economies reflects specialization and participation in global supply and production chains (Bontadini et al. 2024). Computer, electronic, and optical products industry exports (which include computer chips or semiconductors) accounted for the largest shares of KTI manufacturing exports from China (47%), South Korea (42%), and the United States (26%) in 2024, based on current U.S. dollars (Figure TRN-39). The motor vehicles, trailers, and semi-trailers industry exports (including EVs) accounted for the largest share of KTI manufacturing exports from Canada (37%), the United Kingdom (34%), Japan (32%), Germany (28%), and France (23%). The machinery and equipment nec industry accounted for the largest share of KTI manufacturing exports from Italy (28%), and the chemicals and chemical products industry accounted for the largest share of KTI manufacturing exports from India (27%) (Figure TRN-39).
| Region, country, or economy | Chemicals and chemical products | Pharmaceuticals | Computer, electronic, and optical products | Electrical equipment | Machinery and equipment nec | Motor vehicles, trailers, and semi-trailers | Air and spacecraft and related machinery | Weapons and ammunition | Other transport equipment |
|---|---|---|---|---|---|---|---|---|---|
| China | 11.2 | 1.0 | 46.9 | 15.3 | 15.6 | 8.1 | 0.3 | 0.0 | 1.6 |
| Canada | 20.1 | 6.3 | 8.4 | 4.9 | 14.0 | 37.3 | 7.6 | 0.1 | 1.3 |
| France | 23.1 | 10.9 | 12.3 | 7.7 | 12.1 | 23.0 | 10.2 | 0.0 | 0.5 |
| Germany | 13.2 | 10.1 | 15.3 | 9.8 | 19.2 | 28.4 | 2.9 | 0.1 | 0.8 |
| India | 27.0 | 16.0 | 18.7 | 5.5 | 15.2 | 13.2 | 2.2 | 0.2 | 2.1 |
| Italy | 13.7 | 16.6 | 10.3 | 11.4 | 28.4 | 17.2 | 0.6 | 0.3 | 1.4 |
| Japan | 13.1 | 2.7 | 22.7 | 7.0 | 21.3 | 31.6 | 0.5 | 0.0 | 1.1 |
| South Korea | 17.1 | 2.7 | 41.6 | 6.6 | 11.3 | 19.9 | 0.3 | 0.1 | 0.4 |
| United Kingdom | 12.7 | 10.3 | 16.5 | 5.5 | 14.0 | 34.1 | 5.7 | 0.7 | 0.5 |
| United States | 16.9 | 8.1 | 26.2 | 6.7 | 13.5 | 15.9 | 11.7 | 0.5 | 0.6 |
| EU-27 | 16.7 | 14.1 | 15.4 | 9.5 | 17.0 | 23.8 | 2.4 | 0.3 | 1.0 |
EU-27 = European Union; KTI = knowledge and technology intensive; nec = not elsewhere classified.
KTI manufacturing exports include exports from the following industries: chemicals and chemical products; pharmaceuticals; computer, electronic, and optical products; electrical equipment; machinery and equipment nec; motor vehicles, trailers, and semi-trailers; air and spacecraft and related machinery; weapons and ammunition; and other transport equipment (the latter comprises railway locomotives and rolling stock manufacturing and transport equipment nec and military equipment manufacturing).
S&P Global Market Intelligence, Comparative Industry Service special tabulations, April 2025.
Science and Engineering Indicators
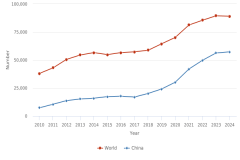
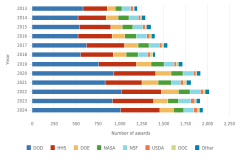
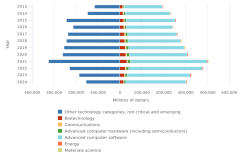
In 2024, the United States had a KTI manufacturing goods trade deficit of $794 billion in current U.S. dollars (Table STRN-45). Across all goods, the U.S. trade deficit was $1.2 trillion in 2024, compared with a deficit of $1.1 trillion in 2023 (BEA 2025b, Exhibit 5). China has had trade surpluses above $1 trillion in KTI goods since 2021, including $1.4 trillion in 2024 in current U.S. dollars, based on S&P Global data (Table STRN-45).