 An official website of the United States government
 Business Dynamics and Investment
Startups and Small Business Innovation Research
Business Dynamics Statistics
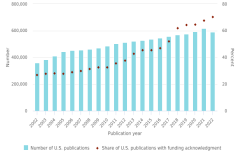
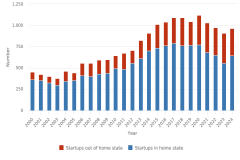
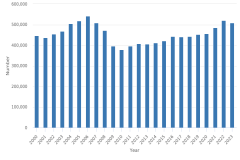
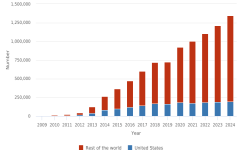
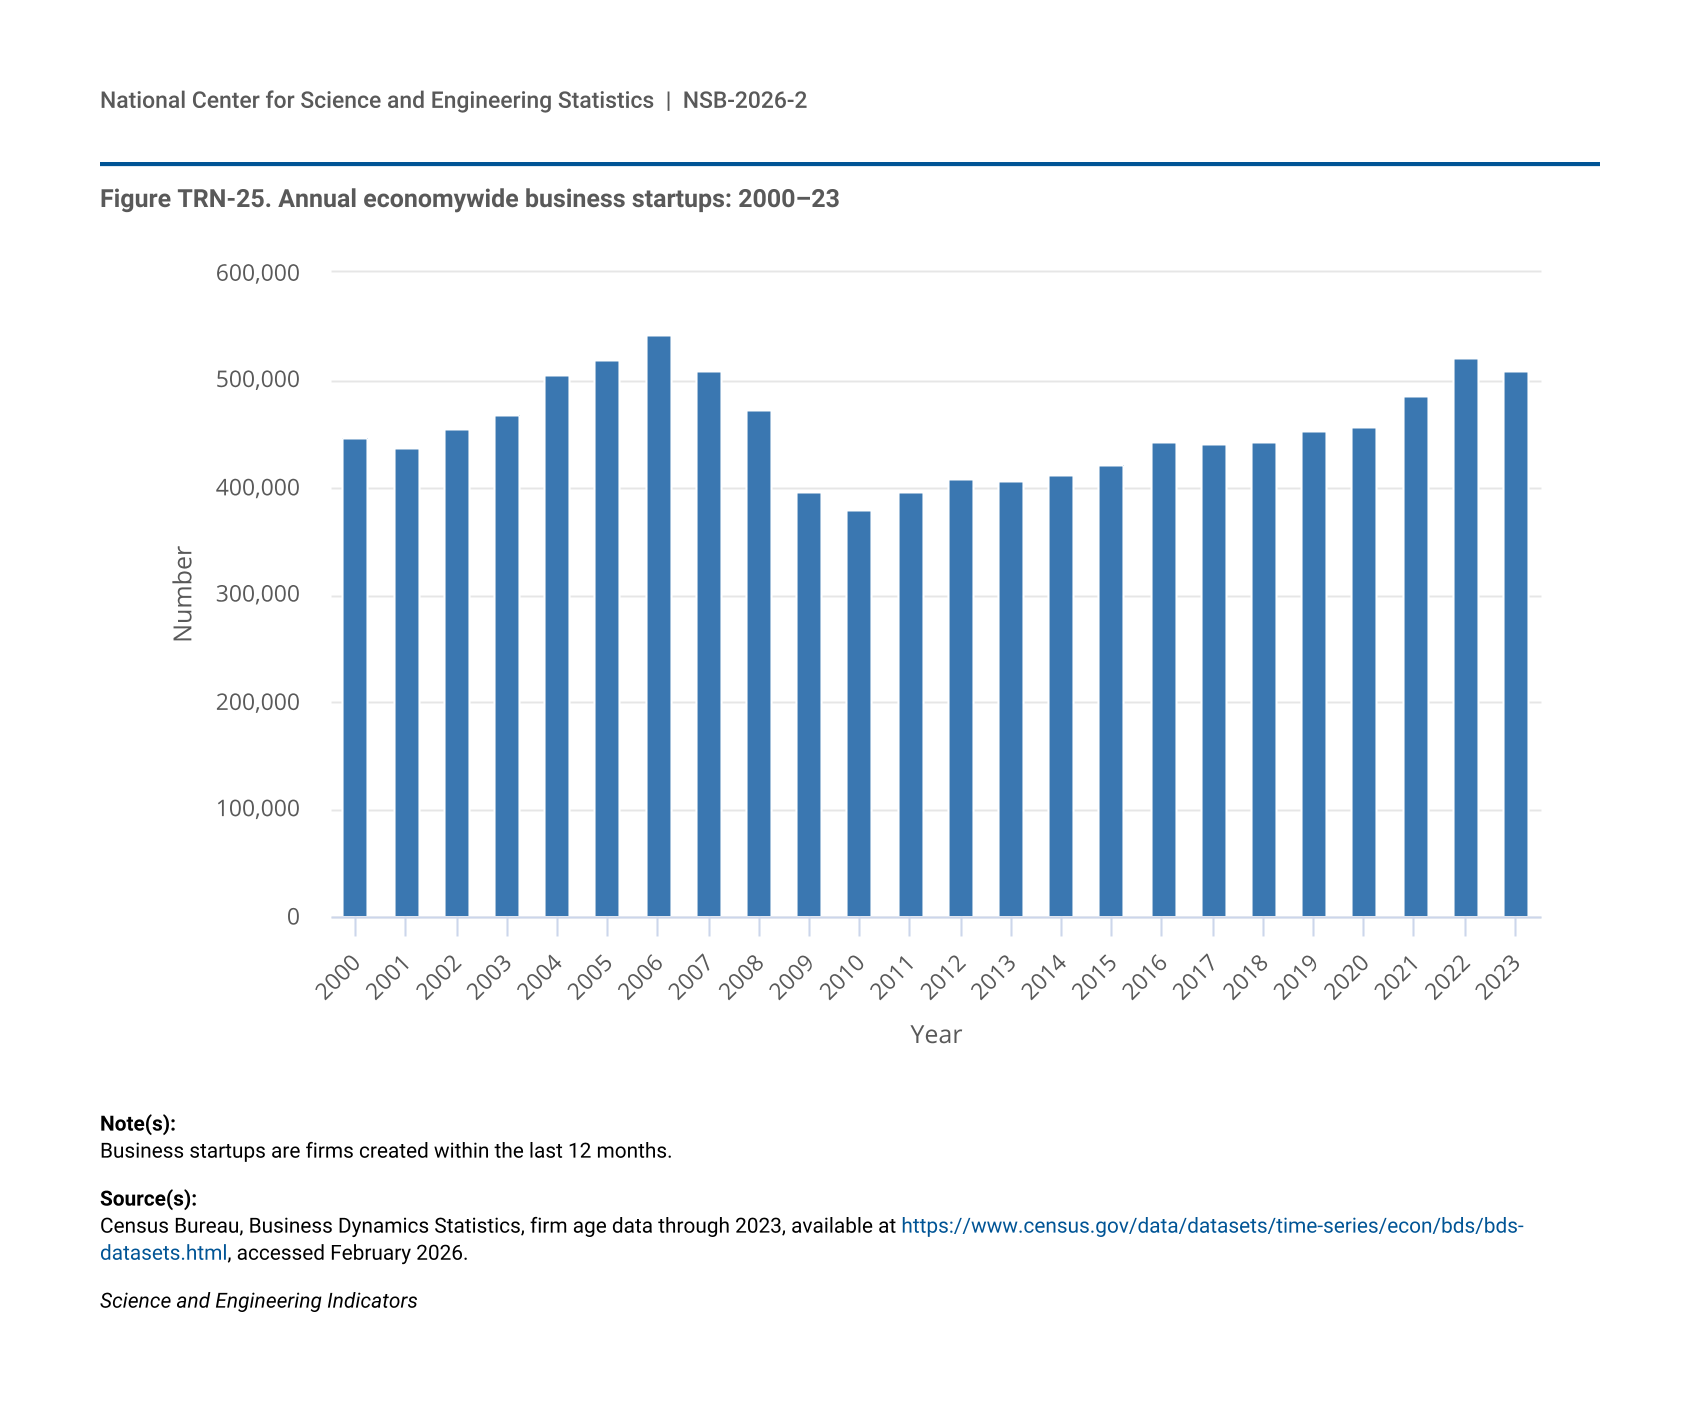
Startups (firms less than 1 year old) are major drivers of job growth and innovation in the United States (Audretsch et al. 2020; Decker et al. 2014; Kane 2010; NASEM 2022). Figure TRN-25 presents the number of new firms created each year between 2000 and 2023. Firm creation peaked in 2006 at 541,000 and declined in subsequent years during the global financial crisis of 2007–09. Since 2010 and through the COVID-19 pandemic, firm creation has continued trending upward, reaching 521,000 in 2022 and declining slightly to 509,000 in 2023, both still short of the 2006 peak.
| Year | Business startups |
|---|---|
| 2000 | 446,204 |
| 2001 | 436,993 |
| 2002 | 455,162 |
| 2003 | 467,532 |
| 2004 | 505,056 |
| 2005 | 518,727 |
| 2006 | 541,317 |
| 2007 | 509,517 |
| 2008 | 471,285 |
| 2009 | 395,235 |
| 2010 | 379,145 |
| 2011 | 395,680 |
| 2012 | 408,546 |
| 2013 | 405,350 |
| 2014 | 411,948 |
| 2015 | 421,155 |
| 2016 | 442,414 |
| 2017 | 439,859 |
| 2018 | 442,078 |
| 2019 | 453,027 |
| 2020 | 455,725 |
| 2021 | 485,256 |
| 2022 | 521,312 |
| 2023 | 508,777 |
Business startups are firms created within the last 12 months.
Census Bureau, Business Dynamics Statistics, firm age data through 2023, available at https://www.census.gov/data/datasets/time-series/econ/bds/bds-datasets.html, accessed February 2026.
Science and Engineering Indicators
Small Business Innovation Research
The Small Business Innovation Research (SBIR) and the Small Business Technology Transfer (STTR) programs are long-standing federal programs designed to enhance small businesses’ capacity to innovate and commercialize products. SBIR was created through the Small Business Innovation Development Act of 1982 (P.L. 97-219) and aims to “stimulate technological innovation in the U.S. economy through the investment of federal research and development (R&D) funds into innovative high-tech US small businesses” (SBA 2025a). STTR was created through the Small Business Research and Development Enhancement Act of 1992 (P.L. 102-564) and serves a similar purpose but focuses its support on “small businesses that pursue technological innovation through cooperative research and development with nonprofit scientific and educational research institutions” (SBA 2025a). Both programs consist of three phases: Phase I provides funding for feasibility studies; Phase II provides additional funding for R&D; and Phase III focuses on commercialization and provides no SBIR or STTR funding, although participants can pursue outside funding (NASEM 2022).
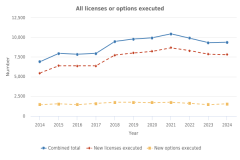
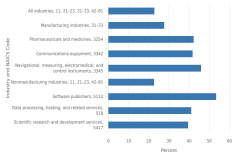
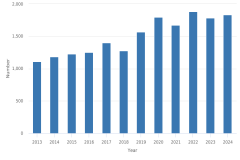
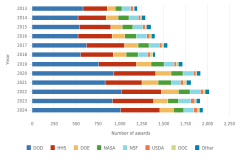
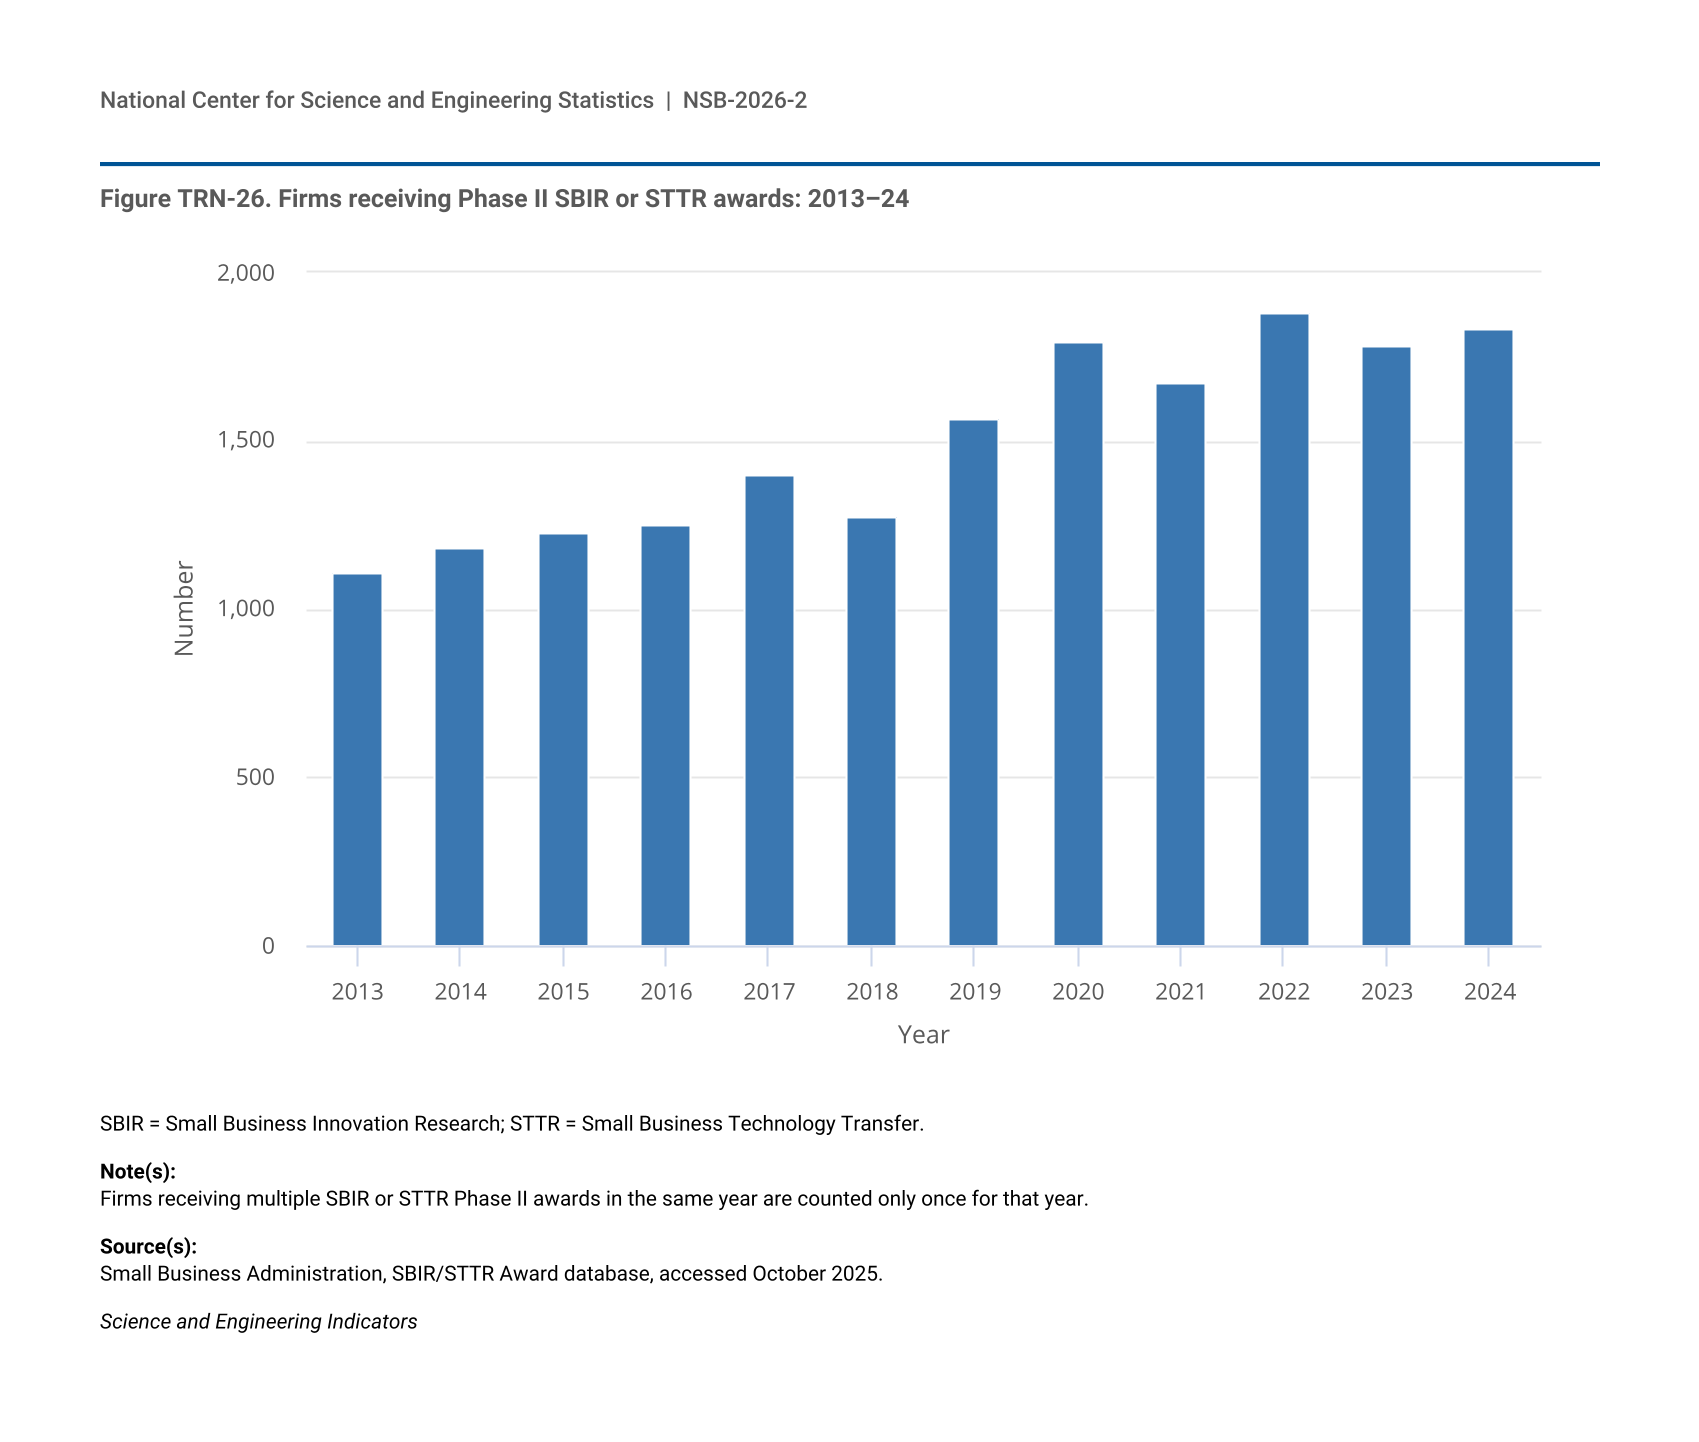
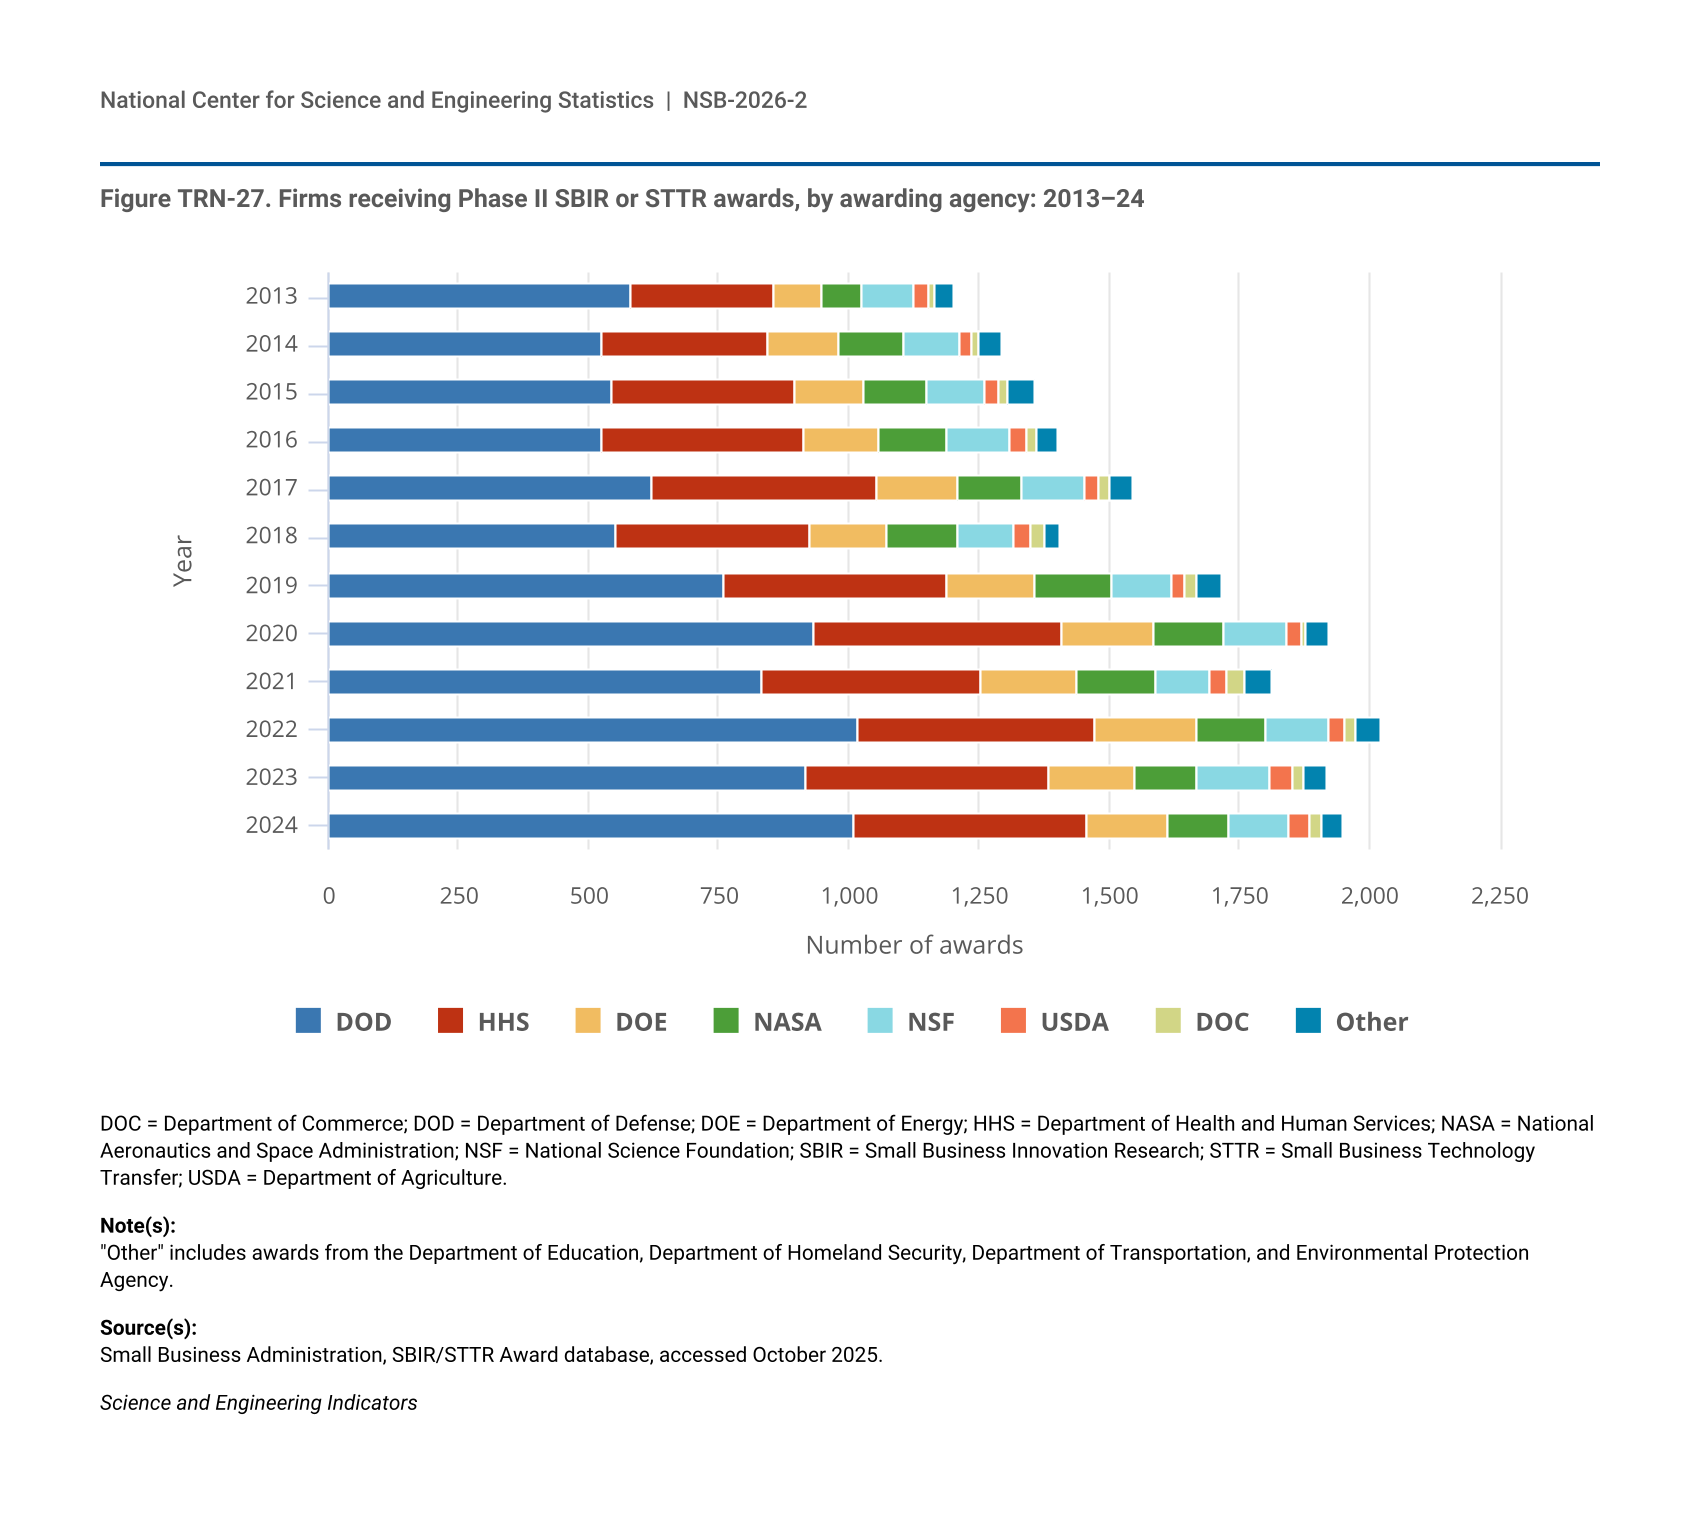
Federal agencies with over $100 million in R&D expenditures are required to spend 3.2% of their extramural research budget on their SBIR programs, and those with over $1 billion in R&D spending per year must also operate an STTR program, with funding set at 0.45% of that agency’s extramural budget (SBA 2023). Currently, 11 agencies operate SBIR or STTR programs. In 2024, 1,835 firms received Phase II SBIR or STTR awards, a slight increase from 2023 and in line with the upward trend over the last decade (Figure TRN-26) (SBA 2025b). Since 2013, DOD has provided awards to the largest share of small businesses, followed by HHS (Figure TRN-27).
| Year | Firms |
|---|---|
| 2013 | 1,107 |
| 2014 | 1,182 |
| 2015 | 1,226 |
| 2016 | 1,253 |
| 2017 | 1,402 |
| 2018 | 1,275 |
| 2019 | 1,565 |
| 2020 | 1,798 |
| 2021 | 1,672 |
| 2022 | 1,882 |
| 2023 | 1,783 |
| 2024 | 1,835 |
SBIR = Small Business Innovation Research; STTR = Small Business Technology Transfer.
Firms receiving multiple SBIR or STTR Phase II awards in the same year are counted only once for that year.
Small Business Administration, SBIR/STTR Award database, accessed October 2025.
Science and Engineering Indicators
| Year | DOD | HHS | DOE | NASA | NSF | USDA | DOC | Other |
|---|---|---|---|---|---|---|---|---|
| 2013 | 580 | 276 | 92 | 78 | 101 | 27 | 10 | 39 |
| 2014 | 523 | 323 | 133 | 124 | 109 | 25 | 12 | 45 |
| 2015 | 544 | 353 | 133 | 120 | 113 | 28 | 16 | 52 |
| 2016 | 526 | 388 | 144 | 133 | 117 | 33 | 21 | 40 |
| 2017 | 619 | 434 | 155 | 127 | 120 | 25 | 21 | 46 |
| 2018 | 551 | 372 | 148 | 138 | 108 | 34 | 25 | 30 |
| 2019 | 761 | 430 | 168 | 146 | 116 | 25 | 24 | 48 |
| 2020 | 932 | 479 | 174 | 138 | 120 | 28 | 8 | 41 |
| 2021 | 831 | 423 | 183 | 151 | 106 | 31 | 38 | 49 |
| 2022 | 1,018 | 454 | 199 | 129 | 121 | 34 | 19 | 47 |
| 2023 | 917 | 468 | 166 | 120 | 140 | 41 | 22 | 44 |
| 2024 | 1,007 | 449 | 159 | 114 | 116 | 42 | 22 | 42 |
DOC = Department of Commerce; DOD = Department of Defense; DOE = Department of Energy; HHS = Department of Health and Human Services; NASA = National Aeronautics and Space Administration; NSF = National Science Foundation; SBIR = Small Business Innovation Research; STTR = Small Business Technology Transfer; USDA = Department of Agriculture.
"Other" includes awards from the Department of Education, Department of Homeland Security, Department of Transportation, and Environmental Protection Agency.
Small Business Administration, SBIR/STTR Award database, accessed October 2025.
Science and Engineering Indicators
Venture Capital
Although VC funds only a small share of new private firms and provides a small share of overall funding compared with the overall U.S. private-sector investments, the size and number of investments are indicators of innovation activity because they fund a disproportionate number of pre-revenue companies that ultimately make public offerings (Lerner and Nanda 2020). Venture investors secure capital from large institutional investors, called limited partners (e.g., pension funds, university endowments, private equity funds, foundations), to invest in selected firms. VC-backed firms that become publicly traded are more likely to have recorded R&D expenditures compared with publicly traded firms that were not originally venture backed (Lerner and Nanda 2020).
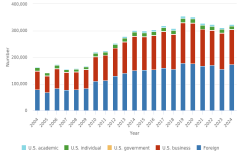
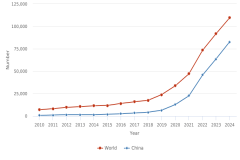
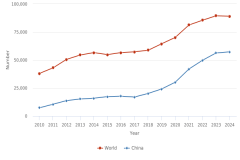
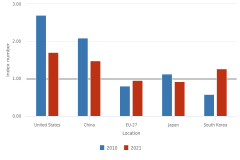
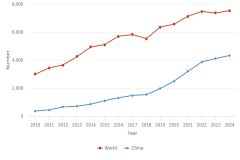
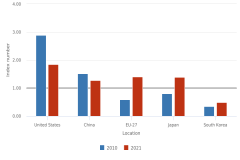
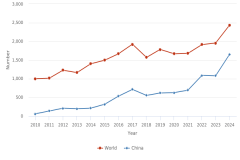
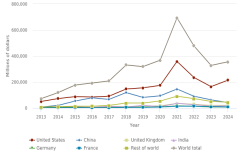
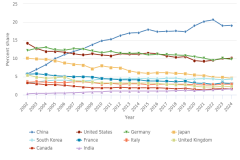
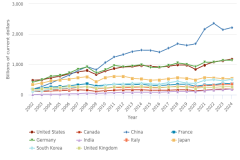
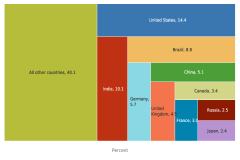
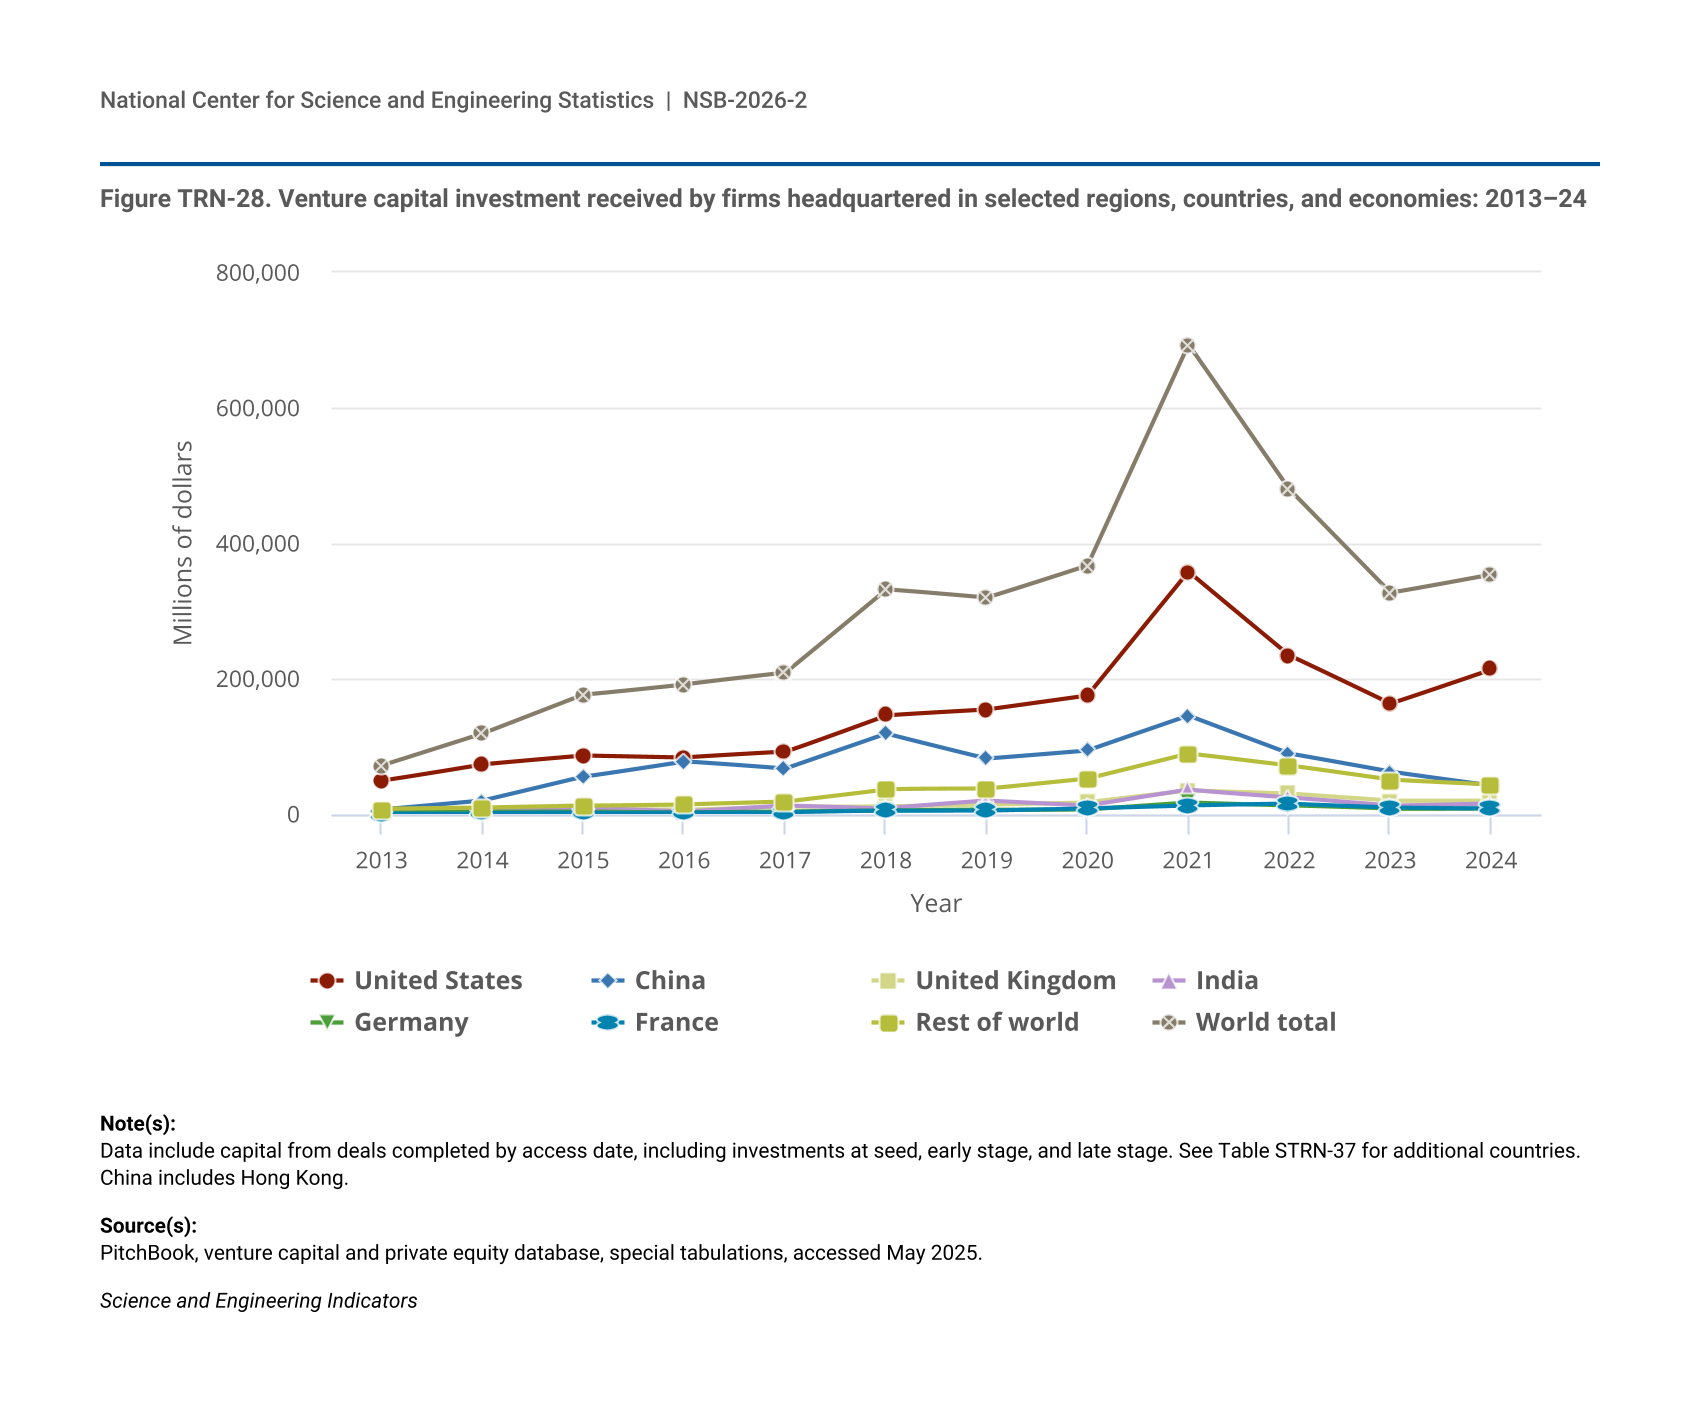
Between 2013 and 2021, worldwide VC investments grew from $71 billion to $694 billion before decreasing (53%) over the next 2 years to $327 billion in 2023. In 2024, worldwide VC investment increased to $354 billion (Figure TRN-28; Table STRN-37). The countries with the largest VC investments that year—the United States, China, the United Kingdom, India, Germany—each received its highest level of VC investment in 2021. Similar reporting also finds a peak in U.S. VC investment in 2021 (NVCA 2025). Between 2013 and 2024, firms in the United States consistently received the largest amount of VC investment. At their highest value in 2021, U.S. firms ($358 billion) received over twice the investment of firms headquartered in China ($145 billion). For a discussion of PitchBook’s international coverage, see the Technical Appendix.
| Year | United States | China | United Kingdom | India | Germany | France | Rest of world | World total |
|---|---|---|---|---|---|---|---|---|
| 2013 | 49,286 | 6,258 | 3,623 | 1,667 | 1,599 | 1,356 | 7,679 | 71,468 |
| 2014 | 73,838 | 19,504 | 4,487 | 6,598 | 3,093 | 1,542 | 9,701 | 118,763 |
| 2015 | 86,499 | 55,105 | 6,639 | 10,055 | 3,647 | 1,817 | 12,698 | 176,460 |
| 2016 | 83,511 | 78,220 | 6,083 | 4,169 | 2,352 | 3,035 | 14,725 | 192,095 |
| 2017 | 91,786 | 67,018 | 11,554 | 13,118 | 3,603 | 2,903 | 18,974 | 208,956 |
| 2018 | 146,302 | 118,604 | 11,793 | 8,639 | 5,070 | 4,788 | 36,925 | 332,122 |
| 2019 | 154,481 | 81,968 | 14,545 | 19,398 | 6,407 | 5,322 | 37,077 | 319,200 |
| 2020 | 175,206 | 94,108 | 17,770 | 12,237 | 7,292 | 8,413 | 52,401 | 367,427 |
| 2021 | 358,161 | 145,384 | 34,653 | 35,765 | 17,436 | 12,535 | 89,647 | 693,582 |
| 2022 | 234,750 | 89,549 | 30,021 | 24,782 | 12,964 | 15,278 | 71,558 | 478,902 |
| 2023 | 163,210 | 62,759 | 19,904 | 12,490 | 7,825 | 9,959 | 50,435 | 326,583 |
| 2024 | 214,015 | 42,670 | 20,746 | 15,908 | 8,784 | 8,635 | 43,386 | 354,144 |
Data include capital from deals completed by access date, including investments at seed, early stage, and late stage. See Table STRN-37 for additional countries. China includes Hong Kong.
PitchBook, venture capital and private equity database, special tabulations, accessed May 2025.
Science and Engineering Indicators
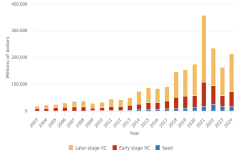
VC funding generally consists of three stages of investment: seed stage, early stage, and later stage. Seed investment refers to the initial capital raised by a firm, often in exchange for equity in the company, from investors to support product development, staffing, and validation of a business model (Metrick and Yasuda 2021). In early stage investments, firms have typically entered development phases, with an existing product in testing, pilot production, or early release, and may be for 3 or fewer years (Metrick and Yasuda 2021). Later-stage VC generally invests in firms in their initial expansion or in a stable growth stage when they have an established product inventory and distribution system (Metrick and Yasuda 2021). Because seed-stage and early stage firms have a high rate of failure, venture investors deploy capital across a portfolio of these firms, expecting that one successful investment will compensate for those that yield no returns (Lerner and Nanda 2020).
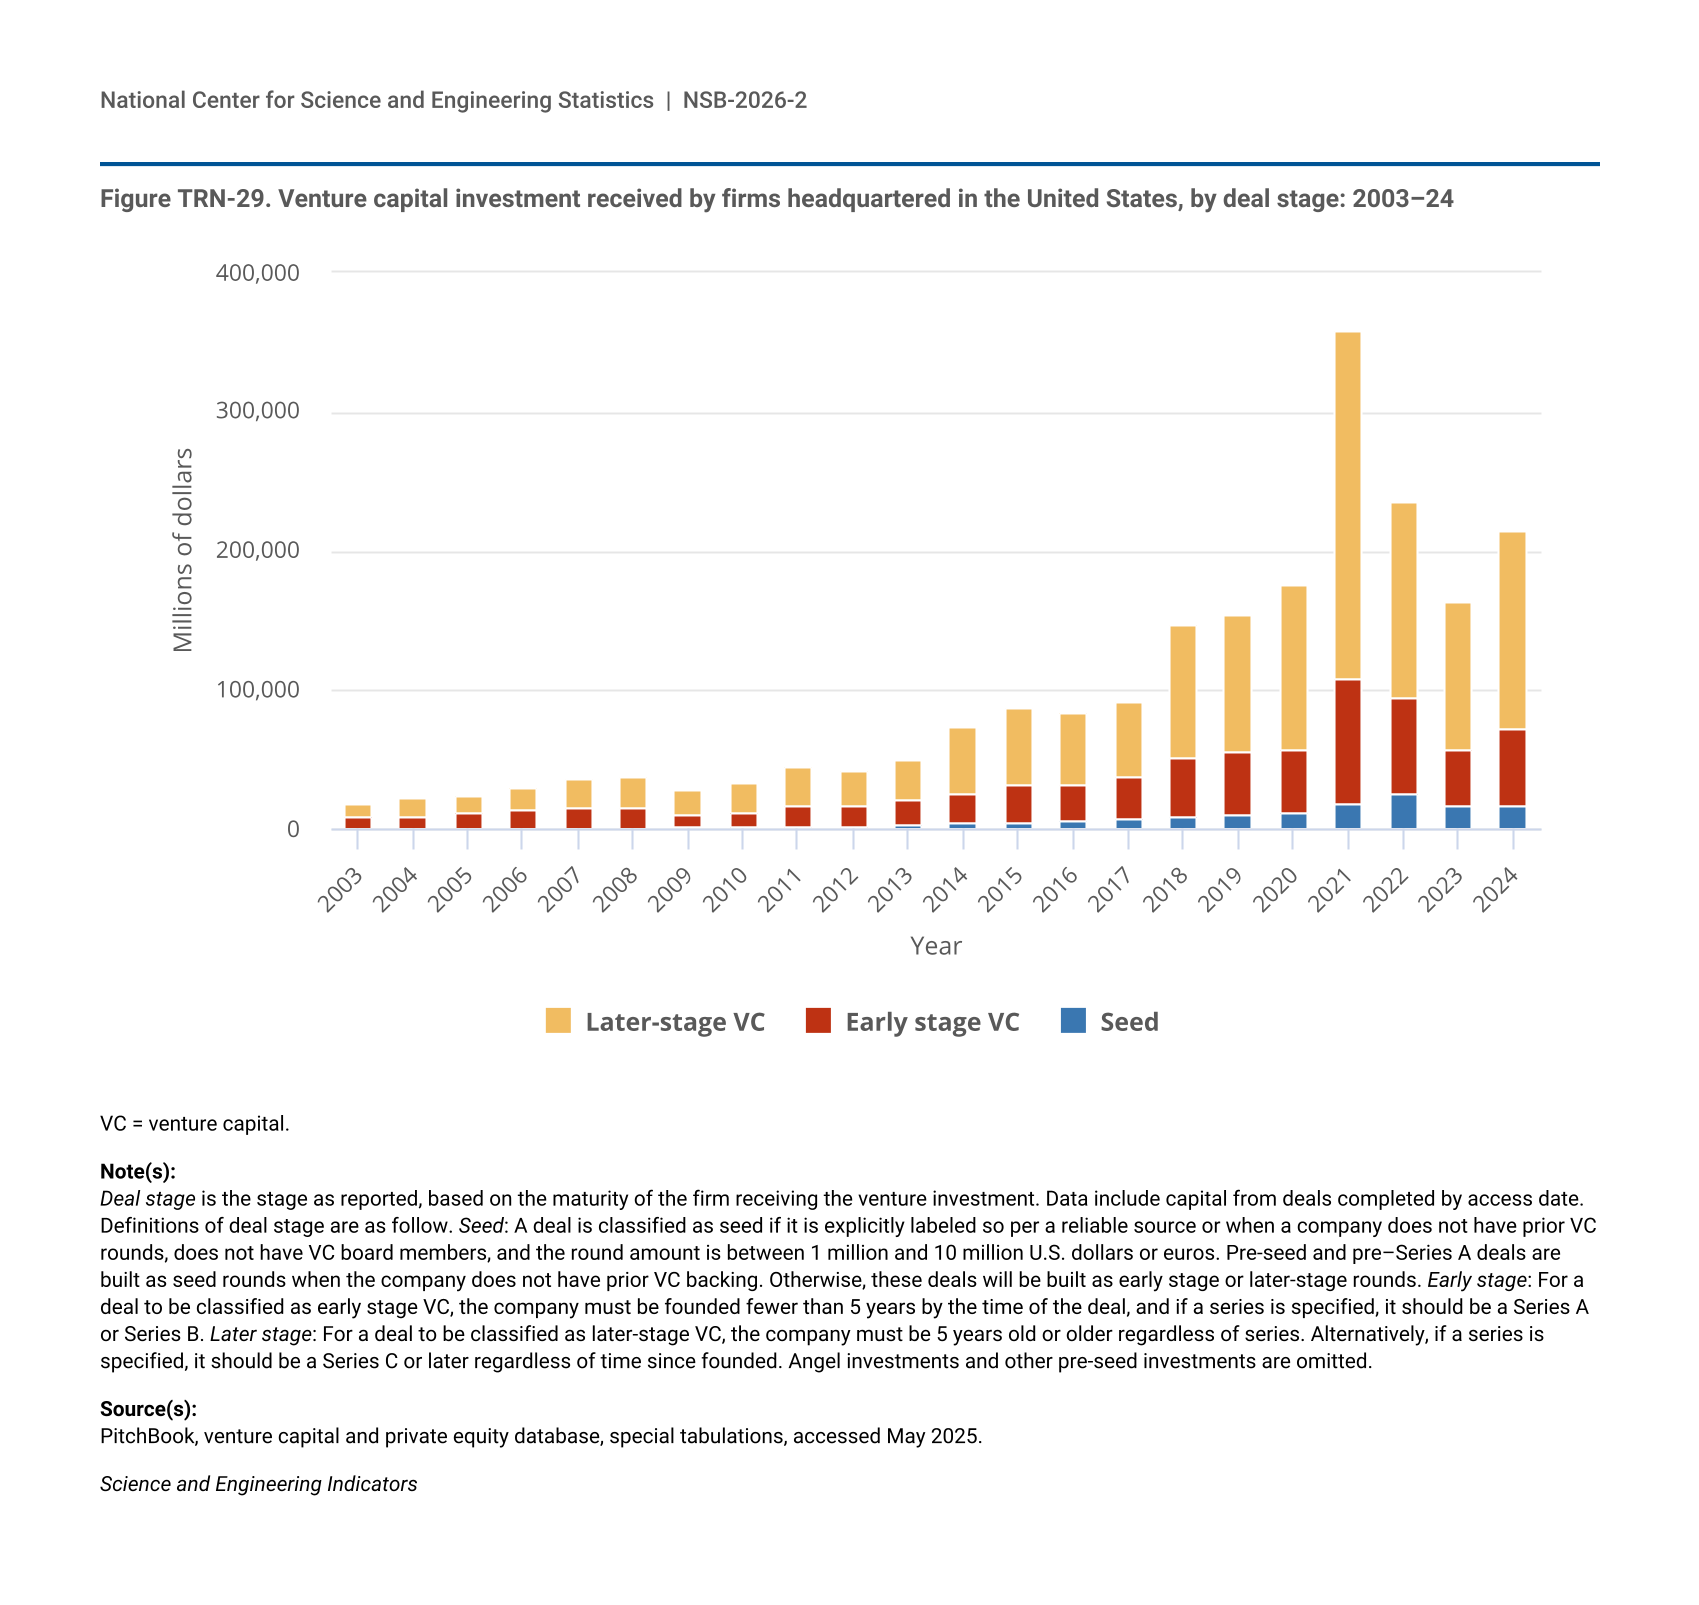
Over half of VC investments in U.S. firms between 2003 and 2024 involved later-stage VC funding (Figure TRN-29). Early stage and later-stage VC funding followed a similar pattern to overall trends, growing from 2003 to a peak in 2021 before decreasing until 2024, while seed-stage VC peaked in 2022. Although seed-stage VC funding increased from $11 billion to $18 billion and early stage funding increased from $45 billion to $89 billion from 2020 to 2021, the peak in 2021 was driven by later-stage funding, which more than doubled from $118 billion to $251 billion and comprised 70% of VC investments that year. The share of early stage VC funding has gradually decreased, from 46% of VC funding in 2003 to 26% in 2024. The share of seed-stage VC funding has gradually increased from 0.5% in 2003 ($95 million) to 11% and $25 billion in 2022 before only a moderate decrease to 7% in 2024. However, the share of later-stage VC funding has also gradually expanded, from 53% in 2003 to 67% ($142 billion) in 2024.
| Year | Seed | Early stage VC | Later-stage VC |
|---|---|---|---|
| 2003 | 95 | 8,506 | 9,871 |
| 2004 | 194 | 9,179 | 12,635 |
| 2005 | 147 | 11,328 | 12,675 |
| 2006 | 231 | 12,860 | 17,112 |
| 2007 | 298 | 14,394 | 21,655 |
| 2008 | 351 | 14,933 | 21,918 |
| 2009 | 767 | 9,728 | 17,266 |
| 2010 | 971 | 11,579 | 19,666 |
| 2011 | 1,548 | 14,364 | 29,271 |
| 2012 | 2,176 | 13,742 | 25,472 |
| 2013 | 3,224 | 17,234 | 28,835 |
| 2014 | 4,025 | 21,753 | 48,086 |
| 2015 | 5,145 | 26,362 | 55,012 |
| 2016 | 5,526 | 25,833 | 52,152 |
| 2017 | 7,021 | 30,107 | 54,658 |
| 2018 | 9,679 | 41,552 | 95,075 |
| 2019 | 9,776 | 45,053 | 99,661 |
| 2020 | 11,429 | 45,386 | 118,390 |
| 2021 | 18,294 | 88,973 | 250,881 |
| 2022 | 25,036 | 69,453 | 140,196 |
| 2023 | 16,021 | 40,484 | 106,697 |
| 2024 | 15,917 | 55,682 | 142,303 |
VC = venture capital.
Deal stage is the stage as reported, based on the maturity of the firm receiving the venture investment. Data include capital from deals completed by access date. Definitions of deal stage are as follow. Seed: A deal is classified as seed if it is explicitly labeled so per a reliable source or when a company does not have prior VC rounds, does not have VC board members, and the round amount is between 1 million and 10 million U.S. dollars or euros. Pre-seed and pre–Series A deals are built as seed rounds when the company does not have prior VC backing. Otherwise, these deals will be built as early stage or later-stage rounds. Early stage: For a deal to be classified as early stage VC, the company must be founded fewer than 5 years by the time of the deal, and if a series is specified, it should be a Series A or Series B. Later stage: For a deal to be classified as later-stage VC, the company must be 5 years old or older regardless of series. Alternatively, if a series is specified, it should be a Series C or later regardless of time since founded. Angel investments and other pre-seed investments are omitted.
PitchBook, venture capital and private equity database, special tabulations, accessed May 2025.
Science and Engineering Indicators
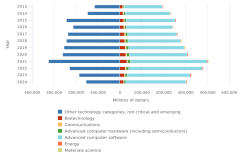
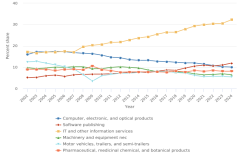
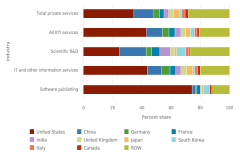
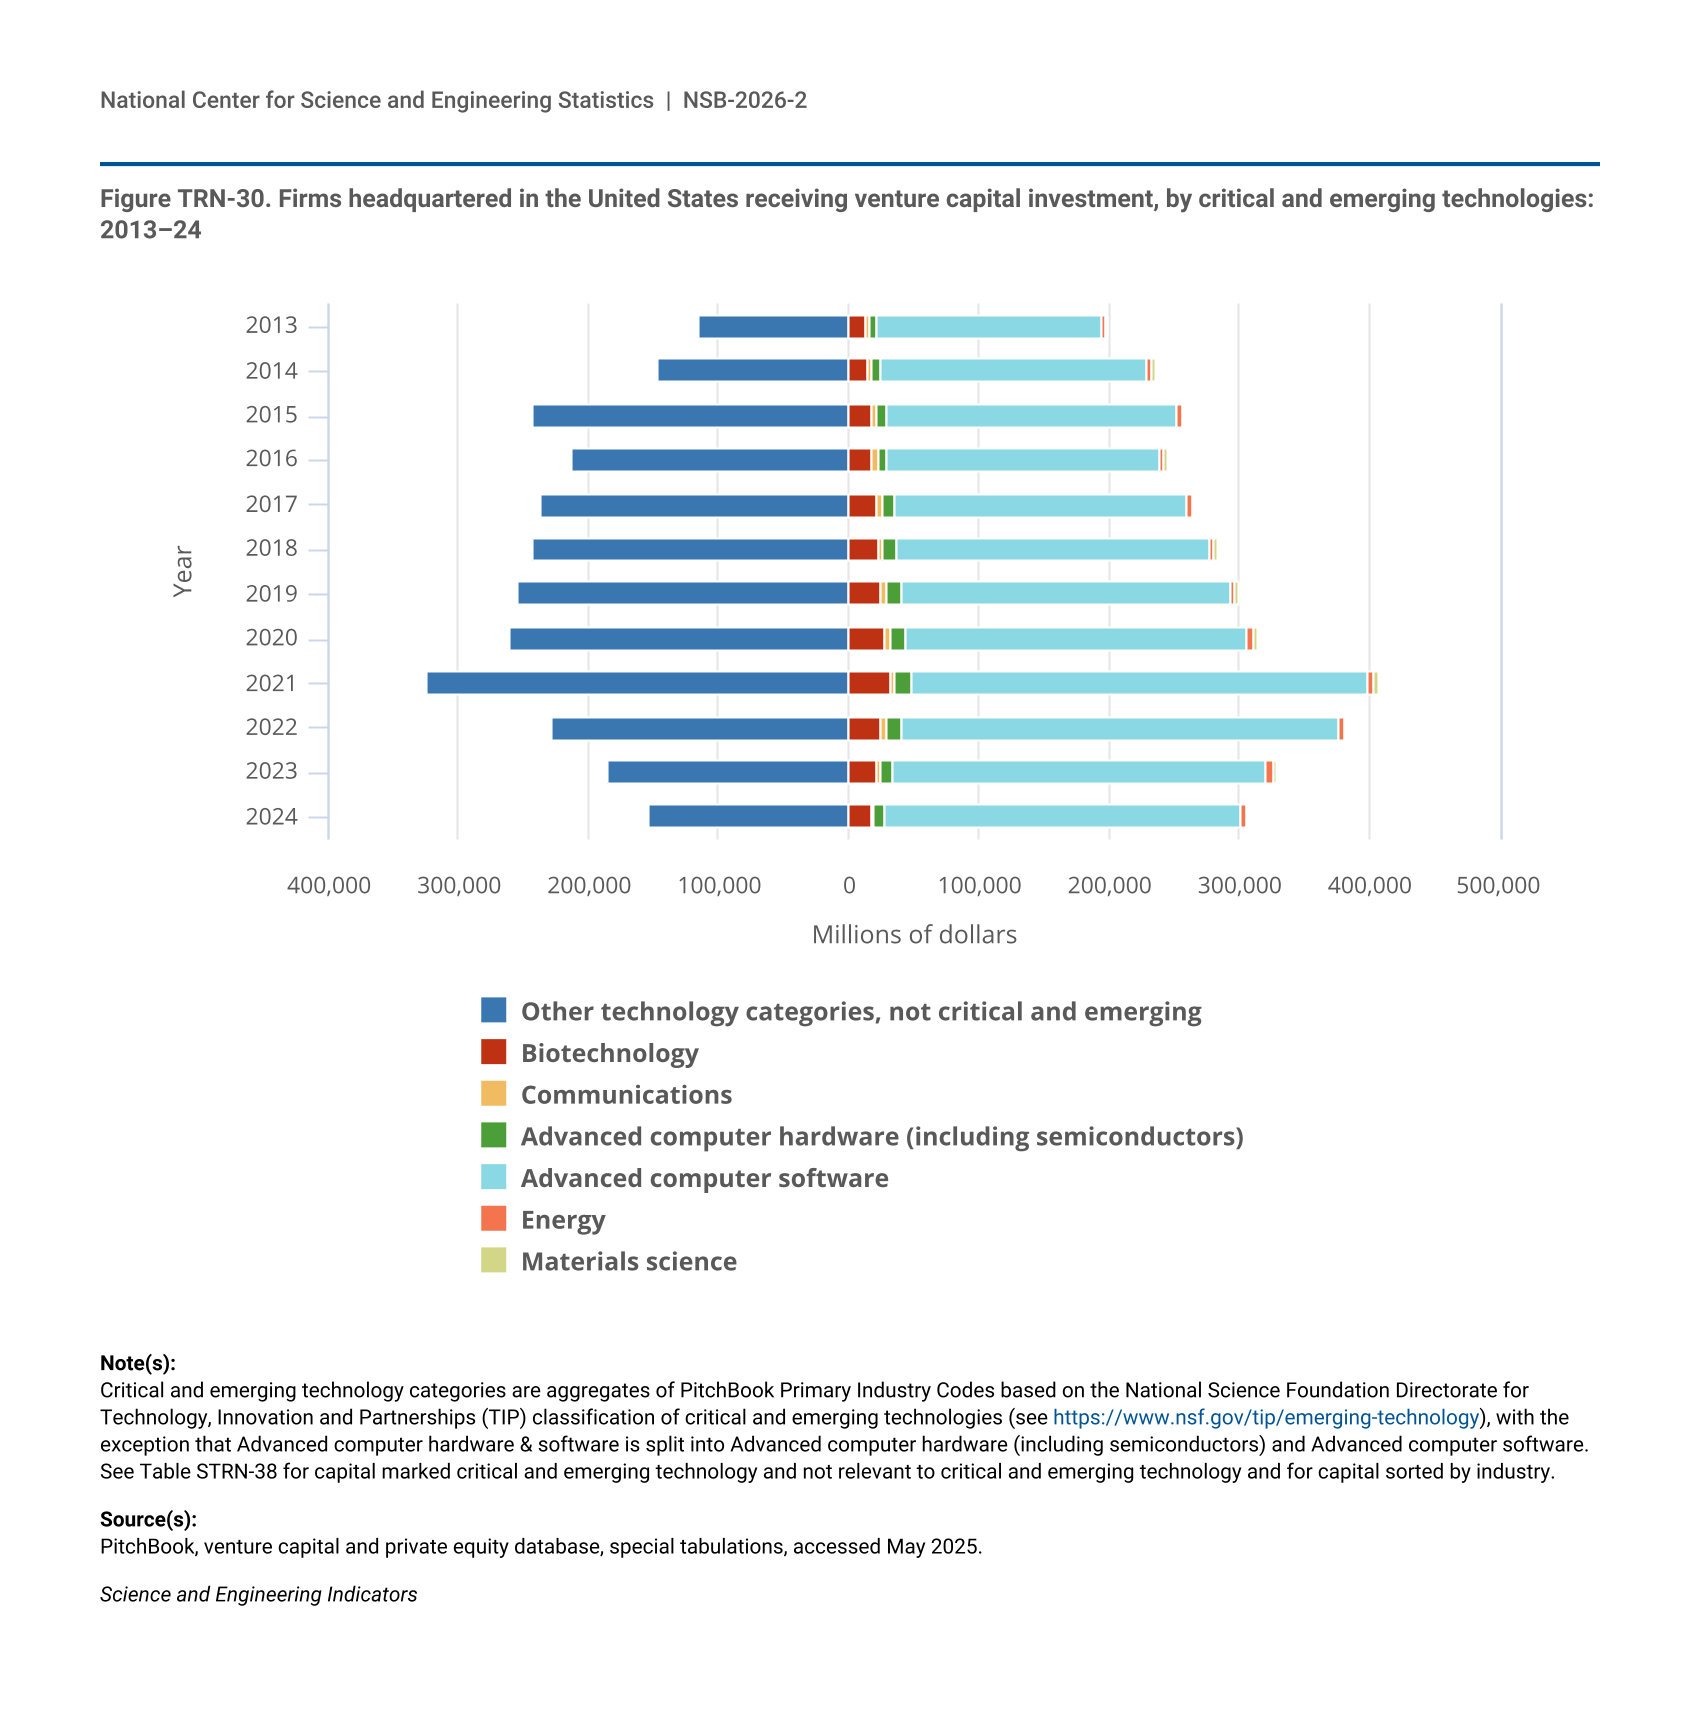
VC investments can support firms developing CETs in the United States. The classification of CET areas developed by NSF TIP (see section Technology Transfer Metrics) was used to examine the share of VC investments funding these technologies in the United States (NSB 2024). Each year from 2013 to 2024, over half of all VC investments in the United States funded firms in CET areas, ranging between 52% and 67% (Figure TRN-30). (VC does fund a broader range of industries; see Table STRN-38.) VC investments in U.S. firms developing computer software consistently accounted for the largest share among all CET areas between 2013 and 2024, receiving over 80% of VC funding in CET areas and between 44% and 59% of all U.S. VC funding each year (Figure TRN-30). VC tends to fund software publishing or other industries with “large uncertainty about an idea’s potential that can nonetheless be resolved quickly” (Lerner and Nanda 2020). This observation may contextualize the differences in the share of VC invested in software publishing in the United States and the share of software publishing within total KTI nonmanufacturing value added in the United States (see the section U.S. Industries). VC funding for U.S. companies developing computer software peaked at $352 billion in 2021 and was $274 billion in 2024.
| Year | Other technology categories, not critical and emerging | Biotechnology | Communications | Advanced computer hardware (including semiconductors) | Advanced computer software | Energy | Materials science |
|---|---|---|---|---|---|---|---|
| 2013 | 114,656 | 12,564 | 3,576 | 5,020 | 173,600 | 2,690 | 1,454 |
| 2014 | 146,992 | 14,076 | 4,060 | 6,576 | 205,152 | 3,326 | 1,870 |
| 2015 | 242,562 | 17,448 | 4,470 | 7,744 | 222,880 | 3,726 | 2,434 |
| 2016 | 213,138 | 18,000 | 4,022 | 7,932 | 209,408 | 3,062 | 2,254 |
| 2017 | 236,960 | 21,756 | 4,086 | 9,080 | 225,472 | 3,422 | 2,556 |
| 2018 | 243,556 | 22,992 | 3,714 | 10,724 | 239,744 | 3,250 | 2,692 |
| 2019 | 254,348 | 25,044 | 4,420 | 10,184 | 254,304 | 3,406 | 2,562 |
| 2020 | 260,458 | 27,408 | 4,472 | 11,148 | 264,000 | 3,978 | 2,616 |
| 2021 | 324,336 | 31,644 | 4,542 | 11,900 | 351,552 | 4,908 | 2,884 |
| 2022 | 228,074 | 24,852 | 4,186 | 10,824 | 336,704 | 4,692 | 2,552 |
| 2023 | 184,762 | 20,916 | 3,644 | 9,256 | 287,392 | 5,094 | 2,314 |
| 2024 | 153,232 | 17,292 | 3,034 | 7,672 | 273,600 | 4,472 | 1,570 |
Critical and emerging technology categories are aggregates of PitchBook Primary Industry Codes based on the National Science Foundation Directorate for Technology, Innovation and Partnerships (TIP) classification of critical and emerging technologies (see https://www.nsf.gov/tip/emerging-technology), with the exception that Advanced computer hardware & software is split into Advanced computer hardware (including semiconductors) and Advanced computer software. See Table STRN-38 for capital marked critical and emerging technology and not relevant to critical and emerging technology and for capital sorted by industry.
PitchBook, venture capital and private equity database, special tabulations, accessed May 2025.
Science and Engineering Indicators
Biotechnology received the next-largest share of VC funding among CET areas, from 2013 to 2024, accounting for between 6% and 9% each year. VC funding for U.S. firms engaged in developing and producing biotechnology products and services peaked at $32 billion in 2021 and was $17 billion in 2024. VC investments in U.S. firms developing and producing computer hardware, a CET area that includes semiconductors, also reached their highest level in 2021 at $12 billion and have since decreased to $8 billion in 2024. Table TRN-5 shows the 20 U.S.-based companies with the highest amount of VC raised in 2024. Many firms on this list strongly feature AI components in their offered products or services, including the top 5 firms: xAI, Databricks, Anthropic, OpenAI, and Waymo.
Data include capital from deals completed by access date, including investments at seed, early stage, and later stage.
PitchBook, accessed November 2025.
Science and Engineering Indicators