 An official website of the United States government
 Knowledge and Technology Transfer
Knowledge arising from publicly funded R&D supports the production of new technologies and processes as that knowledge is adopted by the private sector. This takes place through formal mechanisms, such as licensing agreements and cooperative R&D agreements, as well as through coauthorship between private- and public-sector researchers. Technology developed in universities and government laboratories can be licensed and used by private-sector companies, including startups. Federal agencies collect technology transfer metrics for technologies that they license and then report them to the National Institute of Standards and Technology (NIST). Many universities report data on these activities to the professional society AUTM, which serves the university technology transfer community (AUTM 2025); its data are used in this report.
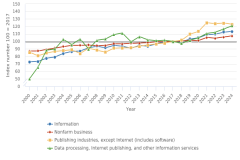
Additional indicators on federal agency, federal laboratory, and university technology transfer included in this section are tabulated from the Scopus bibliometric database, the Patent and Trademark Office (USPTO), and GitHub. In addition to these indicators, the overall number of publications in the United States with business sector authors is reported in the Indicators 2026 report “Discovery: R&D Activity and Research Publications” (NSB 2025: Figure DISC-25). These publications have decreased in recent years, from over 58,000 in 2008 to just over 51,000 in 2023, while an increasing share of these articles was published collaboratively with authors outside the business sector. These trends show that while output from the business sector is declining as total output has mostly grown, there is growing collaboration with business and nonbusiness interests thus promoting knowledge transfer in scientific publications.
Lastly, data on patenting serves as a useful indicator for knowledge and technology transfer. In this section, both utility patents from the USPTO and priority patent families, an international patent classification, are presented alongside the international impact of priority patent families through citation analysis. Indicators are presented for five highlighted CETs: AI, biotechnology, semiconductors, QIST, and nuclear energy.
Technology Transfer Metrics
Federal Agency Activity
U.S. federal agencies frequently engage in processes and activities that support the translation of knowledge arising from R&D for wider use. Federal agencies achieve this through funding R&D activities broadly, and employees of agencies engage in activities such as patenting, publishing, and creating OSS to move the S&E enterprise forward. These contributions create scientific impact by creating new knowledge, in the case of federal funding, or by translating federal R&D expenditures into an array of outputs and are important to track in terms of scientific impact.
Past reports have presented technology transfer data from NIST, which released data provided by individual agencies on these topics, including Federal Laboratory Technology Transfer, Fiscal Year 2020: Summary Report to the President and the Congress (2022). Since the publication of the Indicators 2024 report “Invention, Knowledge Transfer, and Innovation” (NSB 2024), NIST has not released a new report summarizing these data, but the previous report displayed trends on cooperative R&D agreements (CRADAs) and invention disclosures from employees at select federal agencies. Researchers at federal agencies are required to report the development of new techniques and technologies in the form of invention disclosures, whereas CRADAs involve the coordination of a federal agency or laboratory with one or more nonfederal organizations in which the nonfederal organization provides resources for research activities and in exchange receives the option of exclusive license of any newly produced technologies. Together, these indicators help track federal R&D expenditures or research space—this results in future instances of technology transfer through the development of new technologies and how they are shared.
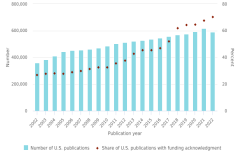
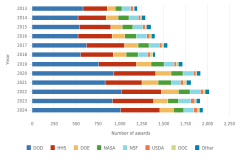
Federal agencies obligate billions of dollars yearly to support basic and applied research (NSB Indicators 2026: Figure DISC-16), and an observable outcome of these obligations is the creation of new knowledge shared in peer-reviewed scientific articles that cite federal support. Table TRN-2 displays the number of published scientific articles from 2002 to 2022 that acknowledged receiving funding from federal agencies, as well as the concentration of those articles that are among the most highly cited articles (HCAs) globally. Nine federal agencies had more than 20,000 scientific articles that acknowledged federal funding. The top agencies included the Department of Health and Human Services (HHS), largely driven by the National Institutes of Health (1,886,755 articles supported), NSF (879,448 articles), and the Department of Energy (DOE) (245,185 articles). The HCA ratio shows the concentration of those articles, which are among the top 1% most cited globally. For an article to be classified in the top 1% globally, it must receive more citations in future work than 99% of the articles in its given scientific field (NSB Indicators 2026: Figure DISC-27). An HCA ratio greater than 1.0 means that more than 1% of those articles featured in the global top 1%, demonstrating considerable scientific impact. In this case, all nine agencies identified earlier had an HCA ratio greater than 1.0, and six agencies had a ratio greater than 2.0. The agencies with the highest HCA ratios were the Department of Defense (DOD) (3.70), DOE (2.94), and NSF (2.71). For more detail and subagency components, see Table STRN-1.
DOC = Department of Commerce; DOD = Department of Defense; DOE = Department of Energy; DOI = Department of the Interior; EPA = Environmental Protection Agency; HHS = Department of Health and Human Services; NASA = National Aeronautics and Space Administration; NSF = National Science Foundation; USDA = Department of Agriculture; VA = Department of Veterans Affairs.
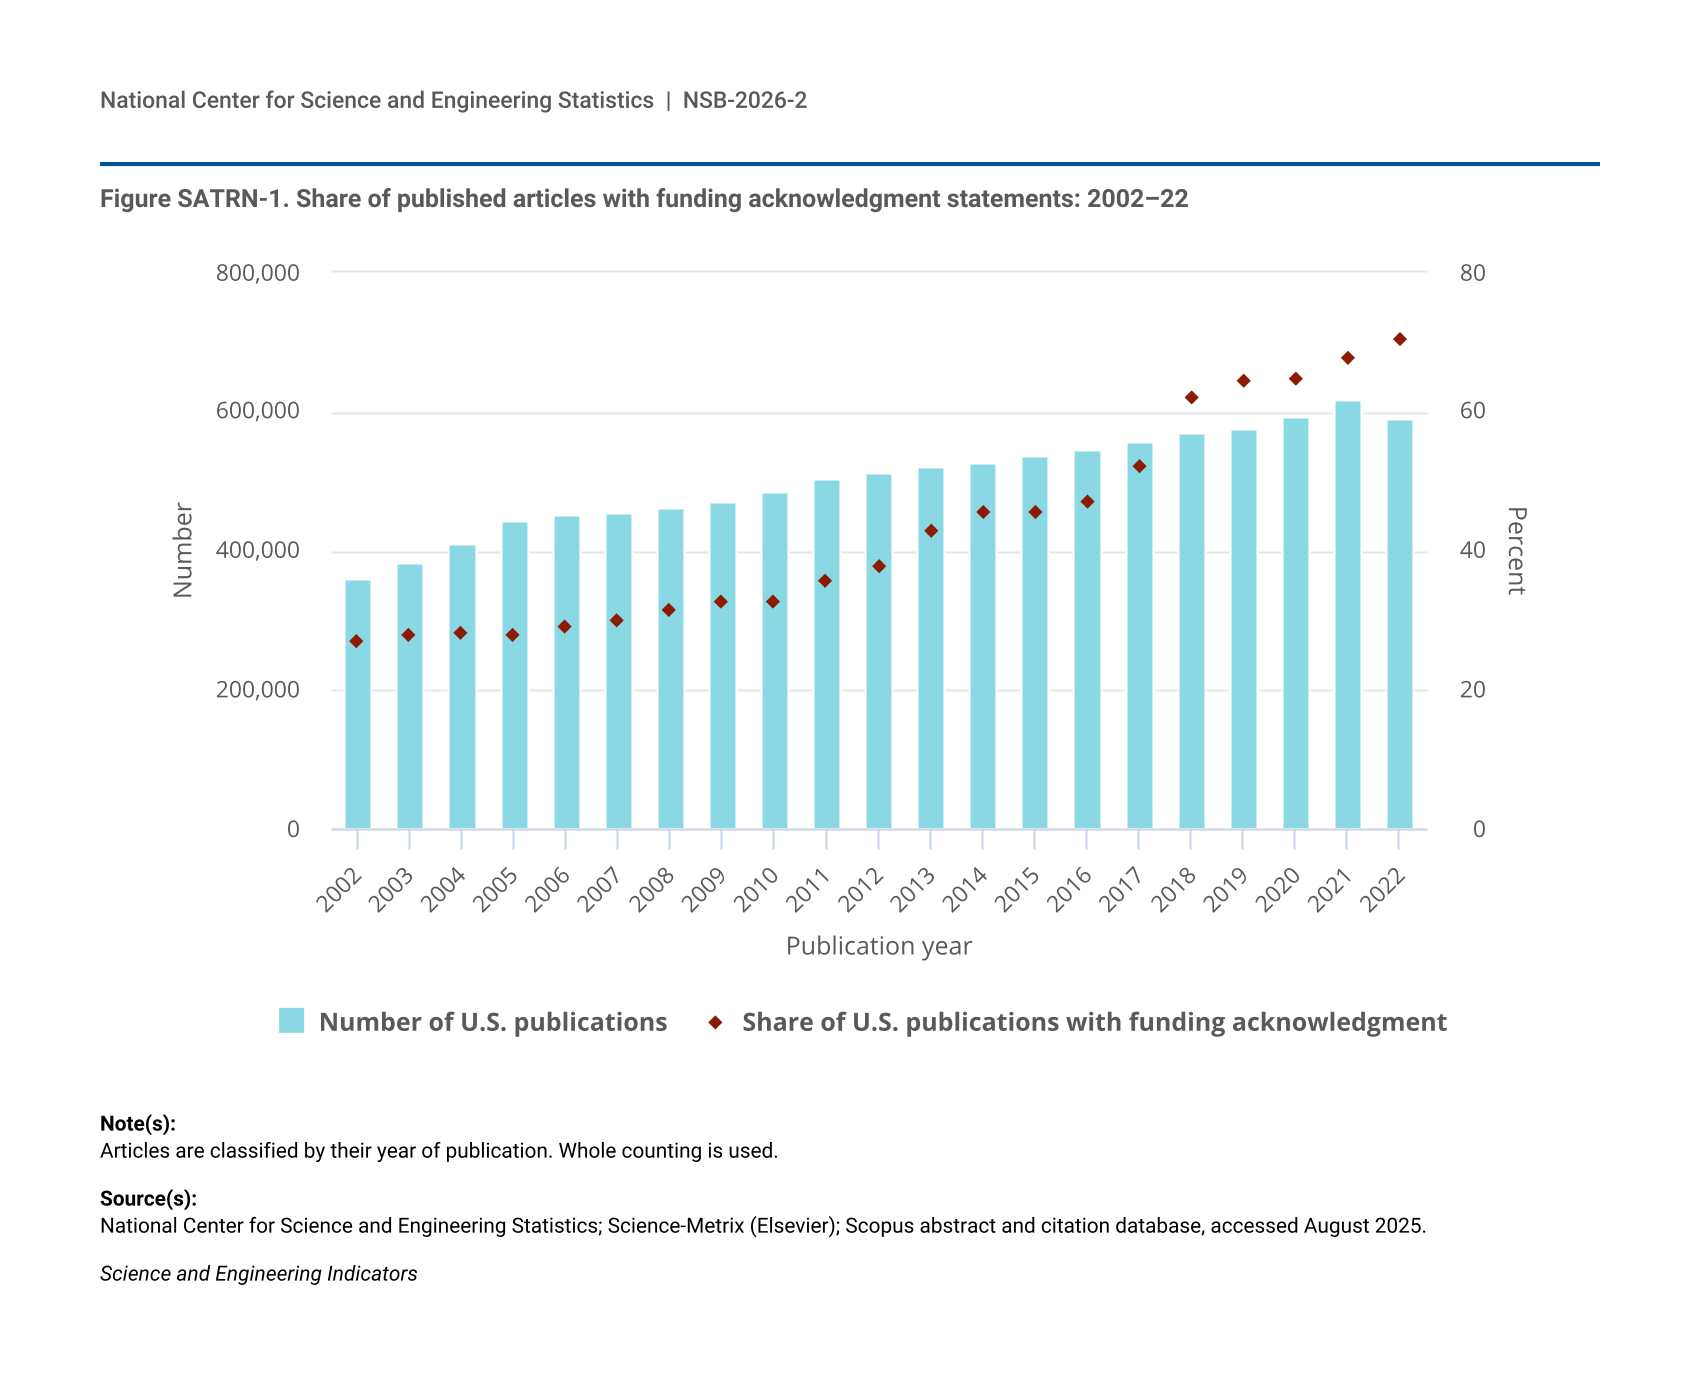
Articles are classified by their year of publication. Whole counting is used. An article is considered to be federally funded if the funding information tied with the publication record in Scopus links it with one of the U.S. federal agencies. Not all Scopus publications have funding information available, and coverage has evolved with time; for more information, see Figure SATRN-1. The count of publications linked to funding from each parent agency includes those linked to its child entities. Child entities are not shown. Because publications that are not thematically classified do not have citation scores, the relative citation index is not simply the ratio of the count of publications in the top 1% over the total number of publications because publications without a citation score are excluded in the denominator.
National Center for Science and Engineering Statistics; Science-Metrix (Elsevier); Scopus abstract and citation database, accessed August 2025.
Science and Engineering Indicators
Other indicators of federal activities that support knowledge transfer include U.S. patents granted to employees at federal agencies, S&E articles with federal authors, and S&E articles with federal authors cited in granted U.S. patents (Table TRN-3). Between 2013 and 2024, the federal agencies with the greatest number of employee-granted U.S. patents were DOD (6,468 patents granted), DOE (5,345 patents), and HHS (2,008 patents). During this period, federal authors at DOE (233,739 articles), HHS (166,439 articles), and the Department of Veterans Affairs (VA) (140,910 articles) published the greatest number of S&E articles relative to their counterparts at other agencies. The same three agencies, albeit in a different order, had the most S&E articles published by their employees cited in granted U.S. patents between 2013 and 2022: HHS (180,861 articles), DOE (130,094 articles), and VA (77,774 articles).
DHS = Department of Homeland Security; DOC = Department of Commerce; DOD = Department of Defense; DOE = Department of Energy; DOI = Department of the Interior; DOT = Department of Transportation; EPA = Environmental Protection Agency; HHS = Department of Health and Human Services; NASA = National Aeronautics and Space Administration; USDA = Department of Agriculture; VA = Department of Veterans Affairs.
Patents are classified by their grant year and articles are classified by their year of publication. An article or patent is linked to federal agencies through author and ownership information on the publication record in Scopus and PatentsView. Citation counts are based on an 11-year window with a 5-year lag (e.g., citations for 2022 are references in Patent and Trademark Office (USPTO) patents issued in calendar year 2022 to articles published in 2007–17). Articles and patents are credited on a whole-count basis (i.e., each participating federal agency receives one count).
National Center for Science and Engineering Statistics; Science-Metrix (Elsevier); PatentsView, USPTO, accessed March 2025; Scopus abstract and citation database, accessed August 2025.
Science and Engineering Indicators
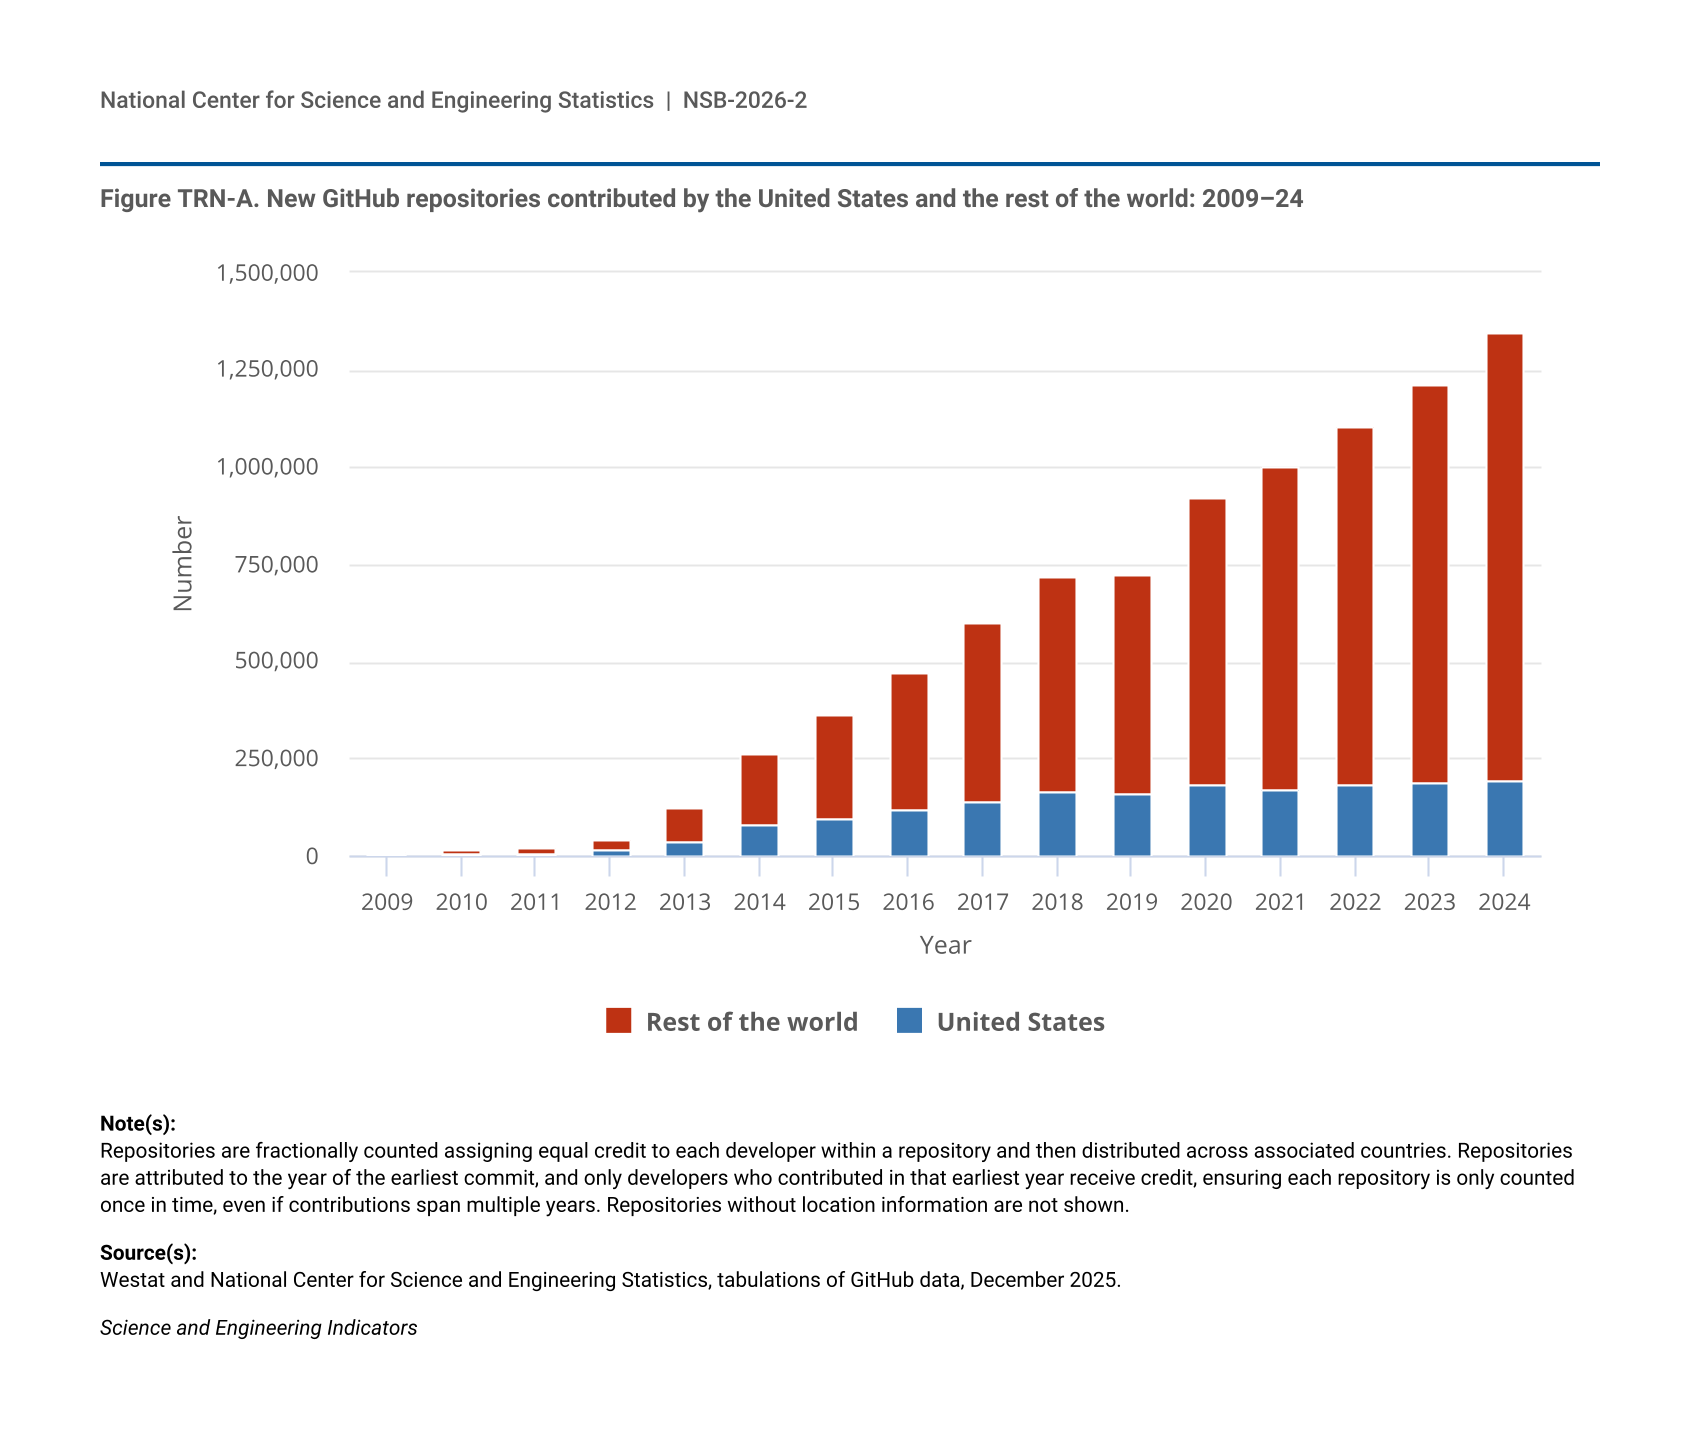
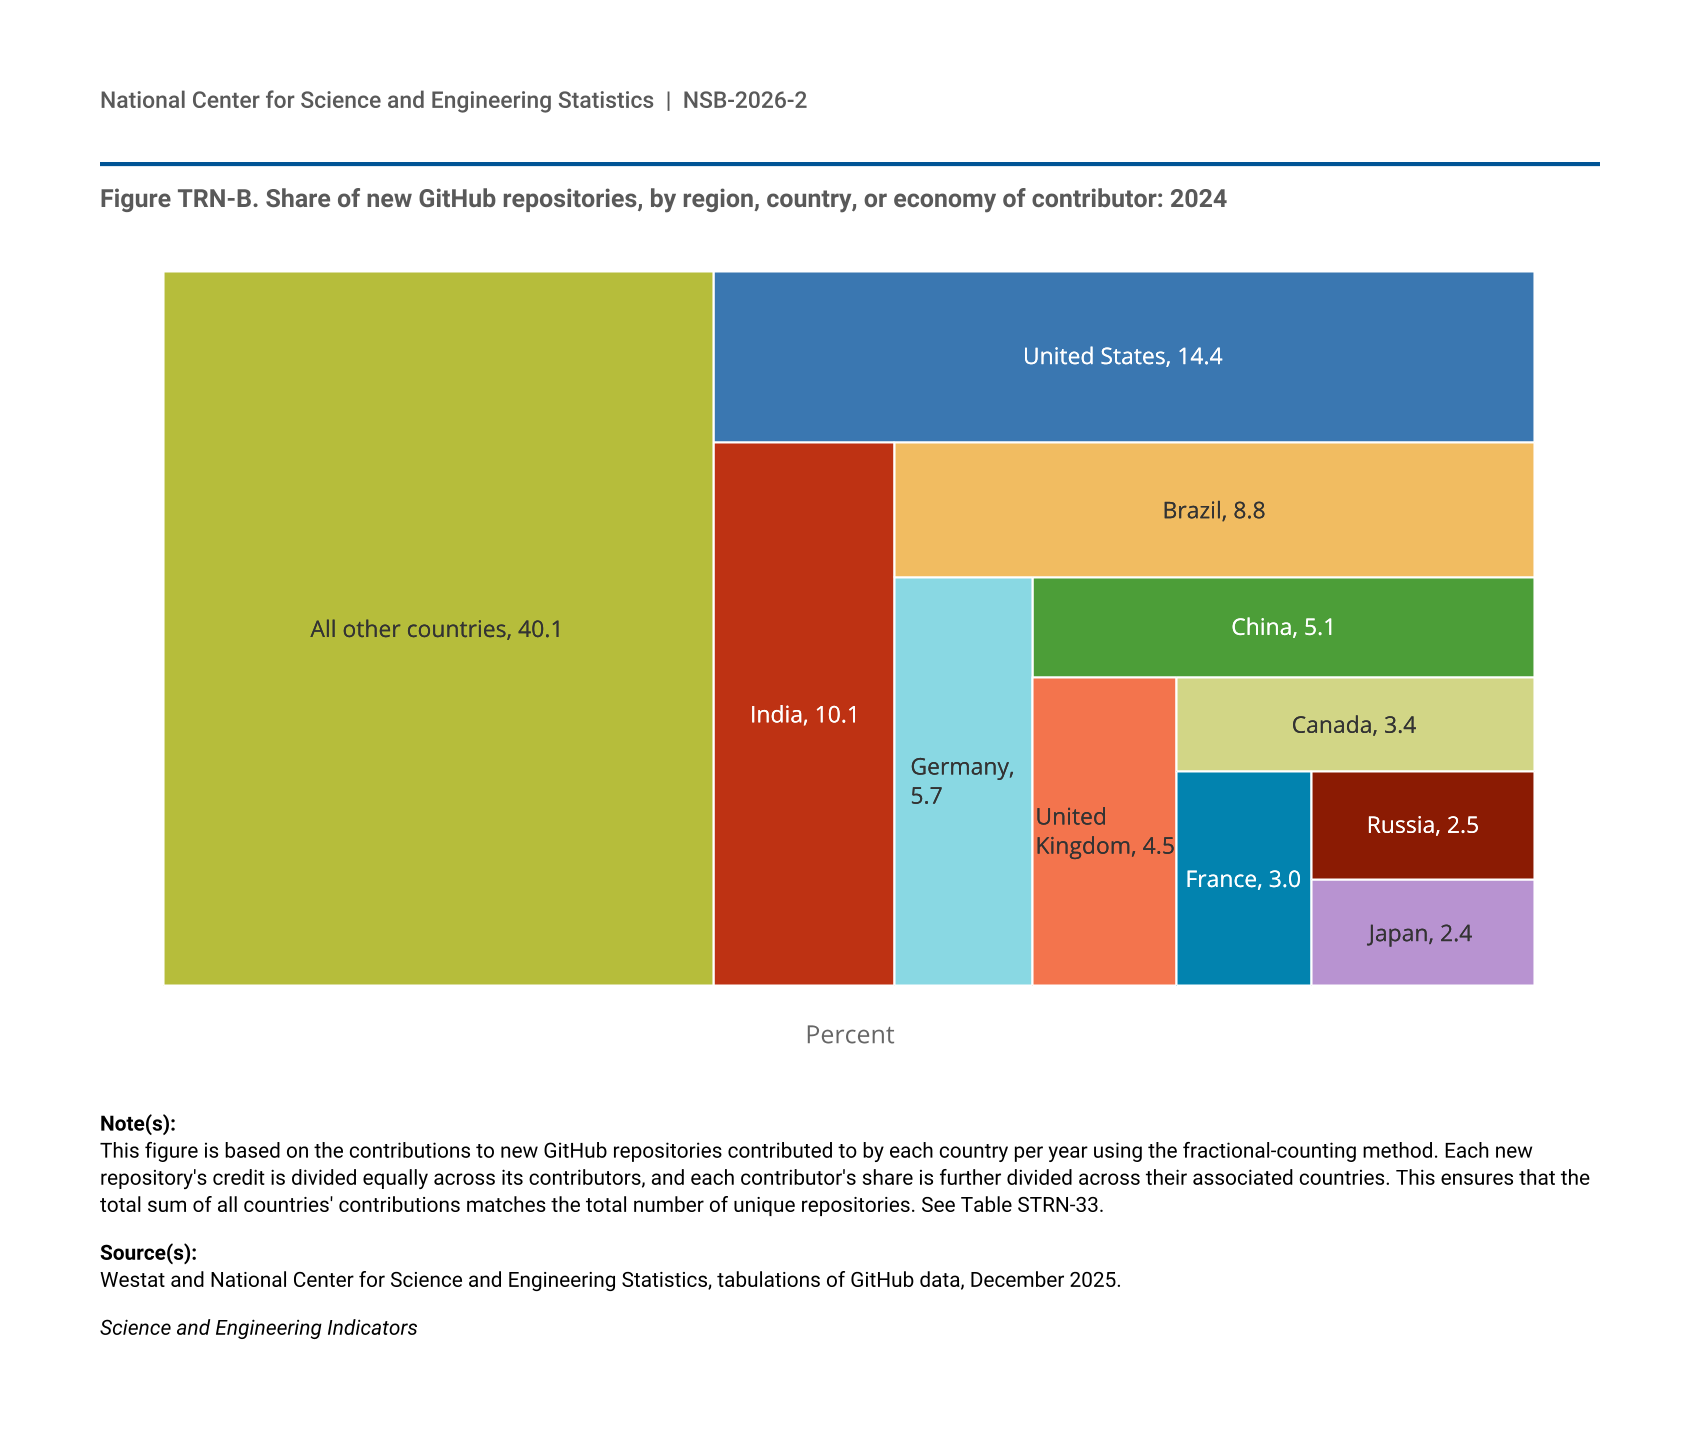
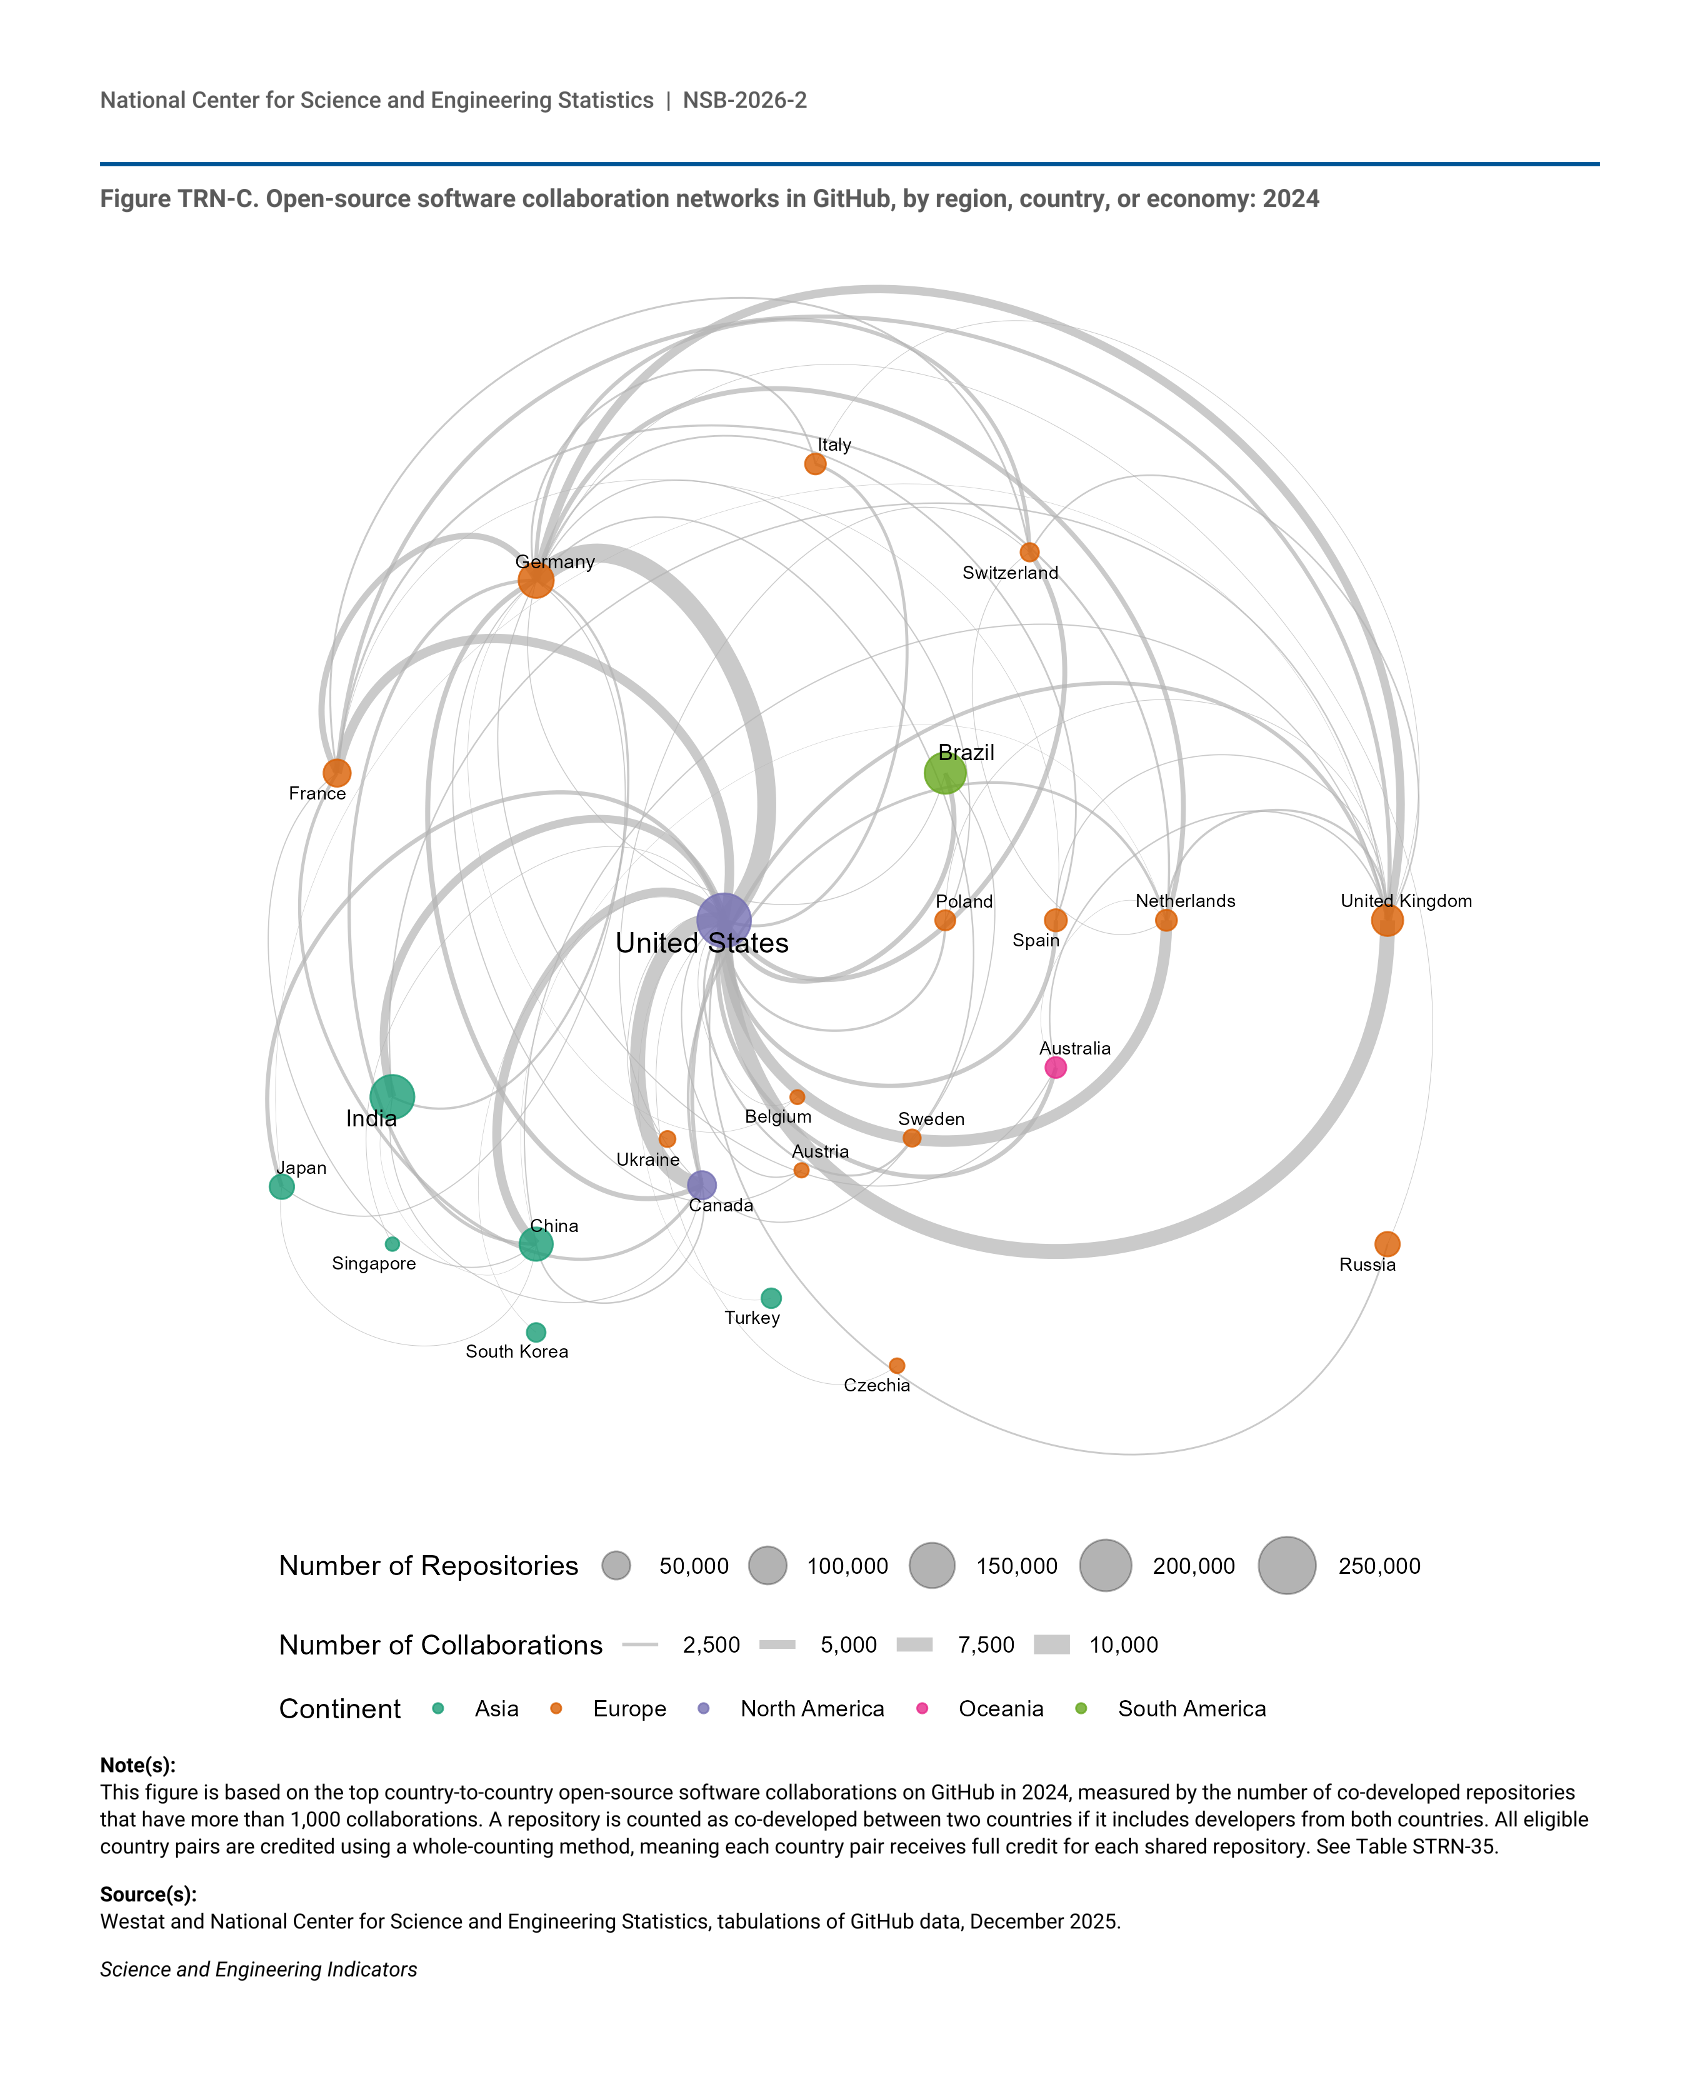
Employees of federal agencies also engage in the production of OSS repositories, a further knowledge and technology transfer activity. Software uploaded to the GitHub platform is an open resource for the research community, enabling the reuse of previously developed code to support scientific research and analyses. From 2009 to 2024, almost 20,000 new contributions were made to software repositories on GitHub from at least one employee from each federal agency, with about 3,000 posted in 2024. Employees from DOE accounted for 52% (9,959) of all instances of federal contributions to GitHub repositories from 2009 to 2024 (Table STRN-2).
University Transfer Metrics
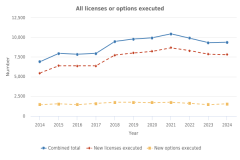
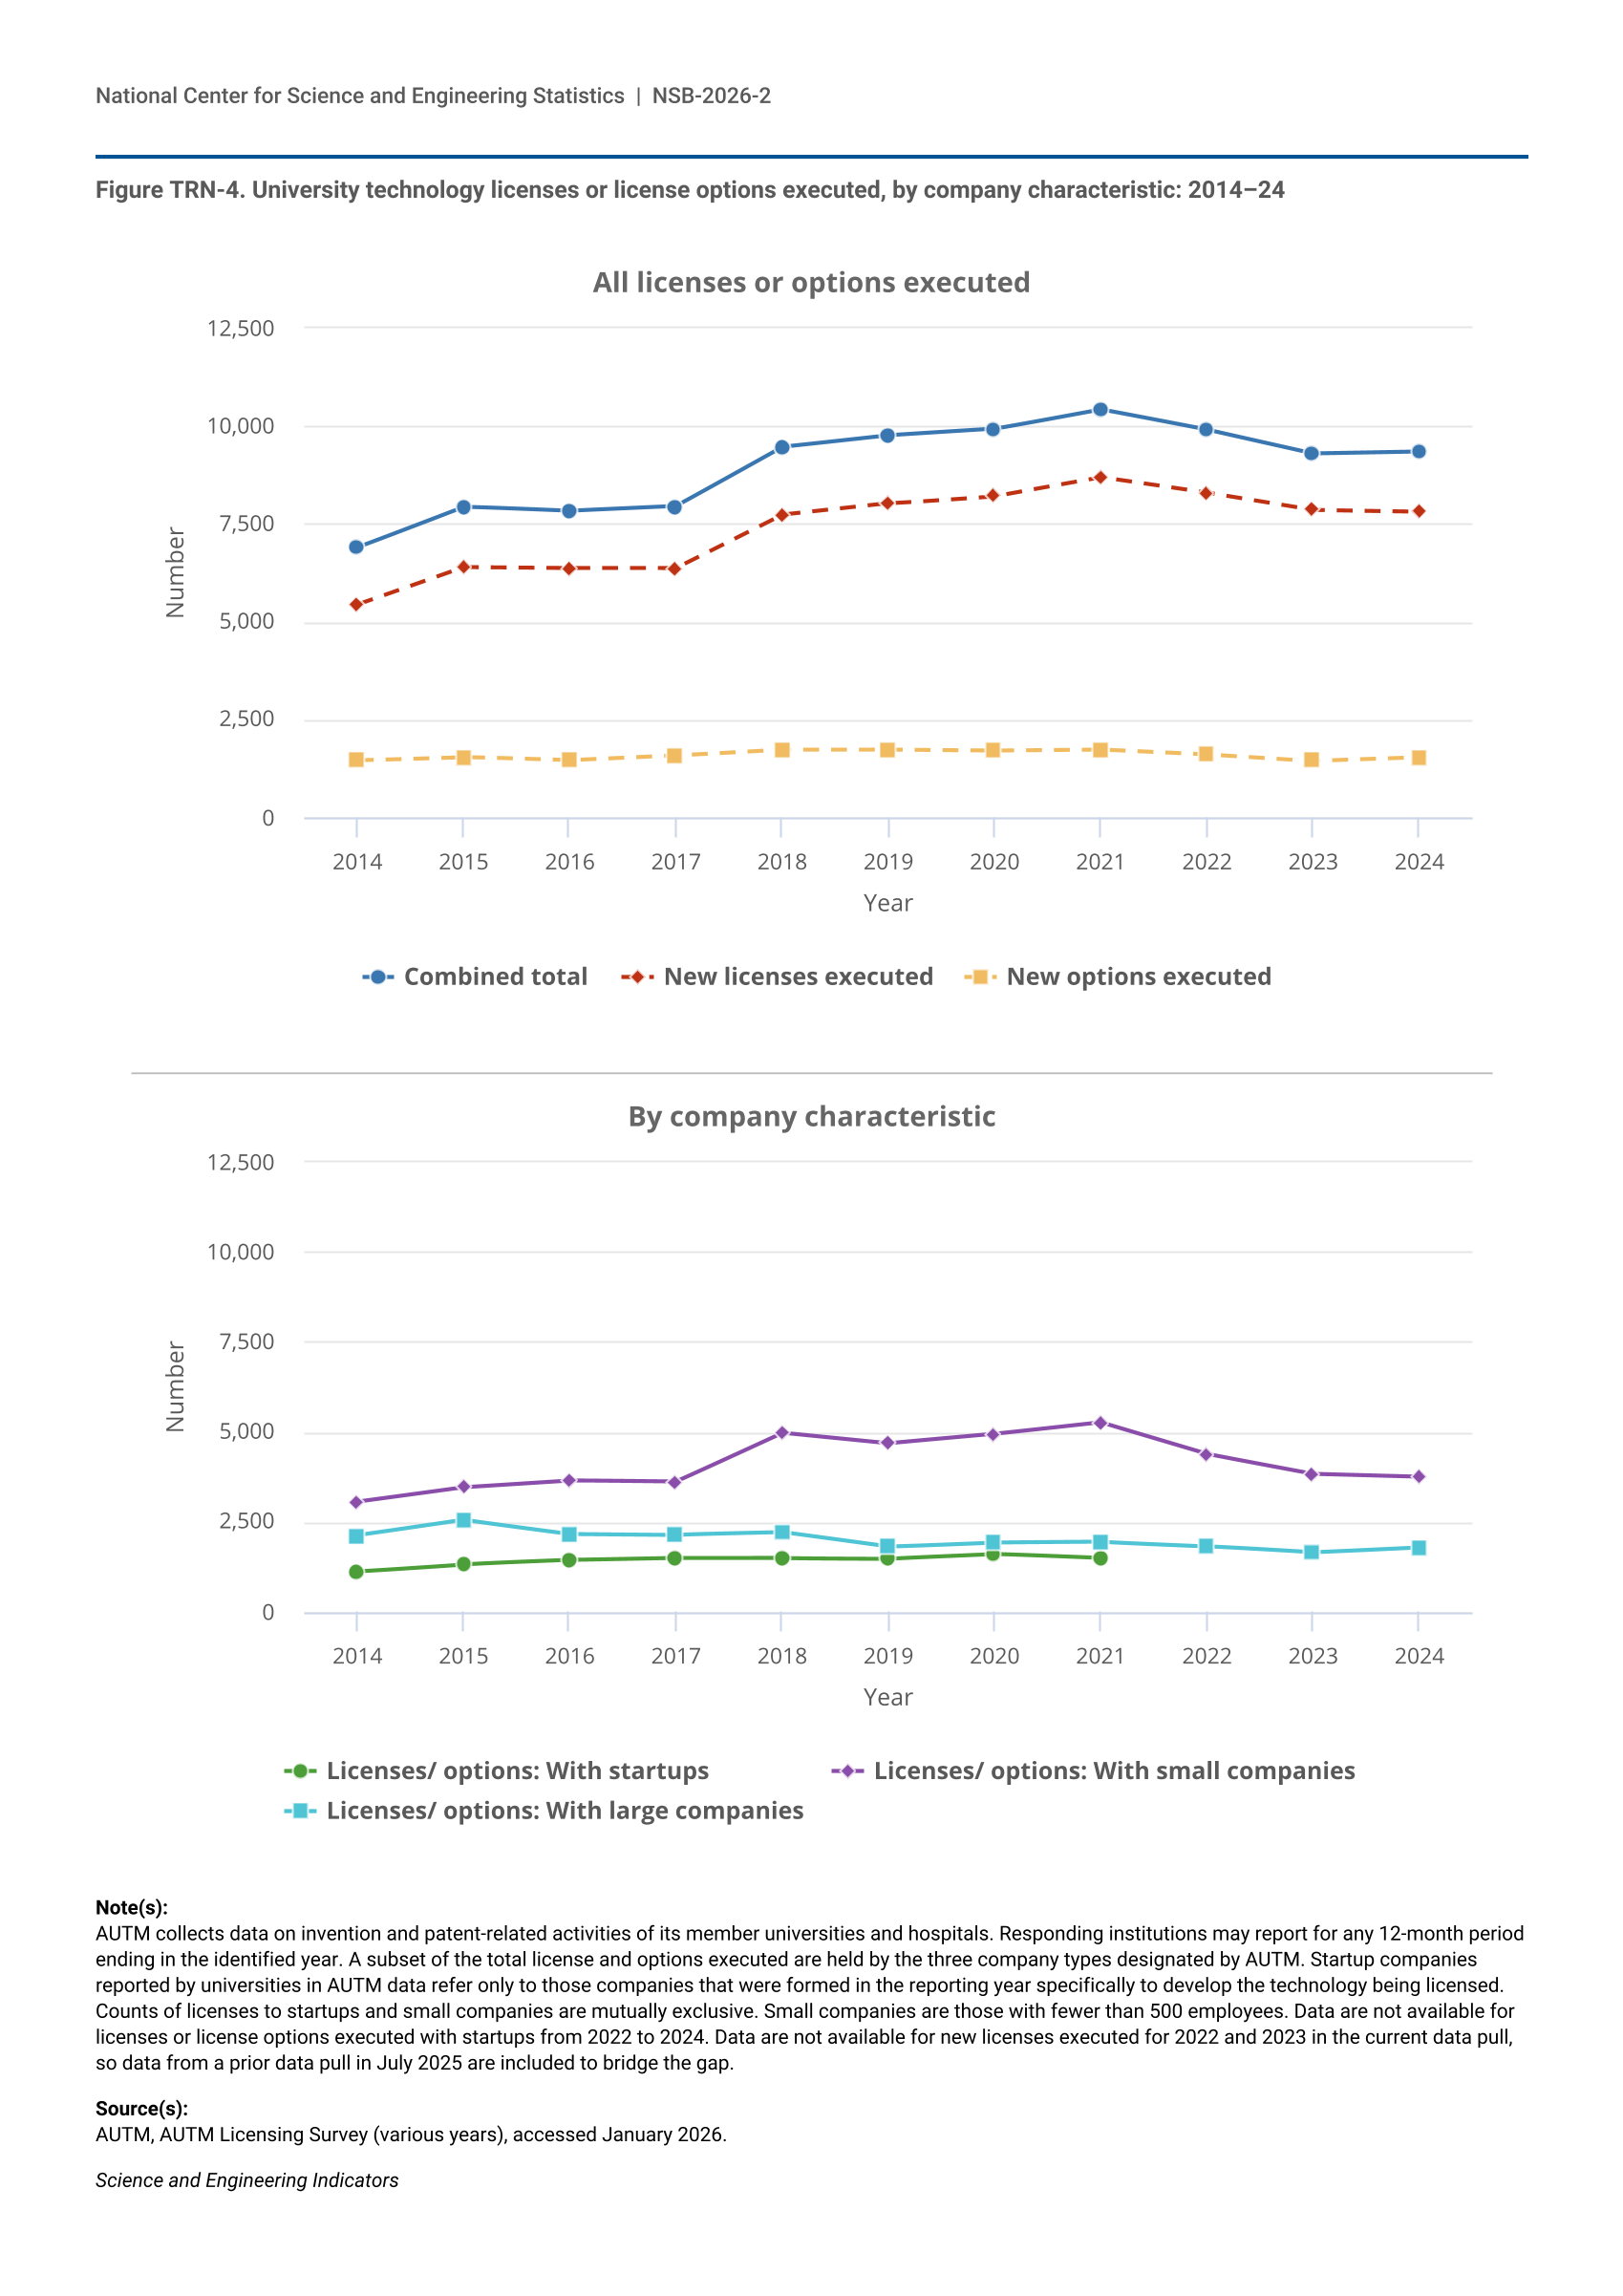
As major performers of R&D (see the Indicators 2026 report “Discovery: R&D Activity and Research Publications” section Academic R&D [NSB 2025]), universities frequently envision their research contribution to the broader public as a critical element of their mission (Compagnucci and Spigarelli 2020). University technology transfer can occur informally, including through engagement or consulting with nonacademic organizations or firms (Perkmann et al. 2013), but the licensing of university patented technologies may provide a quantifiable measure of the extent that university research may be developed into private-sector innovations. Patented inventions can be immediately licensed to a firm or an exclusive option can be granted for licensing rights at a future date. According to AUTM, U.S. universities issued 7,813 new licenses and 1,538 options in 2024, each of which represents a decrease from the peak year in 2021 (with 8,688 licenses and 1,743 options executed) (Figure TRN-4). The share and number of university technology licenses or license options executed by large firms (those with 500 or more employees) decreased from 2014 (31%, or 2,127) to 2024 (19%, or 1,793) (Figure TRN-4). Startups have the smallest share of licenses and options, with 1,487 (14%) in 2021. Small firms (with fewer than 500 employees) consistently executed a larger share of licenses and options (between 40% and 53% from 2014 to 2024) than large companies and startups, though their number of licenses and options has decreased sharply in recent years from 5,268 in 2021 to 3,763 in 2024.
| Year | Combined total | New licenses executed | New options executed |
|---|---|---|---|
| 2014 | 6,902 | 5,440 | 1,462 |
| 2015 | 7,942 | 6,395 | 1,547 |
| 2016 | 7,830 | 6,370 | 1,460 |
| 2017 | 7,951 | 6,366 | 1,585 |
| 2018 | 9,464 | 7,726 | 1,738 |
| 2019 | 9,760 | 8,019 | 1,741 |
| 2020 | 9,928 | 8,210 | 1,718 |
| 2021 | 10,431 | 8,688 | 1,743 |
| 2022 | 9,908 | 8,289 | 1,619 |
| 2023 | 9,301 | 7,852 | 1,449 |
| 2024 | 9,351 | 7,813 | 1,538 |
| Year | Licenses/ options: With startups | Licenses/ options: With small companies | Licenses/ options: With large companies |
|---|---|---|---|
| 2014 | 1,127 | 3,062 | 2,127 |
| 2015 | 1,326 | 3,464 | 2,562 |
| 2016 | 1,437 | 3,653 | 2,175 |
| 2017 | 1,495 | 3,618 | 2,148 |
| 2018 | 1,497 | 4,974 | 2,211 |
| 2019 | 1,485 | 4,684 | 1,809 |
| 2020 | 1,606 | 4,943 | 1,927 |
| 2021 | 1,487 | 5,268 | 1,947 |
| 2022 | NA | 4,394 | 1,828 |
| 2023 | NA | 3,843 | 1,652 |
| 2024 | NA | 3,763 | 1,793 |
AUTM collects data on invention and patent-related activities of its member universities and hospitals. Responding institutions may report for any 12-month period ending in the identified year. A subset of the total license and options executed are held by the three company types designated by AUTM. Startup companies reported by universities in AUTM data refer only to those companies that were formed in the reporting year specifically to develop the technology being licensed. Counts of licenses to startups and small companies are mutually exclusive. Small companies are those with fewer than 500 employees. Data are not available for licenses or license options executed with startups from 2022 to 2024. Data are not available for new licenses executed for 2022 and 2023 in the current data pull, so data from a prior data pull in July 2025 are included to bridge the gap.
AUTM, AUTM Licensing Survey (various years), accessed January 2026.
Science and Engineering Indicators
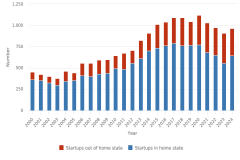
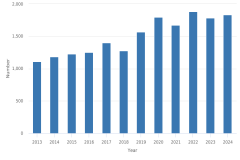
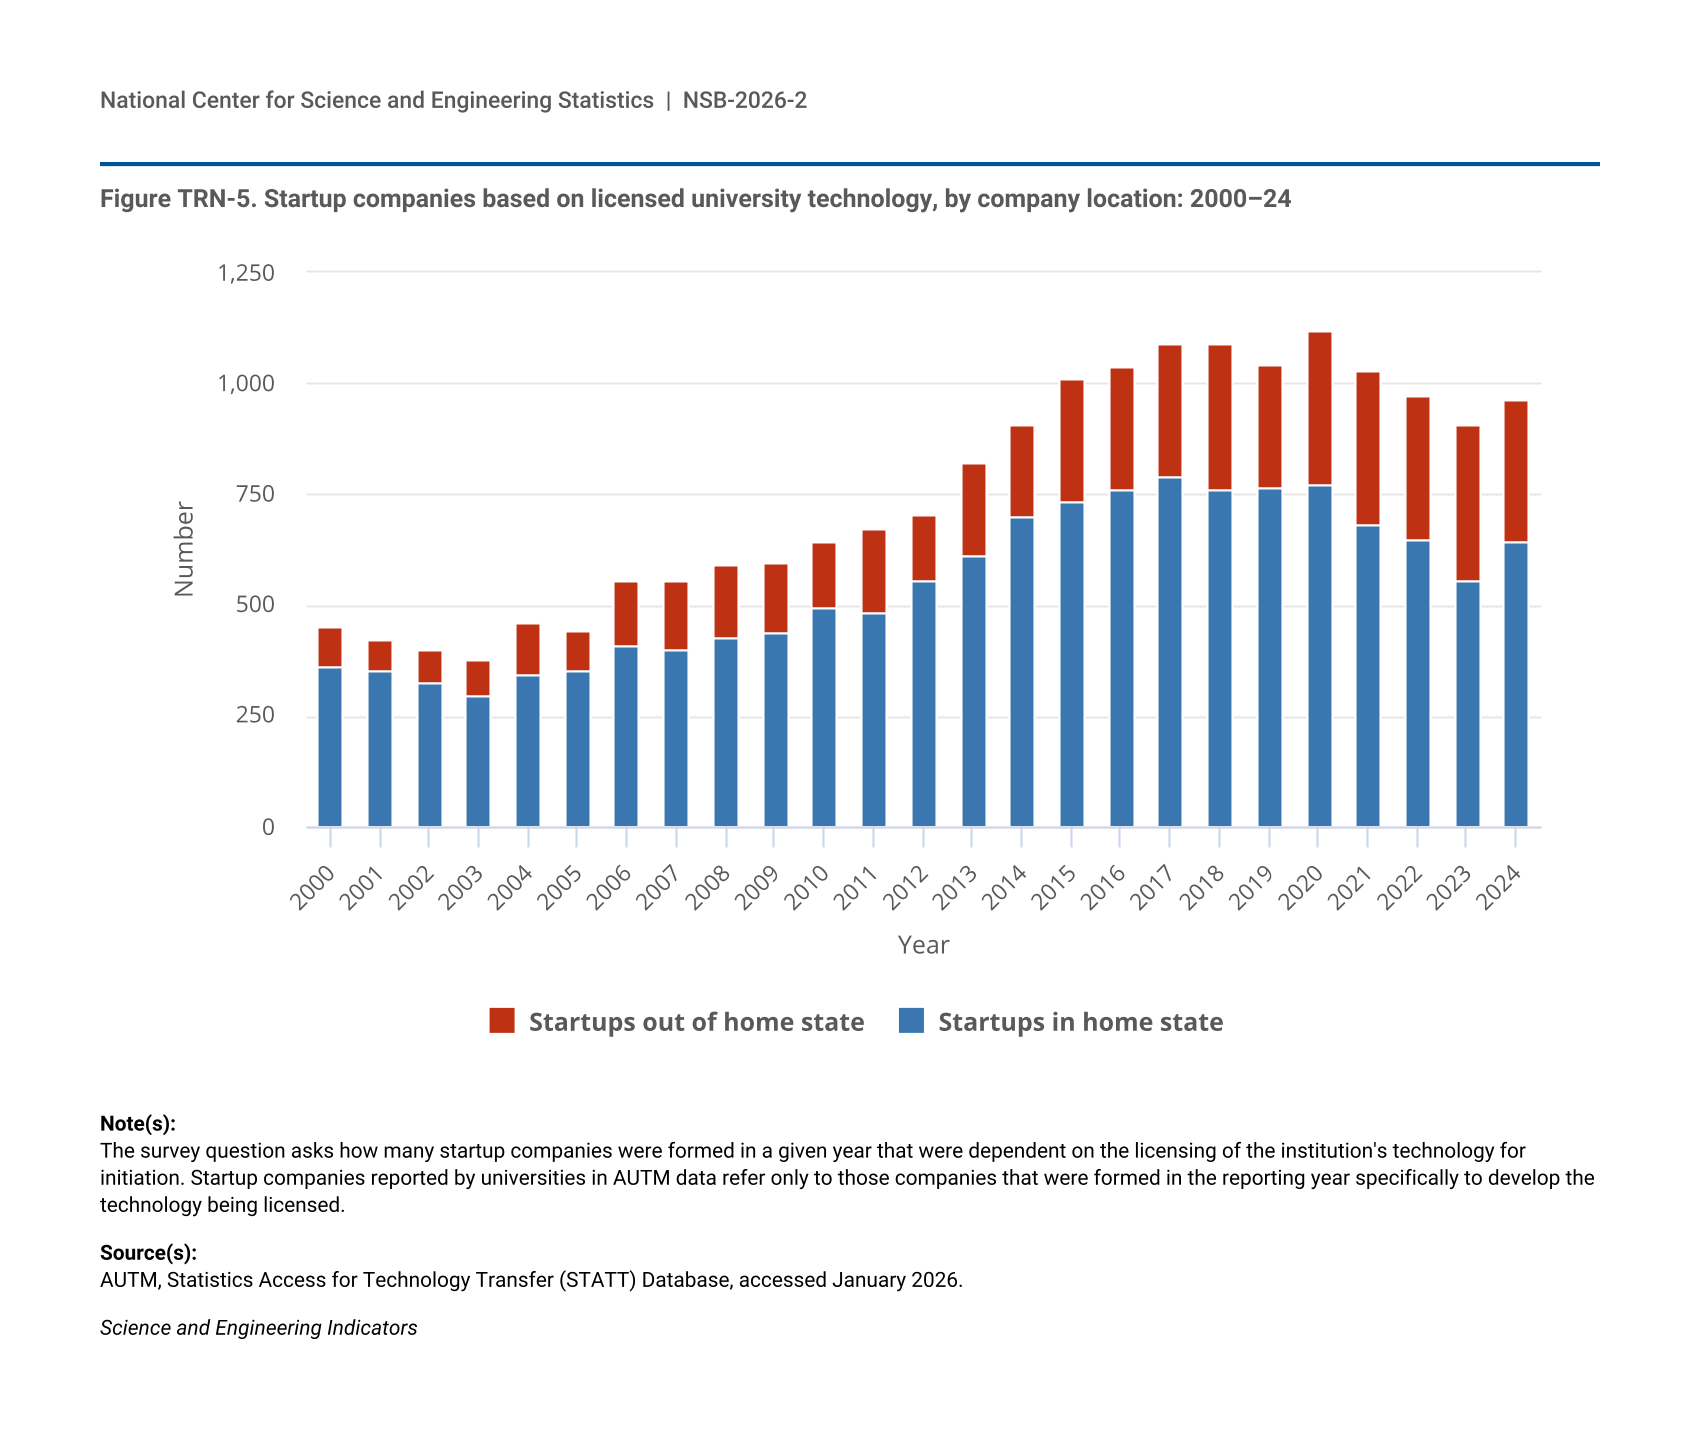
Startups formed specifically to develop university technology are a small subset of new firms in the United States, comprising less than 0.2% of firm startups each year through 2022 (Table STRN-3). However, these startups, often launched by university faculty and students, are one of the most direct means of translating findings and innovation from universities to the private sector (Stephan 2012), using university patents that might not be licensed otherwise (Swamidass 2013). The number of startups based on university technology peaked in 2020, when 1,119 were launched. Since then, the number has dipped below 1,000 since 2022, and 2024 saw the launch of 962 startups (a 14% decrease between 2020 and 2024). The majority of university-related startups launched since 2000 are in the home state of the research university from which the technology was transferred, ranging from 83% in 2001 to 61% in 2023 (Figure TRN-5). In 2024, 67% of all university-related startups were in the state of the affiliated university. Since 2000, the share of out-of-state startups has oscillated but has gradually risen, with the share of out-of-state startups rising by more than 10 percentage points since 2000 (from 20% in 2000 to 33% in 2024). As with any business venture, university-founded startups are affected by a complicated mixture of personal, market, and structural factors (Bruneel et al. 2020; Sansone et al. 2021). However, as university R&D is characteristically more independent of commercial considerations, university technology transfer to the private sector may have a more complicated pipeline to market with a longer timeline (Stephan 2012; Swamidass 2013).
| Year | Startups in home state | Startups out of home state |
|---|---|---|
| 2000 | 362 | 89 |
| 2001 | 352 | 73 |
| 2002 | 322 | 76 |
| 2003 | 295 | 79 |
| 2004 | 342 | 118 |
| 2005 | 354 | 90 |
| 2006 | 410 | 144 |
| 2007 | 401 | 154 |
| 2008 | 428 | 165 |
| 2009 | 435 | 161 |
| 2010 | 492 | 154 |
| 2011 | 486 | 184 |
| 2012 | 553 | 152 |
| 2013 | 613 | 208 |
| 2014 | 698 | 207 |
| 2015 | 735 | 277 |
| 2016 | 762 | 275 |
| 2017 | 791 | 298 |
| 2018 | 759 | 333 |
| 2019 | 766 | 277 |
| 2020 | 773 | 346 |
| 2021 | 682 | 345 |
| 2022 | 649 | 324 |
| 2023 | 556 | 351 |
| 2024 | 642 | 320 |
The survey question asks how many startup companies were formed in a given year that were dependent on the licensing of the institution's technology for initiation. Startup companies reported by universities in AUTM data refer only to those companies that were formed in the reporting year specifically to develop the technology being licensed.
AUTM, Statistics Access for Technology Transfer (STATT) Database, accessed January 2026.
Science and Engineering Indicators
Impact of Publicly Funded Research: Citations in Patents
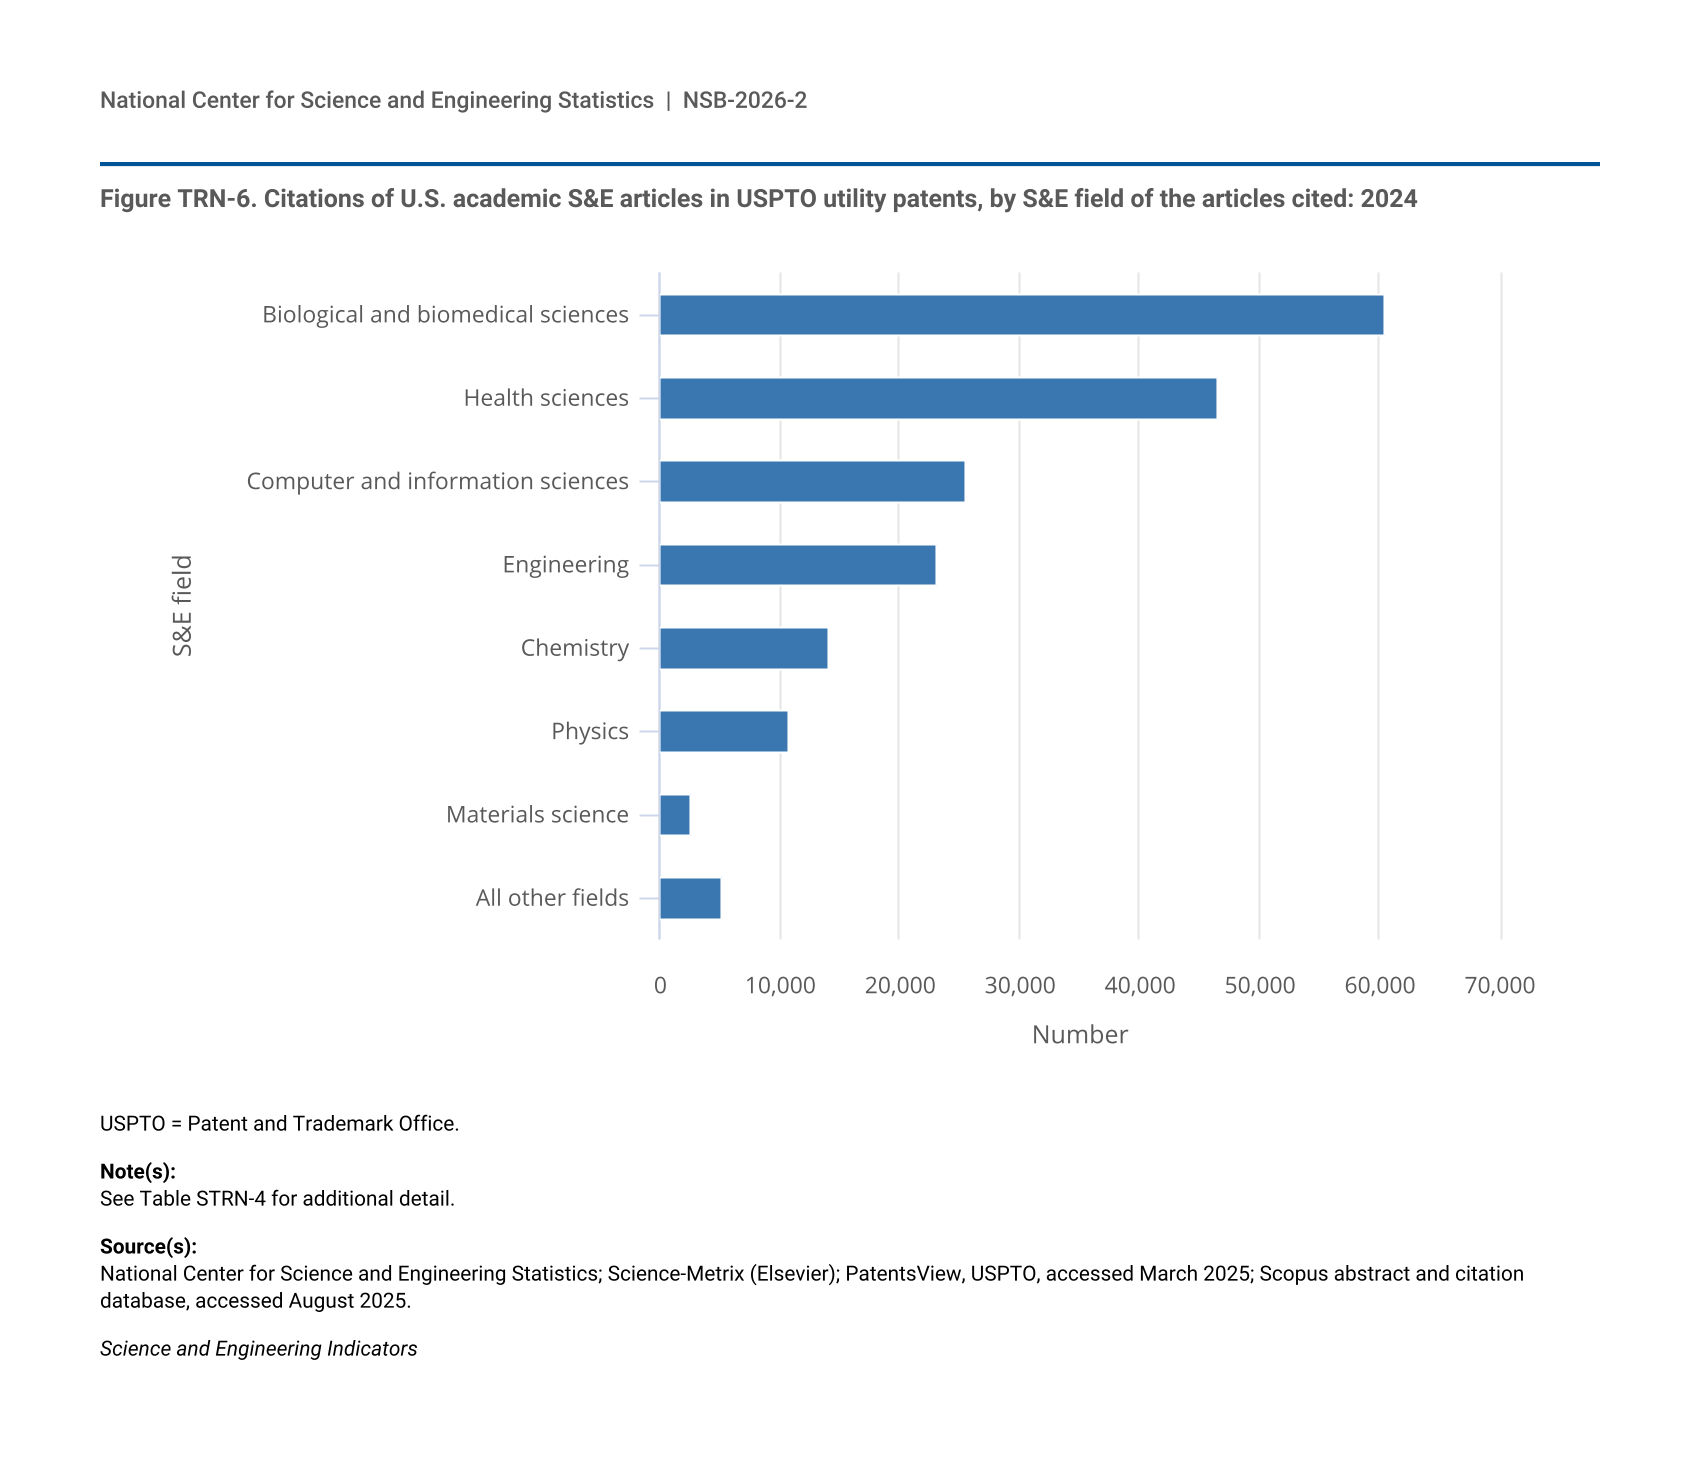
Publicly funded knowledge also flows into the market through its contribution to patents for useful inventions. When peer- reviewed publications from any author are cited in the reference section of patent documents, the linkage suggests that scientific literature may have contributed knowledge to the patented invention. The number of academic publications cited in patents points to the importance of academic research in invention. Of about 642,000 citations to S&E articles in U.S. patents in 2024, about 29% were to articles from the U.S. academic sector (Table STRN-4).
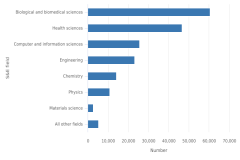
Biotechnology and the biomedical and health sciences are areas of high scientific article output from authors in the United States, and this work is cited in utility patents (see the Indicators 2026 report “Discovery: R&D Activity and Research Publications” sidebar Biotechnology R&D and Publications Output and the section Output by Geography, S&E Field, and Sector) (NSB 2025). By field of science, articles from the biological and biomedical sciences were cited in U.S.-granted patents more often than articles from any other S&E field in 2024, accounting for 27% of all citations (Table STRN-4). For citations to articles from just U.S. academic authors, 32% of all citations were to biological and biomedical sciences articles (Figure TRN-6). Articles from the health sciences were the second-most frequently cited in granted U.S. patents, accounting for 23% of all citations in 2024 (Table STRN-4). However, the volume of citations in U.S. patents varied substantially by type of author. Of the about 171,000 biological and biomedical sciences articles cited in U.S. patents in 2024, 52% had authors from the United States; over 35% had authors in the U.S. academic sector specifically, 7% had authors from the U.S. business sector, about 5% had authors from U.S. nonprofits, and over 3% had federal authors (Table STRN-4). U.S. academic authors accounted for 31% of the almost 150,000 health sciences articles cited in granted U.S. patents in 2024, U.S. business-sector authors accounted for 6%, and U.S. federal agency authors accounted for 2% (Table STRN-4).
| S&E field | Number |
|---|---|
| Biological and biomedical sciences | 60,387 |
| Health sciences | 46,628 |
| Computer and information sciences | 25,581 |
| Engineering | 23,055 |
| Chemistry | 14,146 |
| Physics | 10,849 |
| Materials science | 2,646 |
| All other fields | 5,197 |
USPTO = Patent and Trademark Office.
See Table STRN-4 for additional detail.
National Center for Science and Engineering Statistics; Science-Metrix (Elsevier); PatentsView, USPTO, accessed March 2025; Scopus abstract and citation database, accessed August 2025.
Science and Engineering Indicators
Federal health agencies play an important role in knowledge transfer: S&E articles by HHS authors received about 15,700 citations in granted U.S. patents in 2024 (37% of all citations to S&E articles authored by federal agency employees). DOE authors received about 11,900 citations (28%) (Table STRN-5). Inventors at DOD and DOE were granted more than 400 utility patents in 2024 (Table STRN-6). Additional detail on the patents and publications activity of federal agencies by field or technology area, as well as articles cited in patents, is shown in Table STRN-5–Table STRN-10. The USPTO patent records used in the analysis above also provide geographical inventor information for all patents registered in the United States, including patents granted to individuals and foreign entities.
Patents as Invention Indicators
Three dimensions of patenting are reported here—priority patent families that reflect the international scope of global patenting, USPTO patents that are particularly relevant to the U.S. market for technology, and one that focuses on impact—through highly cited patents (HCPs).
The USPTO grants protection for inventions in the U.S. market. Globally, the Patent Cooperation Treaty (PCT) and the World Intellectual Property Organization (WIPO) provide for international recognition of priority patent families, which protect inventions that have not been previously patented in any jurisdiction and are accessible through the PATSTAT database (EPO 2025). As an indicator, these priority patent families provide a more globally representative picture of patenting of inventions compared with USPTO patents; not all inventors chose to protect their inventions in the U.S. market. Simultaneously, owners of USPTO patents may not necessarily pursue priority patent families, and patents by U.S. inventors that have national security implications are prohibited from being patented outside of the United States, so they will only be counted in the USPTO data (USPTO 2026). Both USPTO and priority patent families are quantity indicators; priority patent families more fully describe the international landscape of patenting.
This report introduces a quality indicator for patents, highly cited priority patent families based on country of the inventor. The HCP share goes beyond raw counts of technology and location to provide a kind of impact indicator that reflects the relevance of a particular patent in subsequent patent filings (Science-Metrix, Patent and Trademark Documentation 2026 [link when available]). Because they identify the scope of prior patent claims, citations to prior patents within patent documents provide a kind of ex post value of the patent document (Trajtenberg 2002).
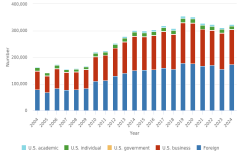
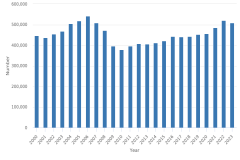
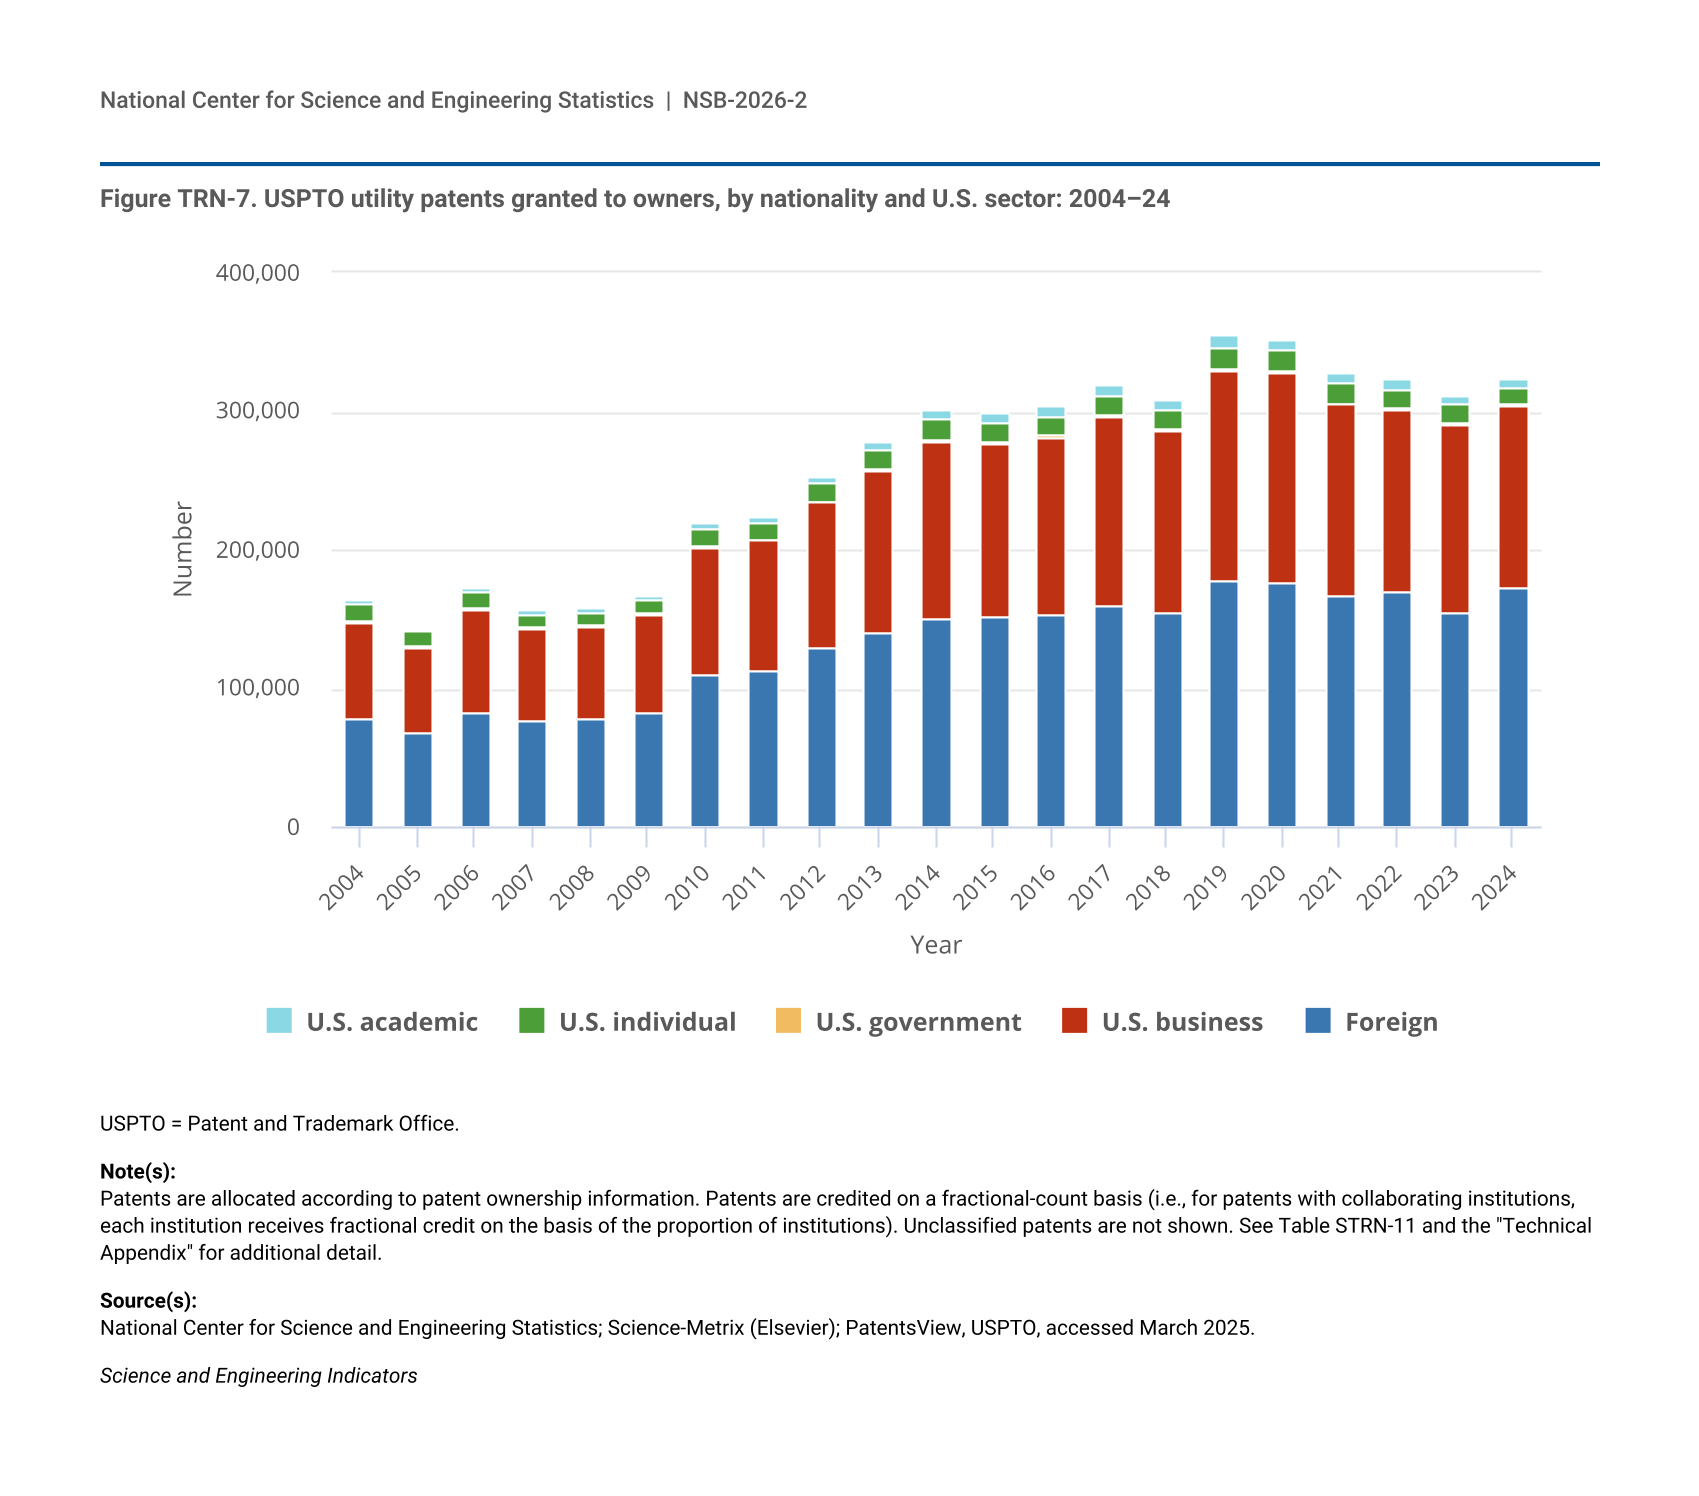
USPTO awarded 326,000 utility patents in 2024, of which 152,000 (47%) were assigned to domestic U.S. owners. Of U.S. patent holders, business owners received the most patents (85%) in 2024, whereas individual filers and those in academia and government accounted for much smaller shares (Figure TRN-7; Table STRN-11). The number of USPTO utility patents awarded to U.S. owners decreased between 2023 (159,000) and 2024 (152,000). However, the annual total awarded to U.S. owners has yet to surpass the total in 2019, the year prior to the COVID-19 pandemic, when 179,000 were granted. Patents assigned to U.S. businesses declined 15% between 2019 and 2022, in contrast to a general upward trend from 2000 to 2019 (Table STRN-11).
| Year | Foreign | U.S. business | U.S. government | U.S. individual | U.S. academic |
|---|---|---|---|---|---|
| 2004 | 78,084 | 69,389 | 1,019 | 12,181 | 3,262 |
| 2005 | 67,615 | 61,723 | 844 | 10,482 | 2,876 |
| 2006 | 82,239 | 74,610 | 1,008 | 12,006 | 3,520 |
| 2007 | 76,192 | 66,550 | 946 | 10,050 | 3,215 |
| 2008 | 78,216 | 66,130 | 905 | 9,205 | 3,024 |
| 2009 | 83,055 | 70,646 | 931 | 9,210 | 3,265 |
| 2010 | 109,149 | 91,856 | 1,257 | 12,556 | 4,516 |
| 2011 | 113,068 | 93,769 | 1,195 | 11,906 | 4,414 |
| 2012 | 128,616 | 105,242 | 1,359 | 12,810 | 5,042 |
| 2013 | 139,354 | 117,539 | 1,447 | 13,914 | 5,625 |
| 2014 | 150,216 | 128,672 | 1,430 | 14,421 | 6,086 |
| 2015 | 151,166 | 125,739 | 1,376 | 14,078 | 6,180 |
| 2016 | 152,730 | 128,858 | 1,299 | 13,902 | 6,630 |
| 2017 | 159,565 | 136,724 | 1,342 | 14,348 | 7,005 |
| 2018 | 154,379 | 131,419 | 1,312 | 13,760 | 6,892 |
| 2019 | 177,043 | 152,821 | 1,434 | 15,173 | 7,795 |
| 2020 | 176,567 | 151,535 | 1,244 | 14,759 | 7,841 |
| 2021 | 166,585 | 138,011 | 1,262 | 14,229 | 7,228 |
| 2022 | 170,554 | 130,558 | 1,291 | 13,619 | 6,752 |
| 2023 | 154,281 | 136,375 | 1,364 | 13,170 | 6,612 |
| 2024 | 173,529 | 129,766 | 1,289 | 12,262 | 6,761 |
USPTO = Patent and Trademark Office.
Patents are allocated according to patent ownership information. Patents are credited on a fractional-count basis (i.e., for patents with collaborating institutions, each institution receives fractional credit on the basis of the proportion of institutions). Unclassified patents are not shown. See Table STRN-11 and the "Technical Appendix" for additional detail.
National Center for Science and Engineering Statistics; Science-Metrix (Elsevier); PatentsView, USPTO, accessed March 2025.
Science and Engineering Indicators
Table TRN-4 shows the 20 entities with the highest share of their USPTO patents in the top 1% most cited in other patents for 2021. Patents in the top 1% by patent citations are designated as HCPs. For each entity, the proportion of HCPs relative to its total patenting output is represented by an index number, called its HCP share, calculated for year and technology area. An HCP share of 1.0 means that 1% of an entity’s cited patents in the year and technology were in the top 1% of all patents in the year and technology class. An HCP share of 2.0, for example, would mean that 2% of the entity’s patents were among the top 1% most cited. HCPs are only reported after a minimum of 3 years have passed, which provides sufficient time for a meaningful number of citations to accumulate while still providing a degree of currentness to the data presented (Hall, Jaffe, and Trajtenberg 2002).
HCP = highly cited patent; USPTO = Patent and Trademark Office.
Patents are allocated according to patent ownership information. Patents are credited on a full-count basis (i.e., for patents with collaborating institutions, each institution receives full credit). Institutions are ordered in decreasing order according to the share of HCP patents. Curated profiles of institutions are based on the disambiguation information available in PatentsView.
National Center for Science and Engineering Statistics; Science-Metrix (Elsevier); PatentsView, USPTO, accessed March 2025.
Science and Engineering Indicators
This report provides data on patents granted by USPTO and on patents granted internationally through the PCT and accessed in the PATSTAT database, referred to here as priority patent families. USPTO patents provide registration, examination, and protection in the U.S. market; priority patents provide registration and examination internationally. The examination process for priority patents provides a check on the patentability of the invention and a search for prior references. Although protection in individual national markets requires additional protection, the priority patent centralizes application and examination. Thus, foreign inventors who apply for USPTO patents are seeking protection for their inventions in the U.S. market, and inventors who apply for PCT patents are implicitly preparing for seeking protection in more than one international market.
A supplemental machine-readable file released with this report contains USPTO and priority patent family data for a 47-category classification of CETs, developed for the Indicators 2024 report “Invention, Knowledge Transfer, and Innovation” sidebar Patenting That Addresses CHIPS and Science Act Technologies (NSB 2024), with input from NSF TIP, SRI International, and Science-Metrix and Elsevier (Table STRN-13). Another existing classification scheme using WIPO’s 35 technology categories is utilized in this thematic report (WIPO 2026). The data released include the region’s, country’s, or economy’s HCP share for priority patent families for each technology area.
Spotlight on Invention in Critical and Emerging Technologies
In addition to the economic growth implications of GPTs such as the Internet and AI, the development, deployment, and use of emerging technologies have a range of potential downstream impacts, both positive and negative. Examples of these risks can include health consequences, national security concerns, facilitation of criminal activity, or environmental effects. As a result, policymakers seek to identify and follow current trends in emerging technology development, deployment, and use, especially where the range of potential outcomes are uncertain or unknown.
This section highlights invention activities for five technology areas identified as critical and emerging. Policymakers identify technologies as critical because of their role in security, prosperity, and resilience, whereas emerging technologies are often identified through data analysis.
AI, QIST, semiconductors, and nuclear technology were among the topics identified by the current administration as CETs in which the administration aspires to technological leadership (Trump 2025; Vought and Kratsios 2025). The CHIPS and Science Act of 2022 (P.L. 117-167) identified domestic production of semiconductors as a national security concern and provided funding to support the domestic semiconductor supply chain and workforce as well as research into basic energy sources and AI (Congress.gov 2022; NSTC 2025). Biotechnology and biomanufacturing have been identified in this administration and in the previous one as additional areas where the United States aims to maintain global competitiveness (Biden 2022; Kratsios 2025; Vought and Kratsios 2025). NSF TIP has been developing a taxonomy of critical technologies identified as key technology areas (NSF/TIP 2025). This taxonomy appears in the Indicators 2024 report “Invention, Knowledge Transfer, and Innovation” (NSB 2024), and NSF TIP has expanded it for this report. The key technology areas and 47 underlying categories or foci are shown in Table STRN-12, their linkage to patent classification codes is shown in Table STRN-13, and the HCP share for these areas is shown in Table STRN-14 for priority patent families granted in 2021.
The figures in the section show selected countries and regions that are most active in patenting globally: the United States, China, the European Union (EU-27), Japan, and South Korea. Additional geographic information is provided for the top 20 highest patenting regions, countries, or economies in supplemental tables; the analysis that follows describes information both in the figures and in the cited supplemental tables.
Artificial Intelligence
AI is widely understood as a rapidly growing GPT, and many nations have set policy goals for achieving competitive advantages through development of AI. For example, China released a development plan in 2017 that calls for it to achieve technological leadership by 2030 (Green and Parker 2026). Several additional nations, including Australia and Brazil, aim to become leaders in AI by 2028 (BCA 2025; IDS 2024).
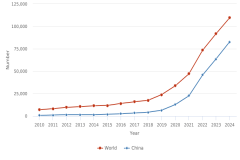
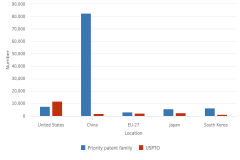
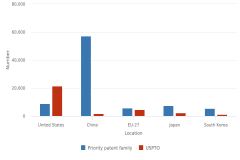
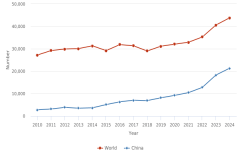
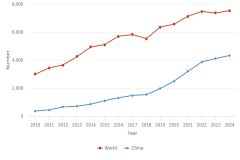
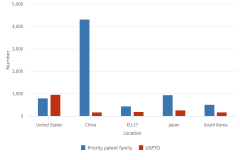
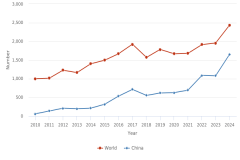
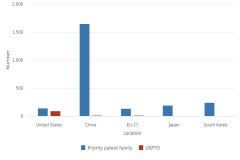
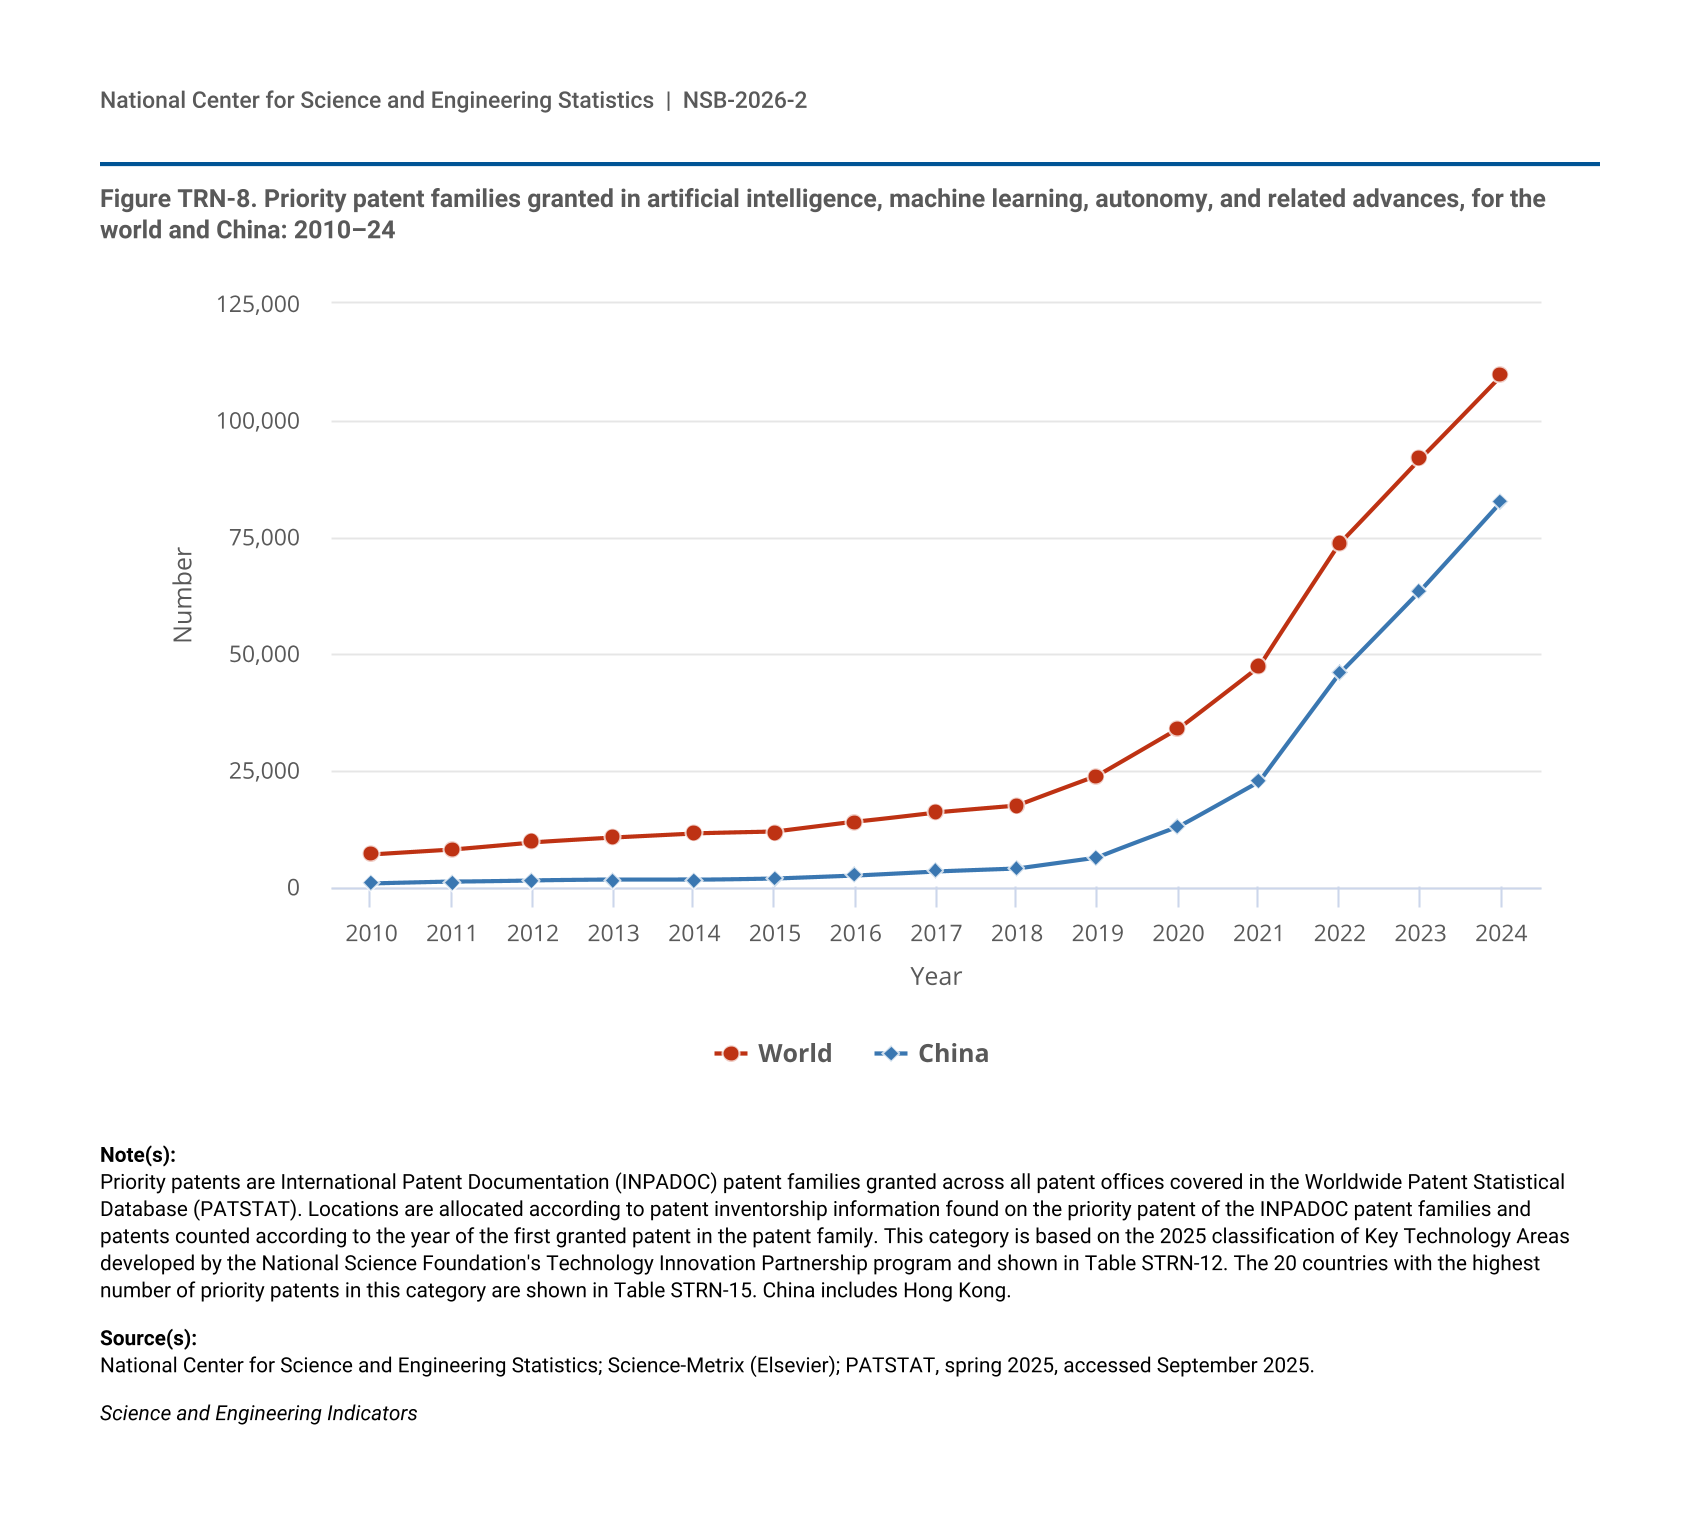
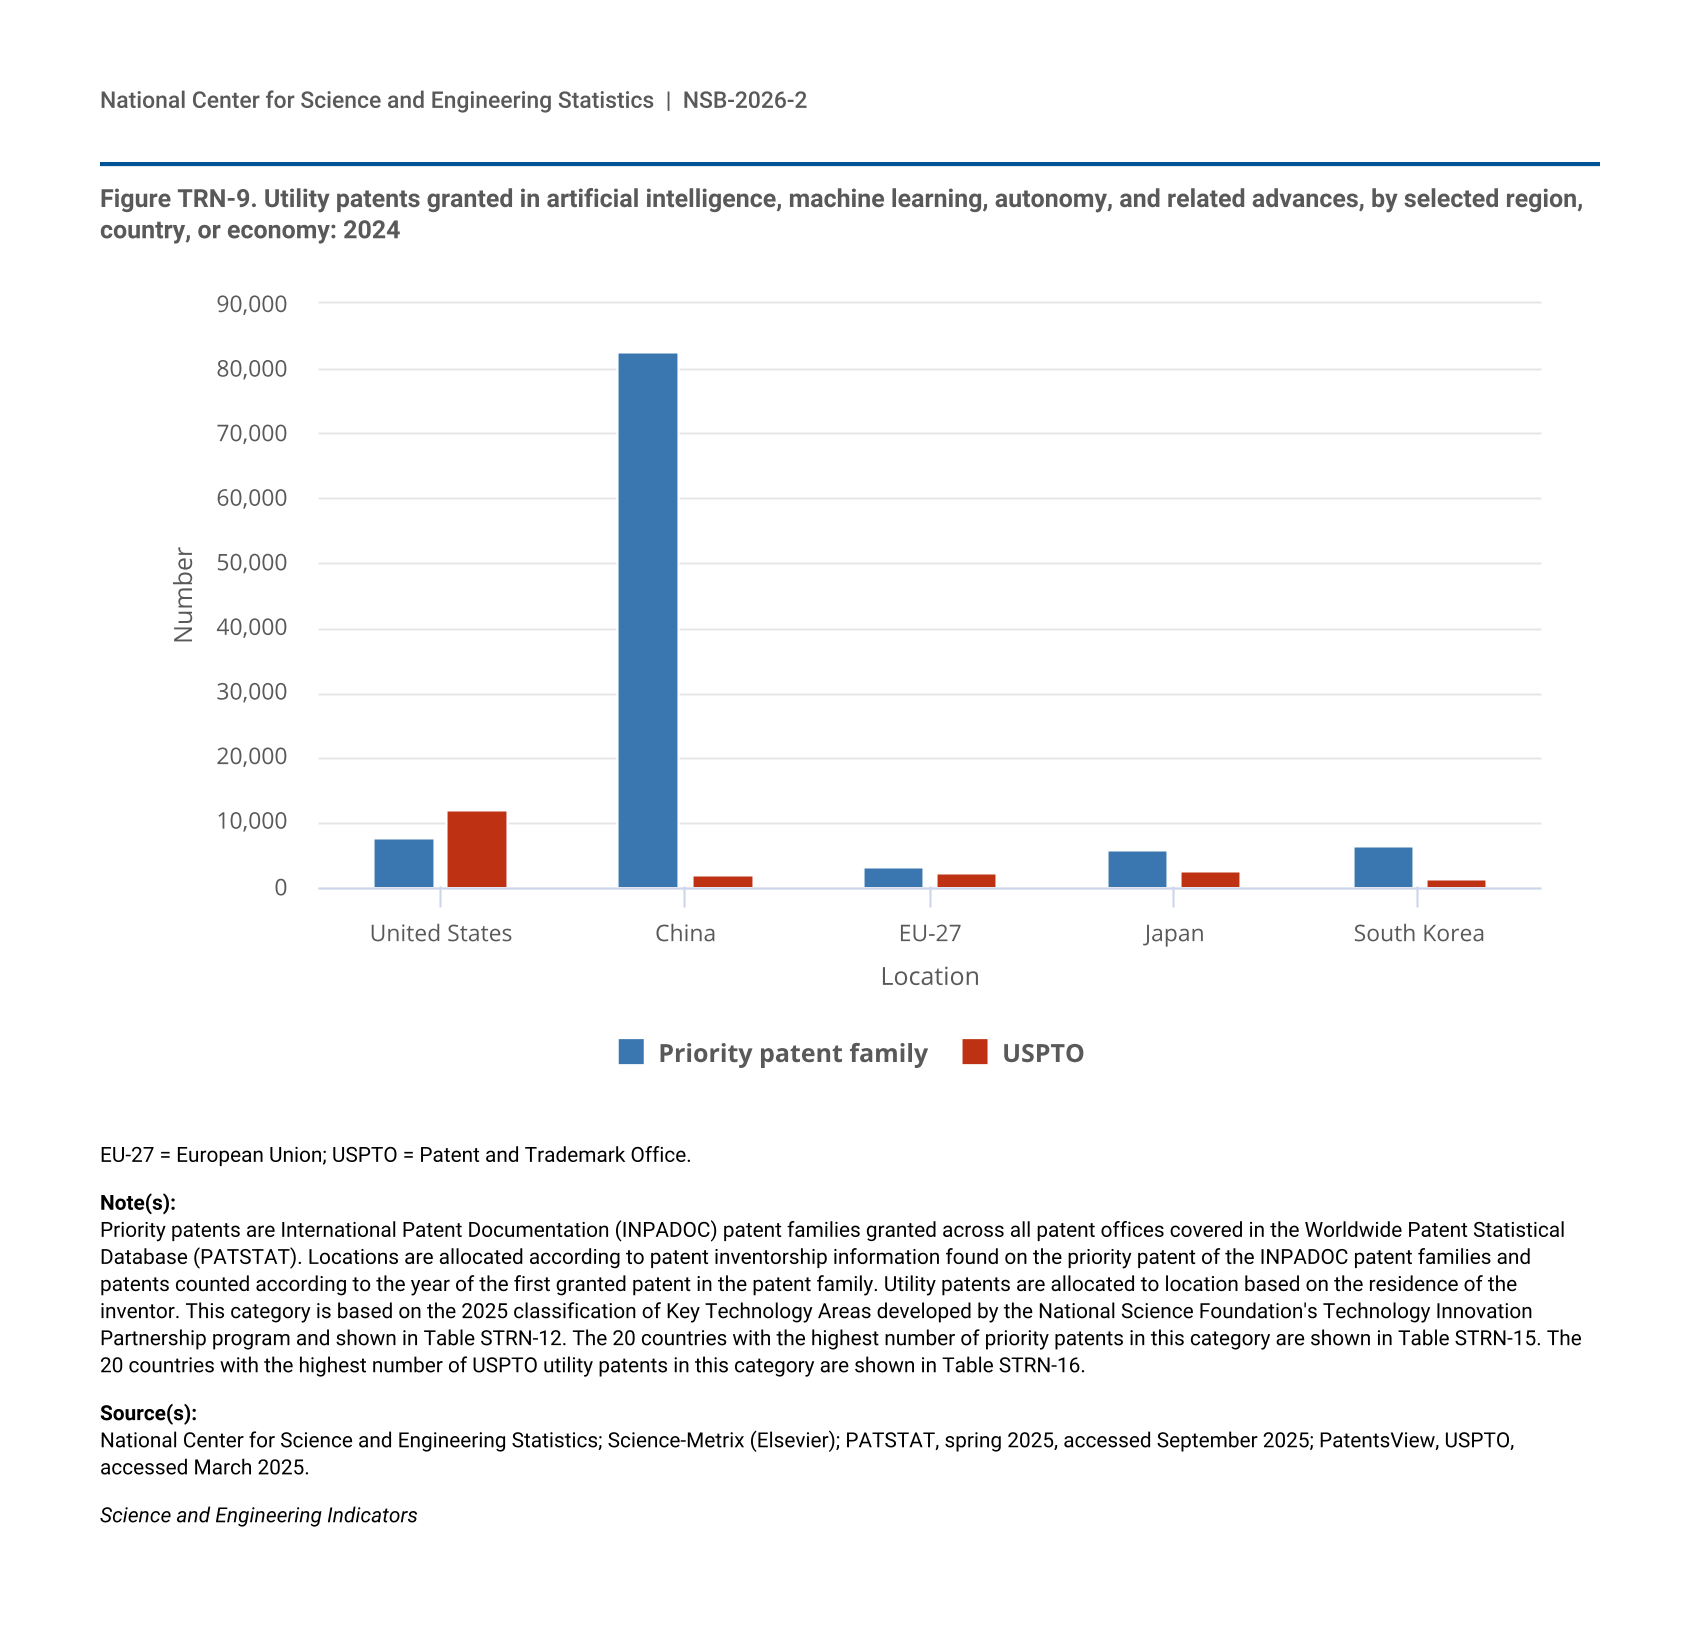
Business R&D investment devoted specifically to AI applications totaled $37 billion in 2022, or 5% of U.S. business R&D that year (NSB 2025; NCSES BERD 2022: Table 21). Internationally, growth in priority patent families granted in AI, machine learning, autonomy, and related advances accelerated in the years preceding the COVID-19 pandemic. By 2022, priority patent families attributed to China accounted for more than half of all the priority patent families granted (Figure TRN-8; Table STRN-15). In 2024, of the 110,000 AI priority patent families granted globally, 7,600 were granted to U.S. inventors. Inventors from South Korea were granted almost 6,400 and inventors from Japan were granted almost 5,800 in the same year. Compared with priority patent families, relatively fewer USPTO patents are granted to foreign inventors. The USPTO granted 12,000 patents to U.S. inventors in 2024, while inventors from Japan were granted 2,700 patents (Figure TRN-9; Table STRN-16).
| Year | World | China |
|---|---|---|
| 2010 | 7,026 | 689 |
| 2011 | 8,073 | 1,085 |
| 2012 | 9,622 | 1,367 |
| 2013 | 10,602 | 1,517 |
| 2014 | 11,451 | 1,543 |
| 2015 | 11,808 | 1,870 |
| 2016 | 13,958 | 2,535 |
| 2017 | 16,006 | 3,423 |
| 2018 | 17,427 | 4,034 |
| 2019 | 23,813 | 6,410 |
| 2020 | 33,898 | 12,857 |
| 2021 | 47,273 | 22,608 |
| 2022 | 73,522 | 45,829 |
| 2023 | 91,811 | 63,614 |
| 2024 | 109,682 | 82,708 |
Priority patents are International Patent Documentation (INPADOC) patent families granted across all patent offices covered in the Worldwide Patent Statistical Database (PATSTAT). Locations are allocated according to patent inventorship information found on the priority patent of the INPADOC patent families and patents counted according to the year of the first granted patent in the patent family. This category is based on the 2025 classification of Key Technology Areas developed by the National Science Foundation's Technology Innovation Partnership program and shown in Table STRN-12. The 20 countries with the highest number of priority patents in this category are shown in Table STRN-15. China includes Hong Kong.
National Center for Science and Engineering Statistics; Science-Metrix (Elsevier); PATSTAT, spring 2025, accessed September 2025.
Science and Engineering Indicators
| Location | Priority patent family | USPTO |
|---|---|---|
| United States | 7,584 | 11,994 |
| China | 82,708 | 1,998 |
| EU-27 | 3,374 | 2,114 |
| Japan | 5,778 | 2,708 |
| South Korea | 6,377 | 1,393 |
EU-27 = European Union; USPTO = Patent and Trademark Office.
Priority patents are International Patent Documentation (INPADOC) patent families granted across all patent offices covered in the Worldwide Patent Statistical Database (PATSTAT). Locations are allocated according to patent inventorship information found on the priority patent of the INPADOC patent families and patents counted according to the year of the first granted patent in the patent family. Utility patents are allocated to location based on the residence of the inventor. This category is based on the 2025 classification of Key Technology Areas developed by the National Science Foundation's Technology Innovation Partnership program and shown in Table STRN-12. The 20 countries with the highest number of priority patents in this category are shown in Table STRN-15. The 20 countries with the highest number of USPTO utility patents in this category are shown in Table STRN-16.
National Center for Science and Engineering Statistics; Science-Metrix (Elsevier); PATSTAT, spring 2025, accessed September 2025; PatentsView, USPTO, accessed March 2025.
Science and Engineering Indicators
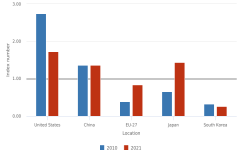
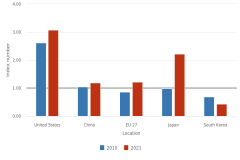
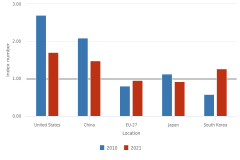
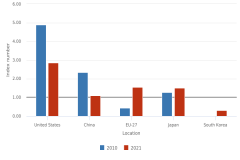
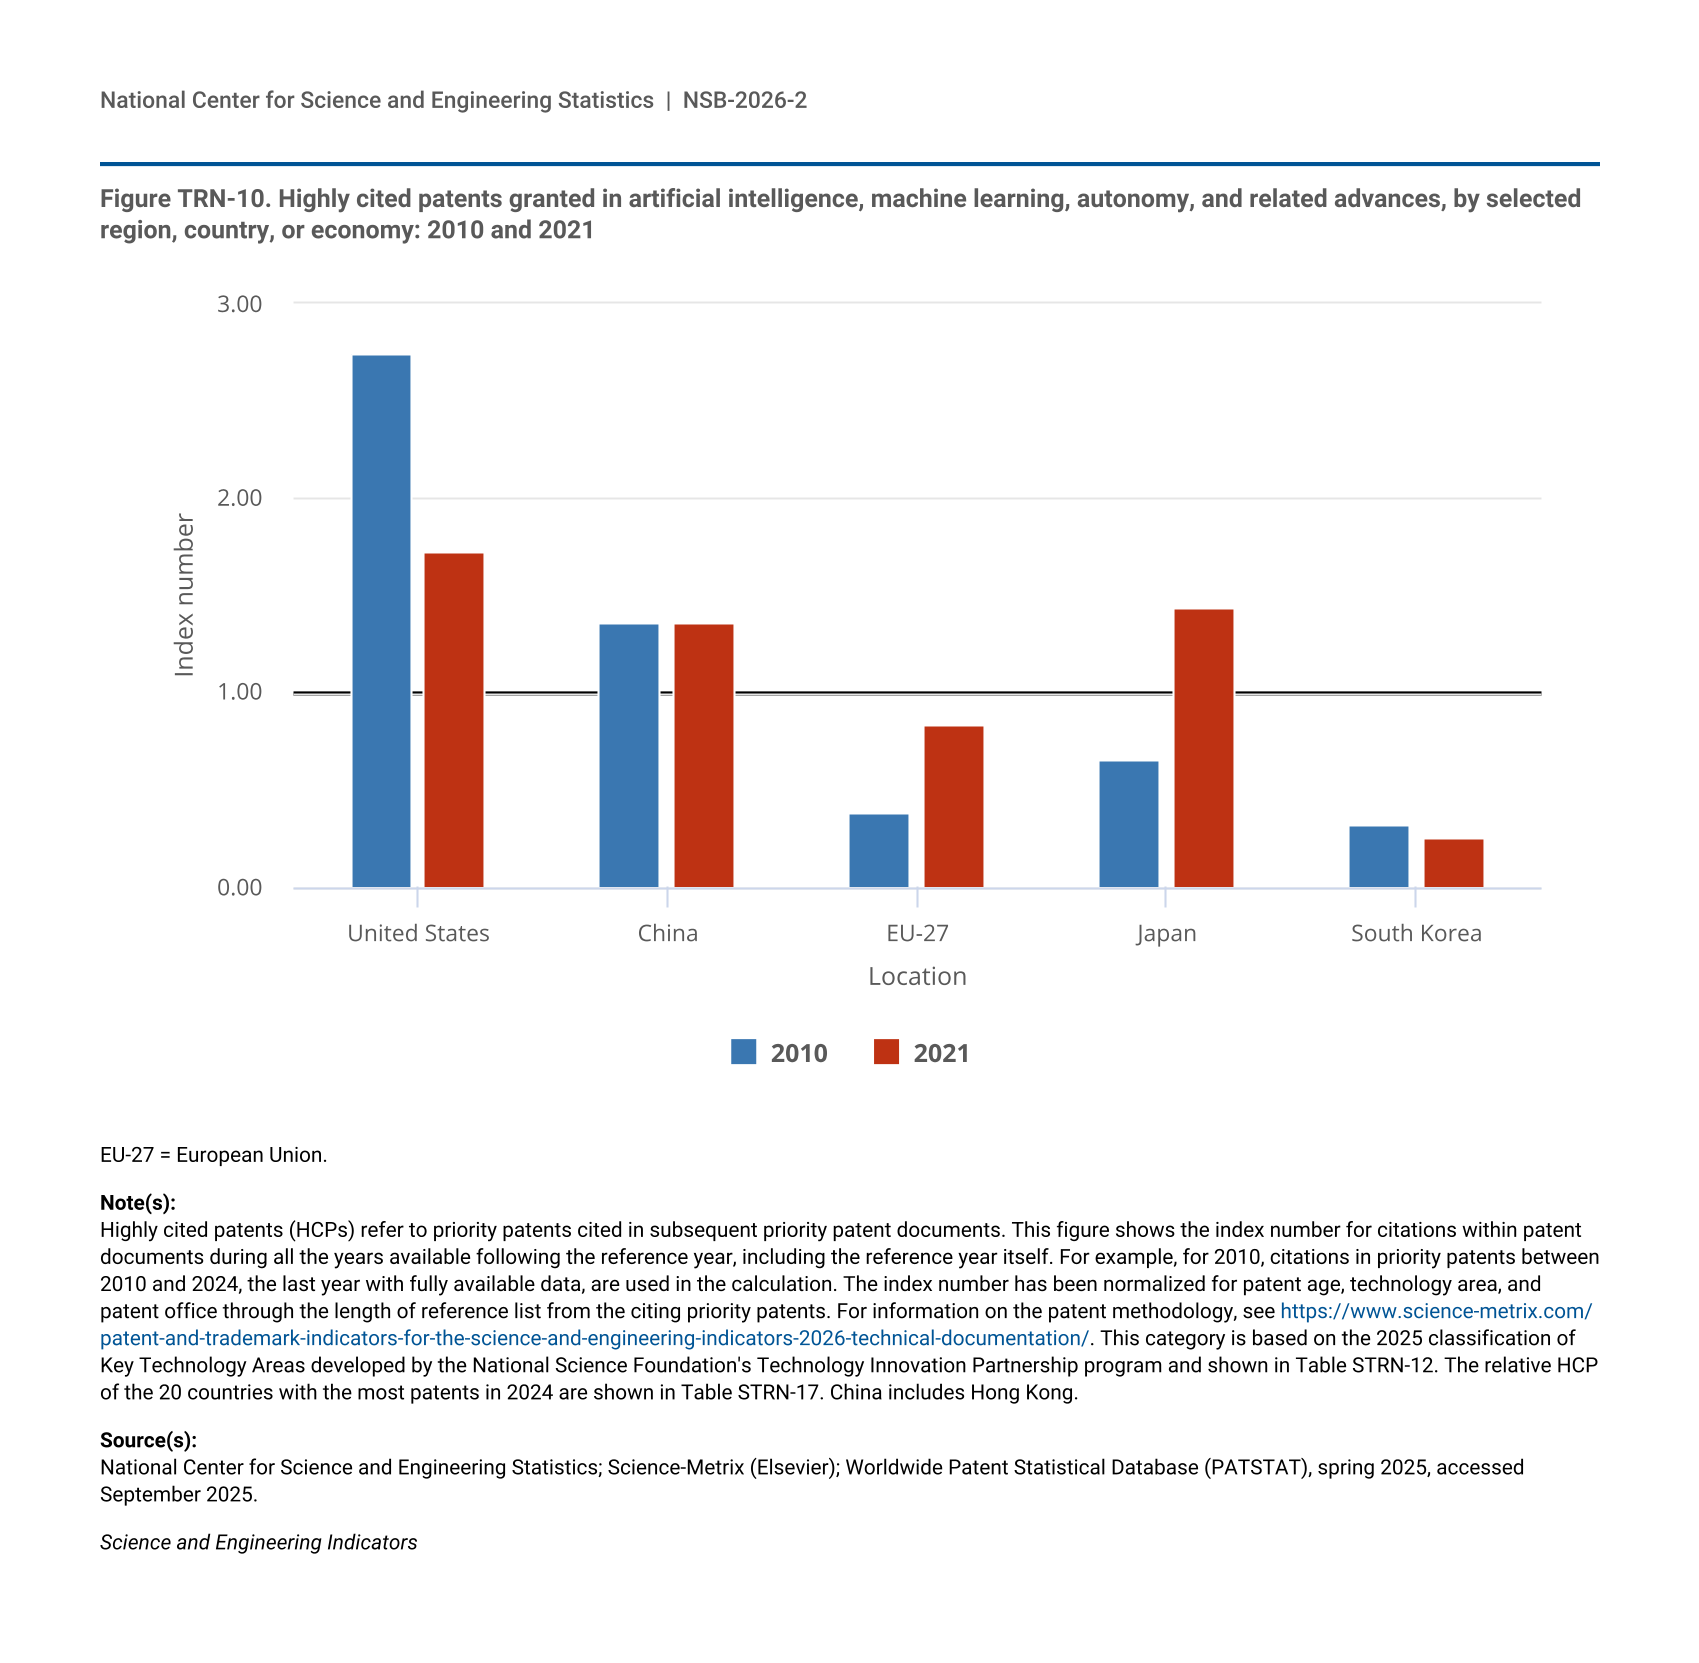
The impact of AI priority patent families, as measured by citations in subsequent patents, was higher for both the EU-27 and Japan in 2021 compared with 2010. For both 2010 and 2021, the HCP share for U.S. inventors showed that while U.S.-attributed AI priority patent families continued to have outsized impact, the HCP share was lower in 2021 (1.73) compared to 2010 (2.74). The HCP share for inventors from China changed little when comparing those two time periods (Figure TRN-10; Table STRN-17).
| Location | 2010 | 2021 |
|---|---|---|
| United States | 2.74 | 1.73 |
| China | 1.36 | 1.36 |
| EU-27 | 0.39 | 0.84 |
| Japan | 0.65 | 1.44 |
| South Korea | 0.32 | 0.26 |
EU-27 = European Union.
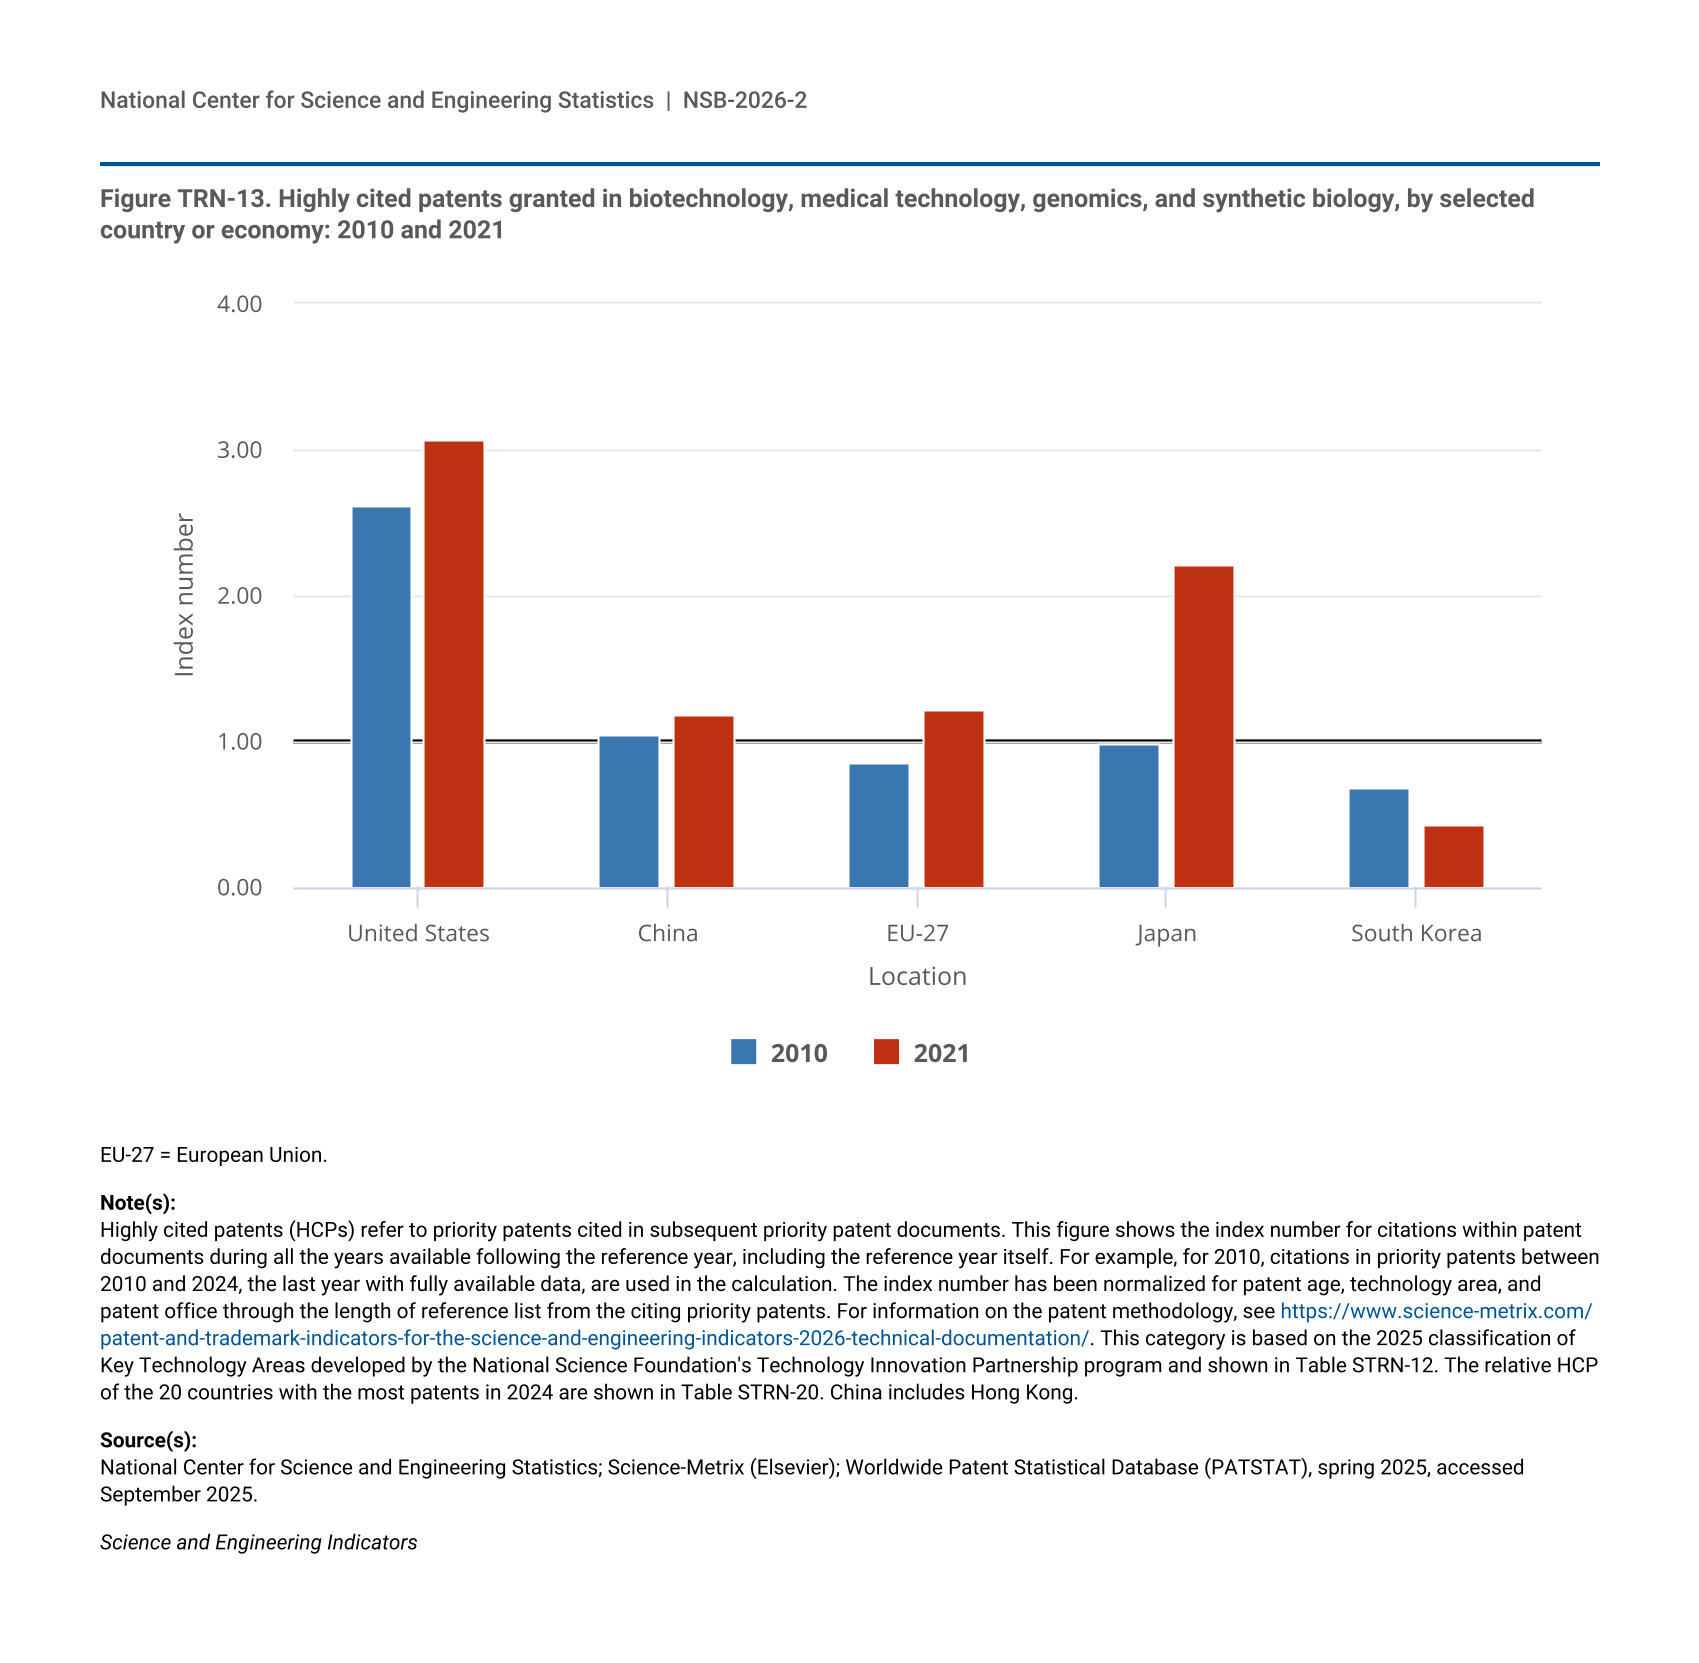
Highly cited patents (HCPs) refer to priority patents cited in subsequent priority patent documents. This figure shows the index number for citations within patent documents during all the years available following the reference year, including the reference year itself. For example, for 2010, citations in priority patents between 2010 and 2024, the last year with fully available data, are used in the calculation. The index number has been normalized for patent age, technology area, and patent office through the length of reference list from the citing priority patents. For information on the patent methodology, see https://www.science-metrix.com/patent-and-trademark-indicators-for-the-science-and-engineering-indicators-2026-technical-documentation/. This category is based on the 2025 classification of Key Technology Areas developed by the National Science Foundation's Technology Innovation Partnership program and shown in Table STRN-12. The relative HCP of the 20 countries with the most patents in 2024 are shown in Table STRN-17. China includes Hong Kong.
National Center for Science and Engineering Statistics; Science-Metrix (Elsevier); Worldwide Patent Statistical Database (PATSTAT), spring 2025, accessed September 2025.
Science and Engineering Indicators
Semiconductors
Semiconductors are foundational components of electronic computing devices. Achieving international leadership in research, domestic manufacturing, and the development of a robust domestic technical workforce has been a goal of multiple recent presidential administrations as well as the focus of the 2022 CHIPS and Science Act (NSTC 2025). The semiconductor machinery and the semiconductor components manufacturing industries are R&D intensive, together accounting for about 8% of all U.S. business R&D in 2022 (NCSES 2024).
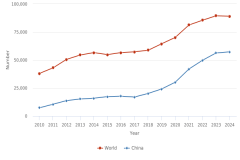
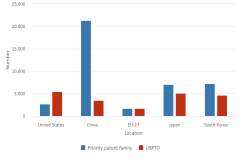
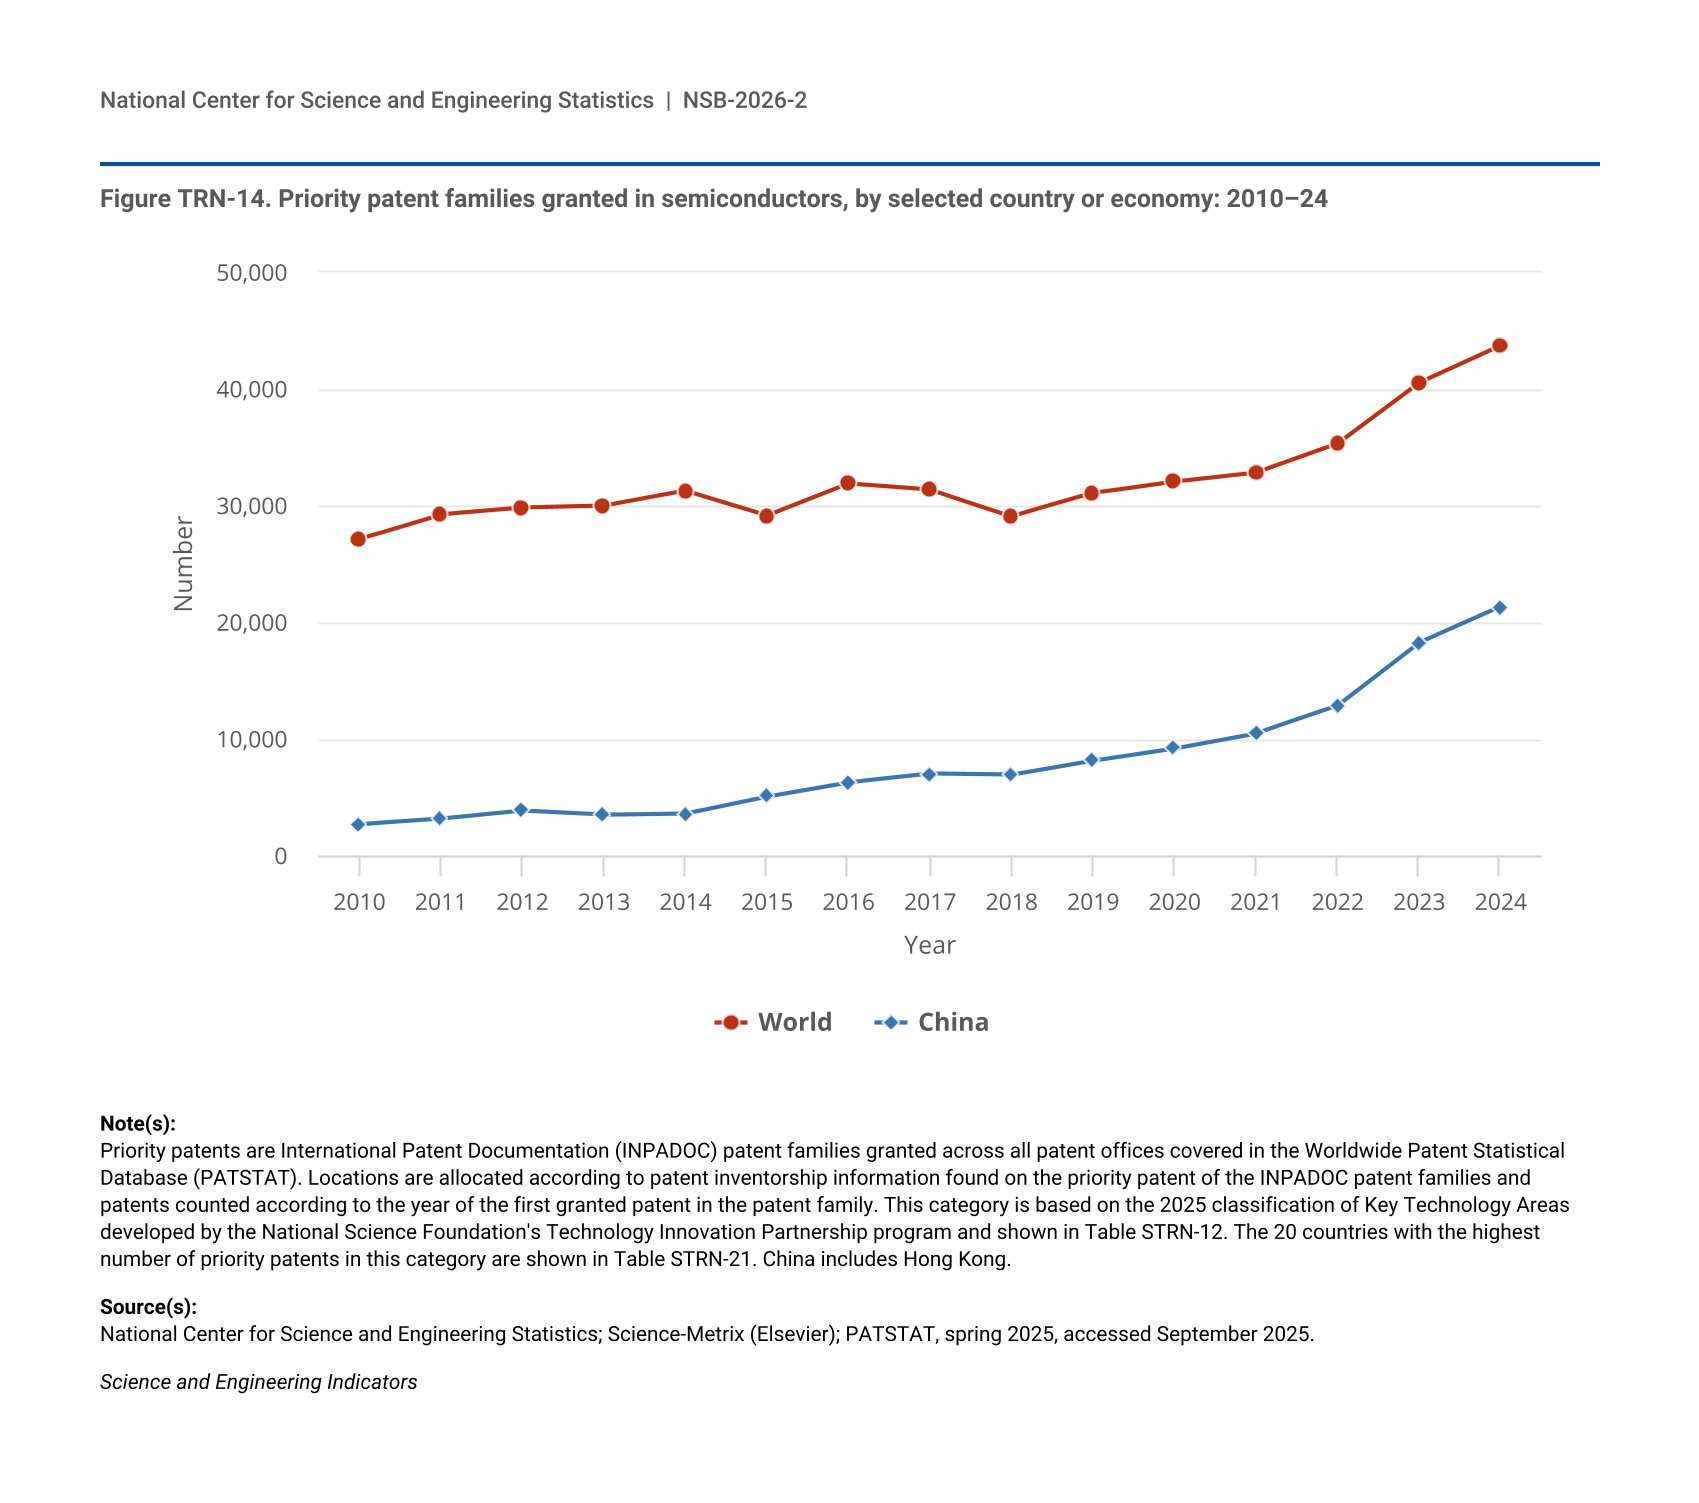
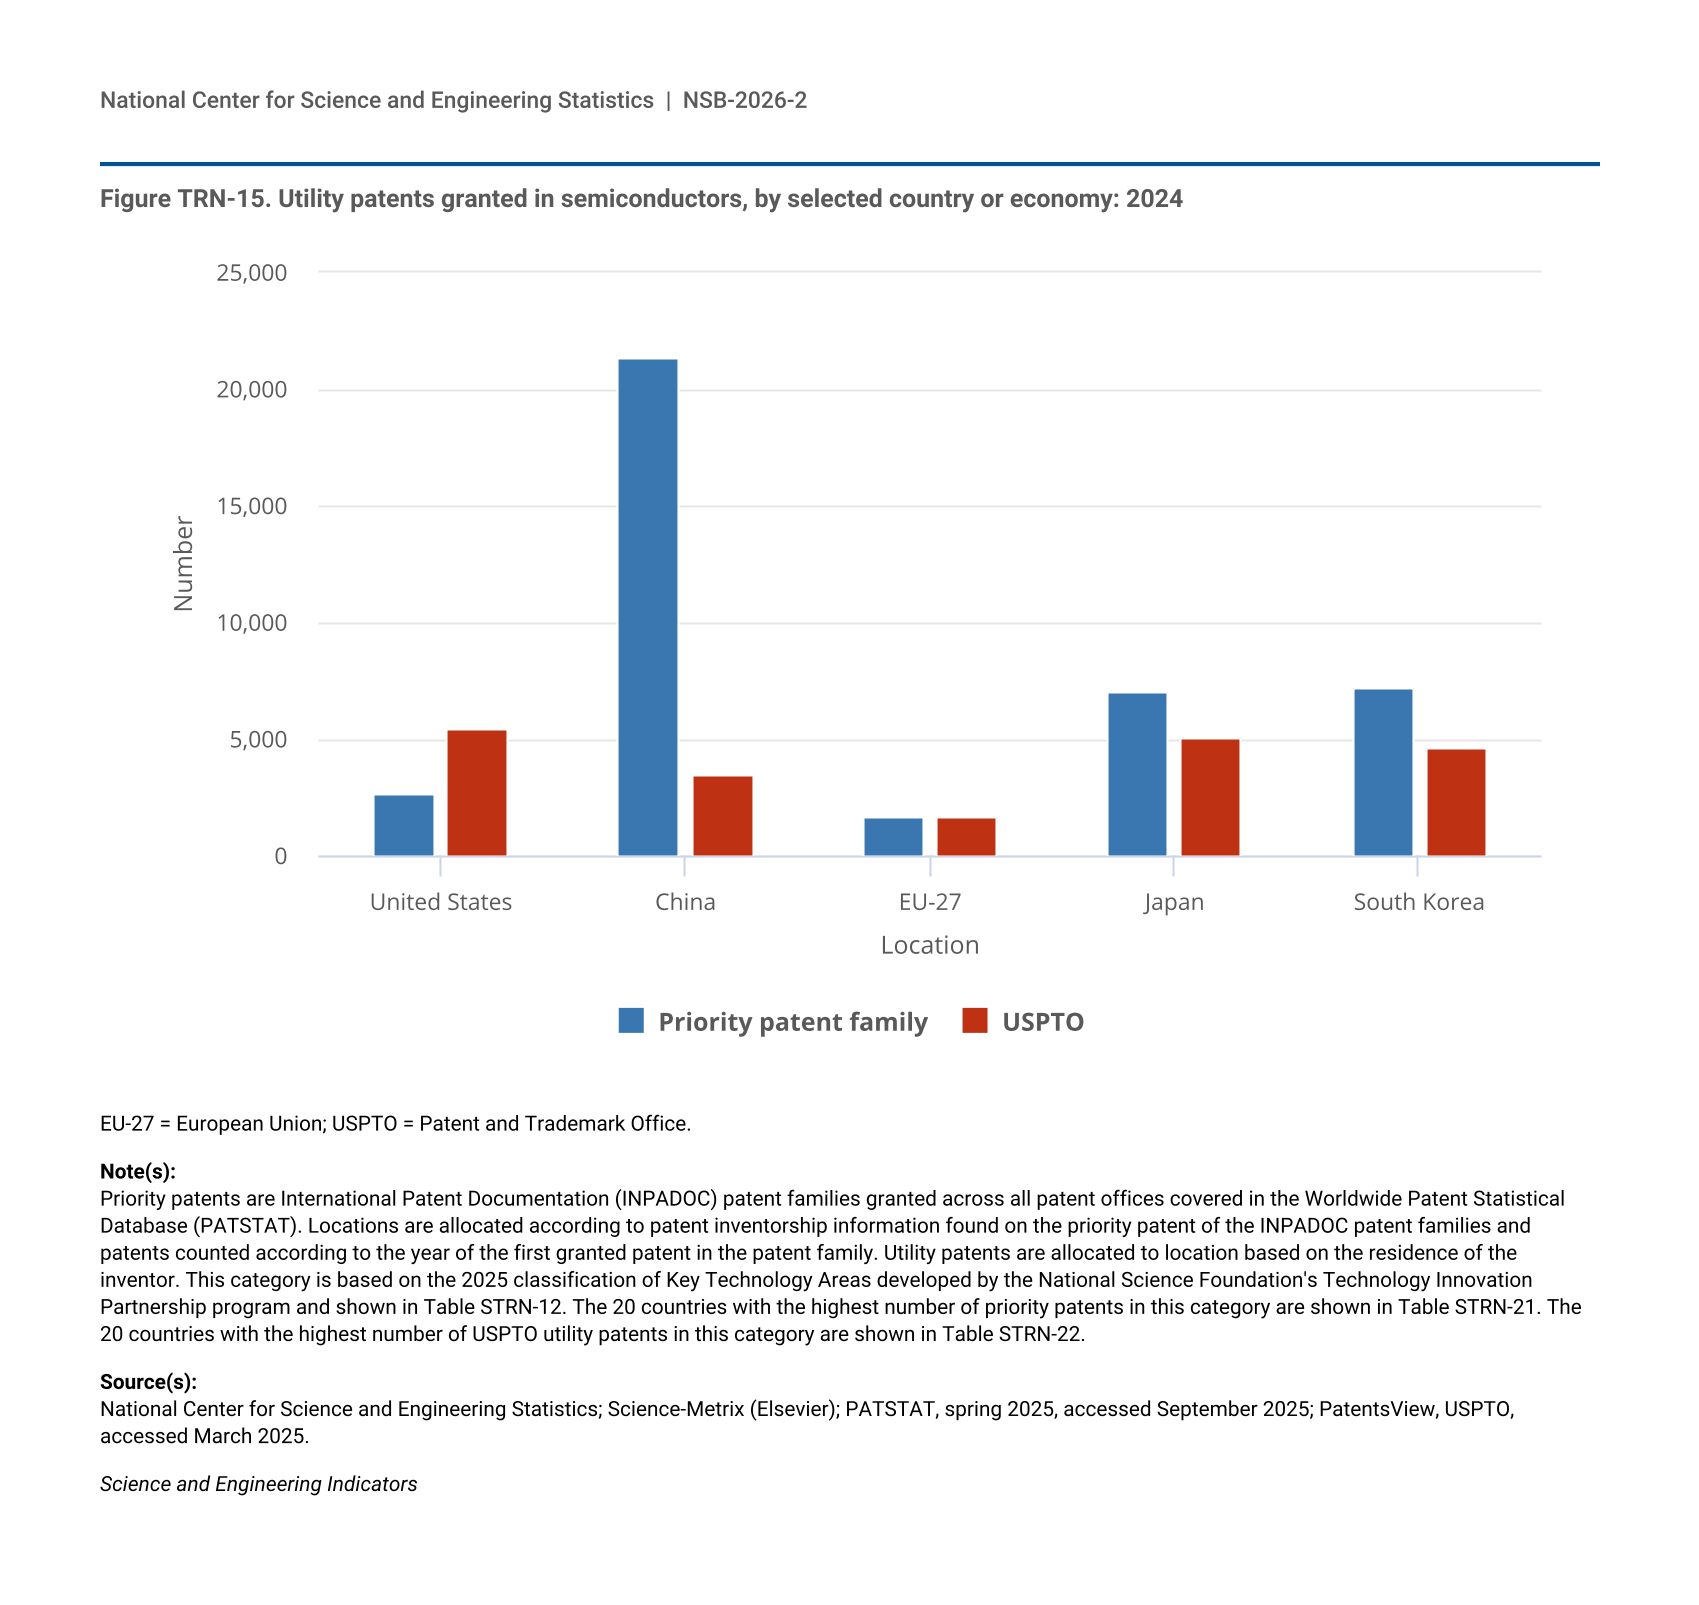
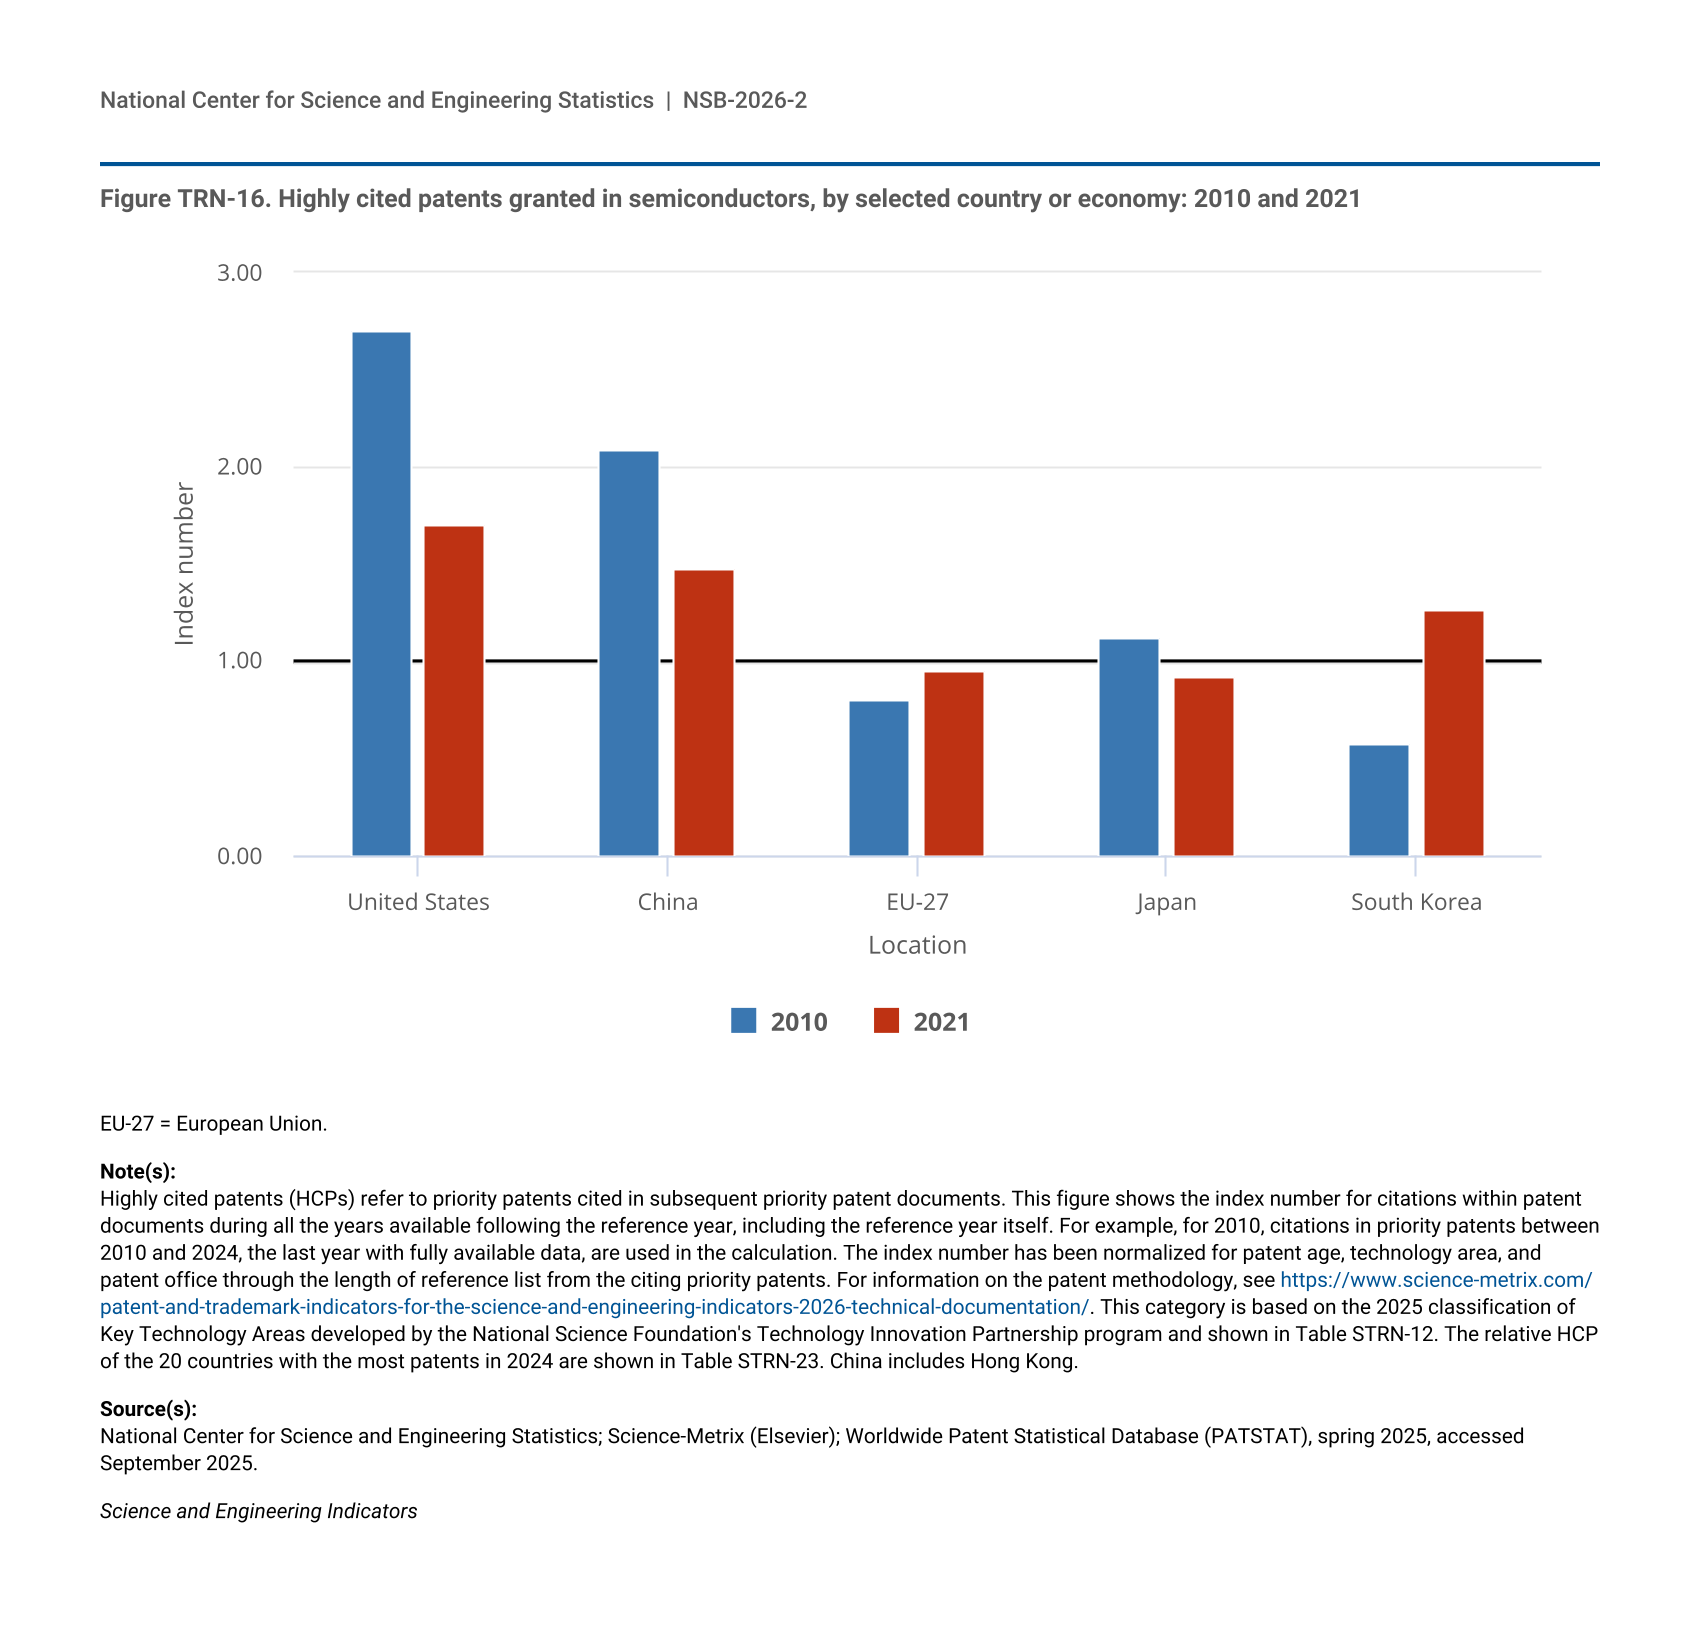
Globally, about 44,000 priority patent families were granted to inventors of semiconductor technology patents in 2024, and about half of these are from inventors in China (21,000) (Figure TRN-14). Inventors from South Korea and Japan were granted about 7,200 and 7,000, respectively, that year (Table STRN-21). Within the U.S. market, inventors in Japan and South Korea (shown in Figure TRN-15) and in Taiwan (Table STRN-22) accounted for more than half of USPTO semiconductor technology patents awarded in 2024. The HCP share for semiconductor priority patent families attributed to inventors from the EU-27 and South Korea were higher in 2021 when compared to 2010. Conversely, the shares for the United States, China, and Japan were lower in 2021 when compared to 2010 (Figure TRN-16). Canada, Belgium, and Finland had HCP shares above 4.0 in 2021, reflecting a number of highly impactful priority patent families out of a smaller overall pool of patents driving high HCP shares (Table STRN-23).
| Year | World | China |
|---|---|---|
| 2010 | 27,155 | 2,690 |
| 2011 | 29,279 | 3,149 |
| 2012 | 29,840 | 3,848 |
| 2013 | 30,004 | 3,513 |
| 2014 | 31,293 | 3,624 |
| 2015 | 29,188 | 5,091 |
| 2016 | 31,913 | 6,306 |
| 2017 | 31,383 | 7,034 |
| 2018 | 29,100 | 6,937 |
| 2019 | 31,101 | 8,170 |
| 2020 | 32,107 | 9,220 |
| 2021 | 32,883 | 10,500 |
| 2022 | 35,356 | 12,850 |
| 2023 | 40,566 | 18,242 |
| 2024 | 43,770 | 21,329 |
Priority patents are International Patent Documentation (INPADOC) patent families granted across all patent offices covered in the Worldwide Patent Statistical Database (PATSTAT). Locations are allocated according to patent inventorship information found on the priority patent of the INPADOC patent families and patents counted according to the year of the first granted patent in the patent family. This category is based on the 2025 classification of Key Technology Areas developed by the National Science Foundation's Technology Innovation Partnership program and shown in Table STRN-12. The 20 countries with the highest number of priority patents in this category are shown in Table STRN-21. China includes Hong Kong.
National Center for Science and Engineering Statistics; Science-Metrix (Elsevier); PATSTAT, spring 2025, accessed September 2025.
Science and Engineering Indicators
| Location | Priority patent family | USPTO |
|---|---|---|
| United States | 2,709 | 5,481 |
| China | 21,329 | 3,446 |
| EU-27 | 1,667 | 1,662 |
| Japan | 7,040 | 5,090 |
| South Korea | 7,192 | 4,666 |
EU-27 = European Union; USPTO = Patent and Trademark Office.
Priority patents are International Patent Documentation (INPADOC) patent families granted across all patent offices covered in the Worldwide Patent Statistical Database (PATSTAT). Locations are allocated according to patent inventorship information found on the priority patent of the INPADOC patent families and patents counted according to the year of the first granted patent in the patent family. Utility patents are allocated to location based on the residence of the inventor. This category is based on the 2025 classification of Key Technology Areas developed by the National Science Foundation's Technology Innovation Partnership program and shown in Table STRN-12. The 20 countries with the highest number of priority patents in this category are shown in Table STRN-21. The 20 countries with the highest number of USPTO utility patents in this category are shown in Table STRN-22.
National Center for Science and Engineering Statistics; Science-Metrix (Elsevier); PATSTAT, spring 2025, accessed September 2025; PatentsView, USPTO, accessed March 2025.
Science and Engineering Indicators
| Location | 2010 | 2021 |
|---|---|---|
| United States | 2.70 | 1.70 |
| China | 2.09 | 1.48 |
| EU-27 | 0.80 | 0.95 |
| Japan | 1.12 | 0.92 |
| South Korea | 0.58 | 1.26 |
EU-27 = European Union.
Highly cited patents (HCPs) refer to priority patents cited in subsequent priority patent documents. This figure shows the index number for citations within patent documents during all the years available following the reference year, including the reference year itself. For example, for 2010, citations in priority patents between 2010 and 2024, the last year with fully available data, are used in the calculation. The index number has been normalized for patent age, technology area, and patent office through the length of reference list from the citing priority patents. For information on the patent methodology, see https://www.science-metrix.com/patent-and-trademark-indicators-for-the-science-and-engineering-indicators-2026-technical-documentation/. This category is based on the 2025 classification of Key Technology Areas developed by the National Science Foundation's Technology Innovation Partnership program and shown in Table STRN-12. The relative HCP of the 20 countries with the most patents in 2024 are shown in Table STRN-23. China includes Hong Kong.
National Center for Science and Engineering Statistics; Science-Metrix (Elsevier); Worldwide Patent Statistical Database (PATSTAT), spring 2025, accessed September 2025.
Science and Engineering Indicators
Quantum Information Science and Technology
QIST aims to use very small particles, or qubits, to develop computing, communication, and sensing systems to store, carry, and process information, leading to new technologies that can potentially solve problems that are currently unsolvable with available computation methods (for more discussion, see https://www.nist.gov/quantum-information-science). These problems include the encryption technologies used in economic and national security transactions, encouraging the race to be first to develop functional quantum computers (NASEM 2025). The United Kingdom and Australia are among the countries that have made large public investments to develop commercial quantum applications (Australian Government 2023; NQTP 2020). The U.S. government’s National Quantum Initiative Act lays out a series of investments aimed at spurring innovation and protecting the security of these investments (NSTC 2024).
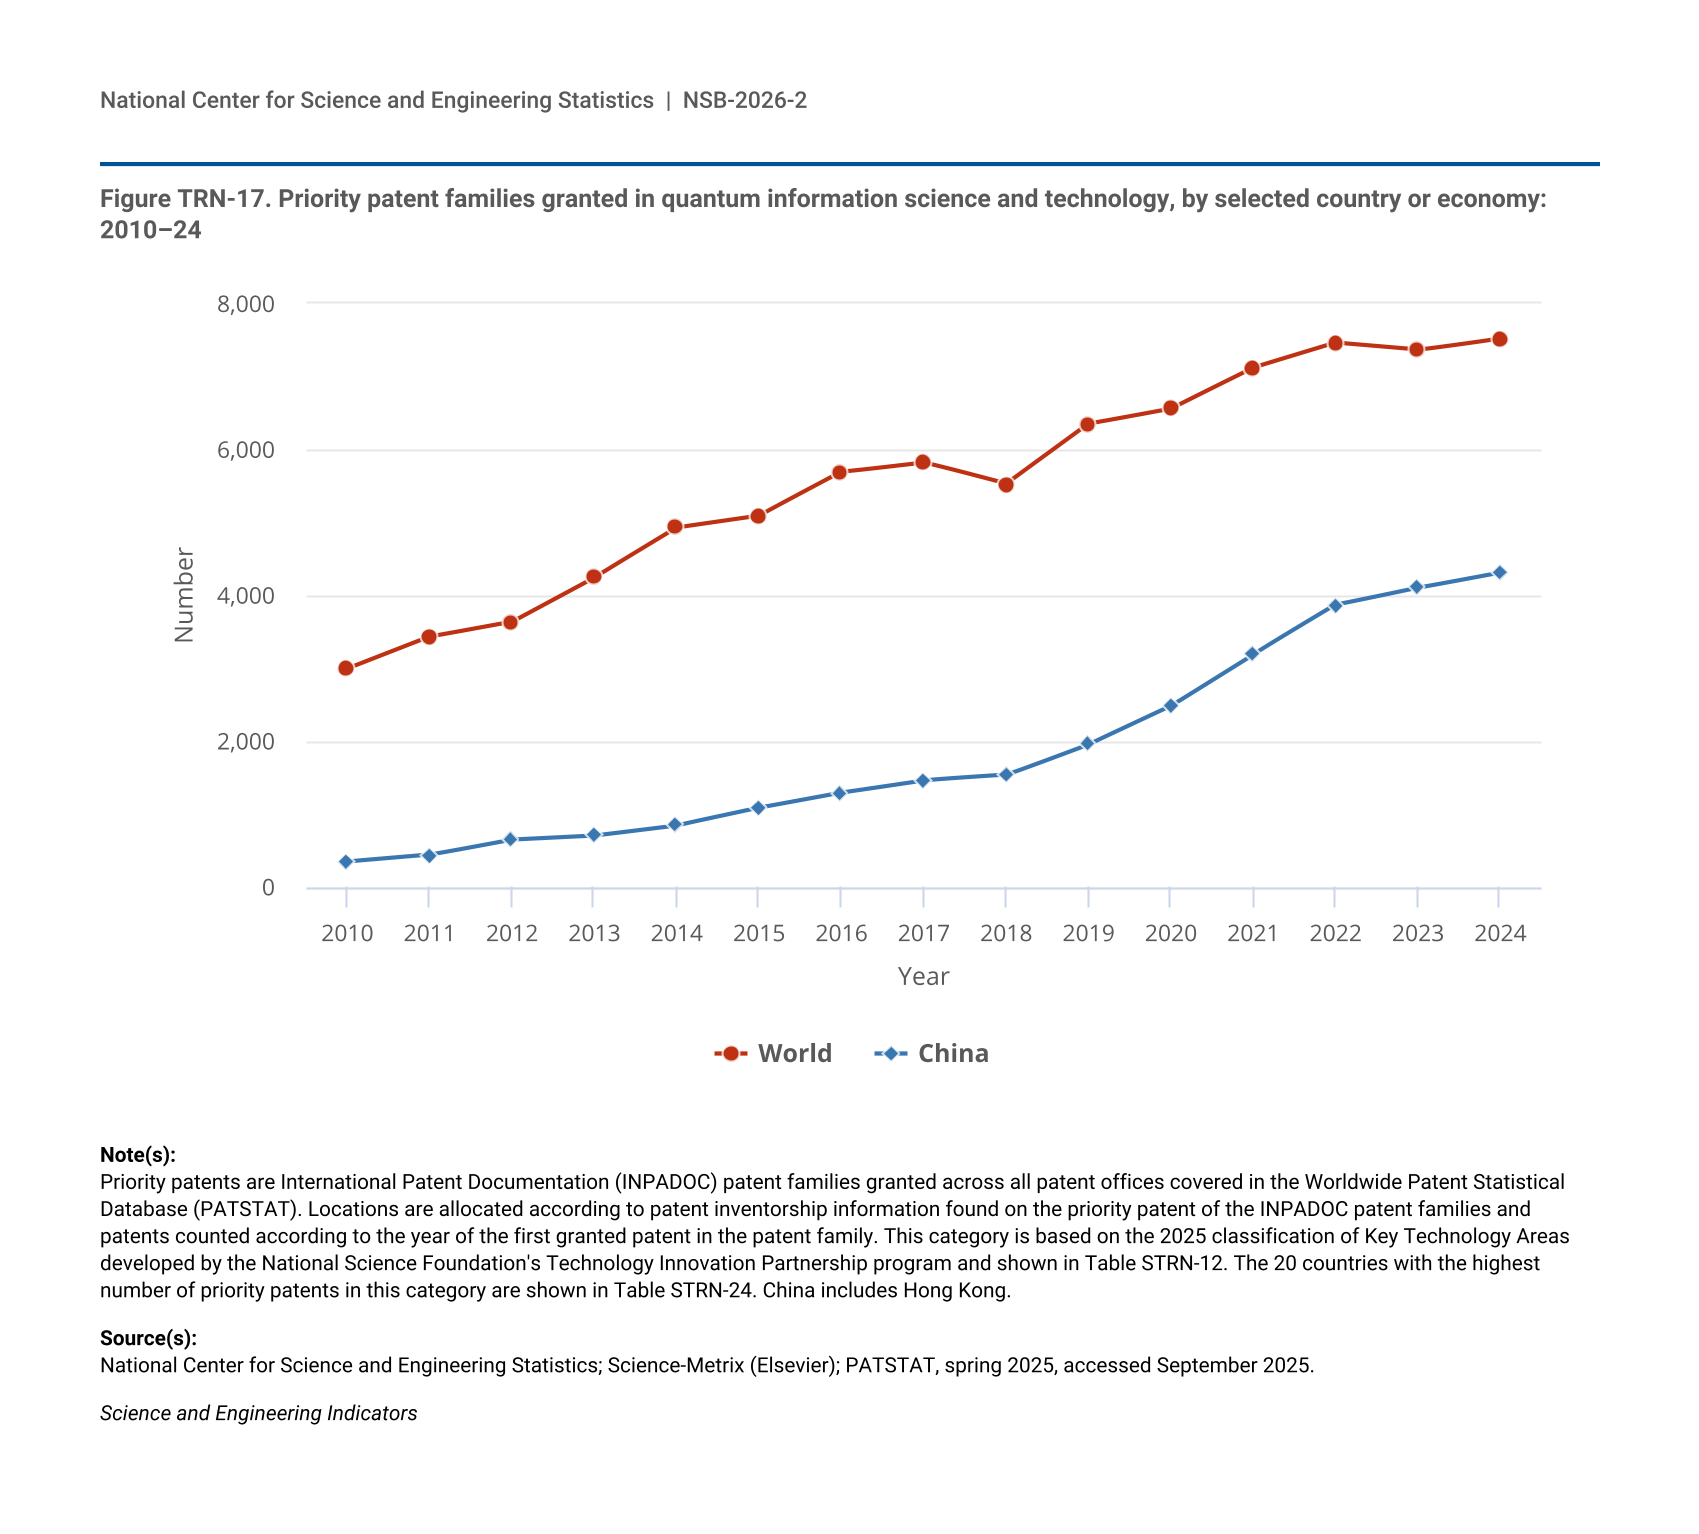
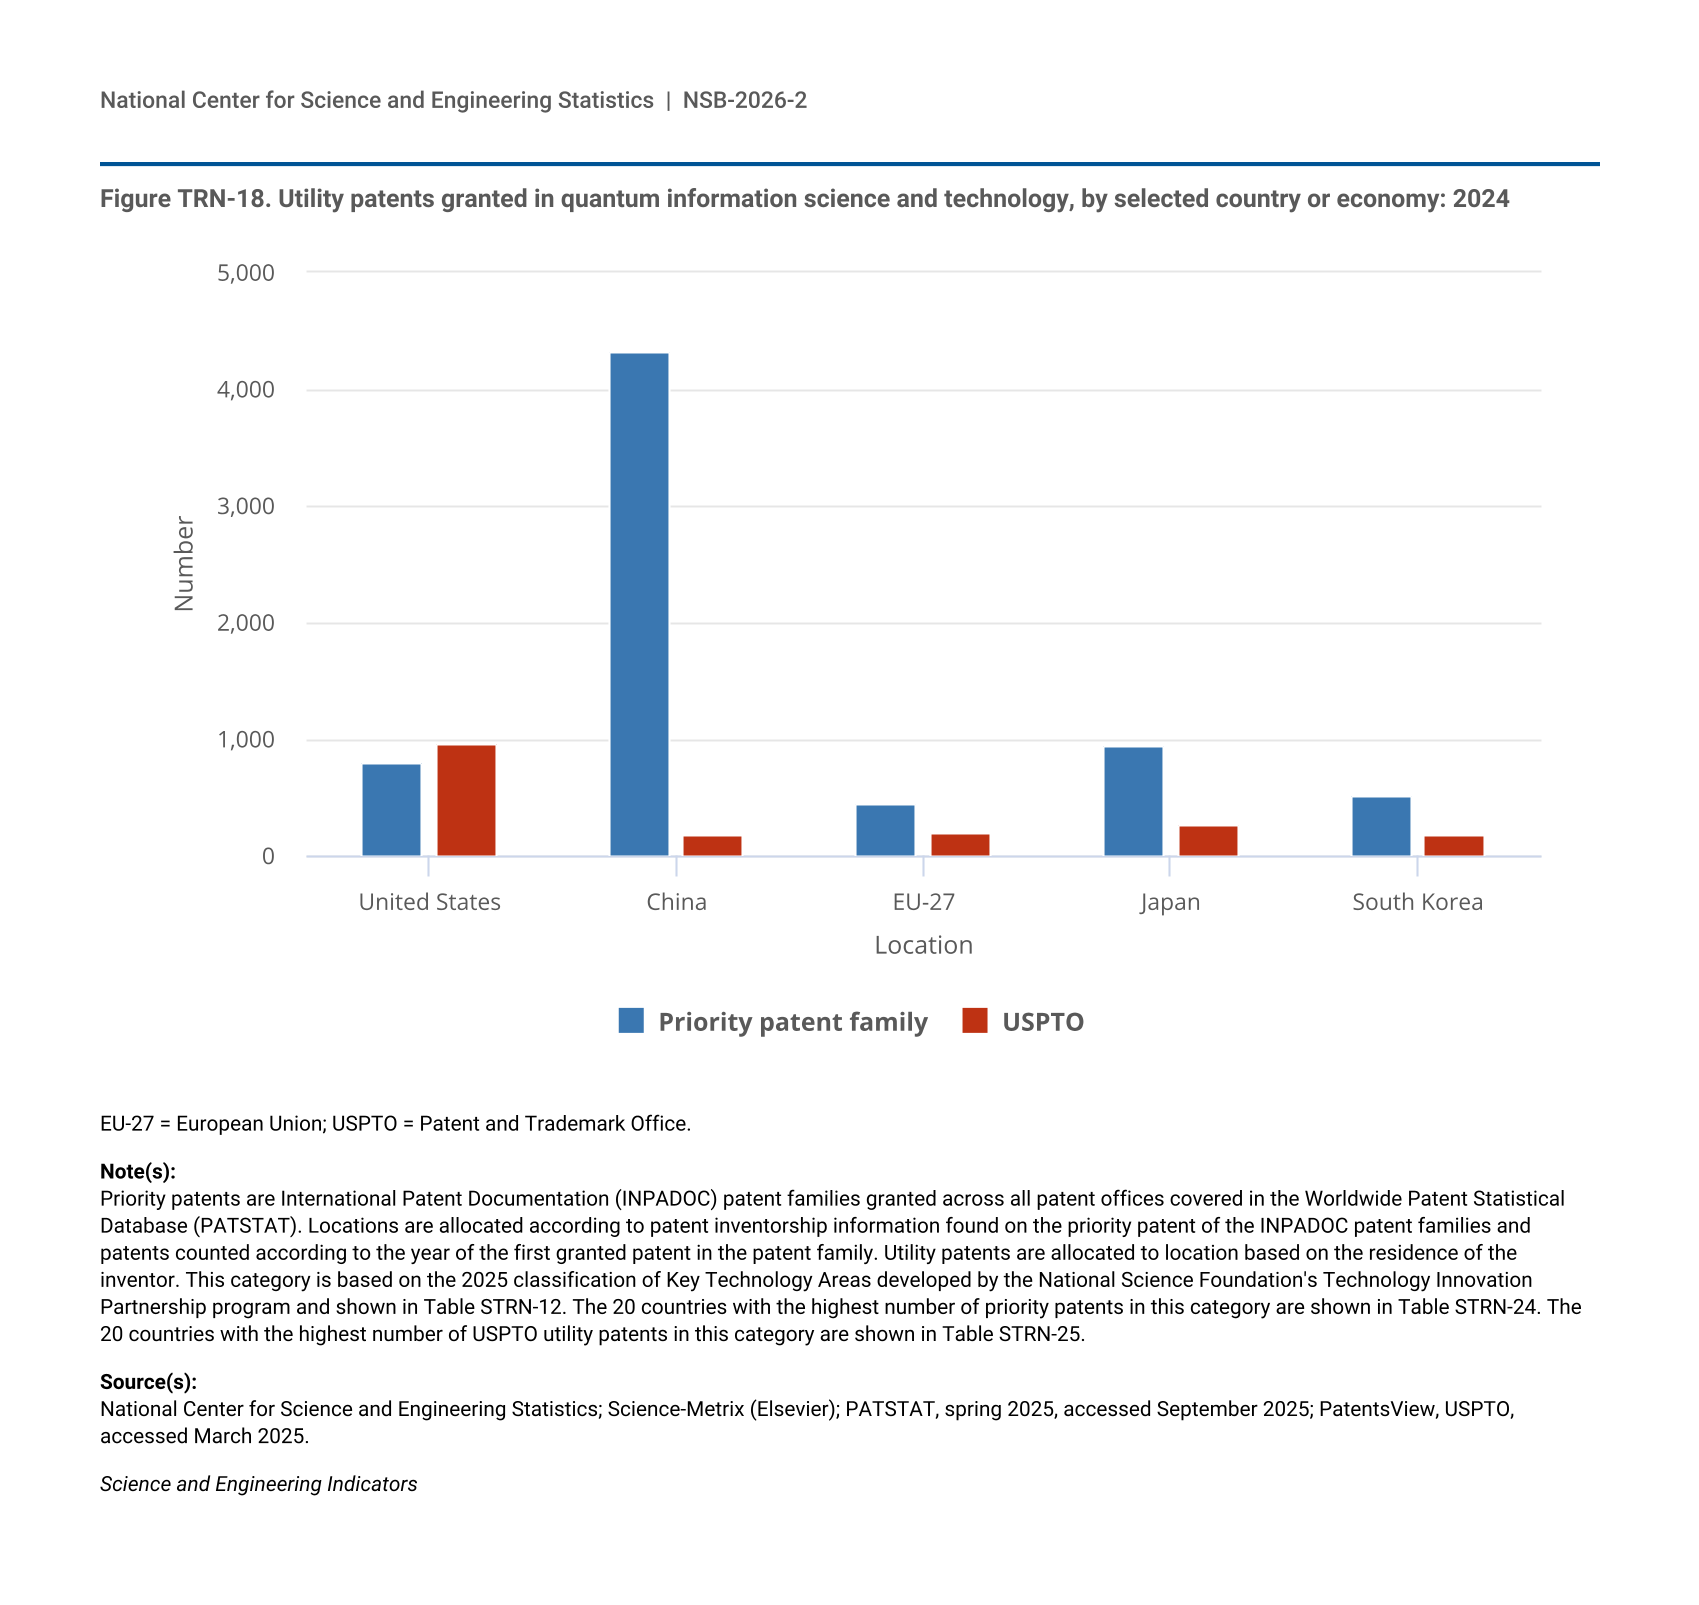
QIST inventors were granted about 7,500 priority patent families in 2024. Inventors from China were granted 4,300 of these (57%), increasing from about 300 (11%) in 2010 (Figure TRN-17). Inventors from Japan and the United States received the second- and third-highest number of priority patent families (900 and 800, respectively) that year (Figure TRN-18; Table STRN-24). Following the overall trend, inventors from the United States received more USPTO QIST patents than QIST priority patent families in 2024. While inventors from China are granted just a small fraction of USPTO QIST patents, that number has increased from about 1% of the world total in 2010 to 8% in 2024 (Table STRN-25).
| Year | World | China |
|---|---|---|
| 2010 | 2,993 | 344 |
| 2011 | 3,432 | 439 |
| 2012 | 3,640 | 651 |
| 2013 | 4,248 | 707 |
| 2014 | 4,931 | 846 |
| 2015 | 5,094 | 1,087 |
| 2016 | 5,692 | 1,296 |
| 2017 | 5,826 | 1,464 |
| 2018 | 5,527 | 1,537 |
| 2019 | 6,352 | 1,961 |
| 2020 | 6,561 | 2,488 |
| 2021 | 7,120 | 3,194 |
| 2022 | 7,462 | 3,868 |
| 2023 | 7,367 | 4,107 |
| 2024 | 7,528 | 4,319 |
Priority patents are International Patent Documentation (INPADOC) patent families granted across all patent offices covered in the Worldwide Patent Statistical Database (PATSTAT). Locations are allocated according to patent inventorship information found on the priority patent of the INPADOC patent families and patents counted according to the year of the first granted patent in the patent family. This category is based on the 2025 classification of Key Technology Areas developed by the National Science Foundation's Technology Innovation Partnership program and shown in Table STRN-12. The 20 countries with the highest number of priority patents in this category are shown in Table STRN-24. China includes Hong Kong.
National Center for Science and Engineering Statistics; Science-Metrix (Elsevier); PATSTAT, spring 2025, accessed September 2025.
Science and Engineering Indicators
| Location | Priority patent family | USPTO |
|---|---|---|
| United States | 812 | 962 |
| China | 4,319 | 187 |
| EU-27 | 443 | 190 |
| Japan | 940 | 275 |
| South Korea | 524 | 176 |
EU-27 = European Union; USPTO = Patent and Trademark Office.
Priority patents are International Patent Documentation (INPADOC) patent families granted across all patent offices covered in the Worldwide Patent Statistical Database (PATSTAT). Locations are allocated according to patent inventorship information found on the priority patent of the INPADOC patent families and patents counted according to the year of the first granted patent in the patent family. Utility patents are allocated to location based on the residence of the inventor. This category is based on the 2025 classification of Key Technology Areas developed by the National Science Foundation's Technology Innovation Partnership program and shown in Table STRN-12. The 20 countries with the highest number of priority patents in this category are shown in Table STRN-24. The 20 countries with the highest number of USPTO utility patents in this category are shown in Table STRN-25.
National Center for Science and Engineering Statistics; Science-Metrix (Elsevier); PATSTAT, spring 2025, accessed September 2025; PatentsView, USPTO, accessed March 2025.
Science and Engineering Indicators
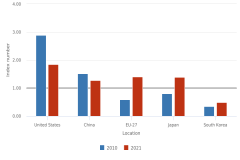
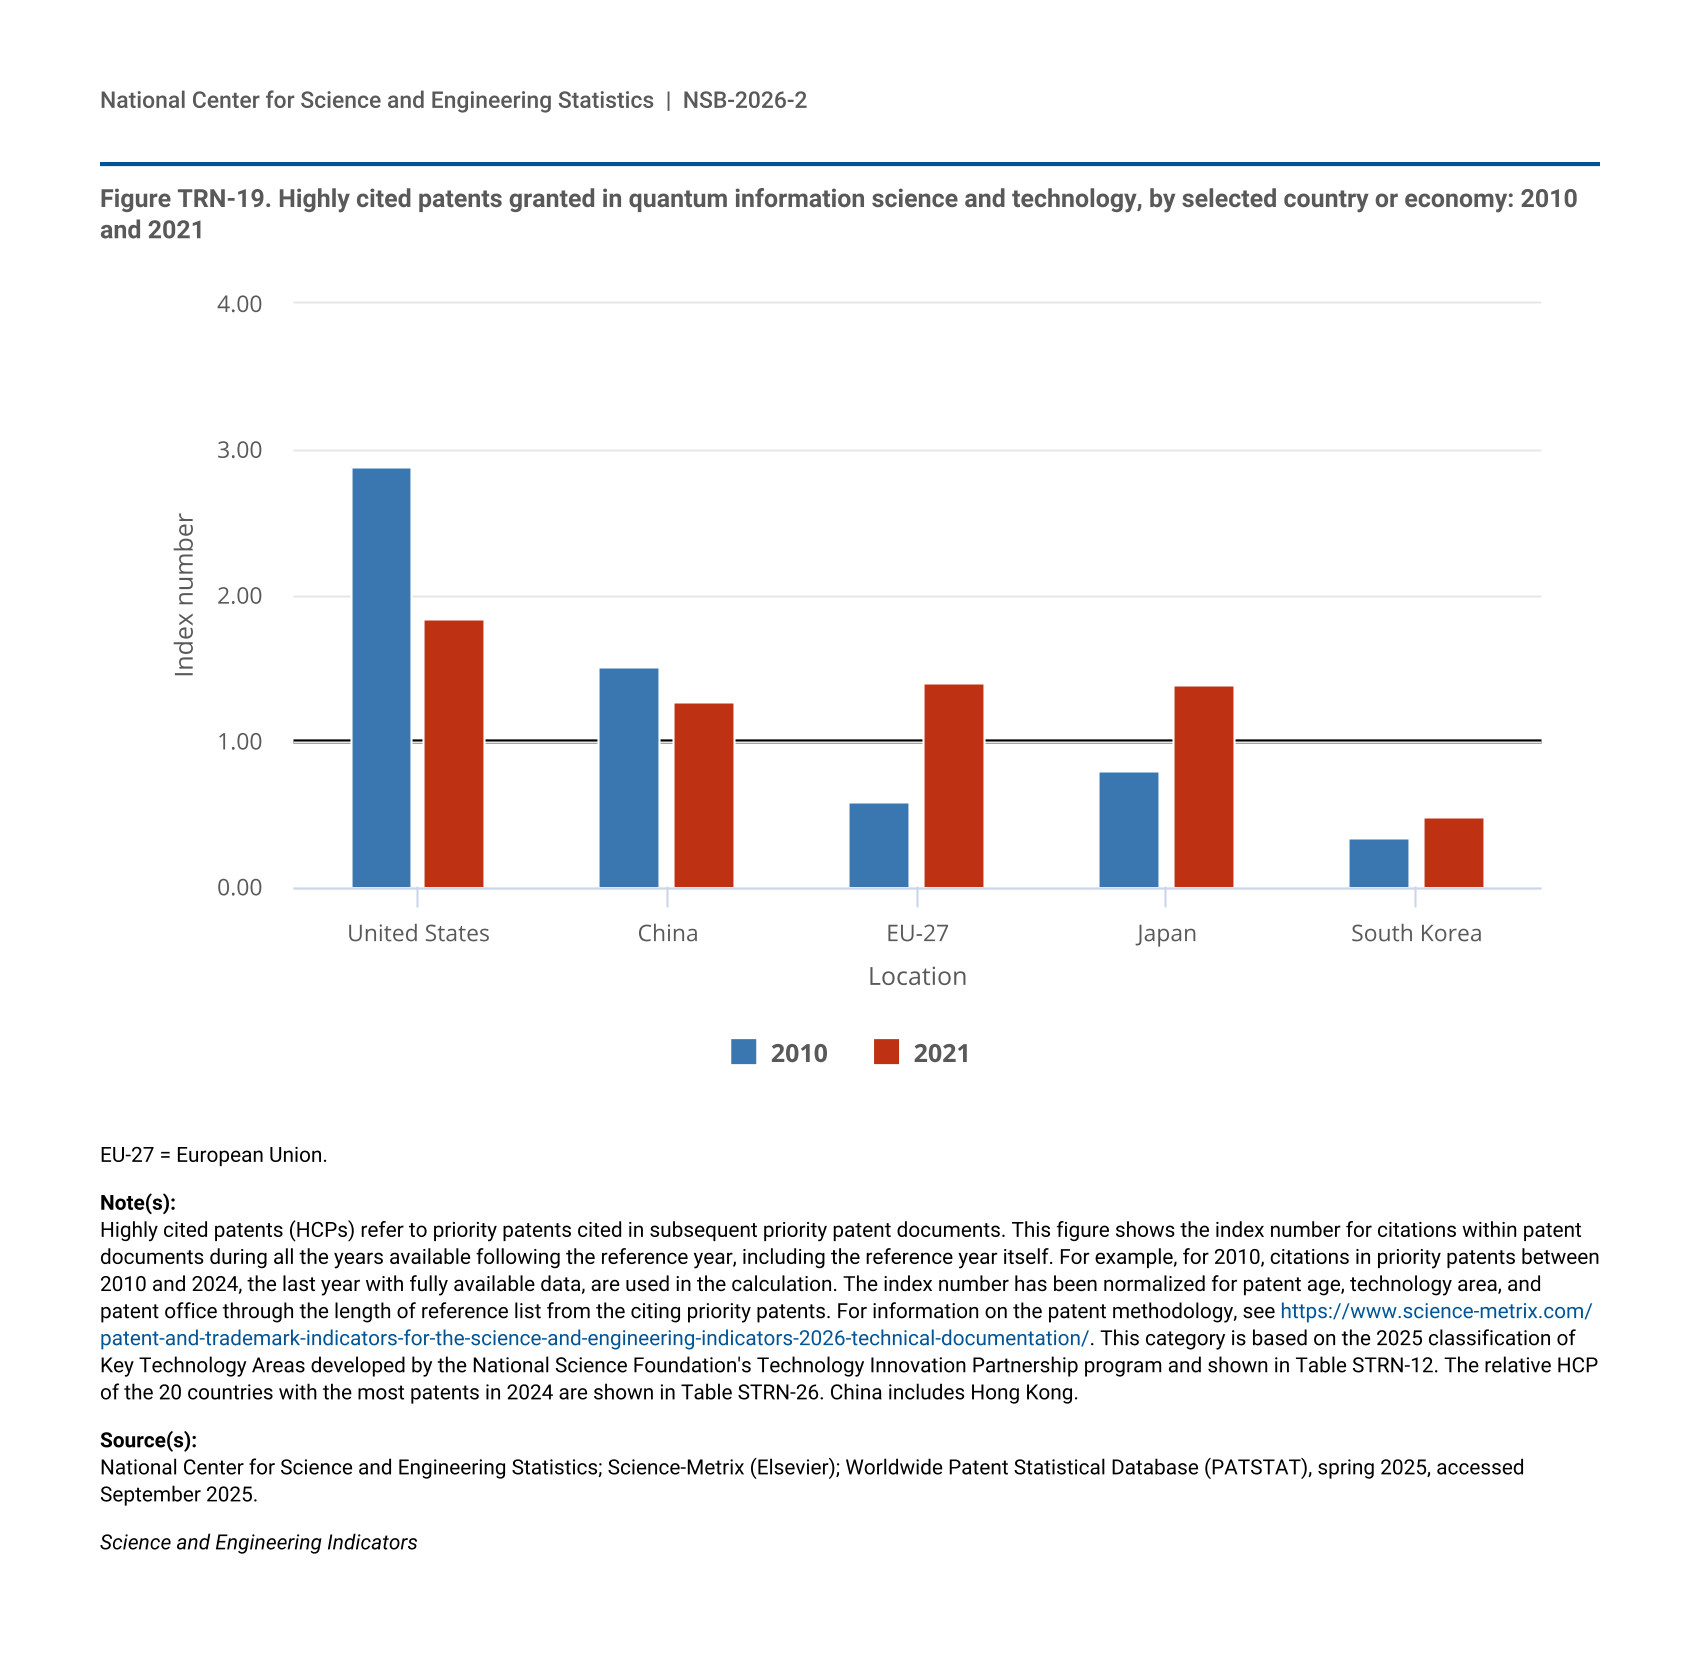
In both 2010 and 2021, inventors from the United States produced disproportionate shares of the top 1% of QIST HCPs. However, that advantage was smaller in 2021: the HCP share for QIST patents from U.S. inventors was 2.88 in 2010; by 2021, the share was 1.84. HCP shares for QIST patents from inventors in South Korea, the EU-27, and Japan increased between 2010 and 2021 (Figure TRN-19). Among other locations, patents granted in 2021 to inventors in Canada, Belgium, Finland, the United Kingdom, and Singapore had HCP shares above 3.00 (Table STRN-26).
| Location | 2010 | 2021 |
|---|---|---|
| United States | 2.88 | 1.84 |
| China | 1.52 | 1.27 |
| EU-27 | 0.59 | 1.40 |
| Japan | 0.80 | 1.39 |
| South Korea | 0.34 | 0.48 |
EU-27 = European Union.
Highly cited patents (HCPs) refer to priority patents cited in subsequent priority patent documents. This figure shows the index number for citations within patent documents during all the years available following the reference year, including the reference year itself. For example, for 2010, citations in priority patents between 2010 and 2024, the last year with fully available data, are used in the calculation. The index number has been normalized for patent age, technology area, and patent office through the length of reference list from the citing priority patents. For information on the patent methodology, see https://www.science-metrix.com/patent-and-trademark-indicators-for-the-science-and-engineering-indicators-2026-technical-documentation/. This category is based on the 2025 classification of Key Technology Areas developed by the National Science Foundation's Technology Innovation Partnership program and shown in Table STRN-12. The relative HCP of the 20 countries with the most patents in 2024 are shown in Table STRN-26. China includes Hong Kong.
National Center for Science and Engineering Statistics; Science-Metrix (Elsevier); Worldwide Patent Statistical Database (PATSTAT), spring 2025, accessed September 2025.
Science and Engineering Indicators
Nuclear Energy
The growth in the information sector of the U.S. economy has led to increased demand for electricity; by 2023, U.S. data centers accounted for 4.4% of total U.S. electricity consumption, and this share is expected to rise, according to a report by the Lawrence Berkeley National Laboratory (Shehabi, Smith, and Hubbard 2024). According to the International Energy Association (IEA), in recent years, nuclear market leadership has shifted toward China and Russia; half of all nuclear power plants under construction are currently in China (IEA 2025). In May 2025, the Trump administration announced executive orders to expand the use of nuclear power by streamlining regulations and adding capacity, aiming for 10 new large reactors to be under construction by 2030 (DOE 2025).
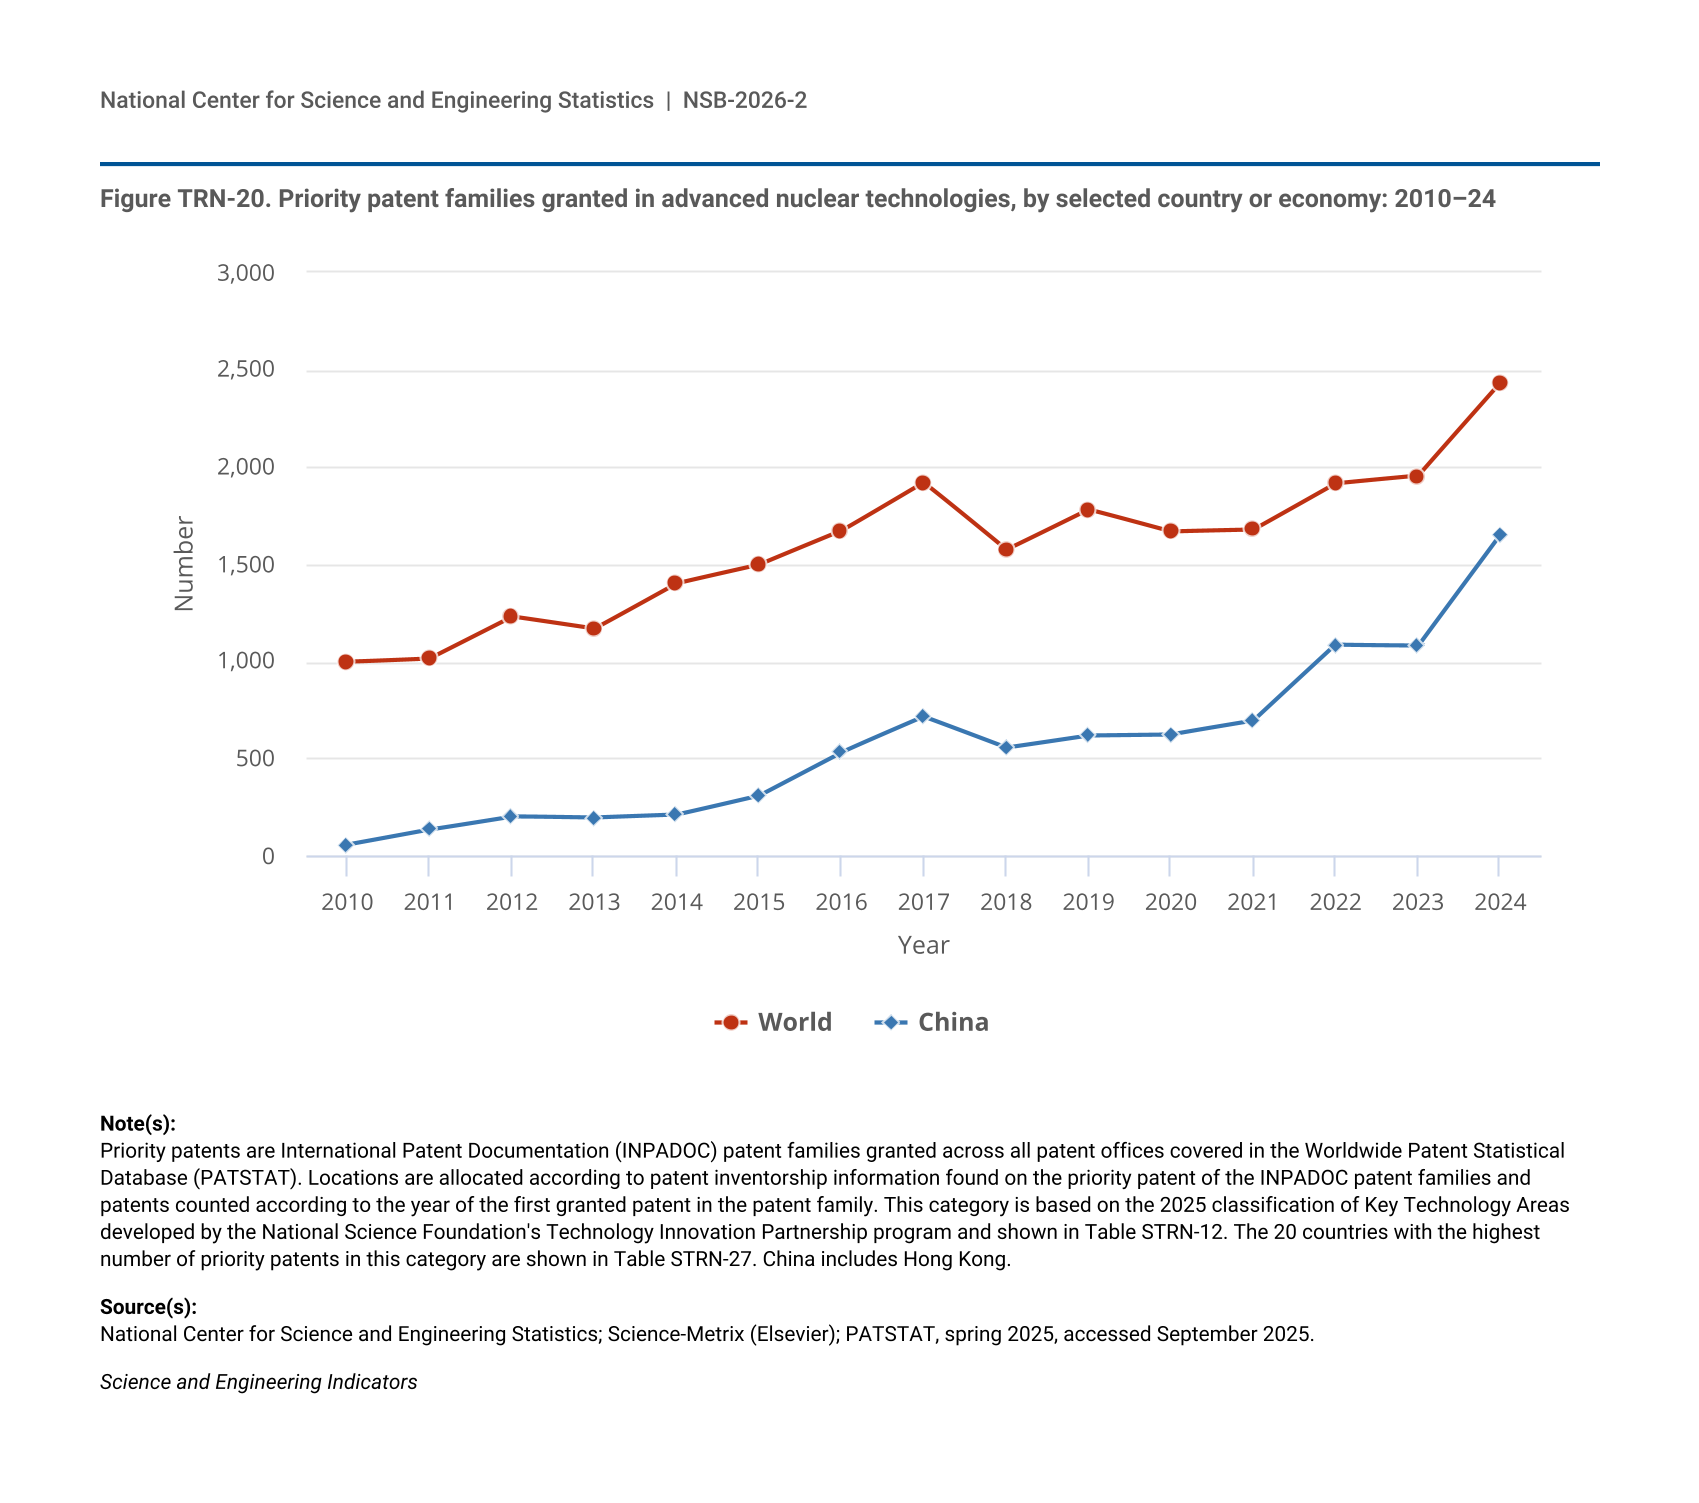
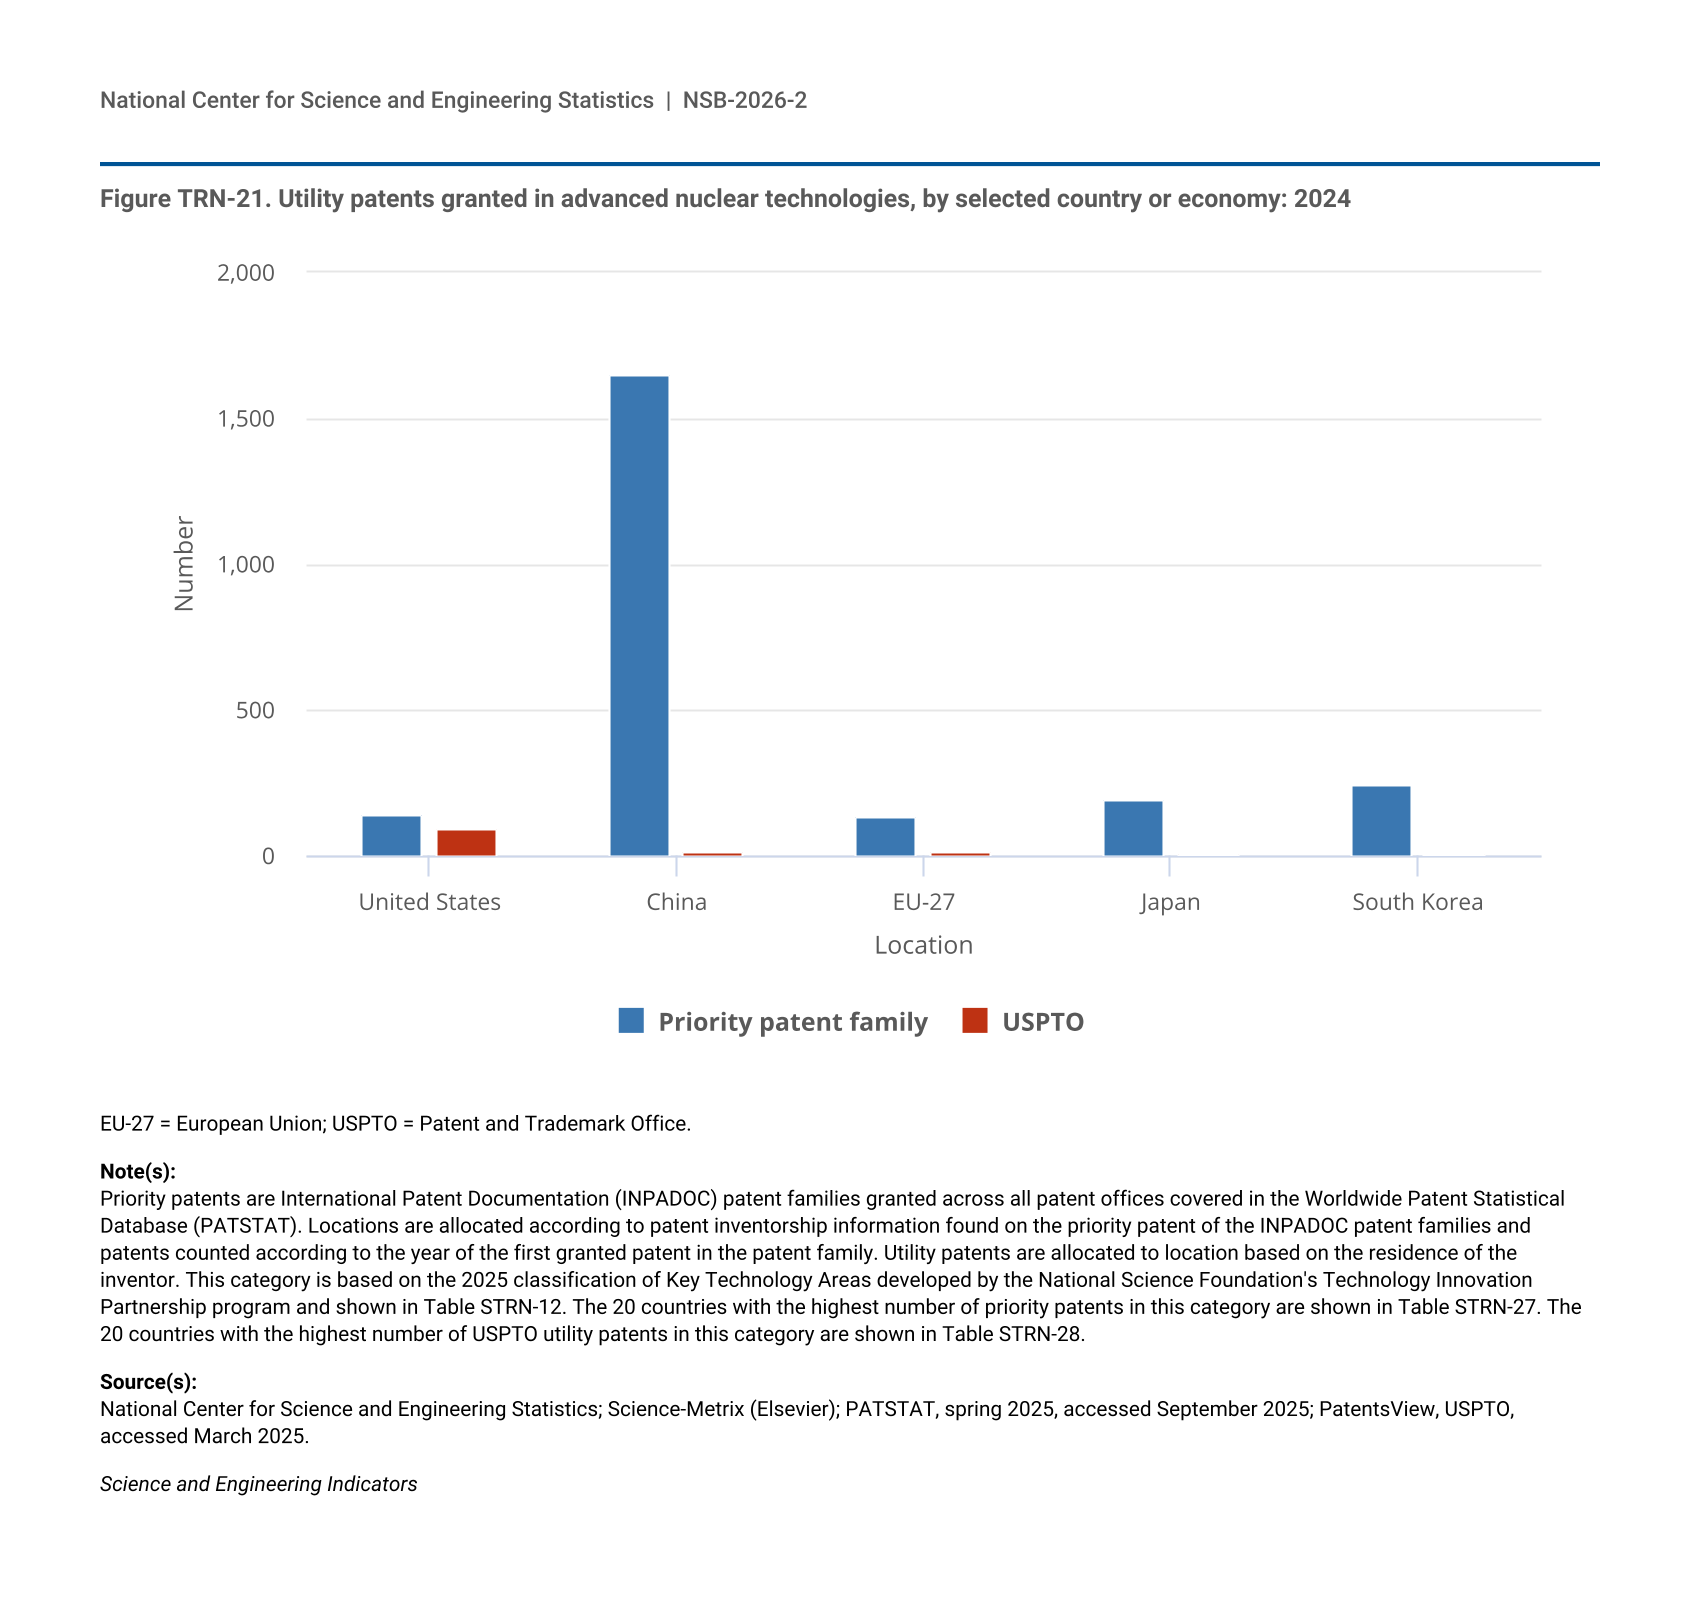
A relatively small number of patents are granted in advanced nuclear energy technologies relative to the other critical technologies described in this report. In 2024, only China, South Korea, Japan, and the United States received more than 100 priority patent families for advanced nuclear energy technologies (Table STRN-27). In keeping with the market leadership role attributed to China by IEA, inventors from China were awarded about two-thirds (1,700) of the 2,400 priority patent families awarded in advanced nuclear energy technologies in 2024 (Figure TRN-20). South Korea received about 240 patents and Japan received about 190 patents, followed by the United States with 140 patents. More than half of USPTO nuclear energy patents—90 of 140 patents—were awarded to U.S. inventors in 2024 (Table STRN-28). A relatively small number of advanced nuclear technologies USPTO patents were awarded to inventors from China in 2024, representing 8% of the total awarded (Figure TRN-21).
| Year | World | China |
|---|---|---|
| 2010 | 997 | 58 |
| 2011 | 1,015 | 136 |
| 2012 | 1,230 | 204 |
| 2013 | 1,167 | 197 |
| 2014 | 1,402 | 212 |
| 2015 | 1,497 | 311 |
| 2016 | 1,671 | 533 |
| 2017 | 1,922 | 715 |
| 2018 | 1,574 | 555 |
| 2019 | 1,783 | 618 |
| 2020 | 1,668 | 623 |
| 2021 | 1,677 | 693 |
| 2022 | 1,916 | 1,084 |
| 2023 | 1,955 | 1,081 |
| 2024 | 2,433 | 1,653 |
Priority patents are International Patent Documentation (INPADOC) patent families granted across all patent offices covered in the Worldwide Patent Statistical Database (PATSTAT). Locations are allocated according to patent inventorship information found on the priority patent of the INPADOC patent families and patents counted according to the year of the first granted patent in the patent family. This category is based on the 2025 classification of Key Technology Areas developed by the National Science Foundation's Technology Innovation Partnership program and shown in Table STRN-12. The 20 countries with the highest number of priority patents in this category are shown in Table STRN-27. China includes Hong Kong.
National Center for Science and Engineering Statistics; Science-Metrix (Elsevier); PATSTAT, spring 2025, accessed September 2025.
Science and Engineering Indicators
| Location | Priority patent family | USPTO |
|---|---|---|
| United States | 141 | 90 |
| China | 1,653 | 11 |
| EU-27 | 136 | 12 |
| Japan | 194 | 4 |
| South Korea | 241 | 8 |
EU-27 = European Union; USPTO = Patent and Trademark Office.
Priority patents are International Patent Documentation (INPADOC) patent families granted across all patent offices covered in the Worldwide Patent Statistical Database (PATSTAT). Locations are allocated according to patent inventorship information found on the priority patent of the INPADOC patent families and patents counted according to the year of the first granted patent in the patent family. Utility patents are allocated to location based on the residence of the inventor. This category is based on the 2025 classification of Key Technology Areas developed by the National Science Foundation's Technology Innovation Partnership program and shown in Table STRN-12. The 20 countries with the highest number of priority patents in this category are shown in Table STRN-27. The 20 countries with the highest number of USPTO utility patents in this category are shown in Table STRN-28.
National Center for Science and Engineering Statistics; Science-Metrix (Elsevier); PATSTAT, spring 2025, accessed September 2025; PatentsView, USPTO, accessed March 2025.
Science and Engineering Indicators
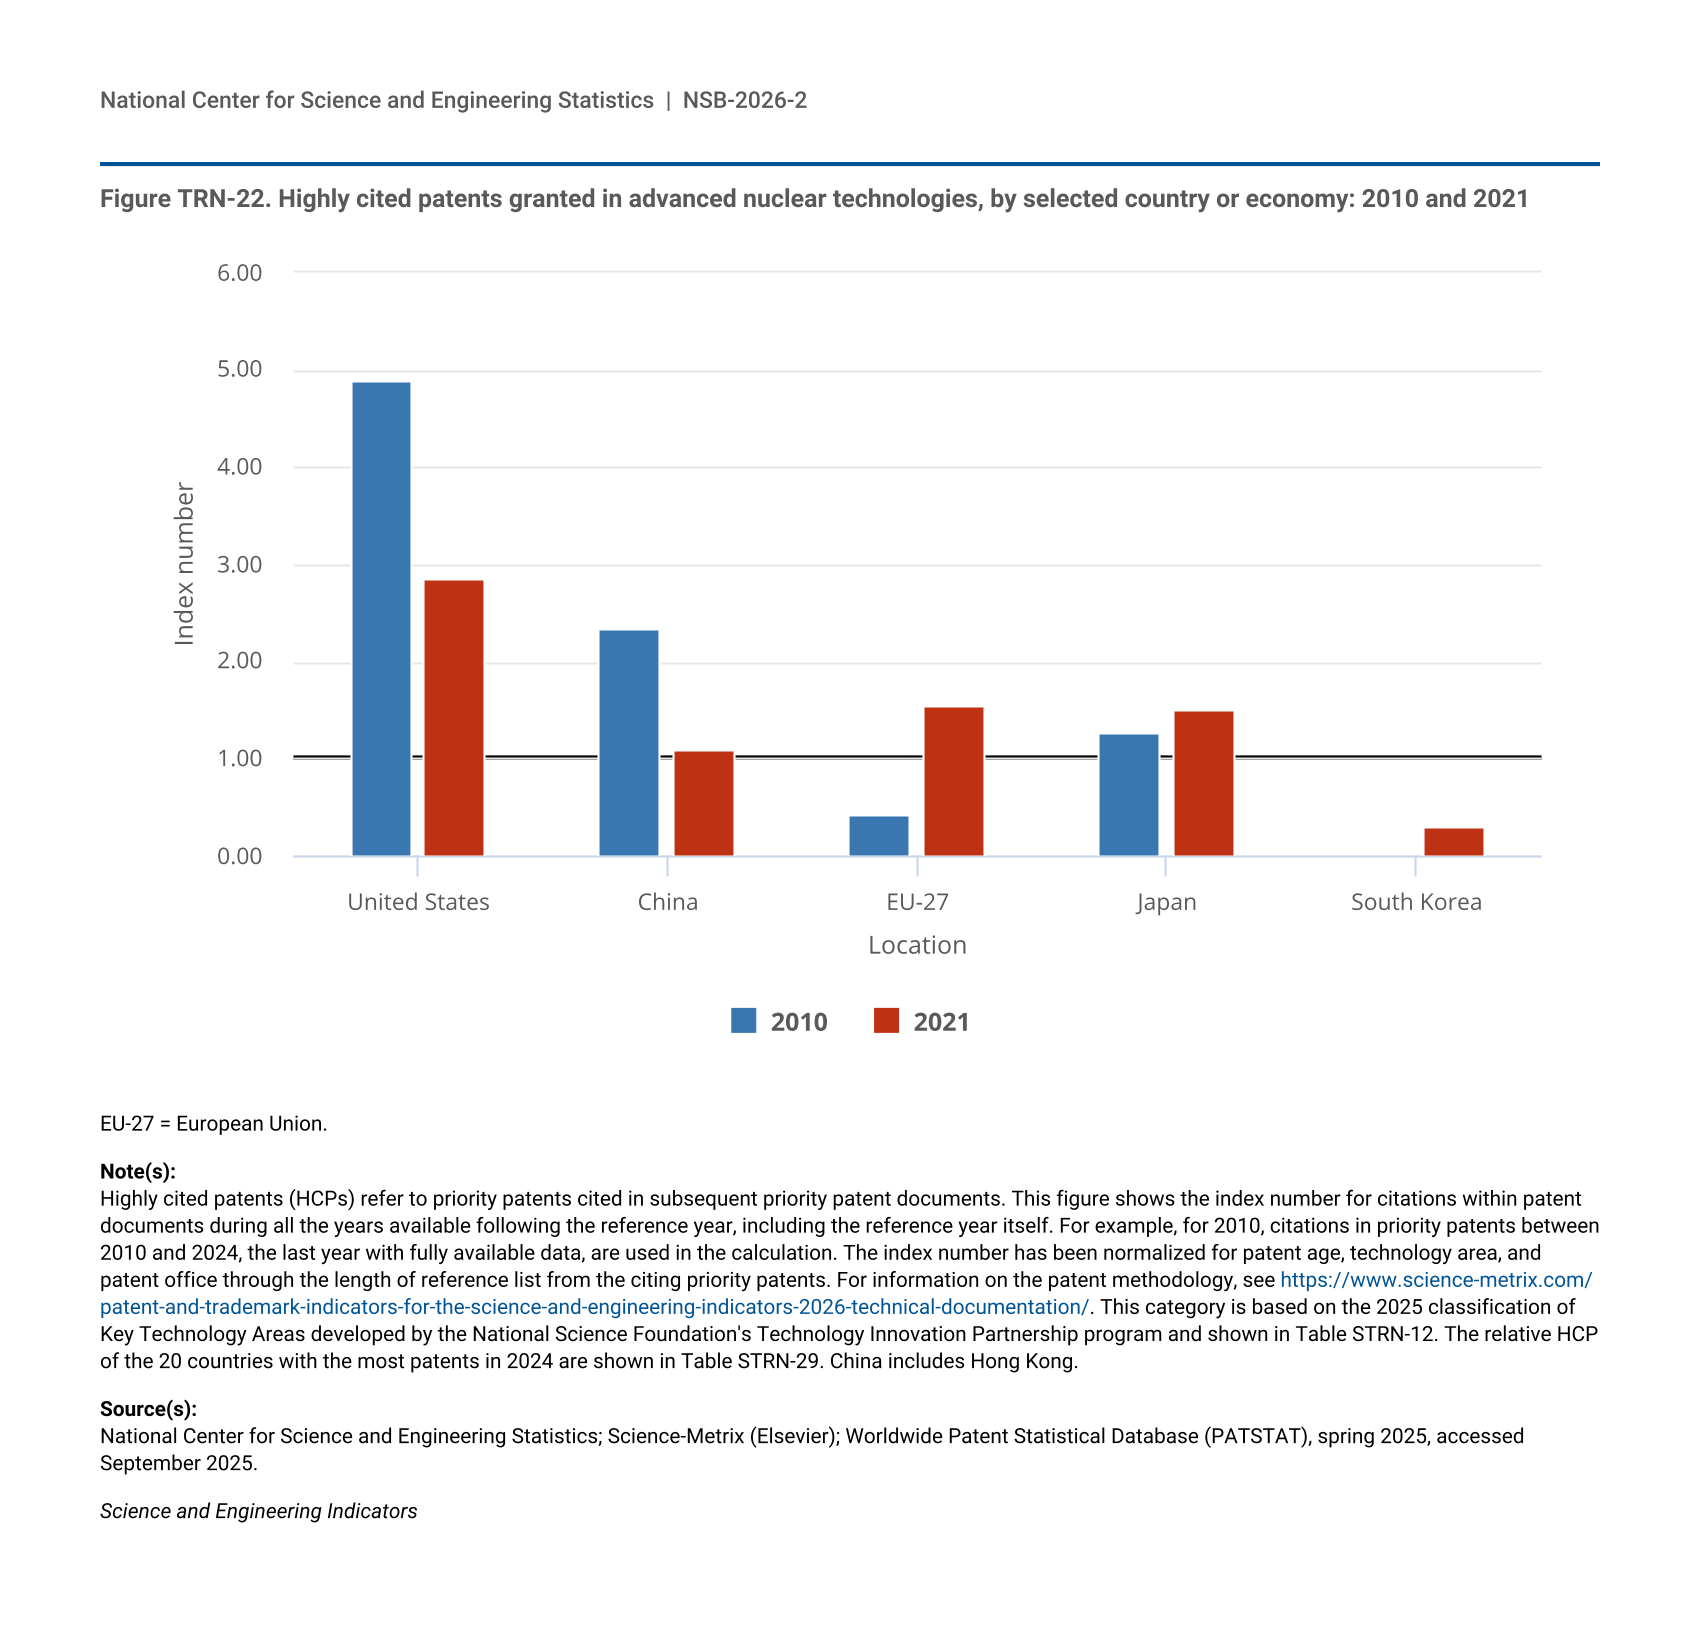
The relatively small number of patents granted in advanced nuclear technologies also affects HCP shares; several locations had zero patents in this category for the years calculated. The small number of patents in the category means that the index is more sensitive to a few HCPs. Only half of the top patenting locations in 2021 had any patents in the top 1% of HCPs, with patents from Denmark and Sweden ranking at 33.33 and 15.38, respectively (Table STRN-29). For patents awarded in 2021, those from U.S. inventors had an HCP share of 2.86, lower than the 4.89 value in 2010. Locations whose HCP shares were higher in 2021 compared with 2010 included the EU-27, Japan, and South Korea (Figure TRN-22).
| Location | 2010 | 2021 |
|---|---|---|
| United States | 4.89 | 2.86 |
| China | 2.33 | 1.10 |
| EU-27 | 0.42 | 1.54 |
| Japan | 1.27 | 1.49 |
| South Korea | 0.00 | 0.30 |
EU-27 = European Union.
Highly cited patents (HCPs) refer to priority patents cited in subsequent priority patent documents. This figure shows the index number for citations within patent documents during all the years available following the reference year, including the reference year itself. For example, for 2010, citations in priority patents between 2010 and 2024, the last year with fully available data, are used in the calculation. The index number has been normalized for patent age, technology area, and patent office through the length of reference list from the citing priority patents. For information on the patent methodology, see https://www.science-metrix.com/patent-and-trademark-indicators-for-the-science-and-engineering-indicators-2026-technical-documentation/. This category is based on the 2025 classification of Key Technology Areas developed by the National Science Foundation's Technology Innovation Partnership program and shown in Table STRN-12. The relative HCP of the 20 countries with the most patents in 2024 are shown in Table STRN-29. China includes Hong Kong.
National Center for Science and Engineering Statistics; Science-Metrix (Elsevier); Worldwide Patent Statistical Database (PATSTAT), spring 2025, accessed September 2025.
Science and Engineering Indicators
Patenting is not the only method by which inventors protect their inventions. The sidebar Intellectual Property Measures in Context describes both the utility and the limitations of patenting compared with other forms of IP protection.