 An official website of the United States government
 Data
Tables
Number
Title
Download
View
NumberTRN-1
TRN-1
"Translation" thematic report indicators and their sources
Title"Translation" thematic report indicators and their sources
NumberTRN-2
TRN-2
U.S. federal agencies cited in the funding acknowledgement section of S&E articles, by citation frequency: 2002–22
TitleU.S. federal agencies cited in the funding acknowledgement section of S&E articles, by citation frequency: 2002–22
NumberTRN-3
TRN-3
U.S. federal agency activity in granted patents, S&E articles, and articles cited by patents, by inventor's or author's affiliated agency: 2013–24
TitleU.S. federal agency activity in granted patents, S&E articles, and articles cited by patents, by inventor's or author's affiliated agency: 2013–24
NumberTRN-4
TRN-4
Top cited organizations at USPTO, according to the share of patents in top 1% most cited: 2021
TitleTop cited organizations at USPTO, according to the share of patents in top 1% most cited: 2021
NumberTRN-5
TRN-5
Top venture capital–funded firms headquartered in the United States: 2024
TitleTop venture capital–funded firms headquartered in the United States: 2024
NumberTRN-6
TRN-6
Global KTI industries, by value added and share of global GDP: 2018–24
TitleGlobal KTI industries, by value added and share of global GDP: 2018–24
NumberSATRN-1
SATRN-1
AUTM institution coverage and response rates: 2014–24
TitleAUTM institution coverage and response rates: 2014–24
NumberSATRN-2
SATRN-2
AUTM coverage of institutions surveyed in the Higher Education Research and Development Survey: 2014–24
TitleAUTM coverage of institutions surveyed in the Higher Education Research and Development Survey: 2014–24
NumberSATRN-3
SATRN-3
Crosswalk of PitchBook industry codes, critical and emerging technology group codes, and industry codes
TitleCrosswalk of PitchBook industry codes, critical and emerging technology group codes, and industry codes
NumberSTRN-1
STRN-1
U.S. federal and state agencies cited in the funding acknowledgement section of S&E articles, by citation frequency: 2002–22
TitleU.S. federal and state agencies cited in the funding acknowledgement section of S&E articles, by citation frequency: 2002–22
NumberSTRN-2
STRN-2
Contributions to New GitHub repositories by selected entities: 2009–24
TitleContributions to New GitHub repositories by selected entities: 2009–24
NumberSTRN-3
STRN-3
Annual economywide business startups and startups with licensed university technology: 2000–24
TitleAnnual economywide business startups and startups with licensed university technology: 2000–24
NumberSTRN-4
STRN-4
Citations of S&E articles in USPTO utility patents, by cited field, cited author country, and patent sector: 2013–24
TitleCitations of S&E articles in USPTO utility patents, by cited field, cited author country, and patent sector: 2013–24
NumberSTRN-5
STRN-5
S&E articles with authors at federal agencies cited by granted U.S. patents, by author's affiliated agency: 2013–24
TitleS&E articles with authors at federal agencies cited by granted U.S. patents, by author's affiliated agency: 2013–24
NumberSTRN-6
STRN-6
Patents granted to U.S. federal agencies, by inventor's agency of employment: 2013–24
TitlePatents granted to U.S. federal agencies, by inventor's agency of employment: 2013–24
NumberSTRN-7
STRN-7
Scholarly publications with authors from U.S. federal agencies, by S&E discipline: 2013–24
TitleScholarly publications with authors from U.S. federal agencies, by S&E discipline: 2013–24
NumberSTRN-8
STRN-8
S&E articles with authors from U.S. federal agencies, by author's affiliated agency: 2013–24
TitleS&E articles with authors from U.S. federal agencies, by author's affiliated agency: 2013–24
NumberSTRN-9
STRN-9
S&E articles with authors at federal agencies cited by granted U.S. patents, by article field: 2013–24
TitleS&E articles with authors at federal agencies cited by granted U.S. patents, by article field: 2013–24
NumberSTRN-10
STRN-10
Patents granted to U.S. federal agencies, by technology area: 2013–24
TitlePatents granted to U.S. federal agencies, by technology area: 2013–24
NumberSTRN-11
STRN-11
USPTO utility patents granted to owners, by sector: 2000–24
TitleUSPTO utility patents granted to owners, by sector: 2000–24
NumberSTRN-12
STRN-12
NSF TIP key technology areas and technology foci key terms
TitleNSF TIP key technology areas and technology foci key terms
NumberSTRN-13
STRN-13
Mapping of critical technologies to CPC codes
TitleMapping of critical technologies to CPC codes
NumberSTRN-14
STRN-14
Patent citation index of international patent families granted in critical technology categories, by selected region, country, or economy of patent inventor: 2021
TitlePatent citation index of international patent families granted in critical technology categories, by selected region, country, or economy of patent inventor: 2021
NumberSTRN-15
STRN-15
Priority patent families granted in artificial intelligence, machine learning, autonomy, and related advances for the top 20 most-patenting regions, countries, or economies: 2010–24
TitlePriority patent families granted in artificial intelligence, machine learning, autonomy, and related advances for the top 20 most-patenting regions, countries, or economies: 2010–24
NumberSTRN-16
STRN-16
USPTO utility patents granted in artificial intelligence, machine learning, autonomy, and related advances for the top 20 most-patenting regions, countries, or economies: 2010–24
TitleUSPTO utility patents granted in artificial intelligence, machine learning, autonomy, and related advances for the top 20 most-patenting regions, countries, or economies: 2010–24
NumberSTRN-17
STRN-17
Highly cited patents in artificial intelligence, machine learning, autonomy, and related advances for the top 20 most-patenting regions, countries, or economies: 2010–21
TitleHighly cited patents in artificial intelligence, machine learning, autonomy, and related advances for the top 20 most-patenting regions, countries, or economies: 2010–21
NumberSTRN-18
STRN-18
Priority patent families granted in biotechnology, medical technology, genomics, and synthetic biology for the top 20 most-patenting regions, countries, or economies: 2010–24
TitlePriority patent families granted in biotechnology, medical technology, genomics, and synthetic biology for the top 20 most-patenting regions, countries, or economies: 2010–24
NumberSTRN-19
STRN-19
USPTO utility patents granted in biotechnology, medical technology, genomics, and synthetic biology for the top 20 most-patenting regions, countries, or economies: 2010–24
TitleUSPTO utility patents granted in biotechnology, medical technology, genomics, and synthetic biology for the top 20 most-patenting regions, countries, or economies: 2010–24
NumberSTRN-20
STRN-20
Highly cited patents in biotechnology, medical technology, genomics, and synthetic biology for the top 20 most-patenting regions, countries, or economies: 2010–21
TitleHighly cited patents in biotechnology, medical technology, genomics, and synthetic biology for the top 20 most-patenting regions, countries, or economies: 2010–21
NumberSTRN-21
STRN-21
Priority patent families granted in semiconductors for the top 20 most-patenting regions, countries, or economies: 2010–24
TitlePriority patent families granted in semiconductors for the top 20 most-patenting regions, countries, or economies: 2010–24
NumberSTRN-22
STRN-22
USPTO utility patents granted in semiconductors for the top 20 most-patenting regions, countries, or economies: 2010–24
TitleUSPTO utility patents granted in semiconductors for the top 20 most-patenting regions, countries, or economies: 2010–24
NumberSTRN-23
STRN-23
Highly cited patents in semiconductors for the top 20 most-patenting regions, countries, or economies: 2010–21
TitleHighly cited patents in semiconductors for the top 20 most-patenting regions, countries, or economies: 2010–21
NumberSTRN-24
STRN-24
Priority patent families granted in quantum information science and technology for the top 20 most-patenting regions, countries, or economies: 2010–24
TitlePriority patent families granted in quantum information science and technology for the top 20 most-patenting regions, countries, or economies: 2010–24
NumberSTRN-25
STRN-25
USPTO utility patents granted in quantum information science and technology for the top 20 most-patenting regions, countries, or economies: 2010–24
TitleUSPTO utility patents granted in quantum information science and technology for the top 20 most-patenting regions, countries, or economies: 2010–24
NumberSTRN-26
STRN-26
Highly cited patents in quantum information science and technology for the top 20 most-patenting regions, countries, or economies: 2010–21
TitleHighly cited patents in quantum information science and technology for the top 20 most-patenting regions, countries, or economies: 2010–21
NumberSTRN-27
STRN-27
Priority patent families granted in advanced nuclear technologies for the top 20 most-patenting regions, countries, or economies: 2010–24
TitlePriority patent families granted in advanced nuclear technologies for the top 20 most-patenting regions, countries, or economies: 2010–24
NumberSTRN-28
STRN-28
USPTO utility patents granted in advanced nuclear technologies for the top 20 most-patenting regions, countries, or economies: 2010–24
TitleUSPTO utility patents granted in advanced nuclear technologies for the top 20 most-patenting regions, countries, or economies: 2010–24
NumberSTRN-29
STRN-29
Highly cited patents in advanced nuclear technologies for the top 20 most-patenting regions, countries, or economies: 2010–21
TitleHighly cited patents in advanced nuclear technologies for the top 20 most-patenting regions, countries, or economies: 2010–21
NumberSTRN-30
STRN-30
Registered USPTO trademarks, by region, country, or economy: 2000–24
TitleRegistered USPTO trademarks, by region, country, or economy: 2000–24
NumberSTRN-31
STRN-31
Nice Classifications in trademark data, by business sector: 2000–24
TitleNice Classifications in trademark data, by business sector: 2000–24
NumberSTRN-32
STRN-32
U.S.-registered USPTO trademarks, by Nice Classification: 2000–24
TitleU.S.-registered USPTO trademarks, by Nice Classification: 2000–24
NumberSTRN-33
STRN-33
New GitHub repositories contributed to, by selected region, country, or economy: 2009–24
TitleNew GitHub repositories contributed to, by selected region, country, or economy: 2009–24
NumberSTRN-34
STRN-34
Total GitHub repositories contributed to by selected entities: 2009–24
TitleTotal GitHub repositories contributed to by selected entities: 2009–24
NumberSTRN-35
STRN-35
Open-source software collaboration networks in GitHub, by region, country, or economy: 2024
TitleOpen-source software collaboration networks in GitHub, by region, country, or economy: 2024
NumberSTRN-36
STRN-36
Open-source software repositories contributed to in GitHub, by country of contributor: 2024
TitleOpen-source software repositories contributed to in GitHub, by country of contributor: 2024
NumberSTRN-37
STRN-37
Venture capital investment, by region, country, or economy of receiving firm: 2013–24
TitleVenture capital investment, by region, country, or economy of receiving firm: 2013–24
NumberSTRN-38
STRN-38
Firms headquartered in the United States receiving venture capital investment, by industry: 2013–24
TitleFirms headquartered in the United States receiving venture capital investment, by industry: 2013–24
NumberSTRN-39
STRN-39
OECD classification of industries, by R&D intensity category
TitleOECD classification of industries, by R&D intensity category
NumberSTRN-40
STRN-40
U.S. KTI industry value added: 2002–24
TitleU.S. KTI industry value added: 2002–24
NumberSTRN-41
STRN-41
Value added, by industry, for the world and for selected economies: 2002–24
TitleValue added, by industry, for the world and for selected economies: 2002–24
NumberSTRN-42
STRN-42
KTI value added, GDP, and KTI value added as a share of domestic GDP for selected economies: 2002–24
TitleKTI value added, GDP, and KTI value added as a share of domestic GDP for selected economies: 2002–24
NumberSTRN-43
STRN-43
Gross exports of goods trade, for the world and for selected economies: 2002–24
TitleGross exports of goods trade, for the world and for selected economies: 2002–24
NumberSTRN-44
STRN-44
KTI manufacturing exports as a share of total manufacturing exports for selected economies: 2002–24
TitleKTI manufacturing exports as a share of total manufacturing exports for selected economies: 2002–24
NumberSTRN-45
STRN-45
KTI manufacturing exports, imports, and trade balance for selected economies: 2002–24
TitleKTI manufacturing exports, imports, and trade balance for selected economies: 2002–24
Figures
Thumbnail
Number & Title
Download
View
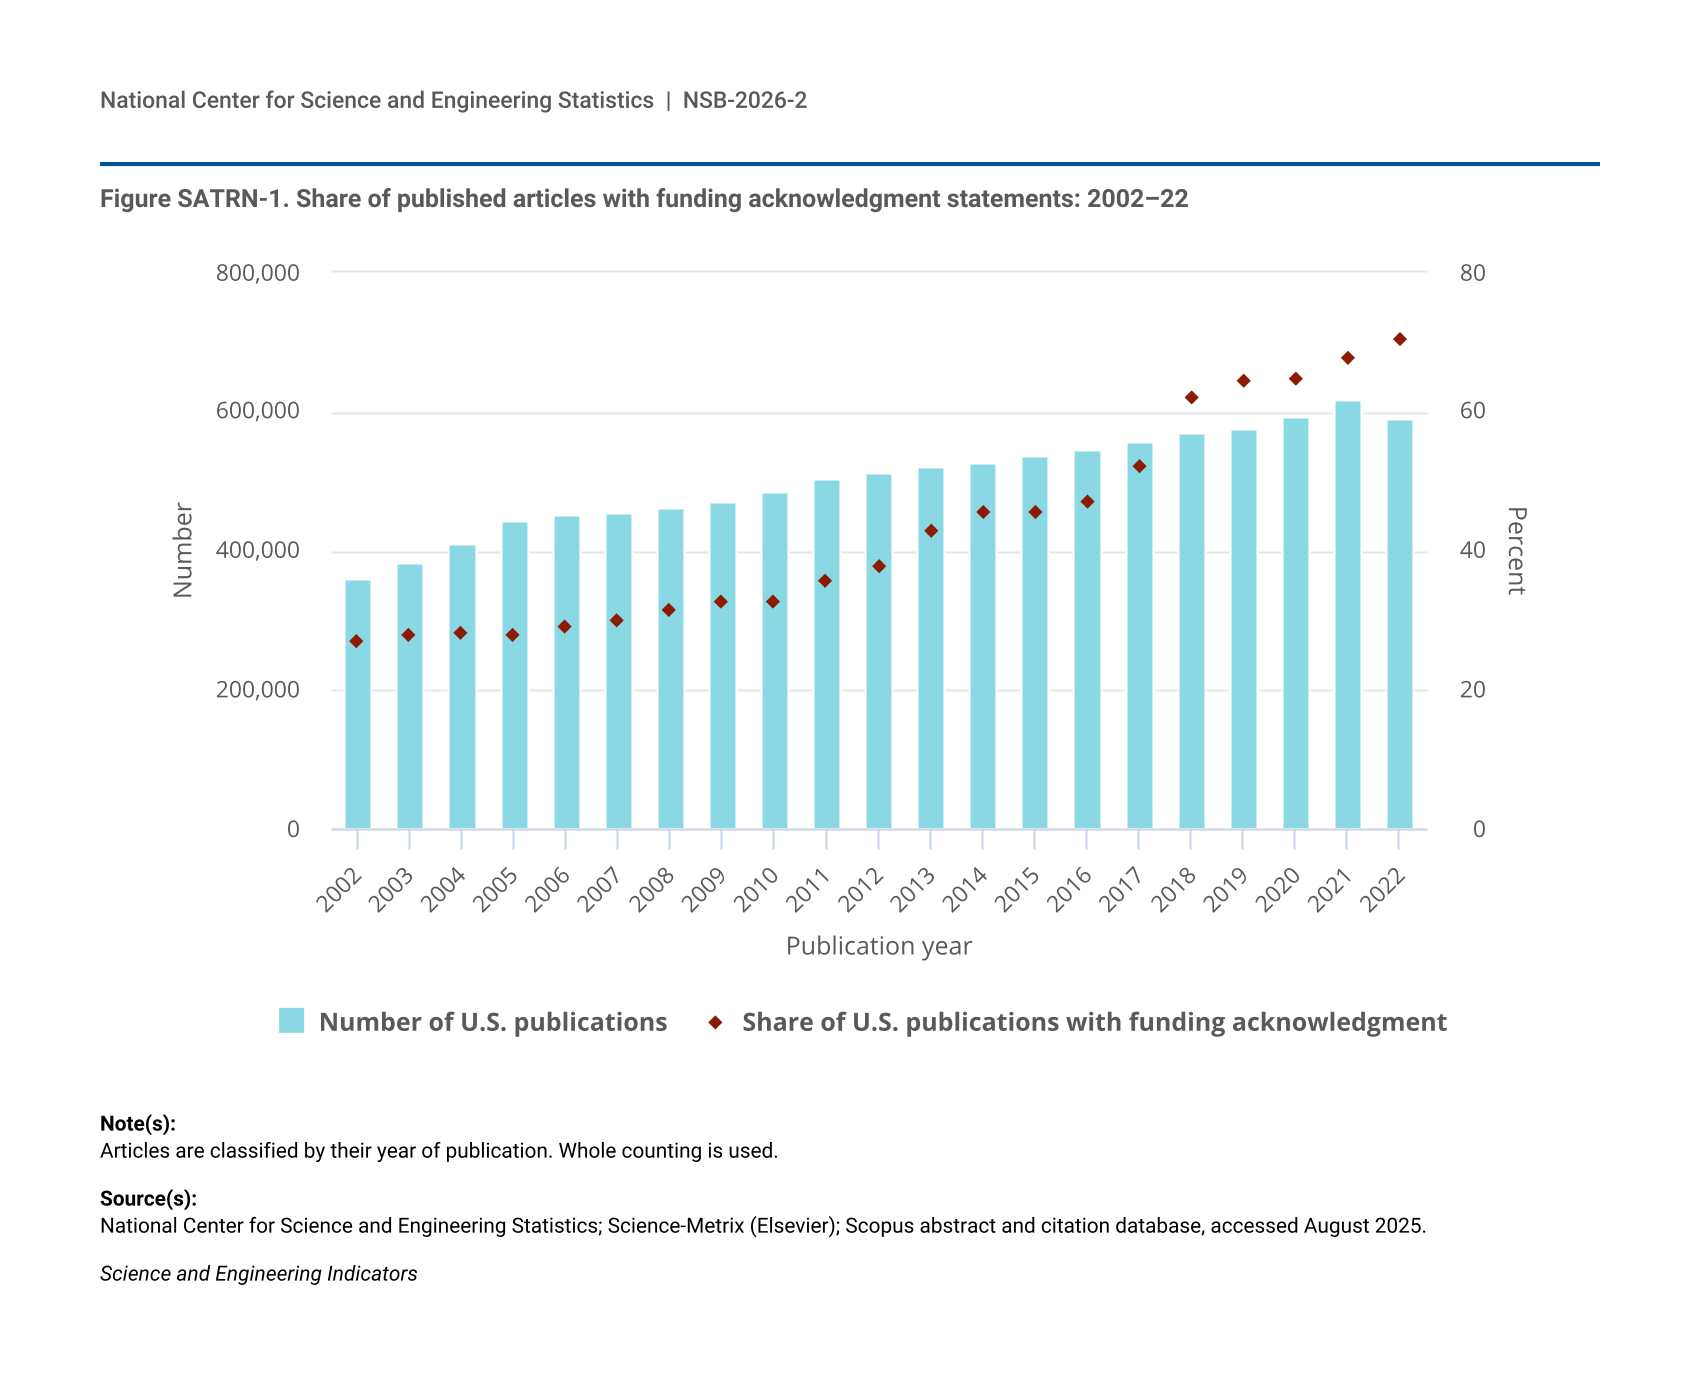
Figure SATRN-1.
Share of published articles with funding acknowledgment statements: 2002–22
Share of published articles with funding acknowledgment statements: 2002–22
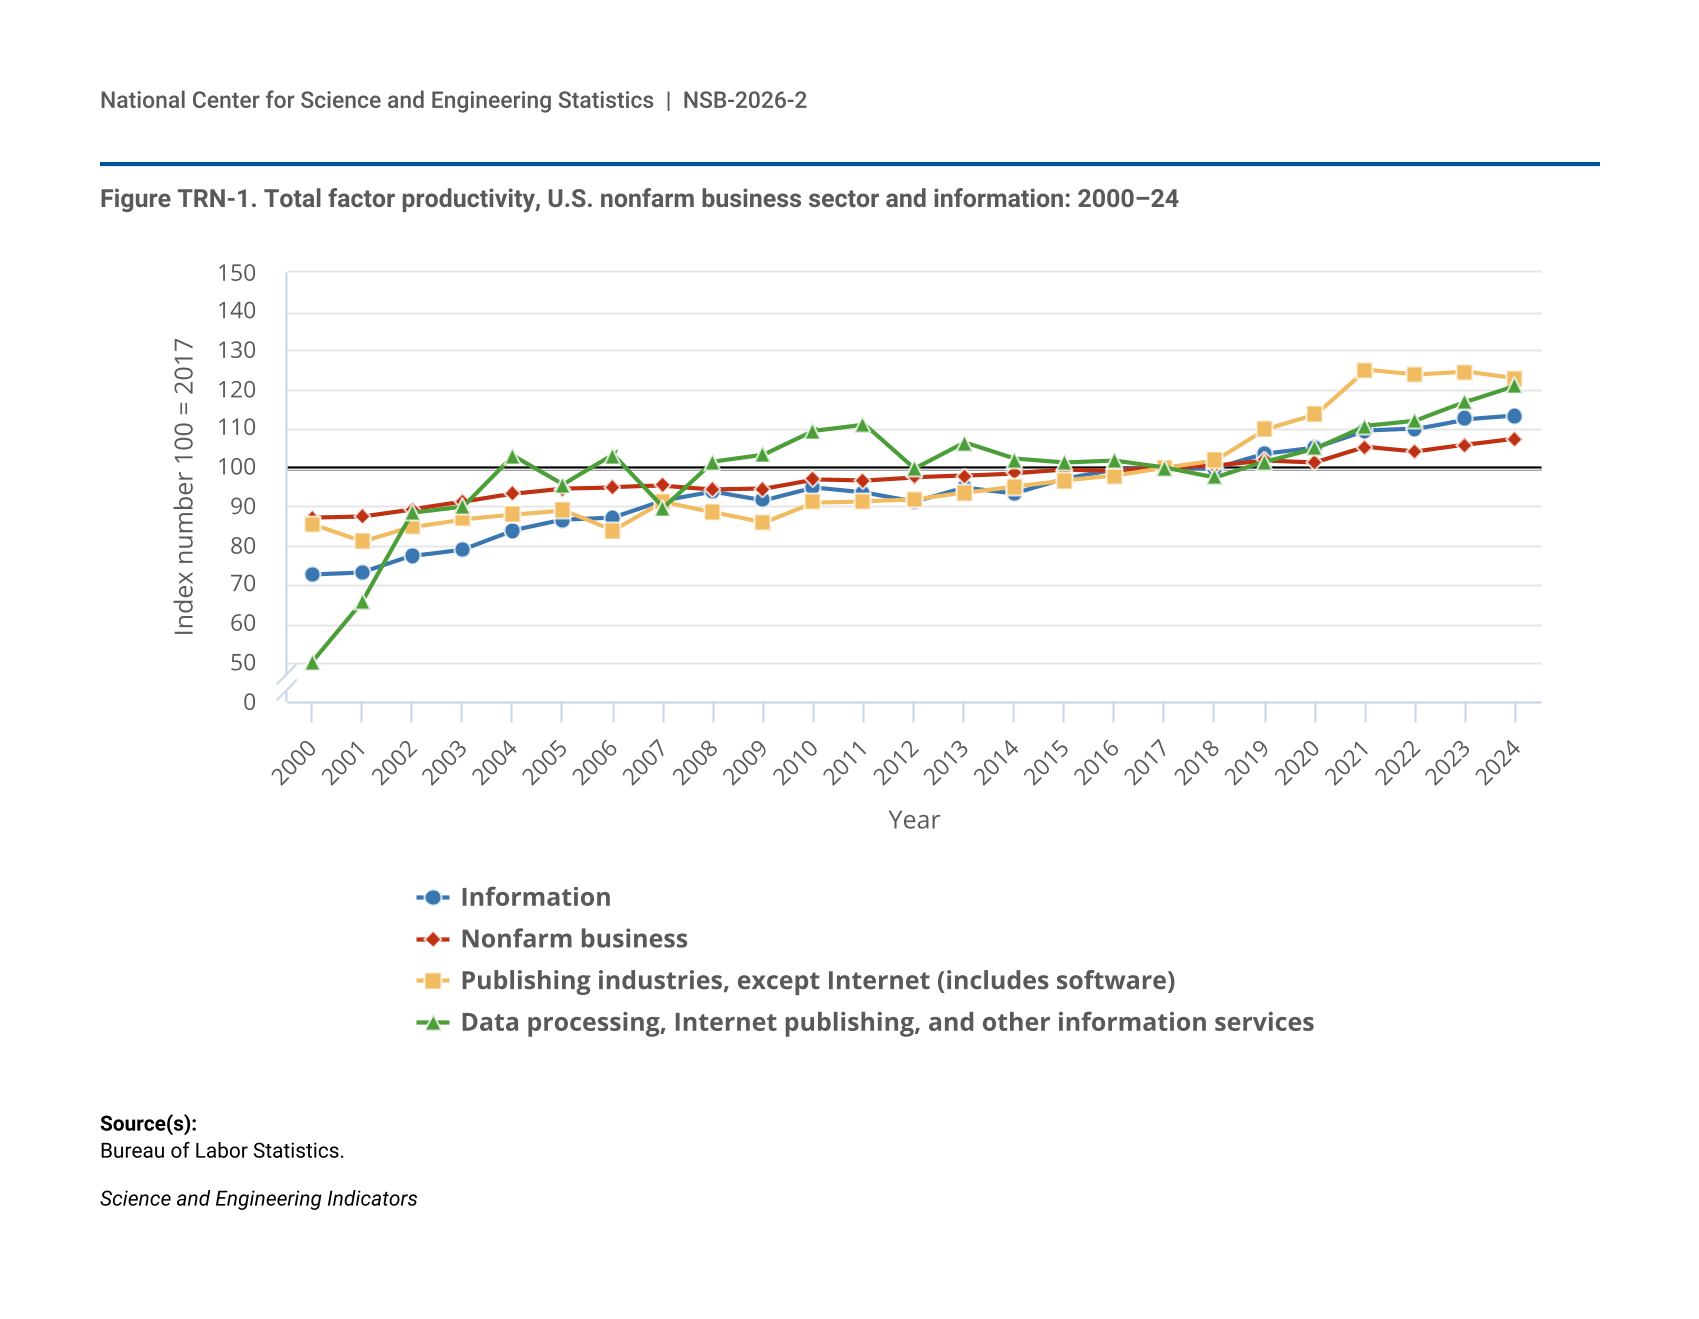
Figure TRN-1.
Total factor productivity, U.S. nonfarm business sector and information: 2000–24
Total factor productivity, U.S. nonfarm business sector and information: 2000–24
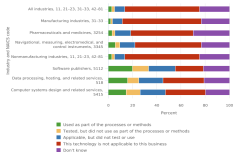
Figure TRN-2.
Use of artificial intelligence as a production technology for goods and services, by selected industry: 2020-22
Use of artificial intelligence as a production technology for goods and services, by selected industry: 2020-22
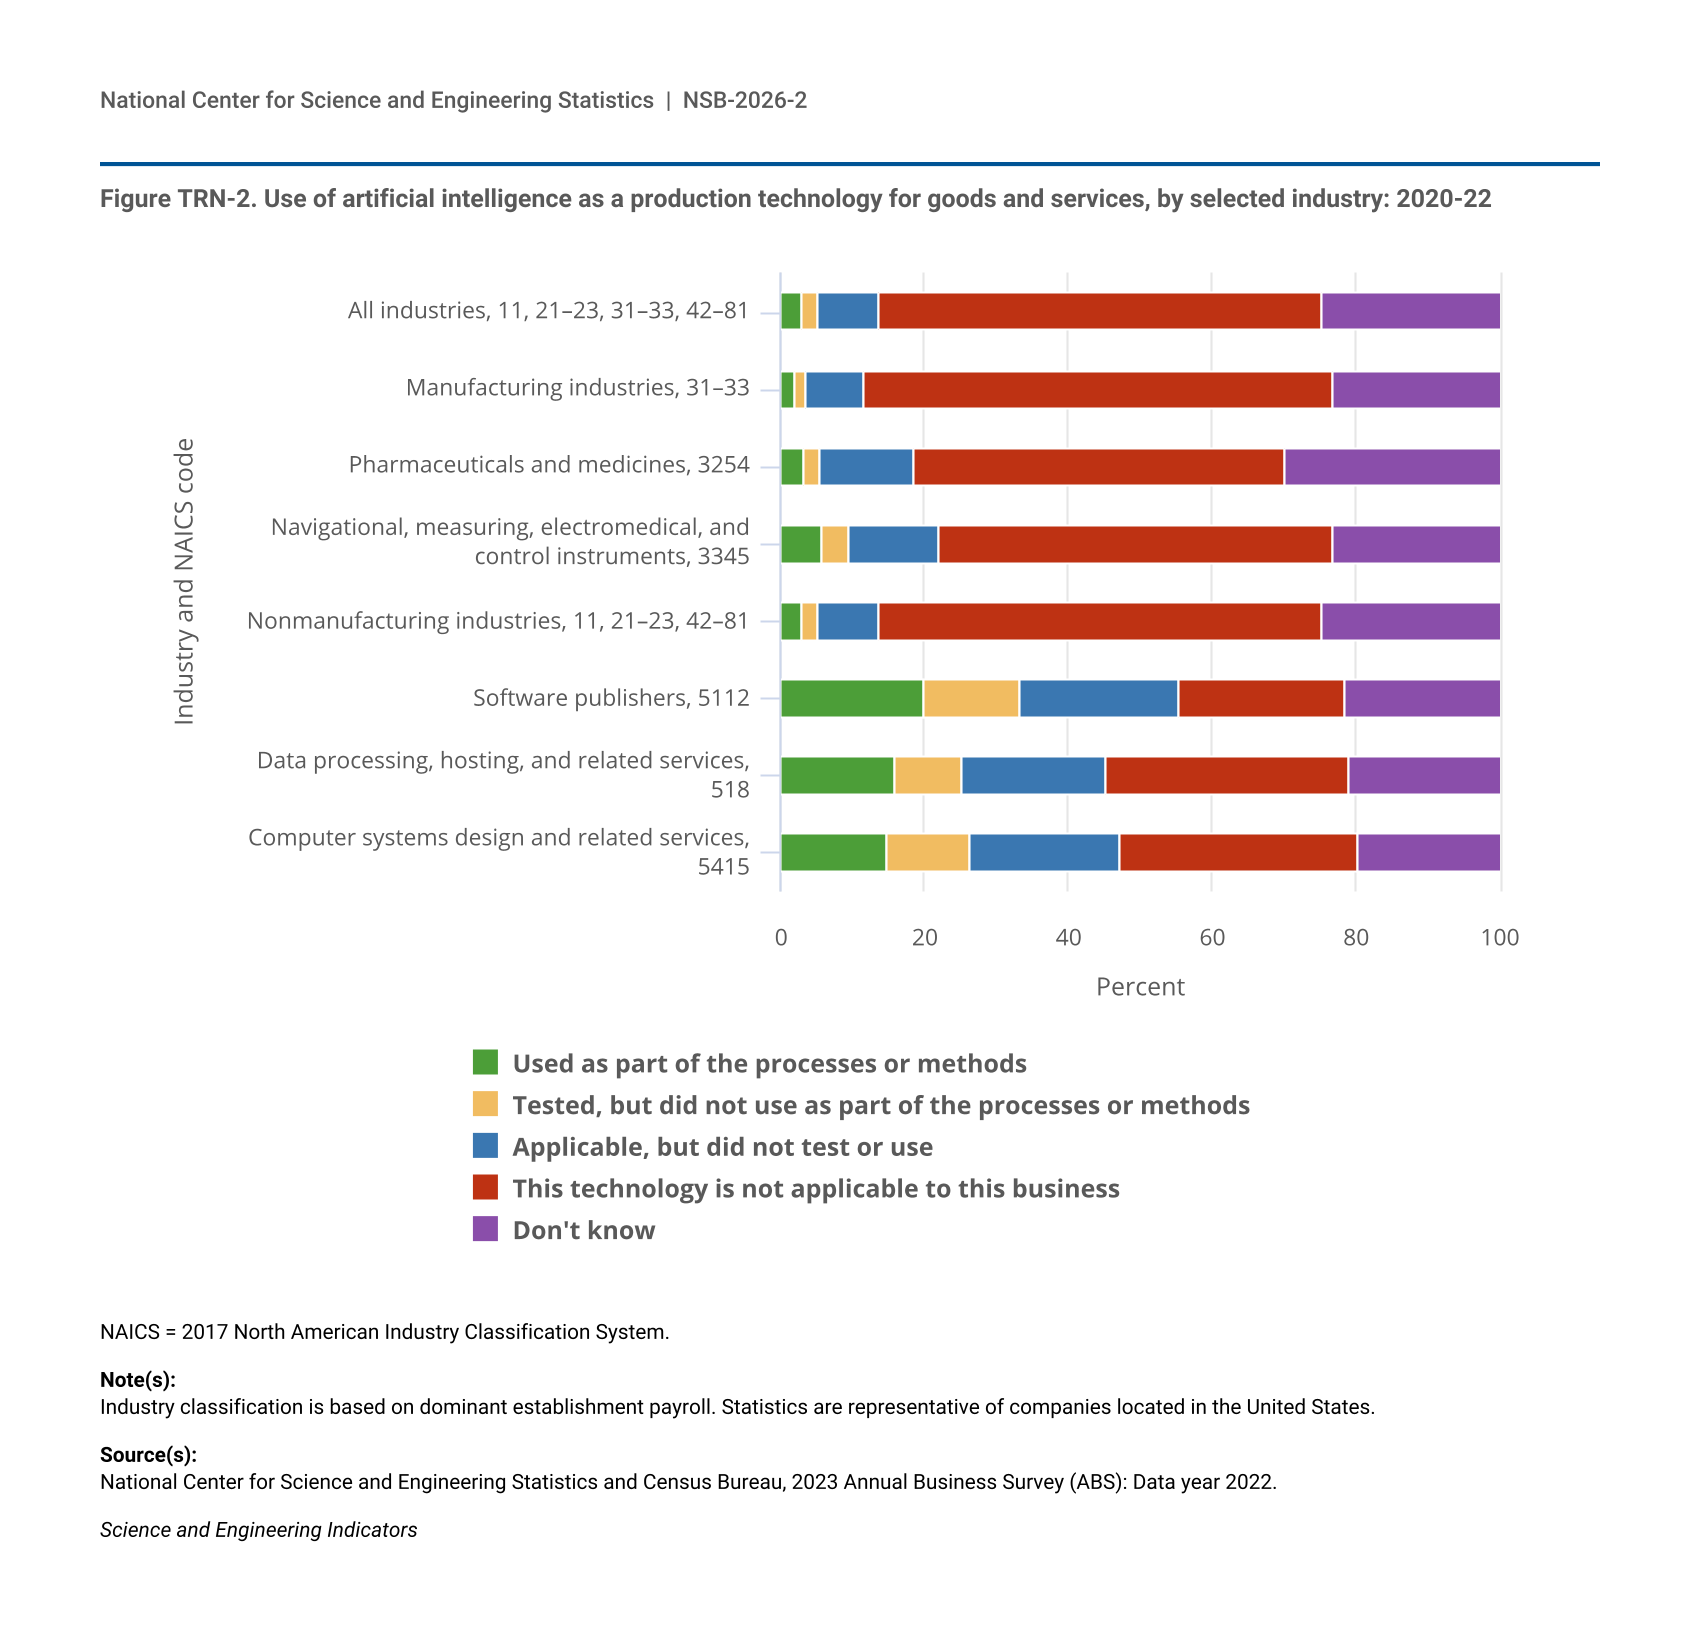
Figure TRN-3.
Use of artificial intelligence as a production technology for goods and services, by company size: 2020-22
Use of artificial intelligence as a production technology for goods and services, by company size: 2020-22
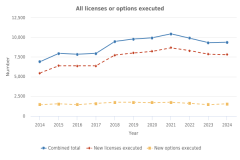
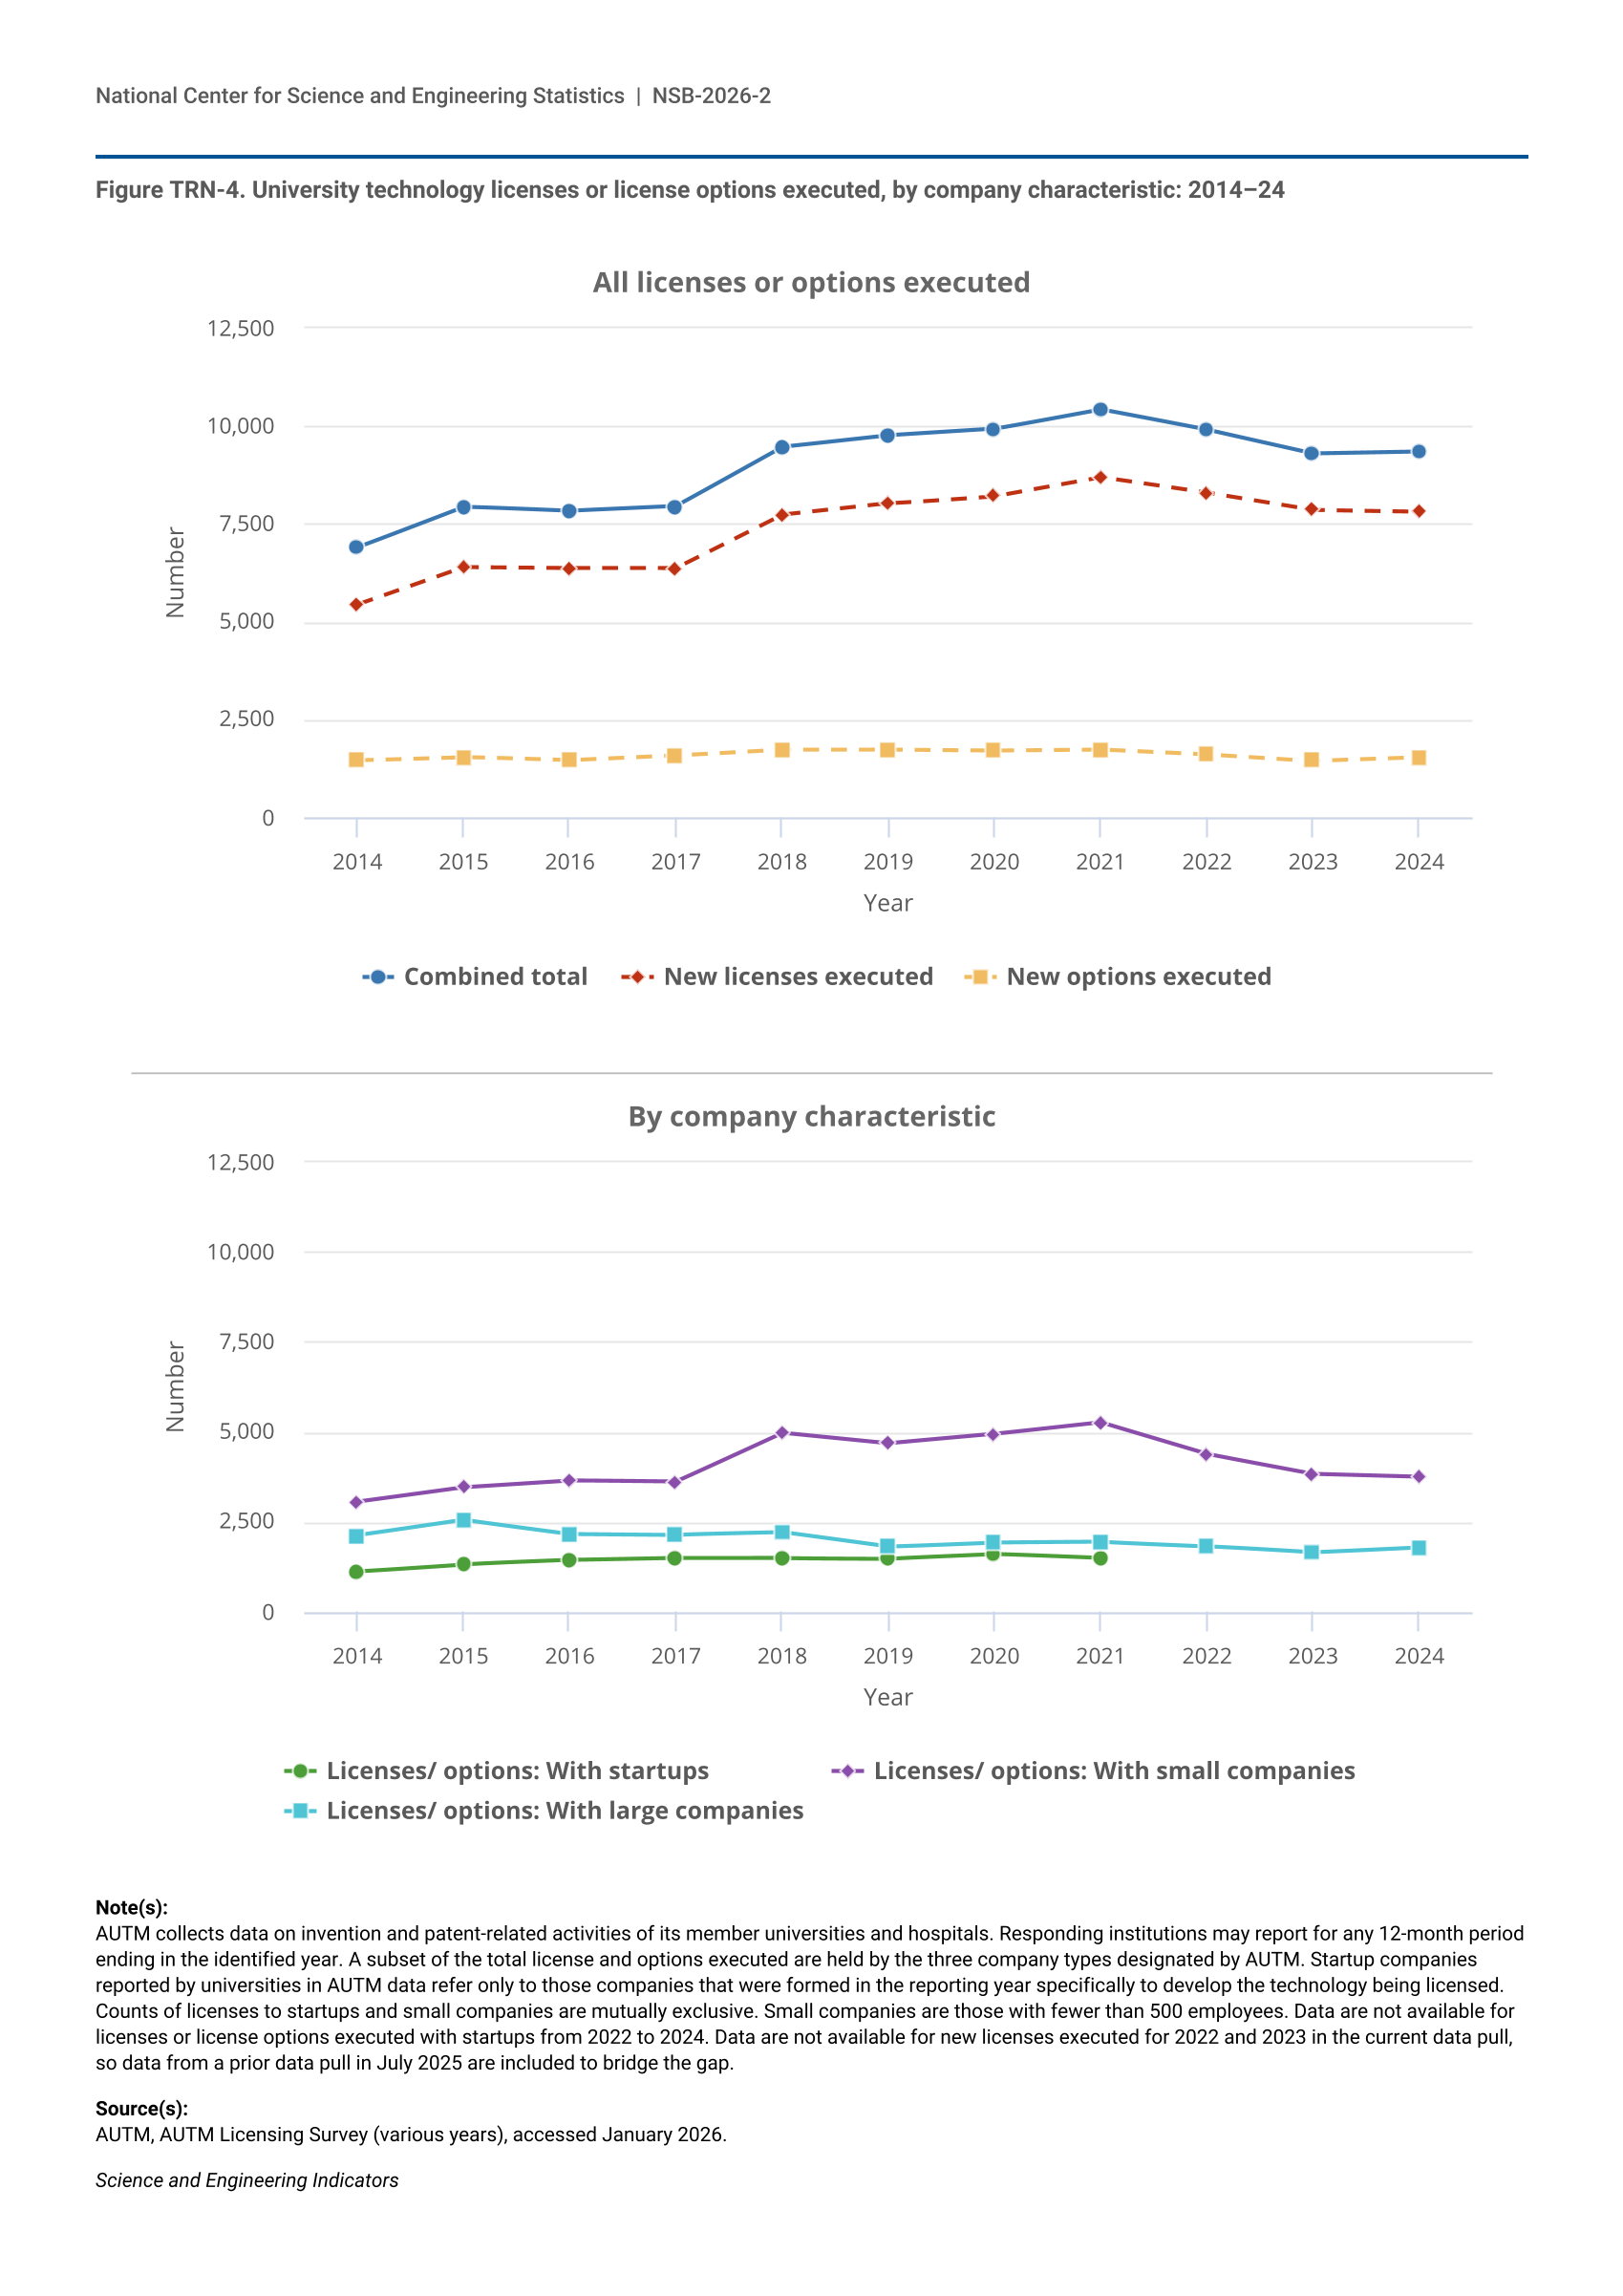
Figure TRN-4.
University technology licenses or license options executed, by company characteristic: 2014–24
University technology licenses or license options executed, by company characteristic: 2014–24
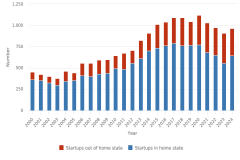
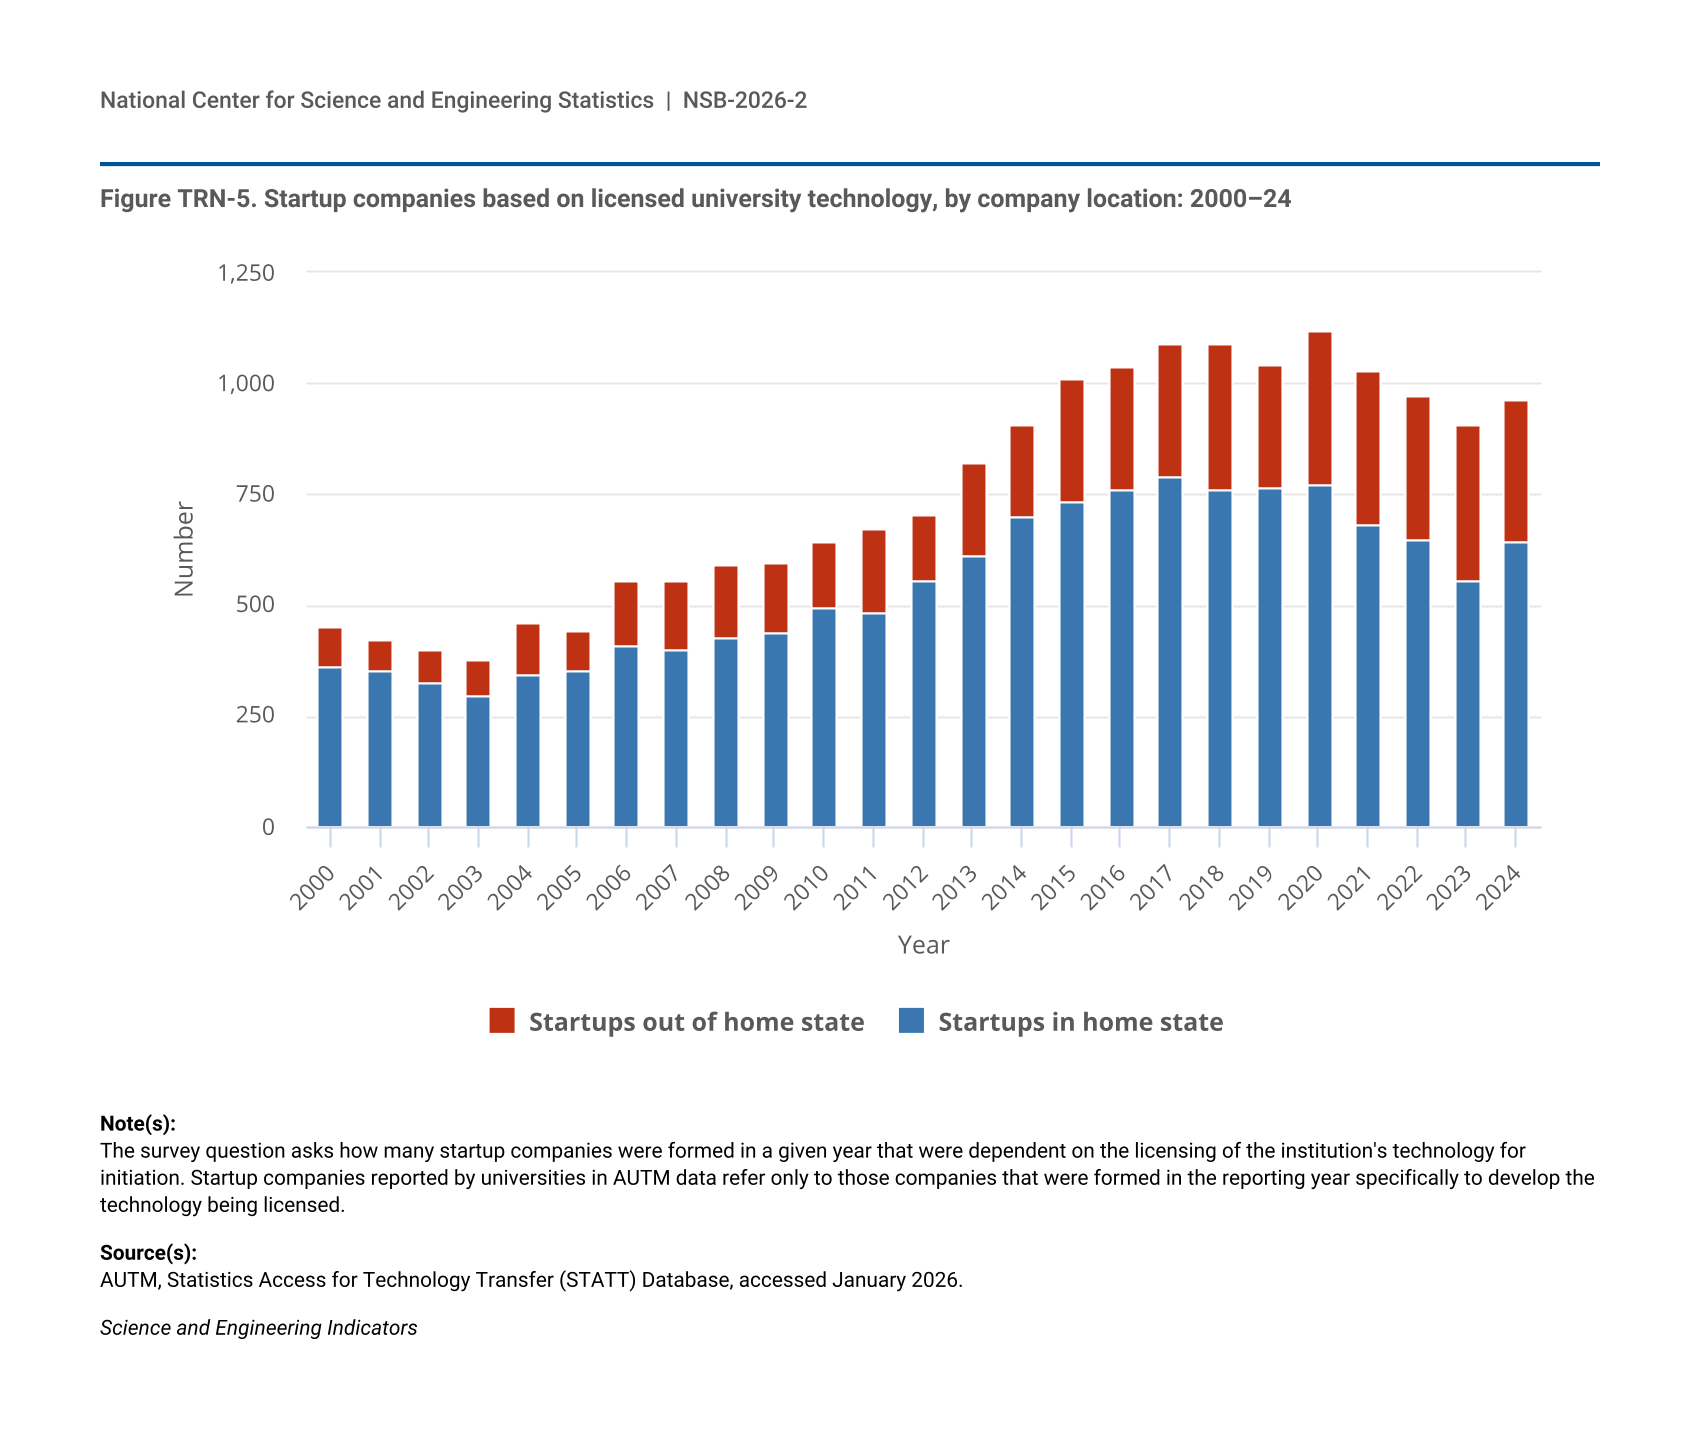
Figure TRN-5.
Startup companies based on licensed university technology, by company location: 2000–24
Startup companies based on licensed university technology, by company location: 2000–24
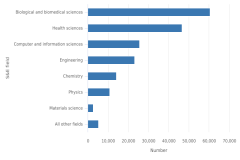
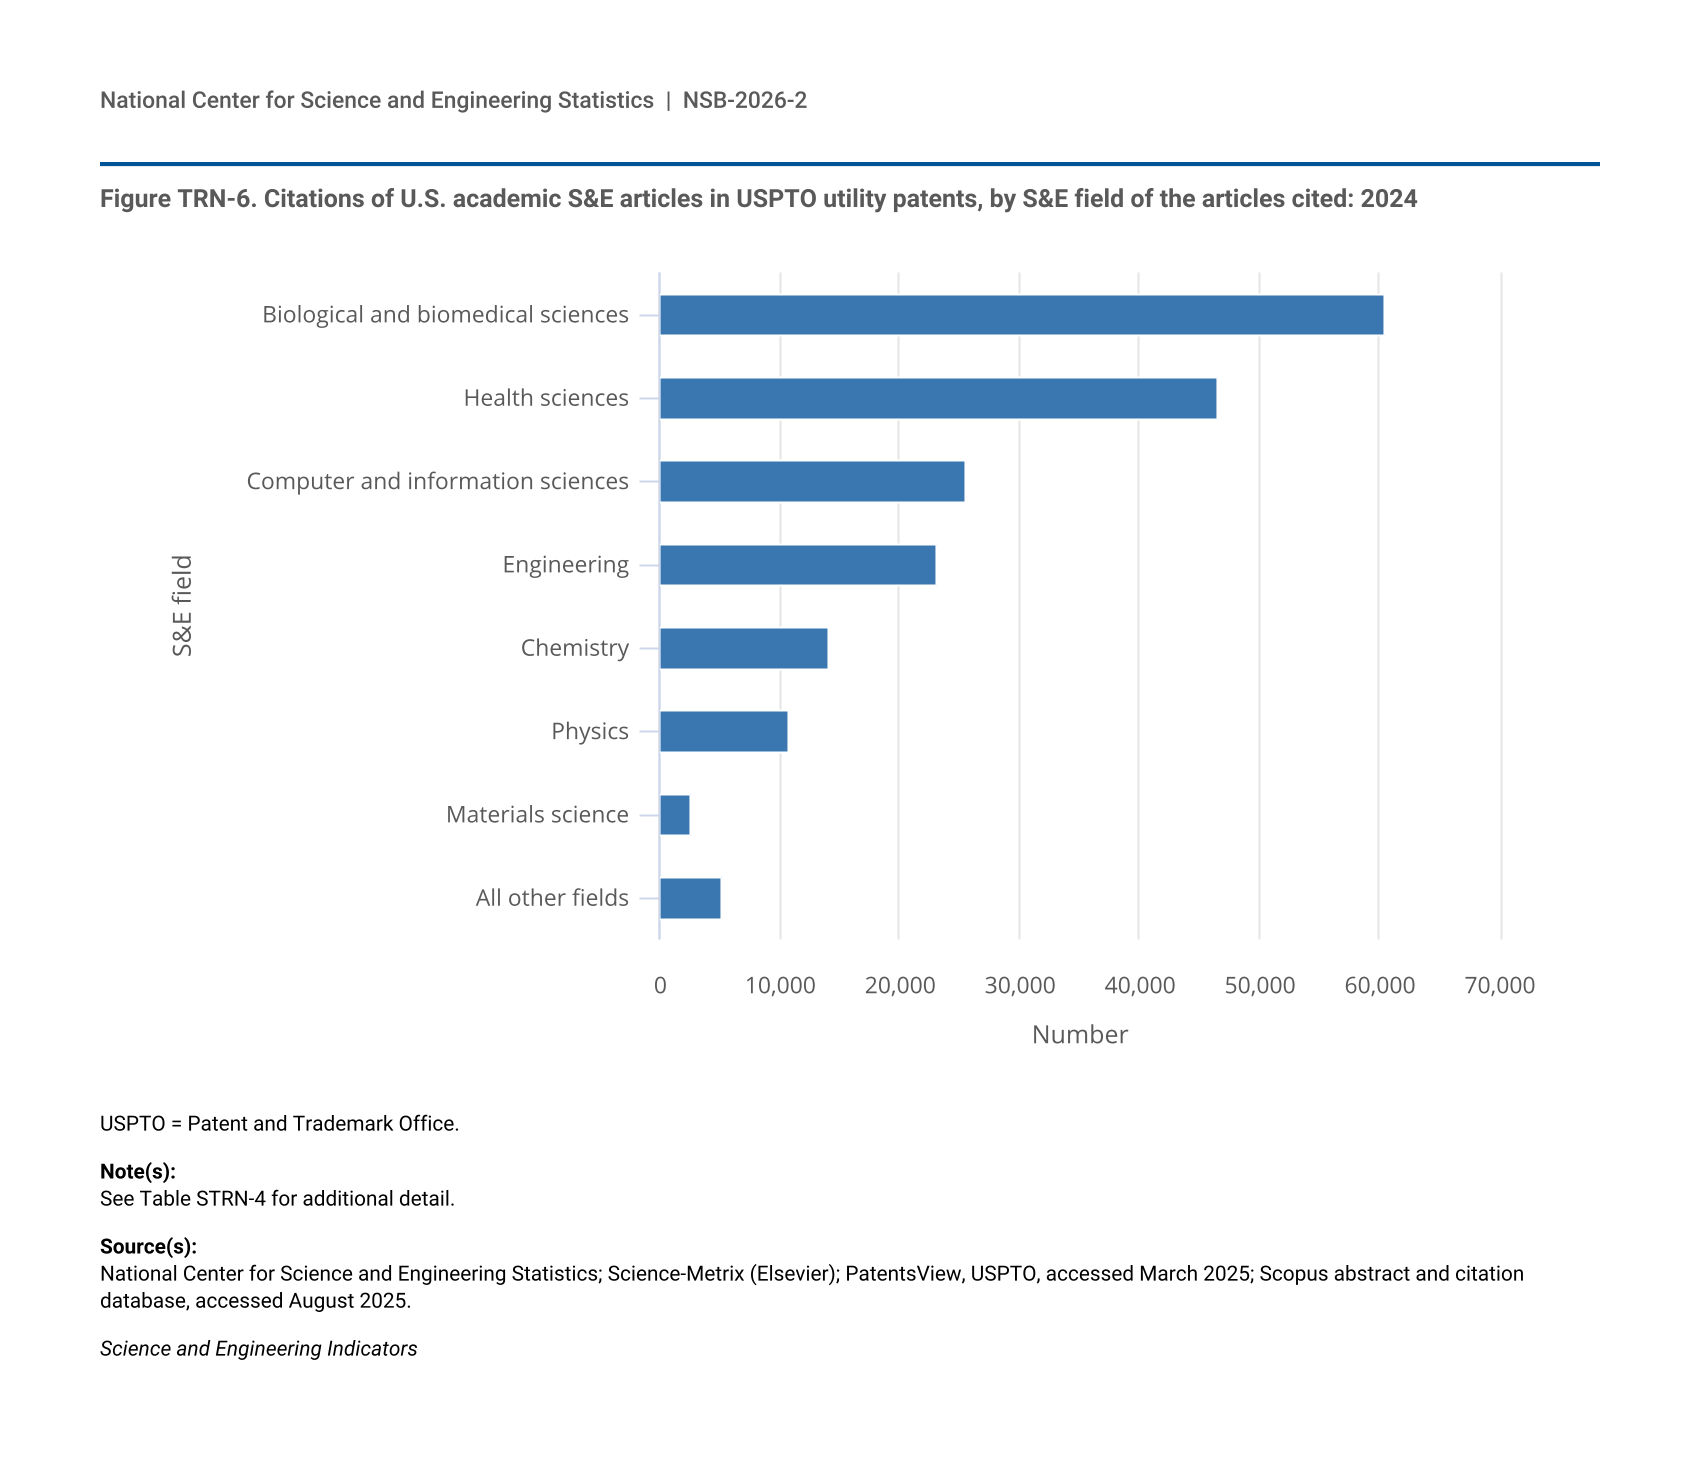
Figure TRN-6.
Citations of U.S. academic S&E articles in USPTO utility patents, by S&E field of the articles cited: 2024
Citations of U.S. academic S&E articles in USPTO utility patents, by S&E field of the articles cited: 2024
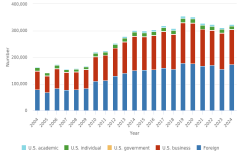
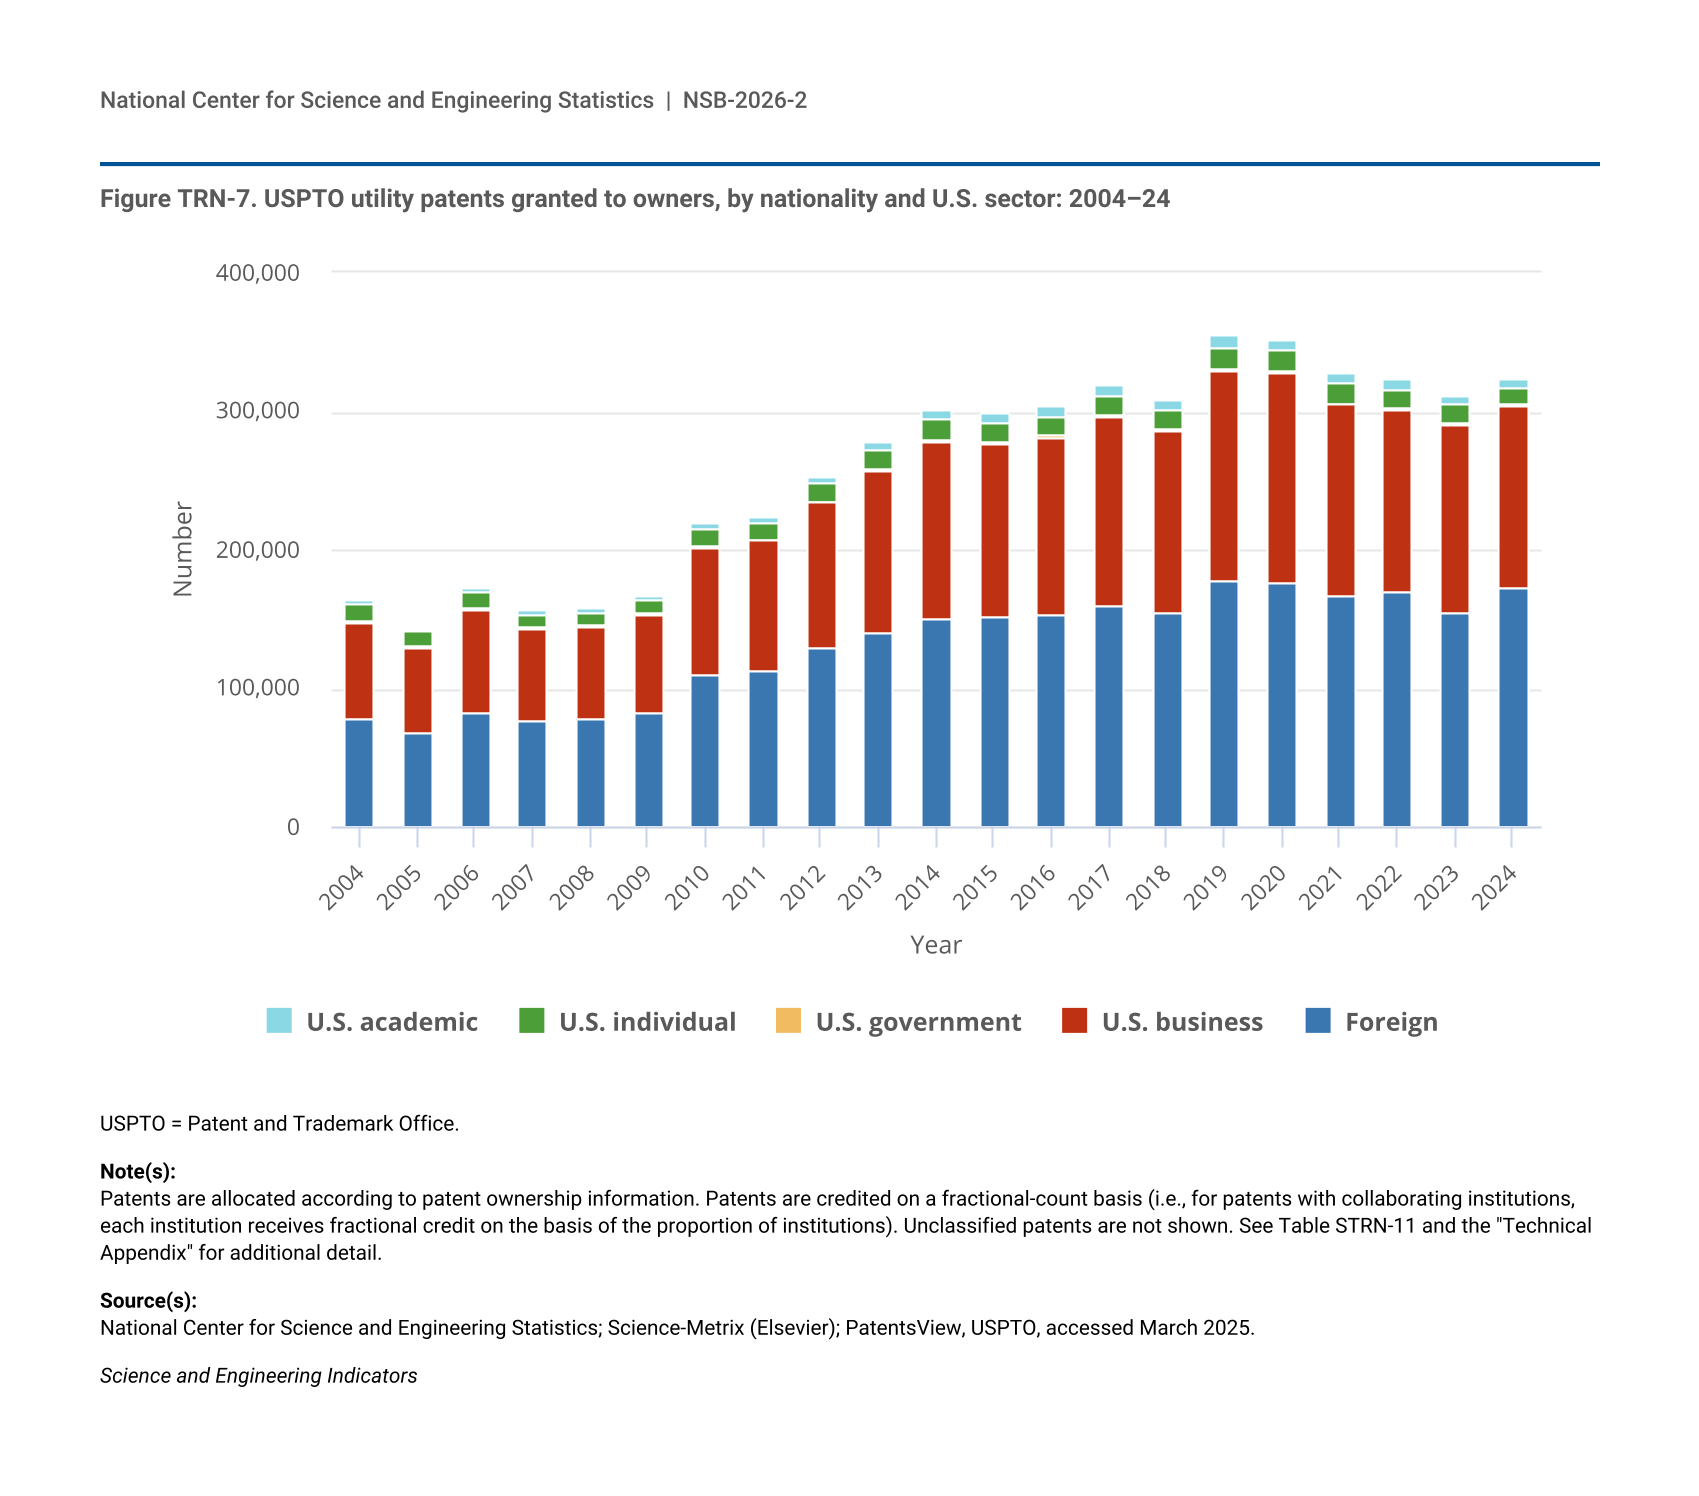
Figure TRN-7.
USPTO utility patents granted to owners, by nationality and U.S. sector: 2004–24
USPTO utility patents granted to owners, by nationality and U.S. sector: 2004–24
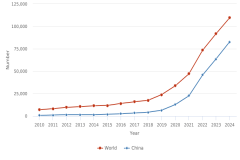
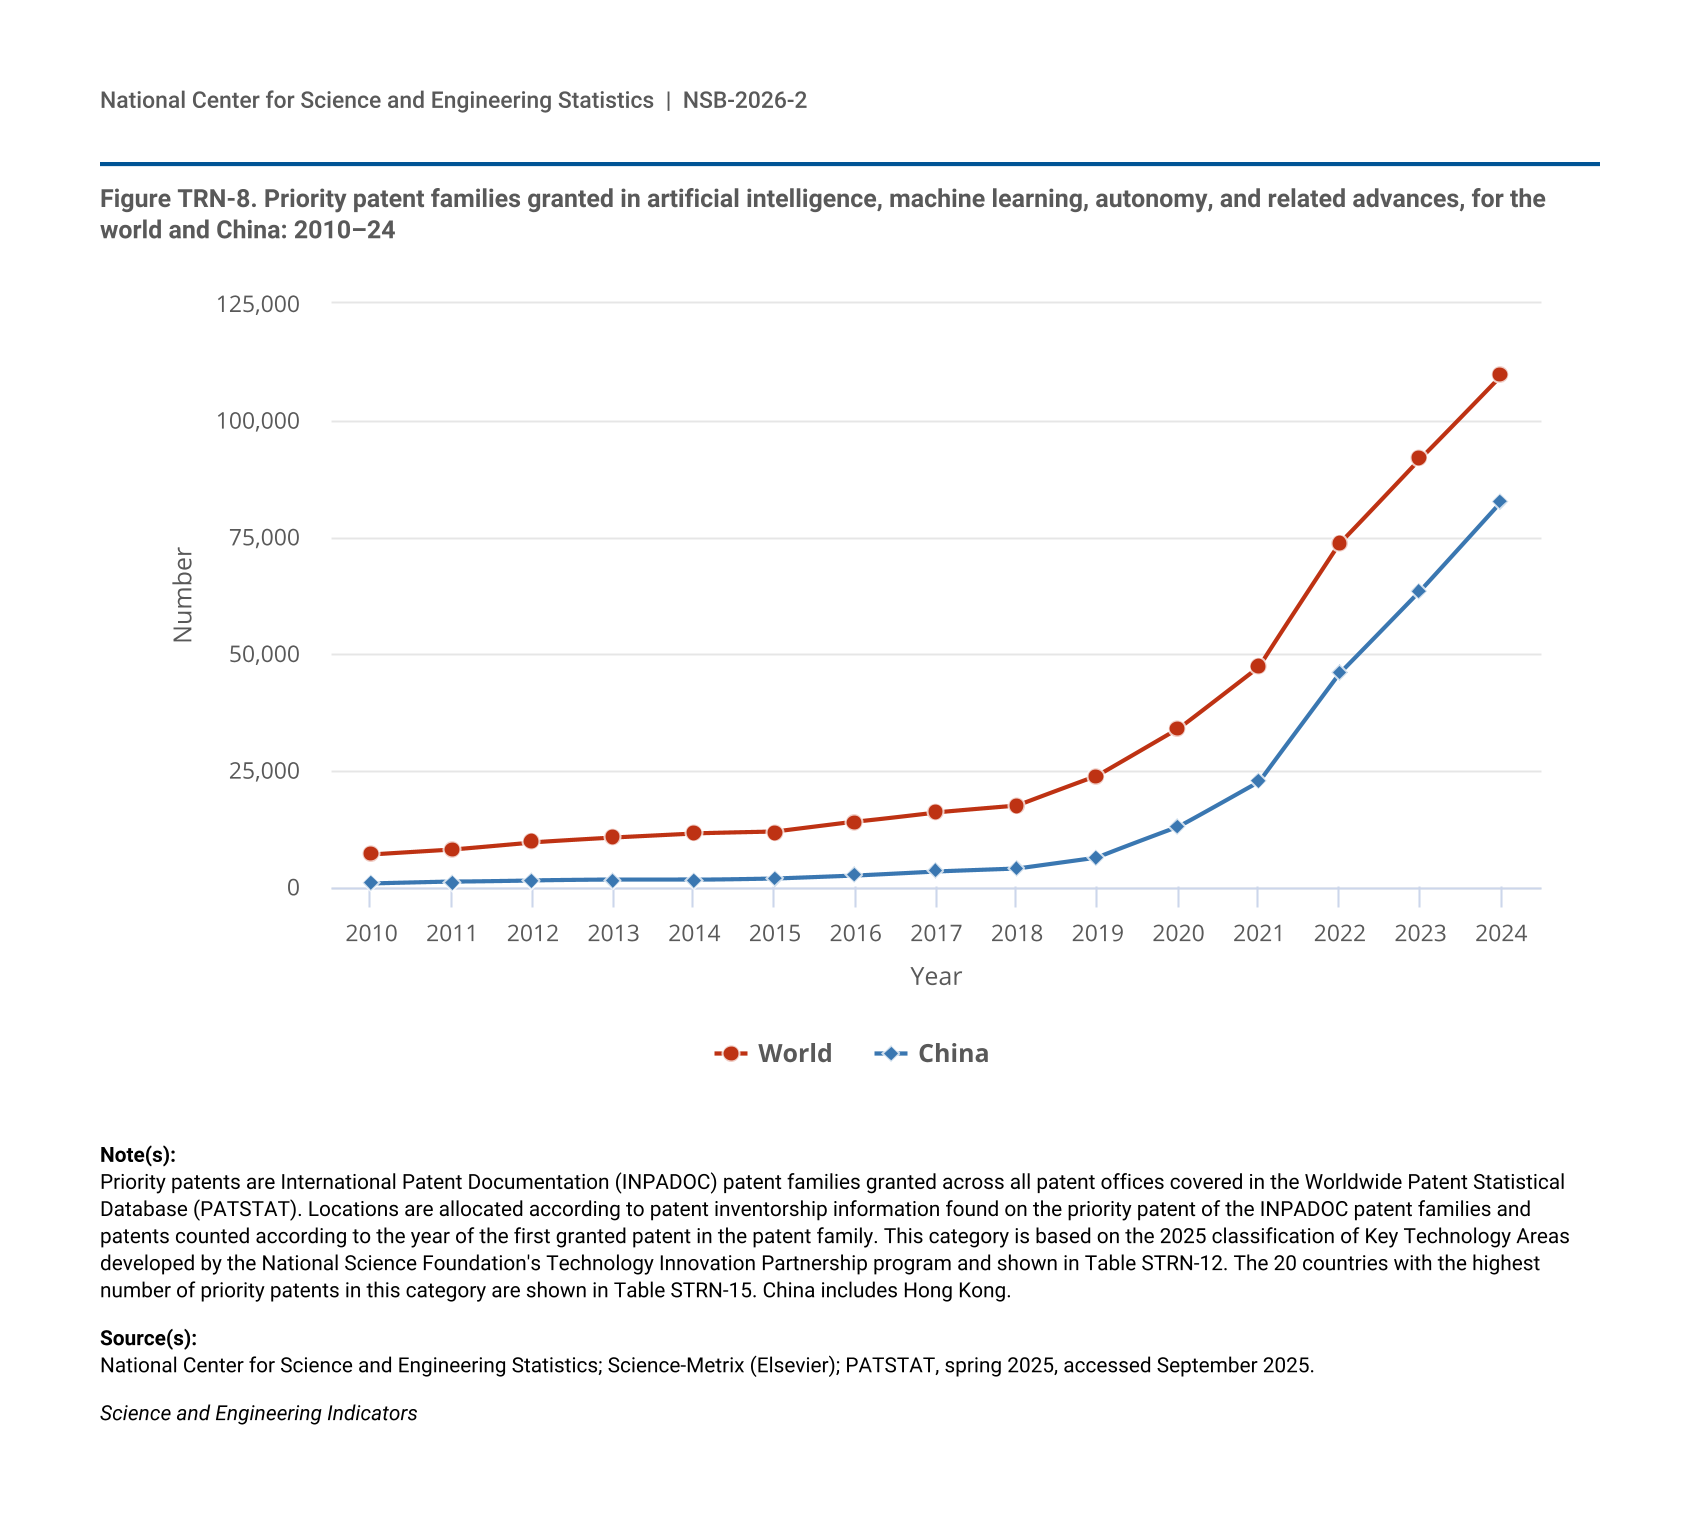
Figure TRN-8.
Priority patent families granted in artificial intelligence, machine learning, autonomy, and related advances, for the world and China: 2010–24
Priority patent families granted in artificial intelligence, machine learning, autonomy, and related advances, for the world and China: 2010–24
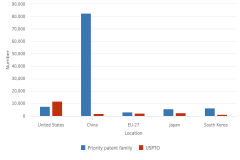
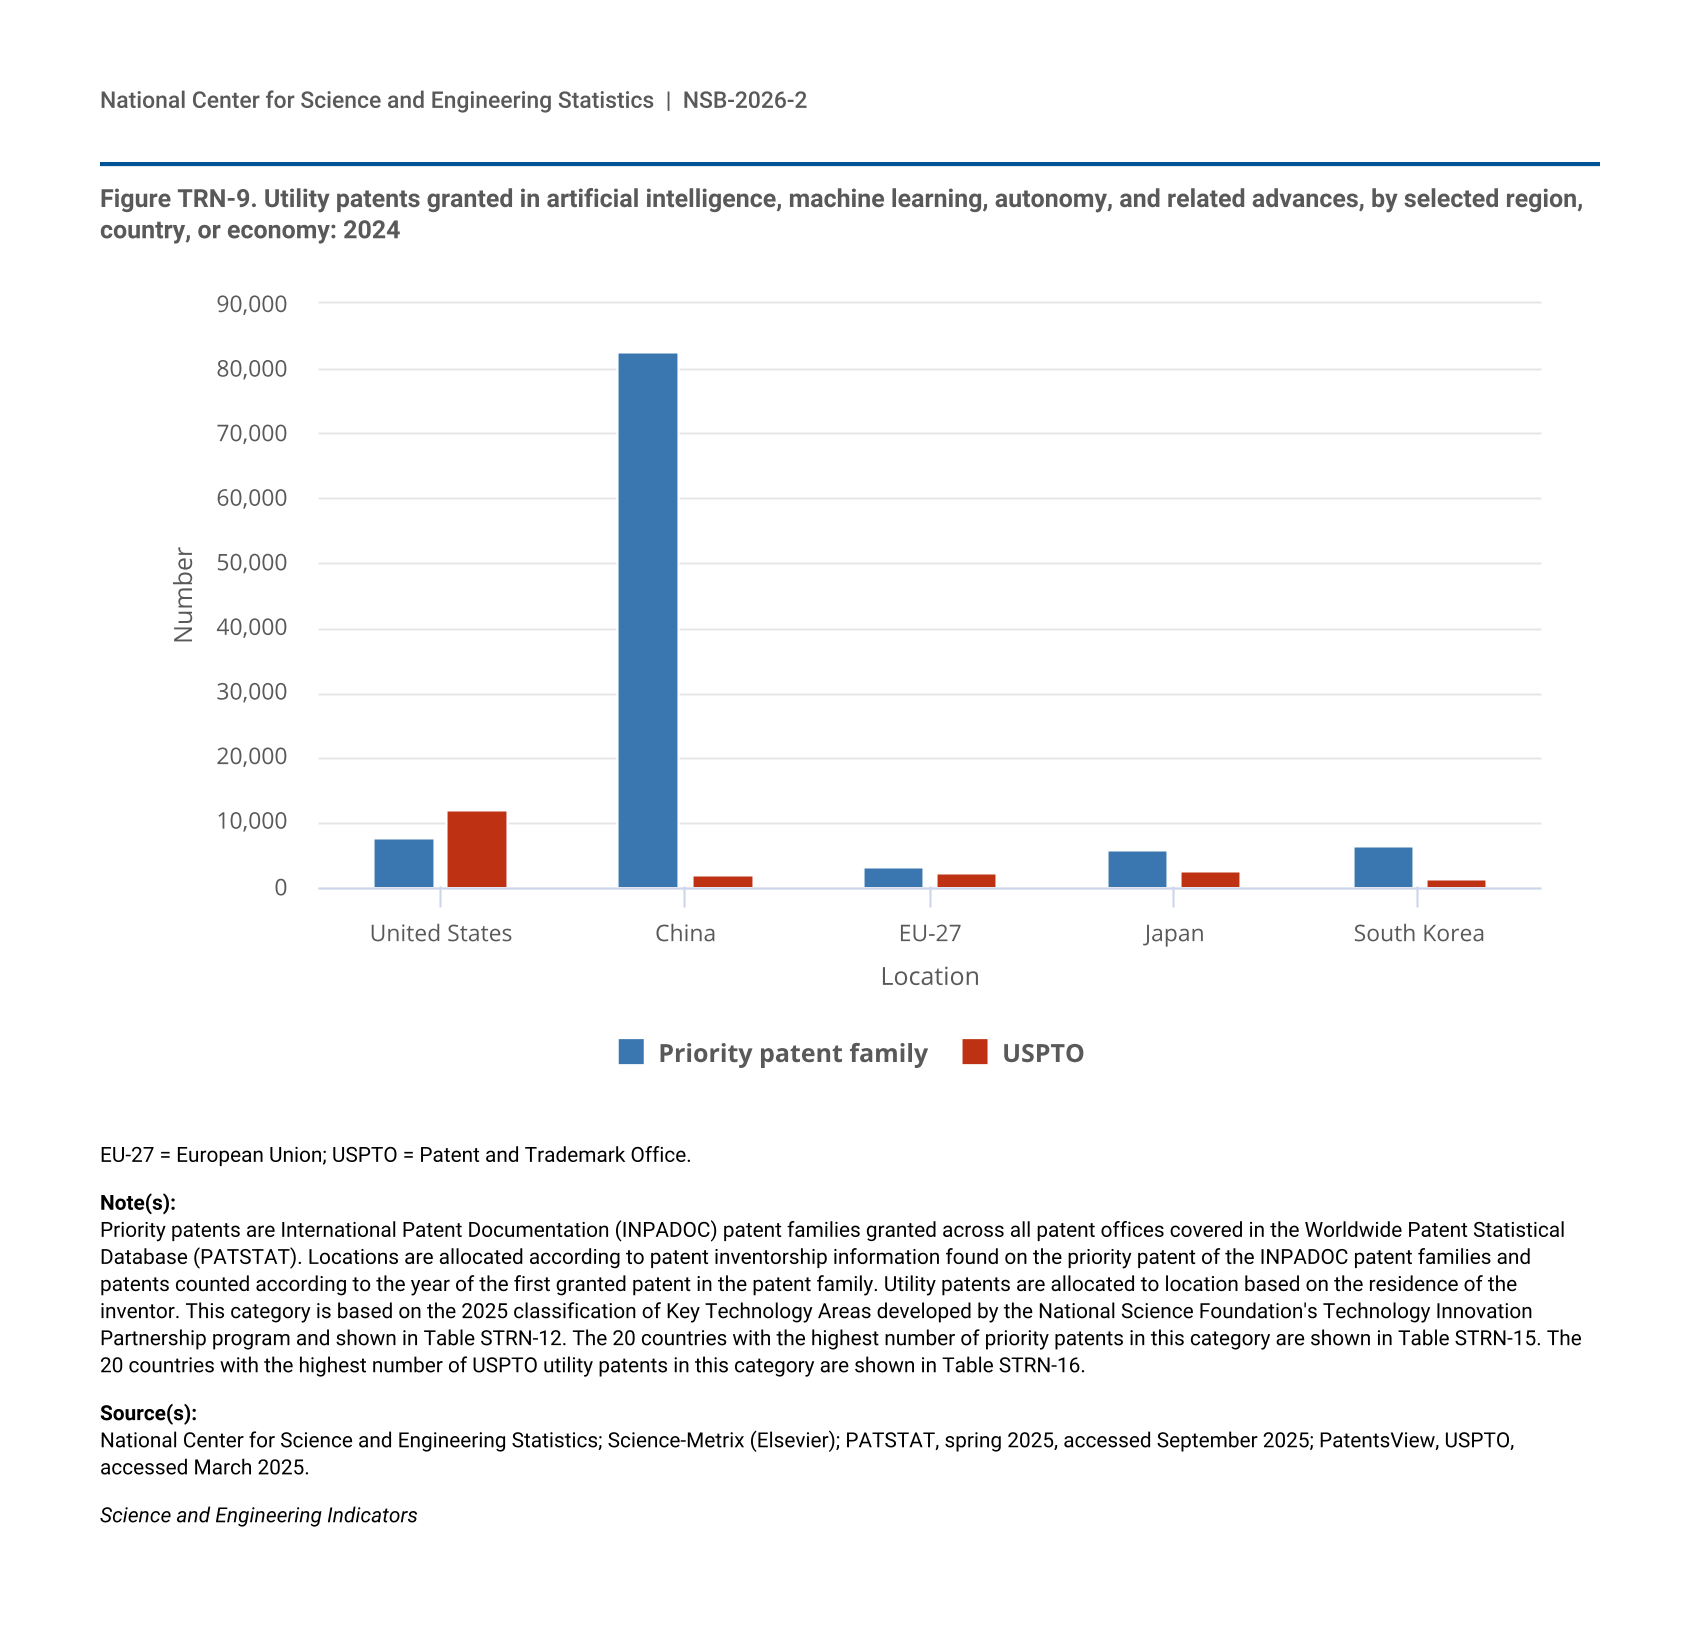
Figure TRN-9.
Utility patents granted in artificial intelligence, machine learning, autonomy, and related advances, by selected region, country, or economy: 2024
Utility patents granted in artificial intelligence, machine learning, autonomy, and related advances, by selected region, country, or economy: 2024
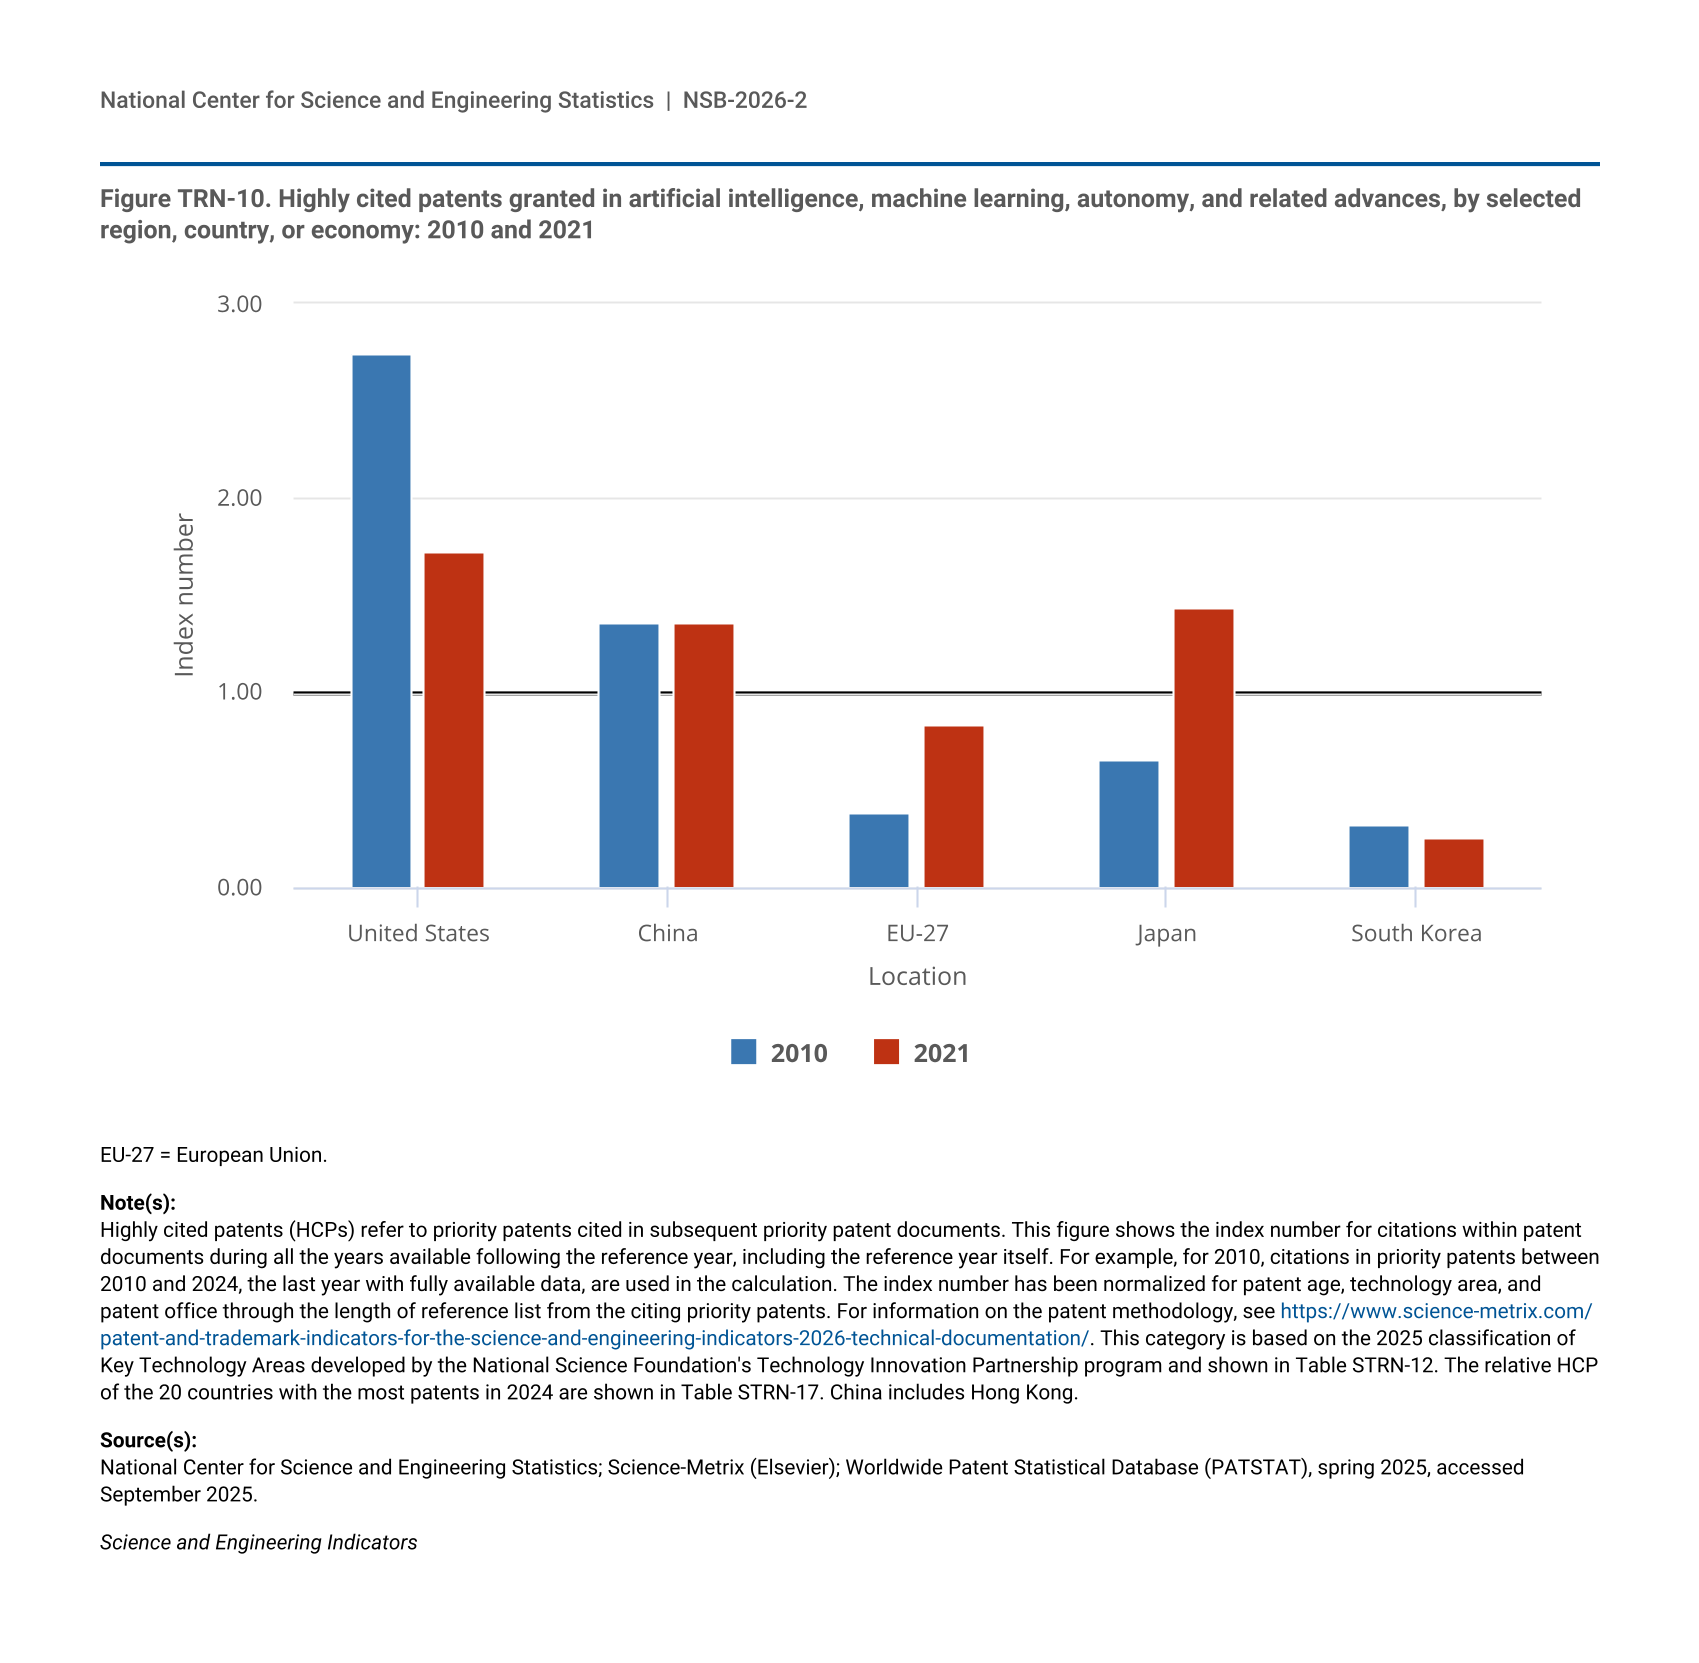
Figure TRN-10.
Highly cited patents granted in artificial intelligence, machine learning, autonomy, and related advances, by selected region, country, or economy: 2010 and 2021
Highly cited patents granted in artificial intelligence, machine learning, autonomy, and related advances, by selected region, country, or economy: 2010 and 2021
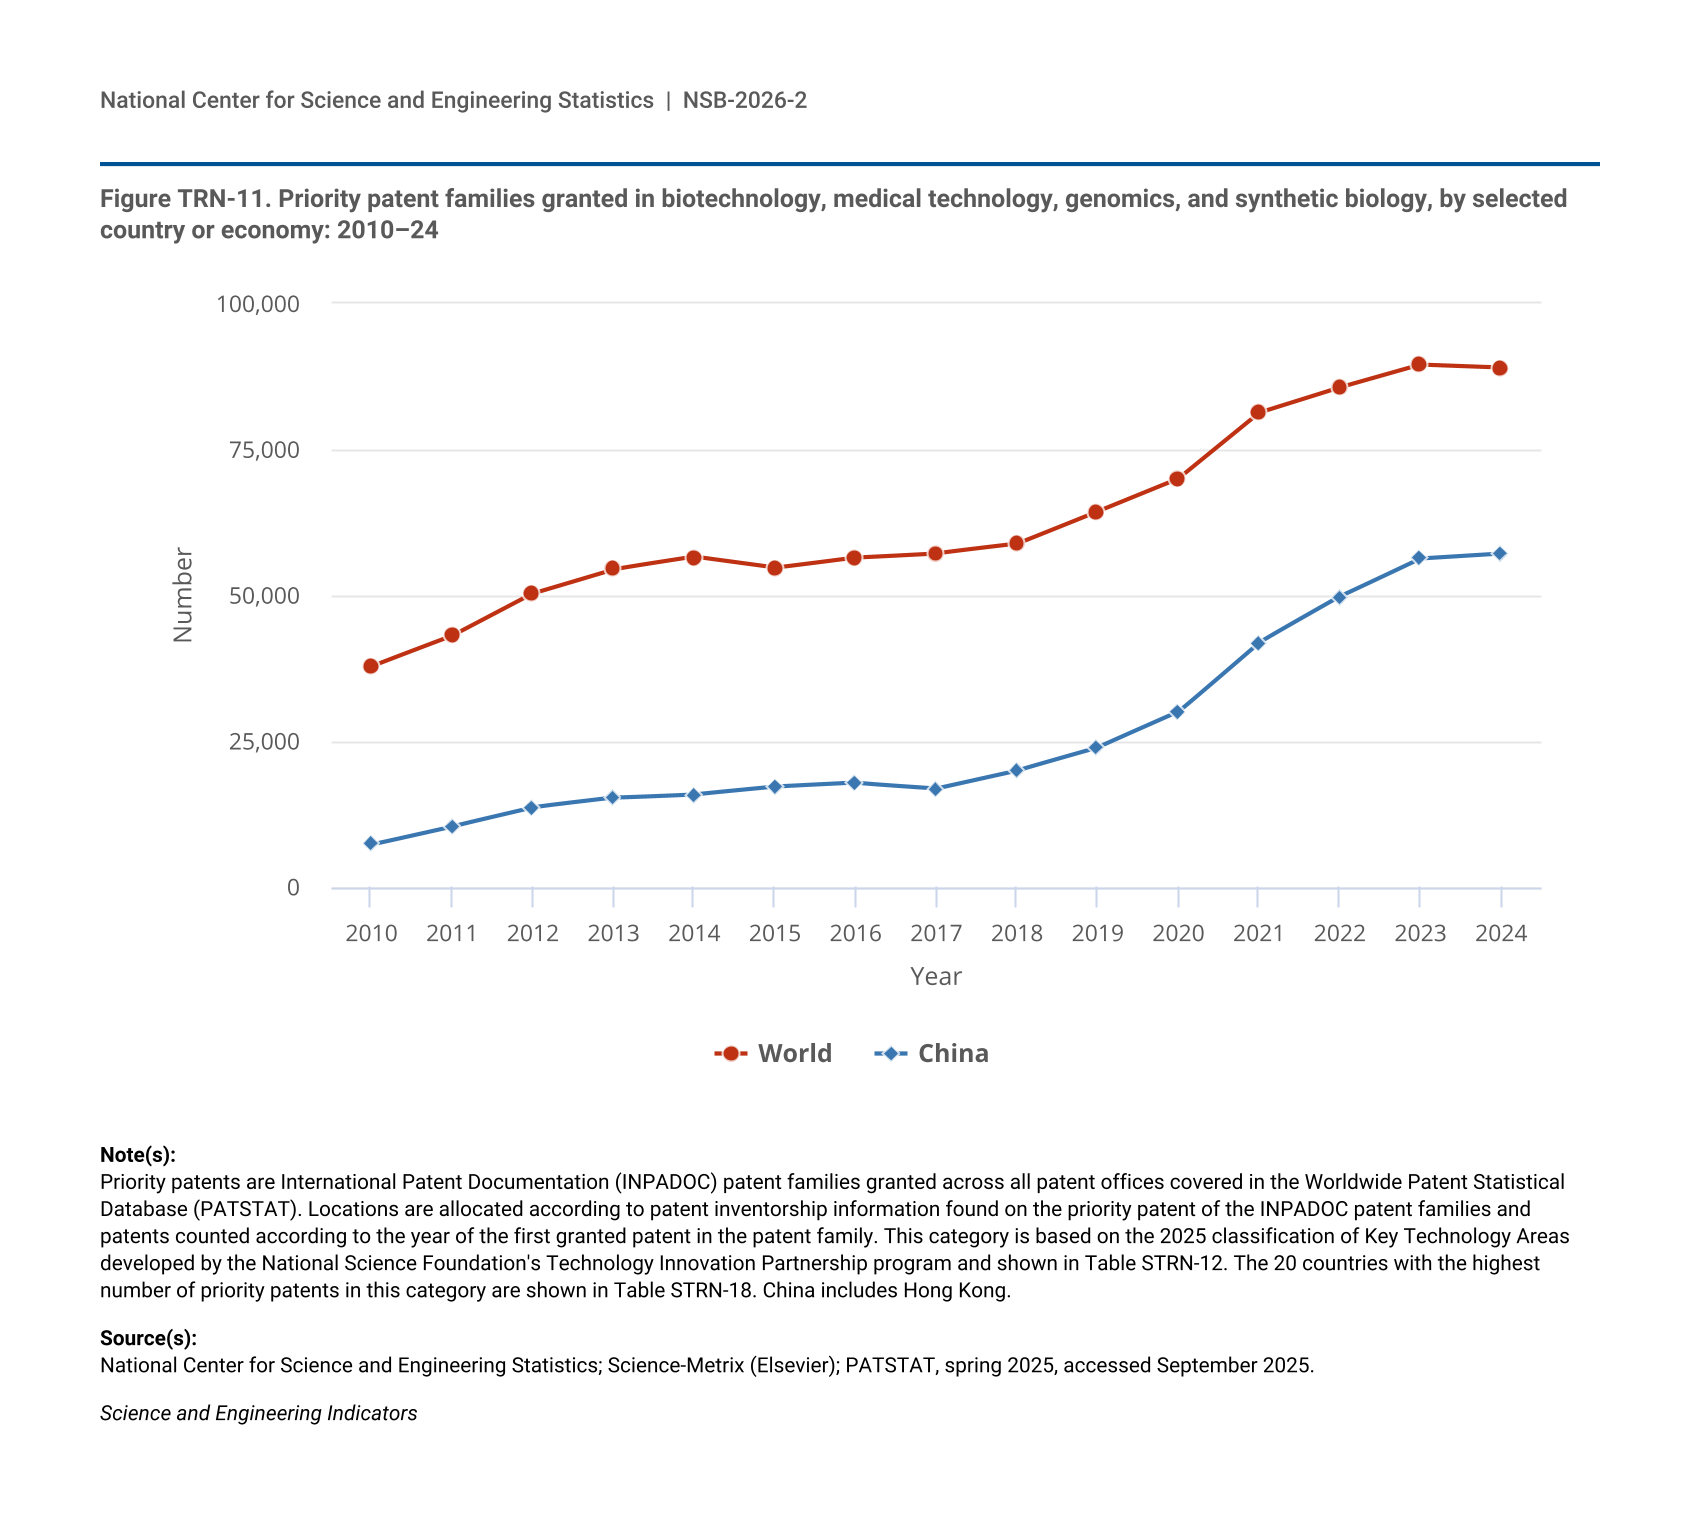
Figure TRN-11.
Priority patent families granted in biotechnology, medical technology, genomics, and synthetic biology, by selected country or economy: 2010–24
Priority patent families granted in biotechnology, medical technology, genomics, and synthetic biology, by selected country or economy: 2010–24
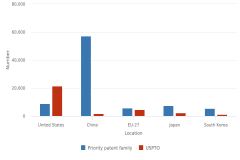
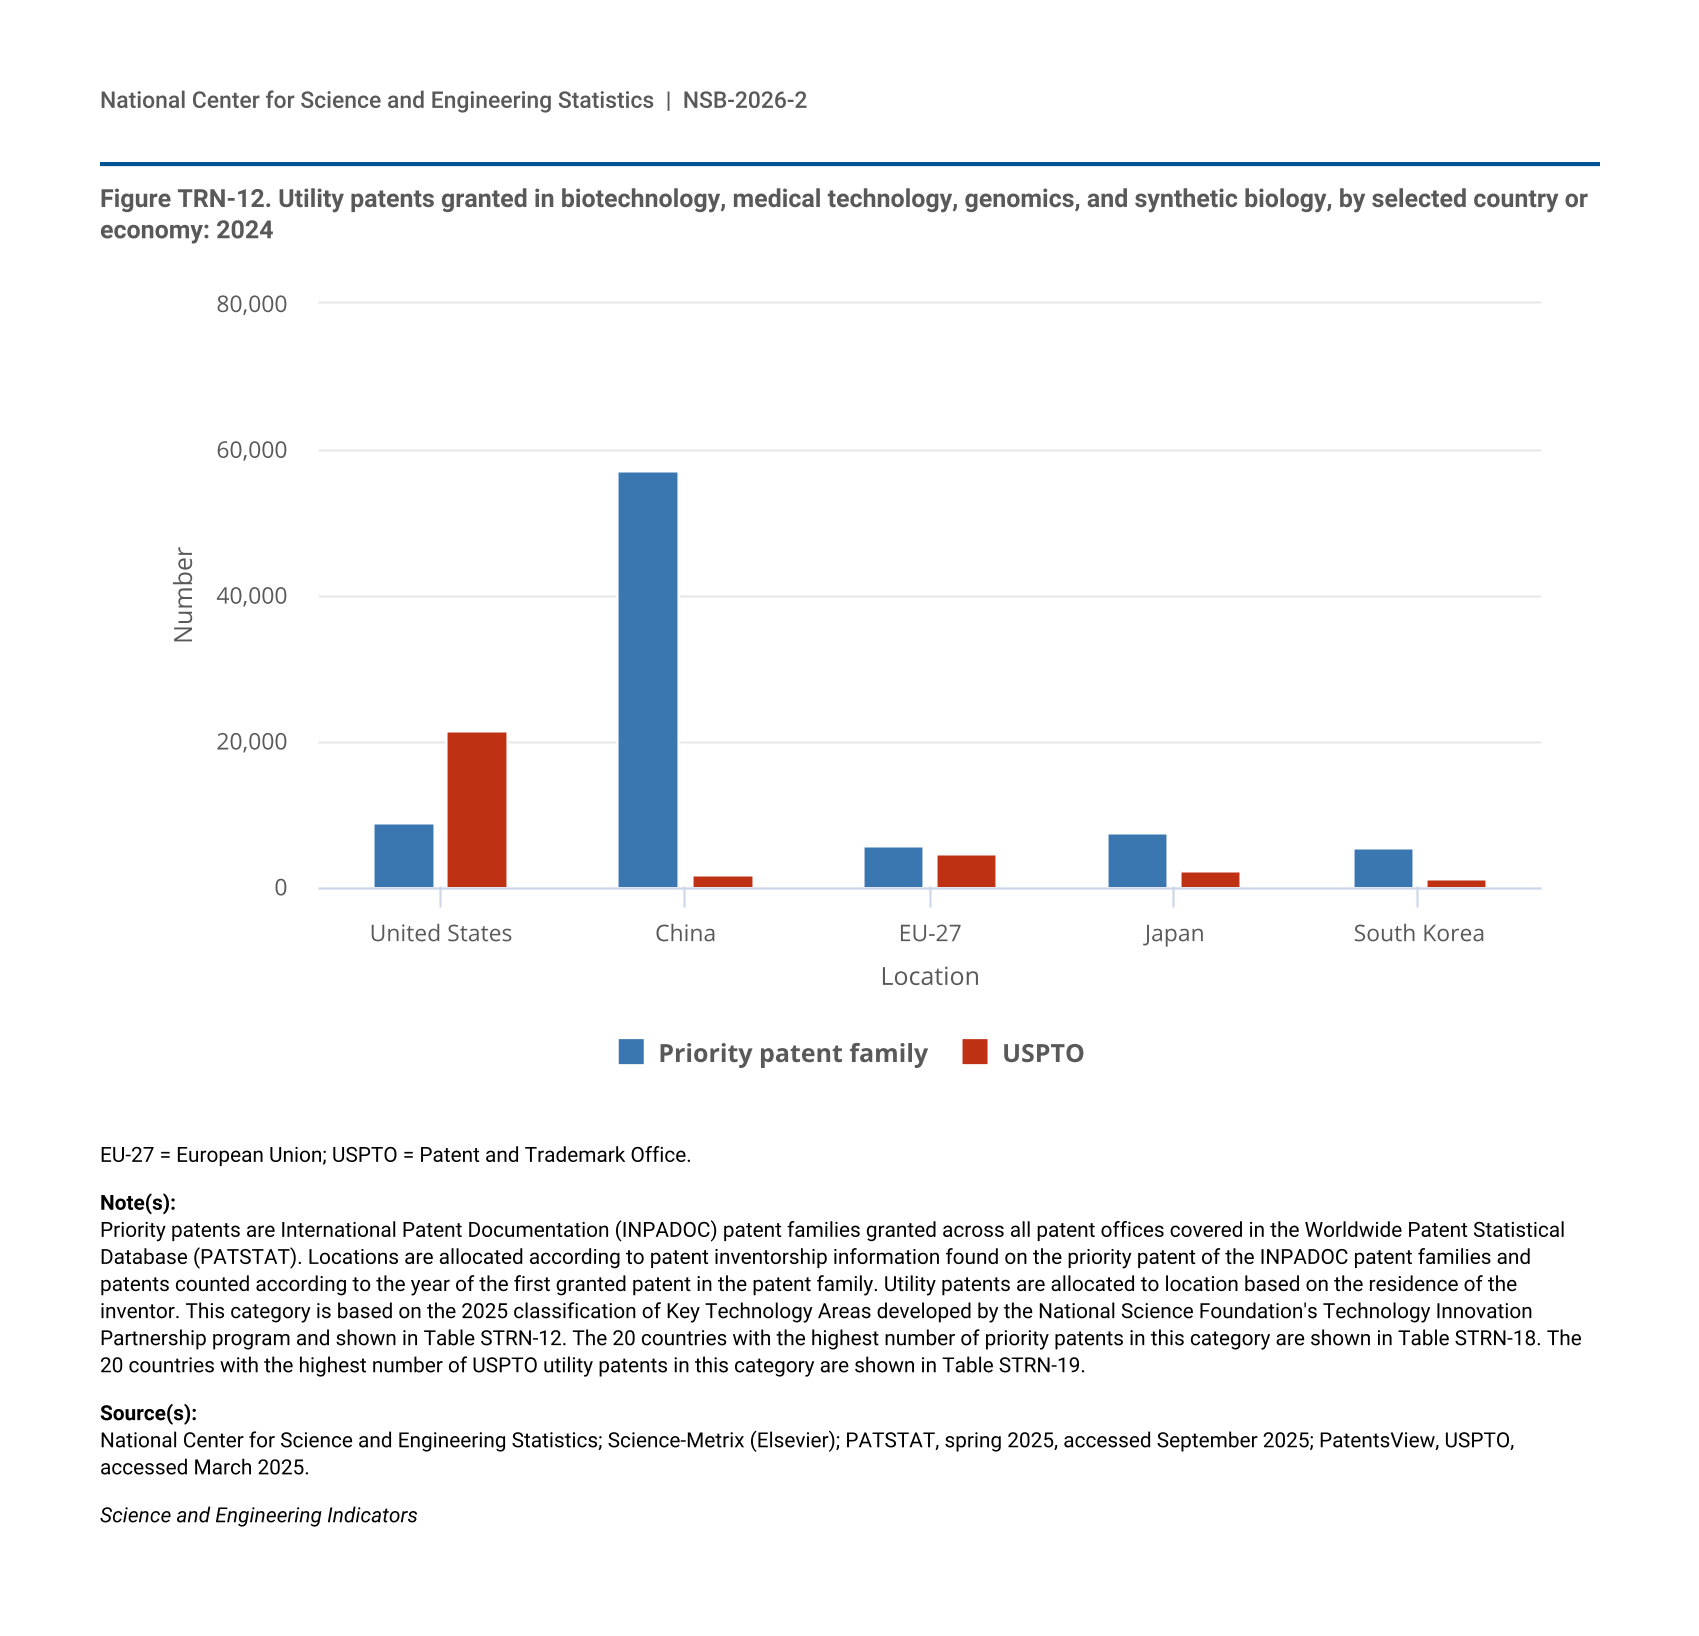
Figure TRN-12.
Utility patents granted in biotechnology, medical technology, genomics, and synthetic biology, by selected country or economy: 2024
Utility patents granted in biotechnology, medical technology, genomics, and synthetic biology, by selected country or economy: 2024
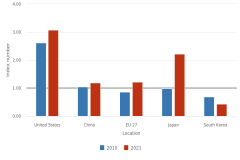
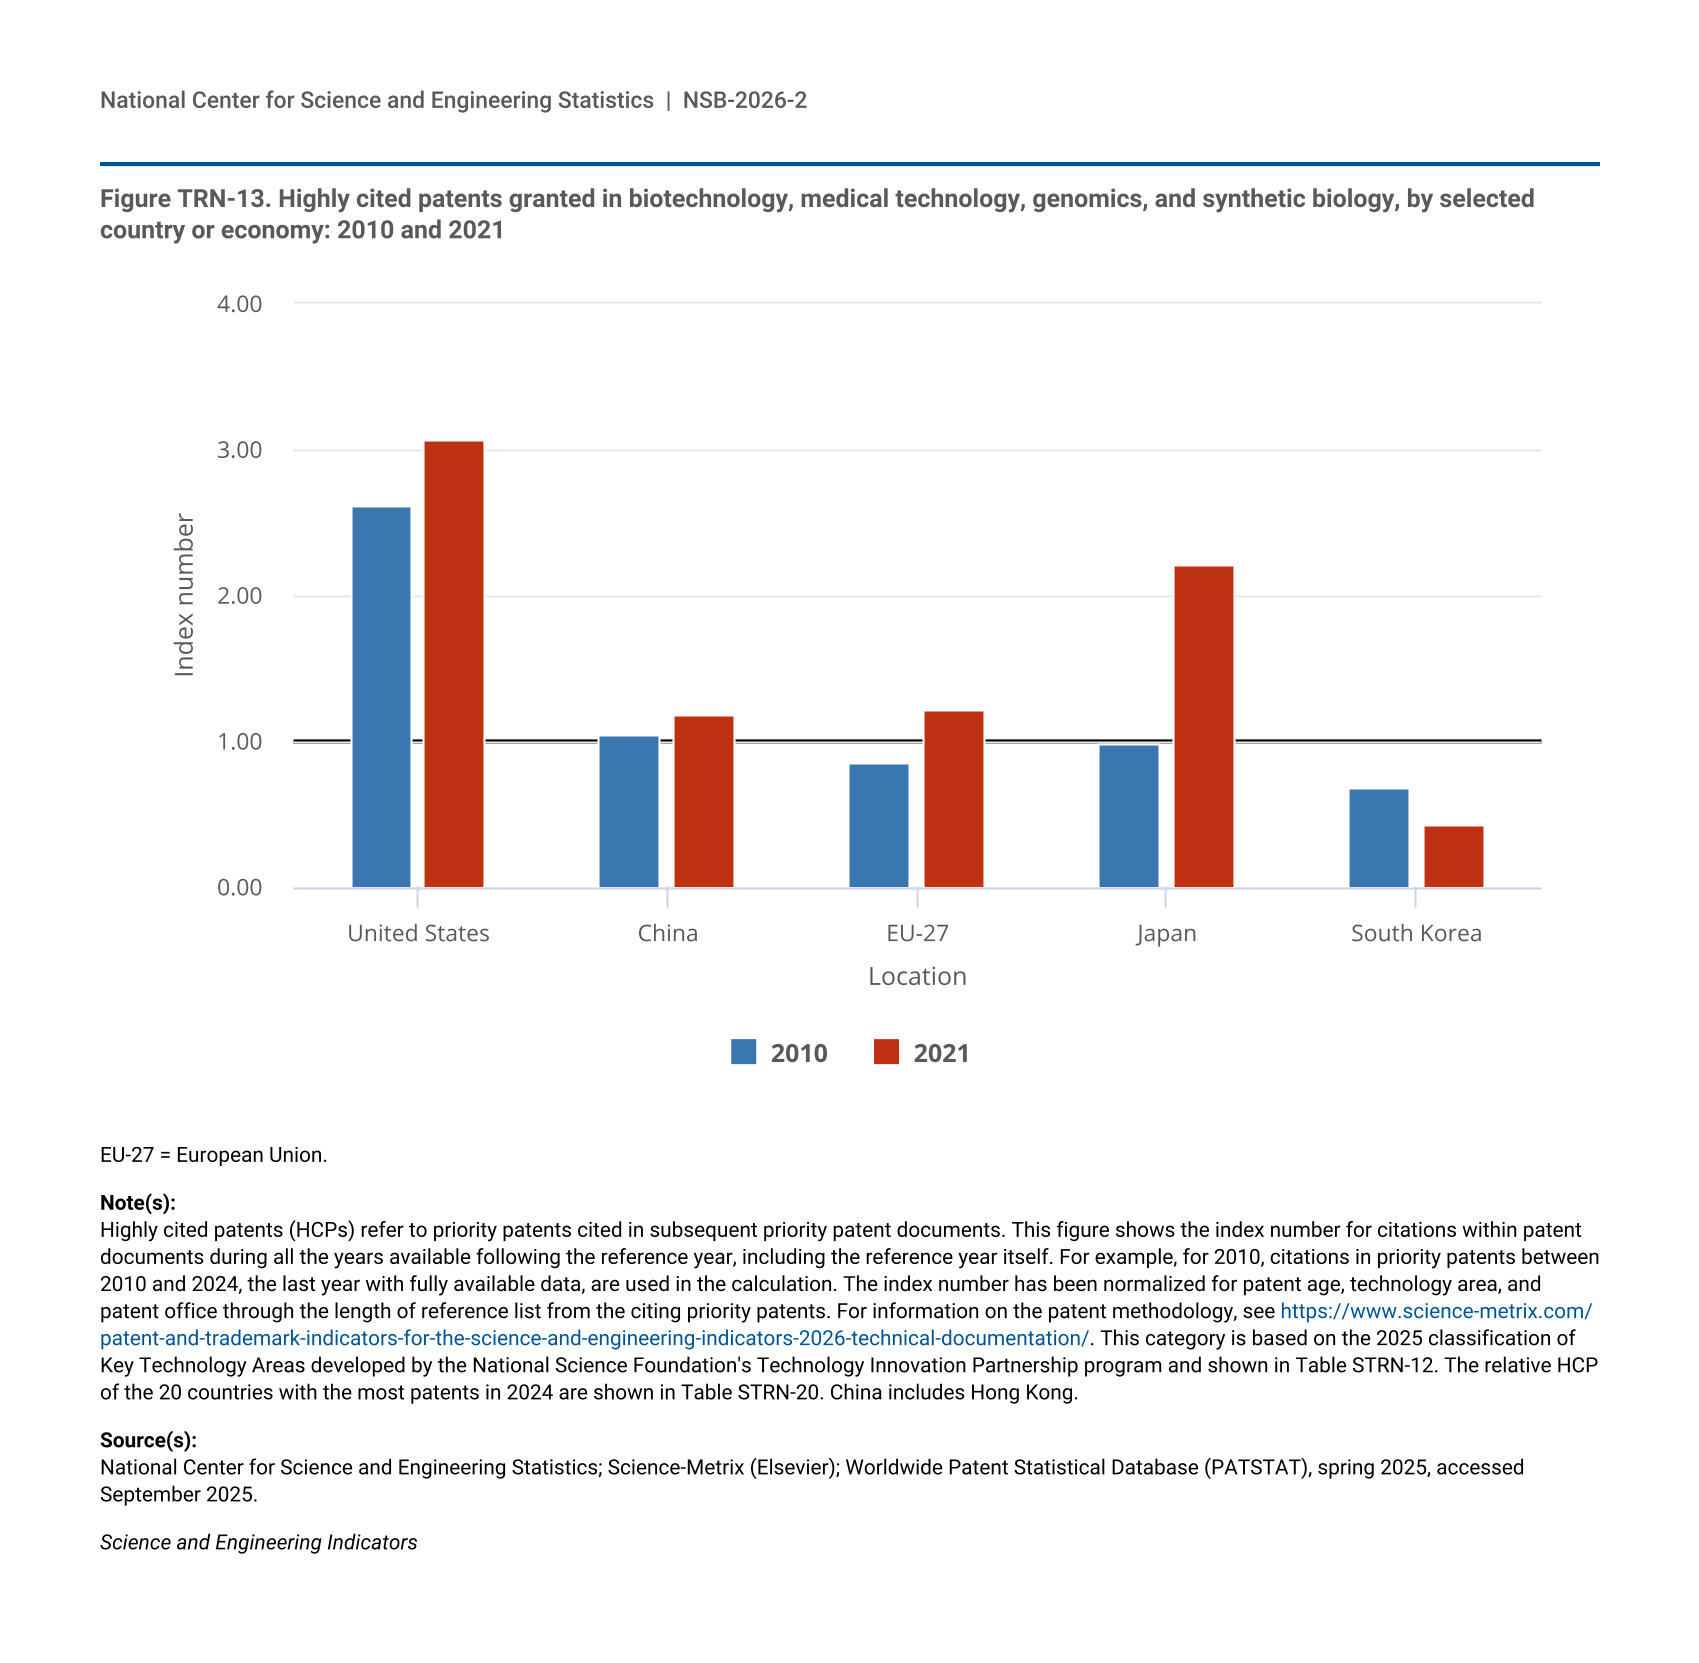
Figure TRN-13.
Highly cited patents granted in biotechnology, medical technology, genomics, and synthetic biology, by selected country or economy: 2010 and 2021
Highly cited patents granted in biotechnology, medical technology, genomics, and synthetic biology, by selected country or economy: 2010 and 2021
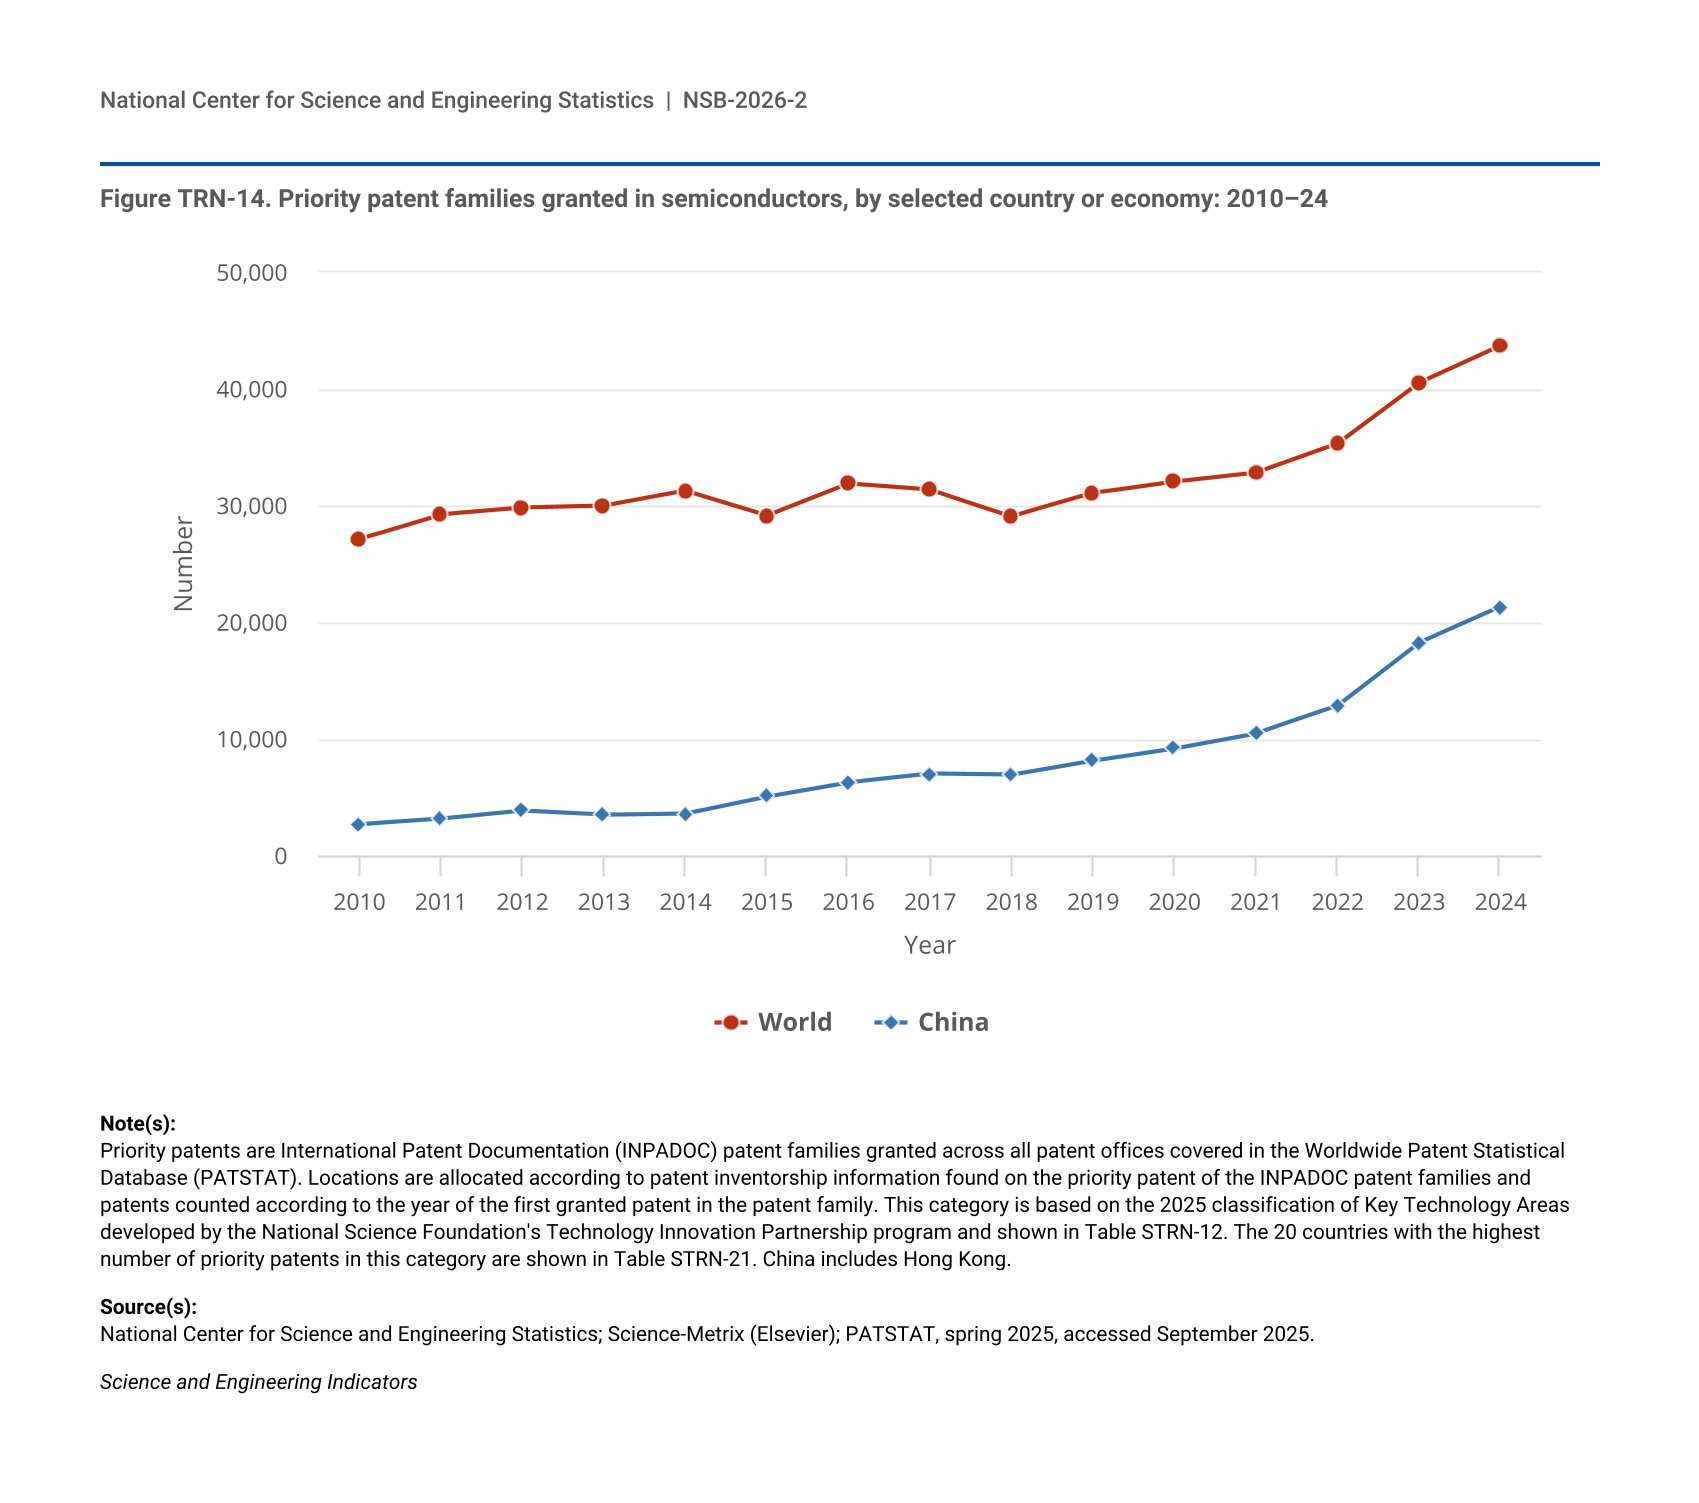
Figure TRN-14.
Priority patent families granted in semiconductors, by selected country or economy: 2010–24
Priority patent families granted in semiconductors, by selected country or economy: 2010–24
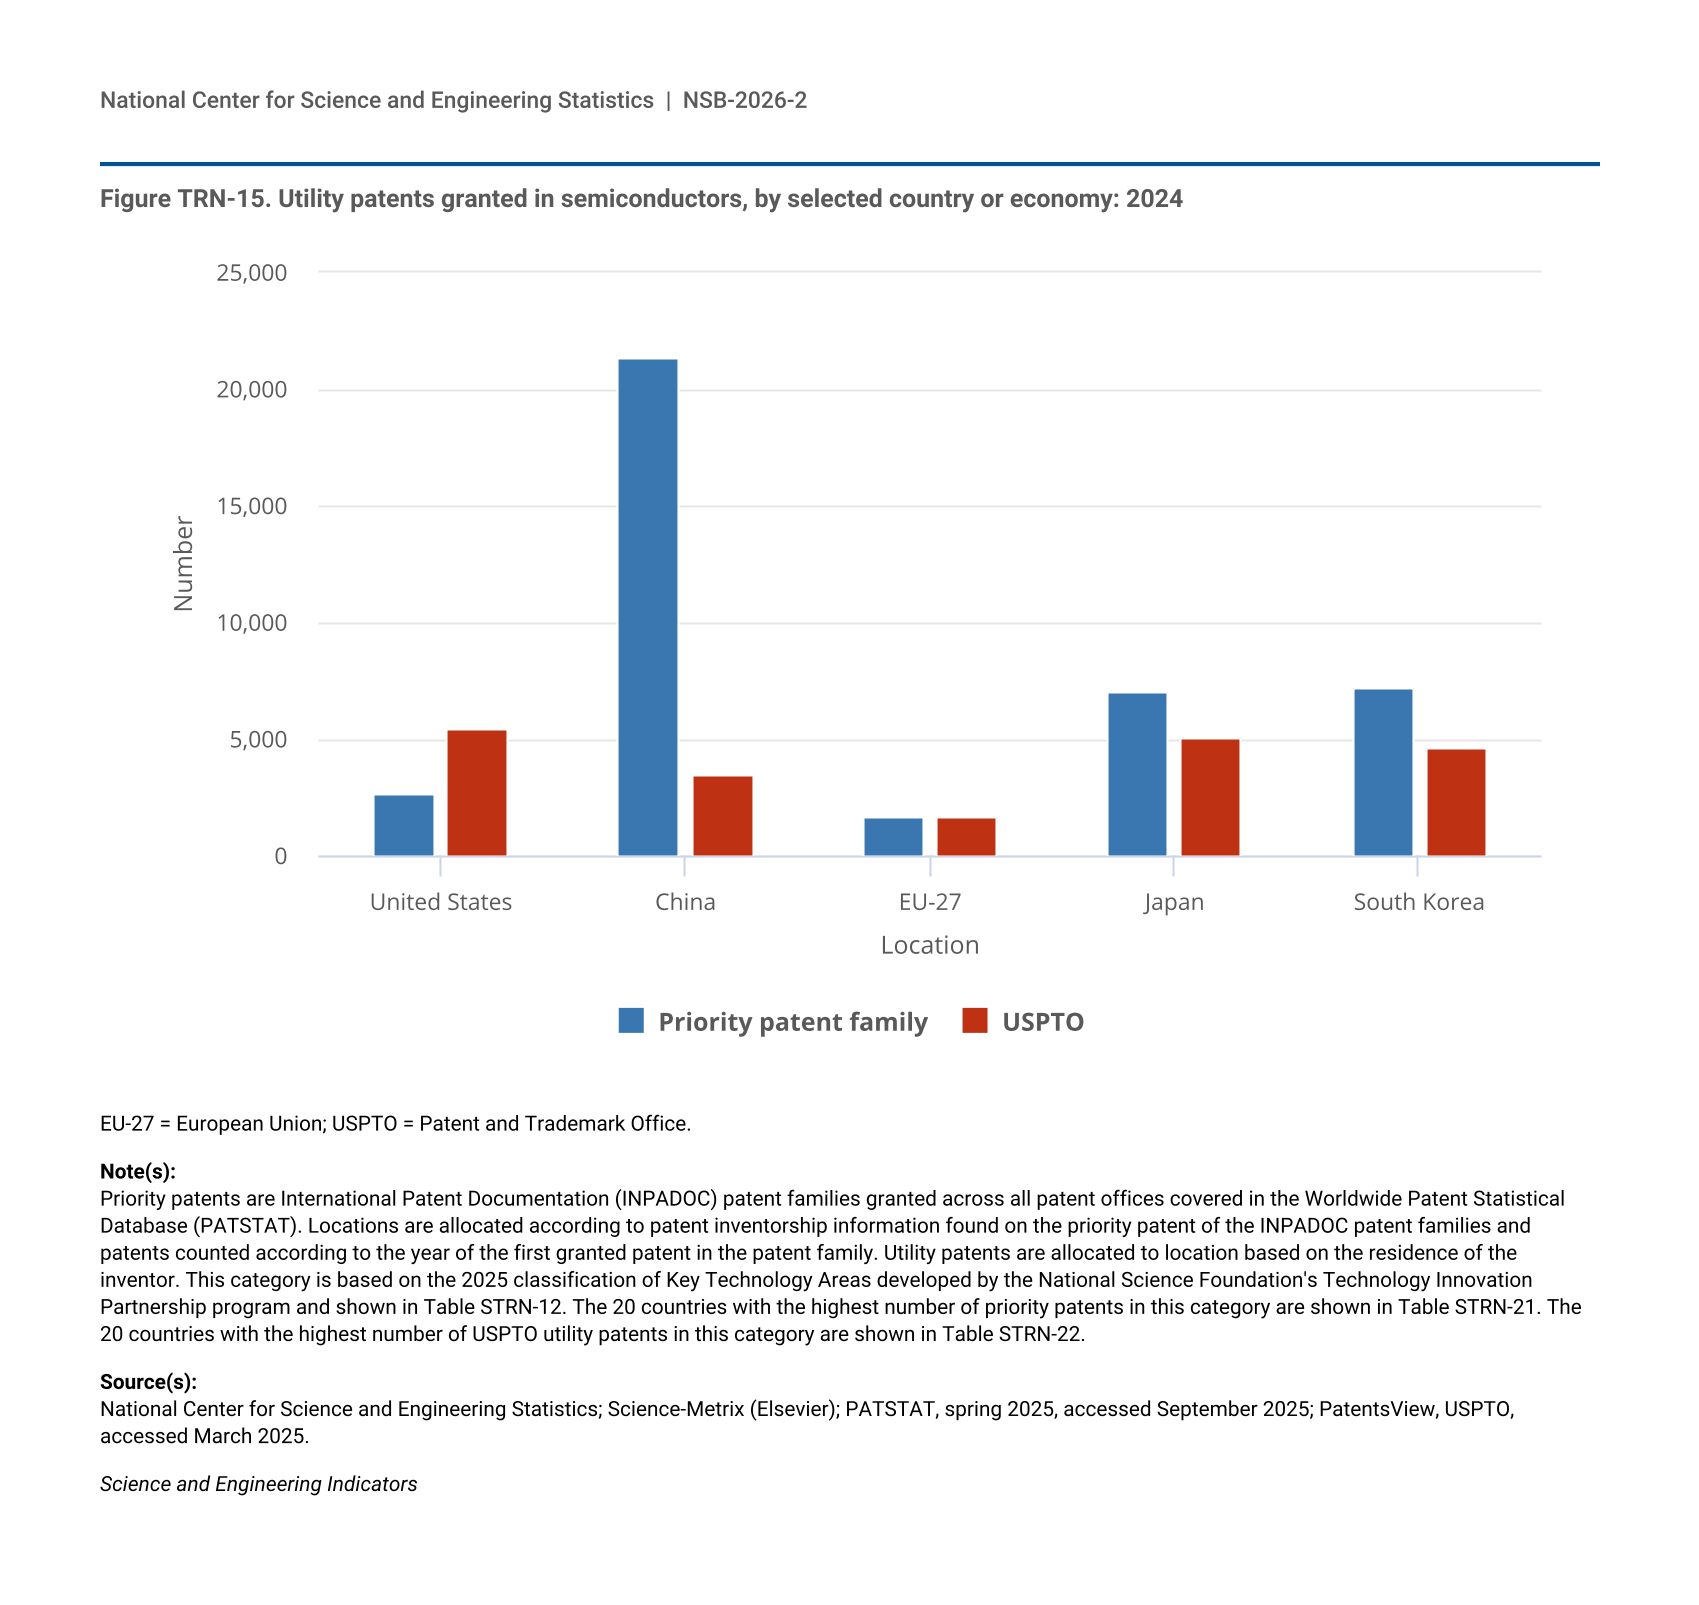
Figure TRN-15.
Utility patents granted in semiconductors, by selected country or economy: 2024
Utility patents granted in semiconductors, by selected country or economy: 2024
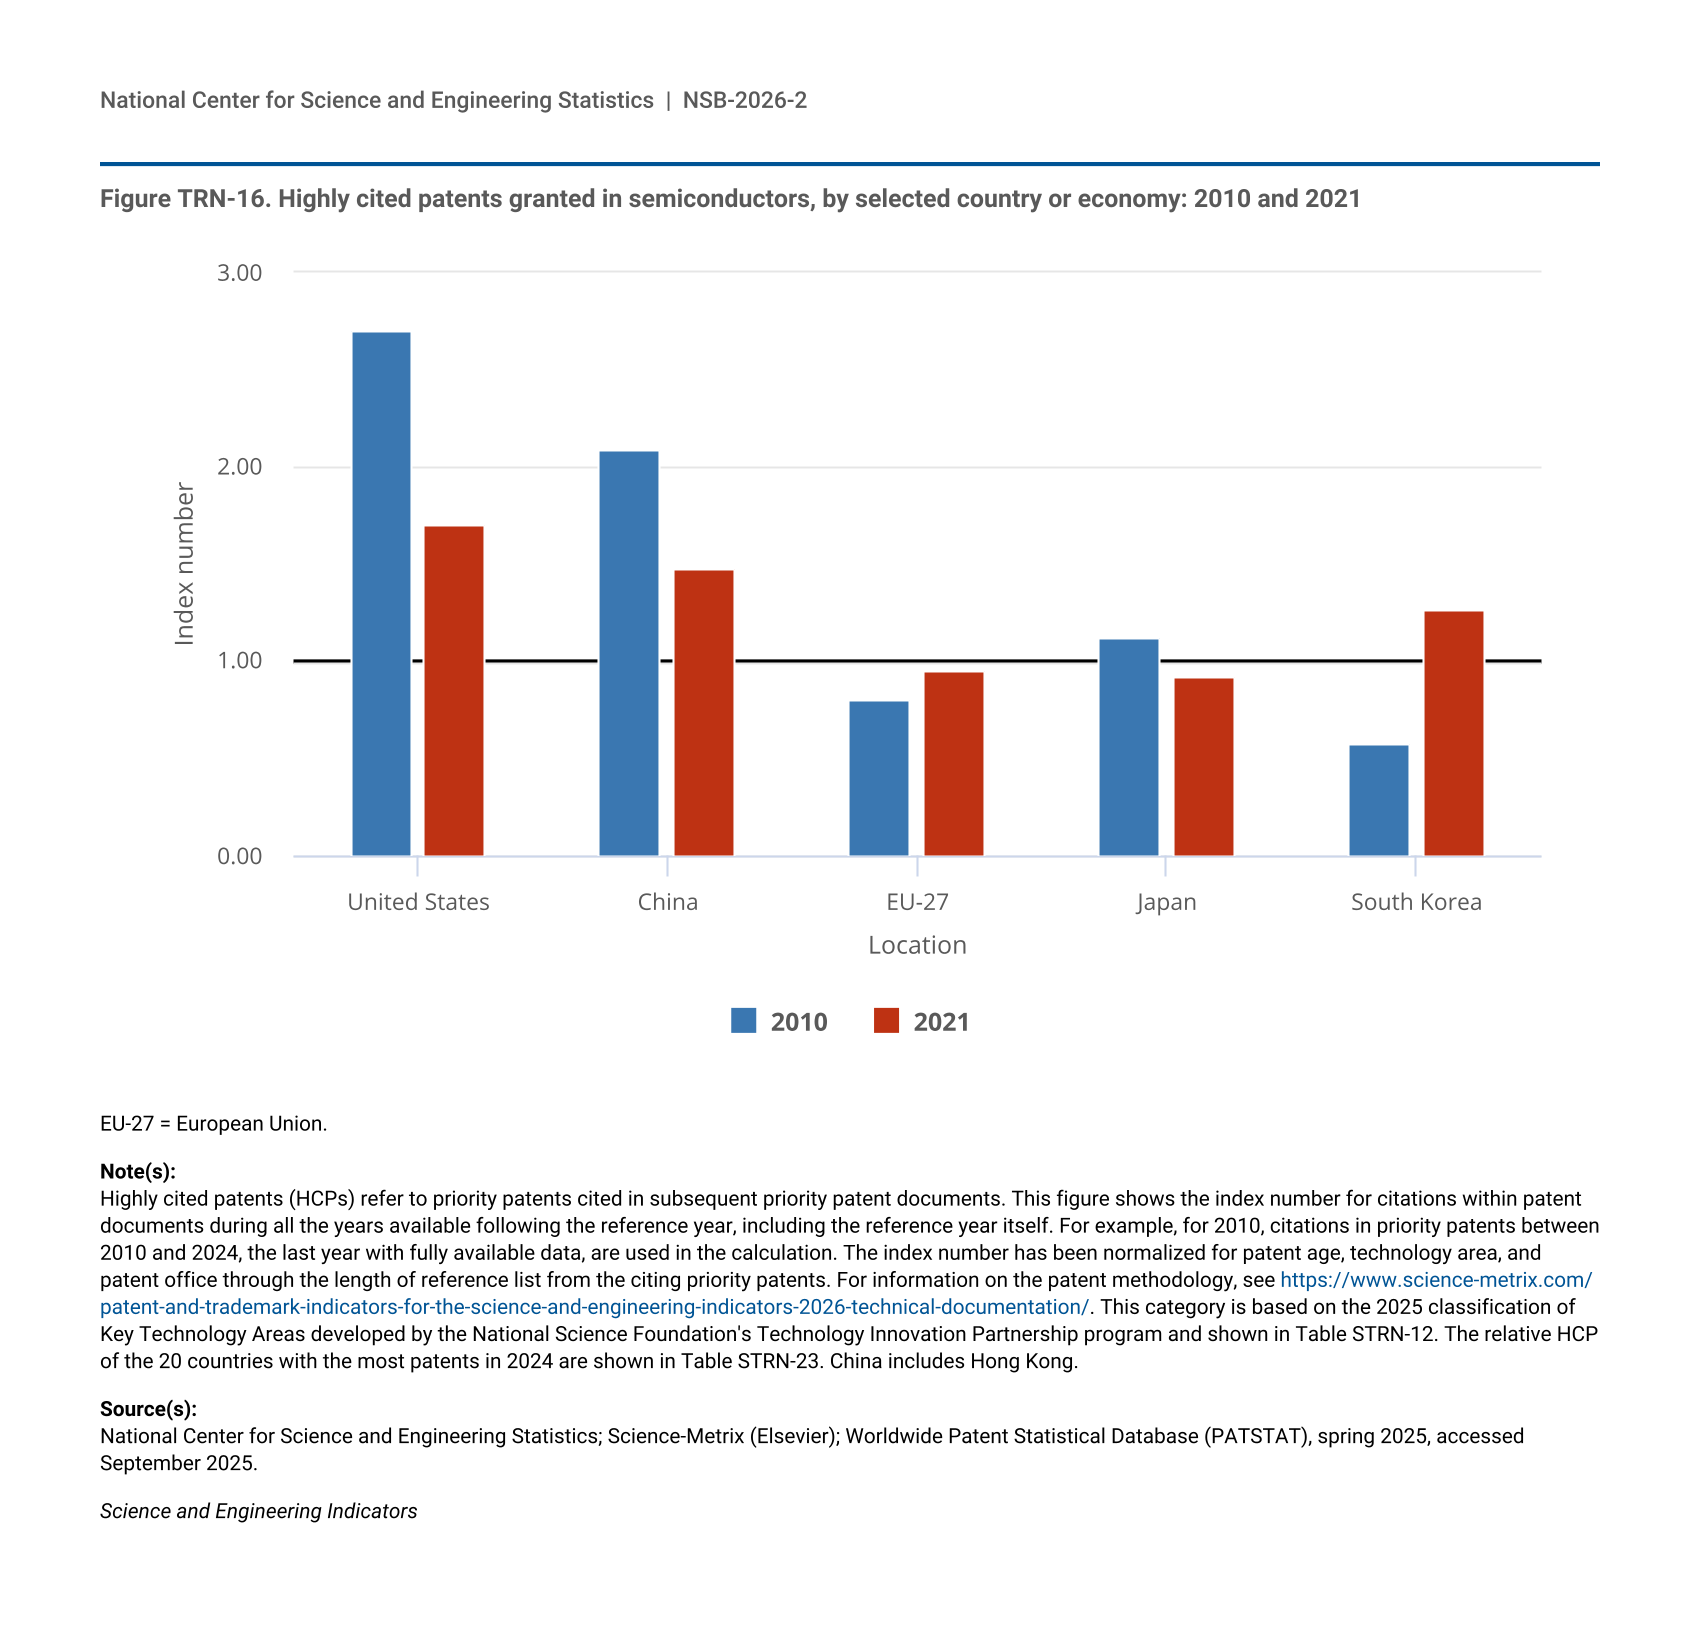
Figure TRN-16.
Highly cited patents granted in semiconductors, by selected country or economy: 2010 and 2021
Highly cited patents granted in semiconductors, by selected country or economy: 2010 and 2021
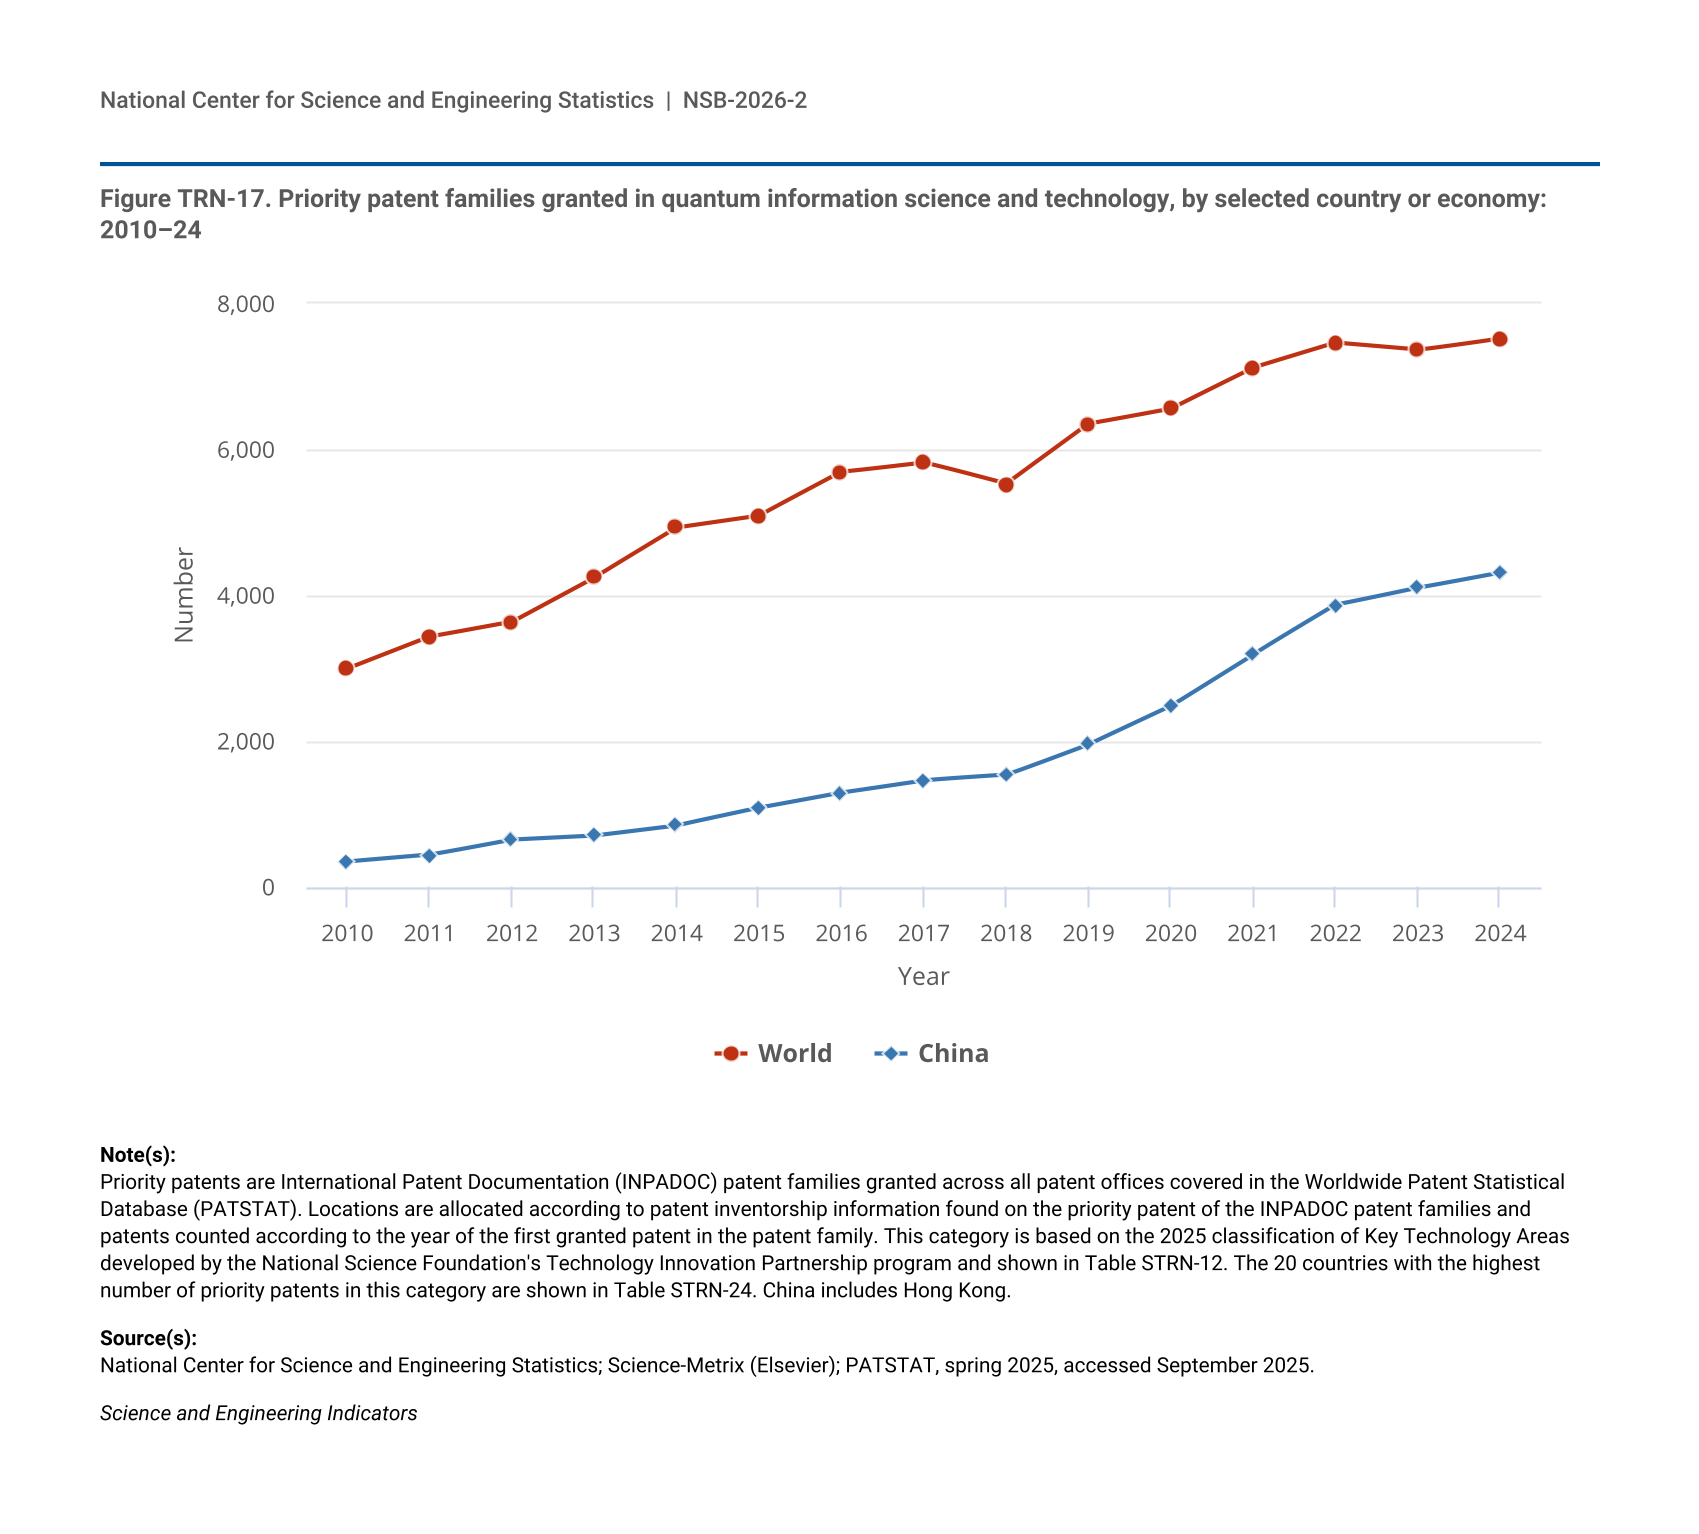
Figure TRN-17.
Priority patent families granted in quantum information science and technology, by selected country or economy: 2010–24
Priority patent families granted in quantum information science and technology, by selected country or economy: 2010–24
Figure TRN-18.
Utility patents granted in quantum information science and technology, by selected country or economy: 2024
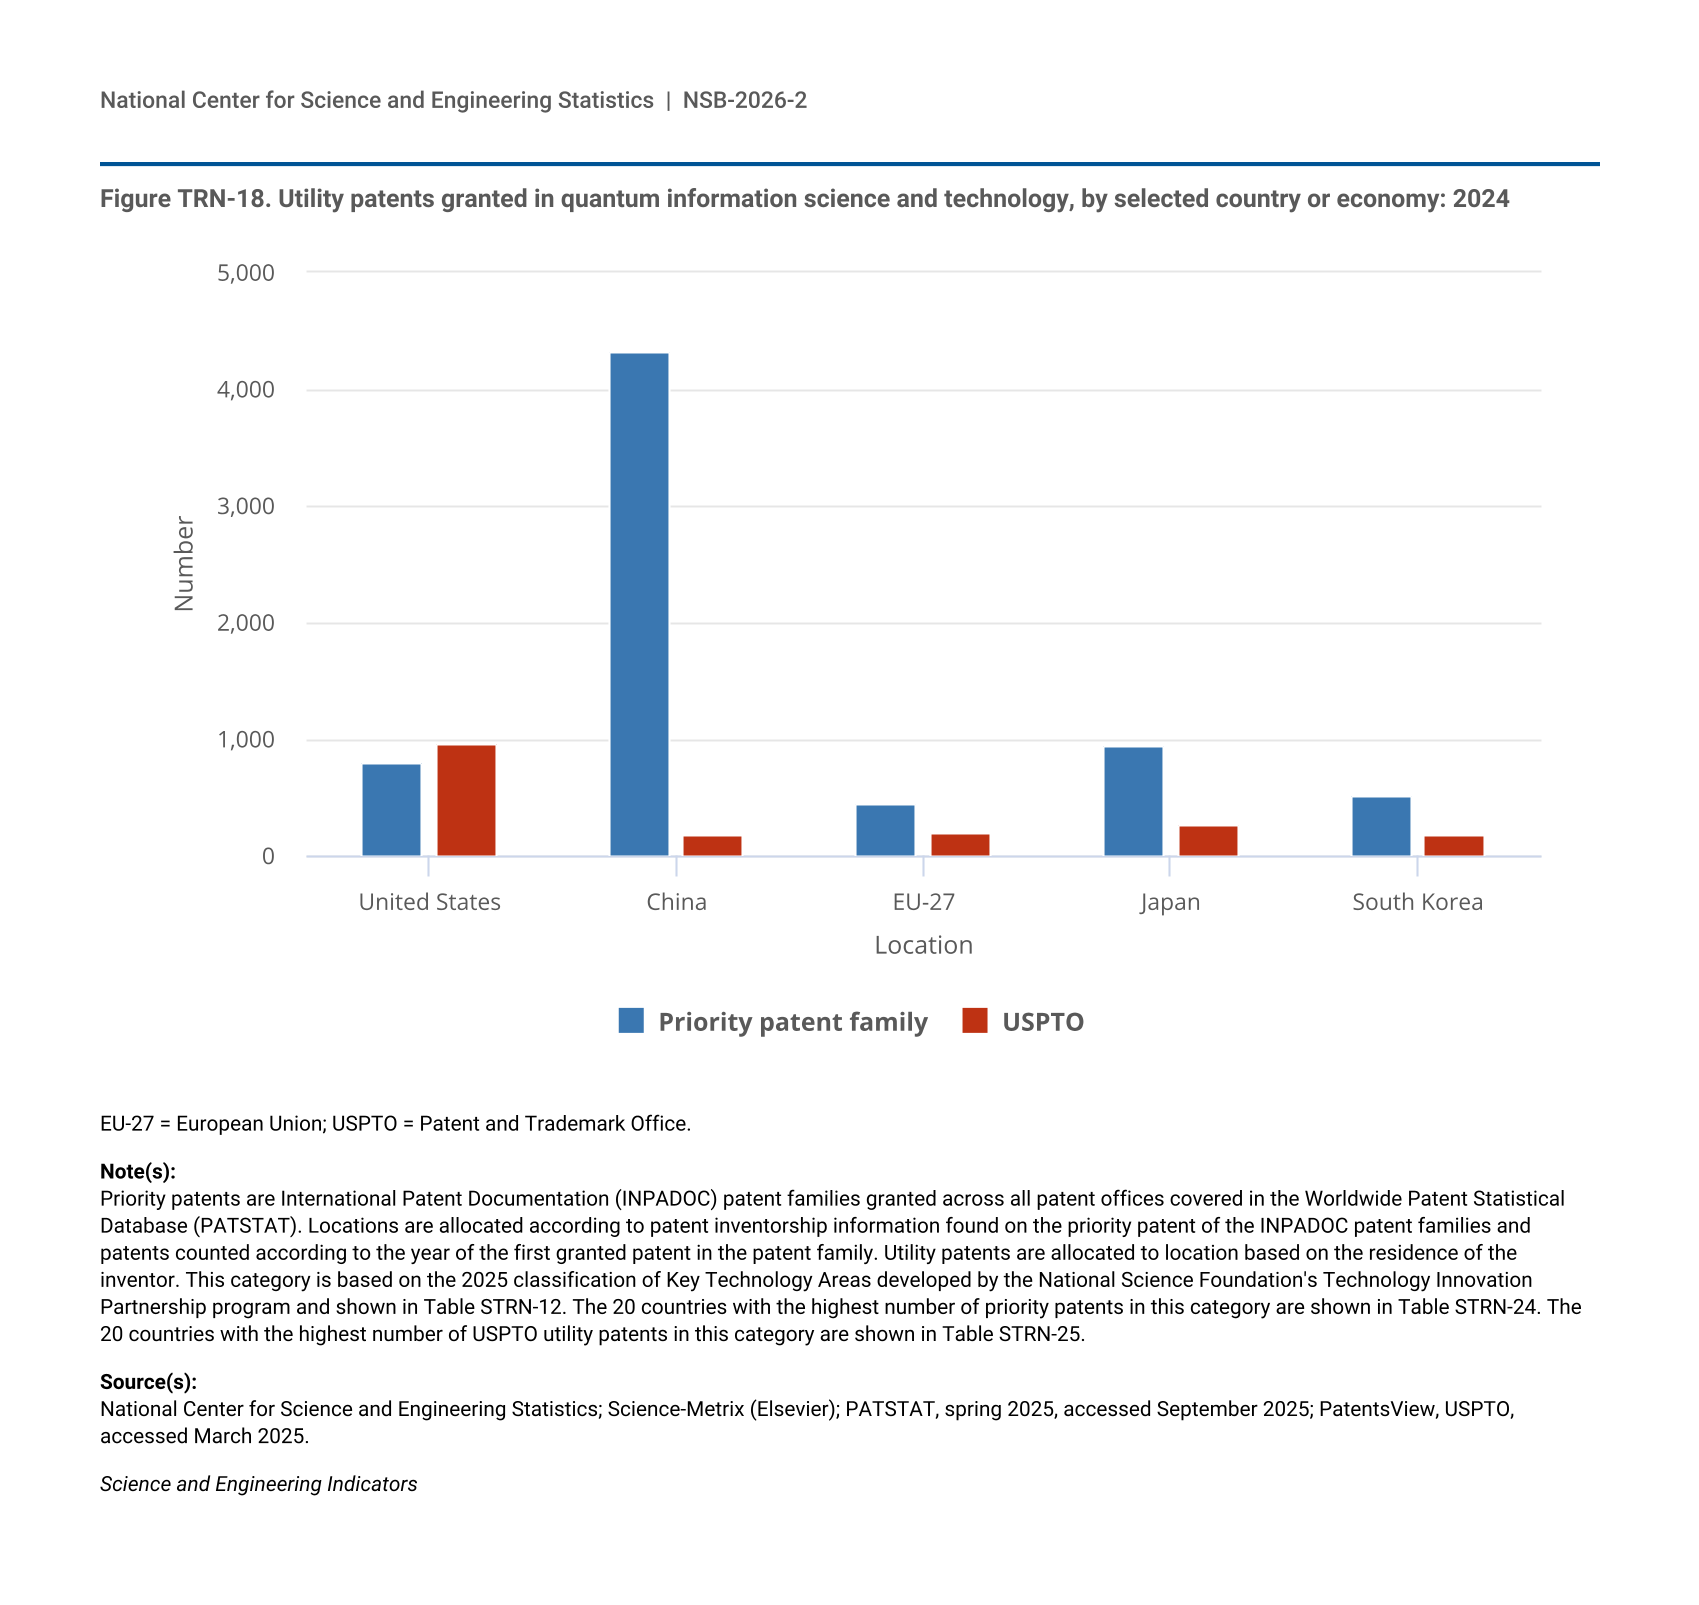
Utility patents granted in quantum information science and technology, by selected country or economy: 2024
Figure TRN-19.
Highly cited patents granted in quantum information science and technology, by selected country or economy: 2010 and 2021
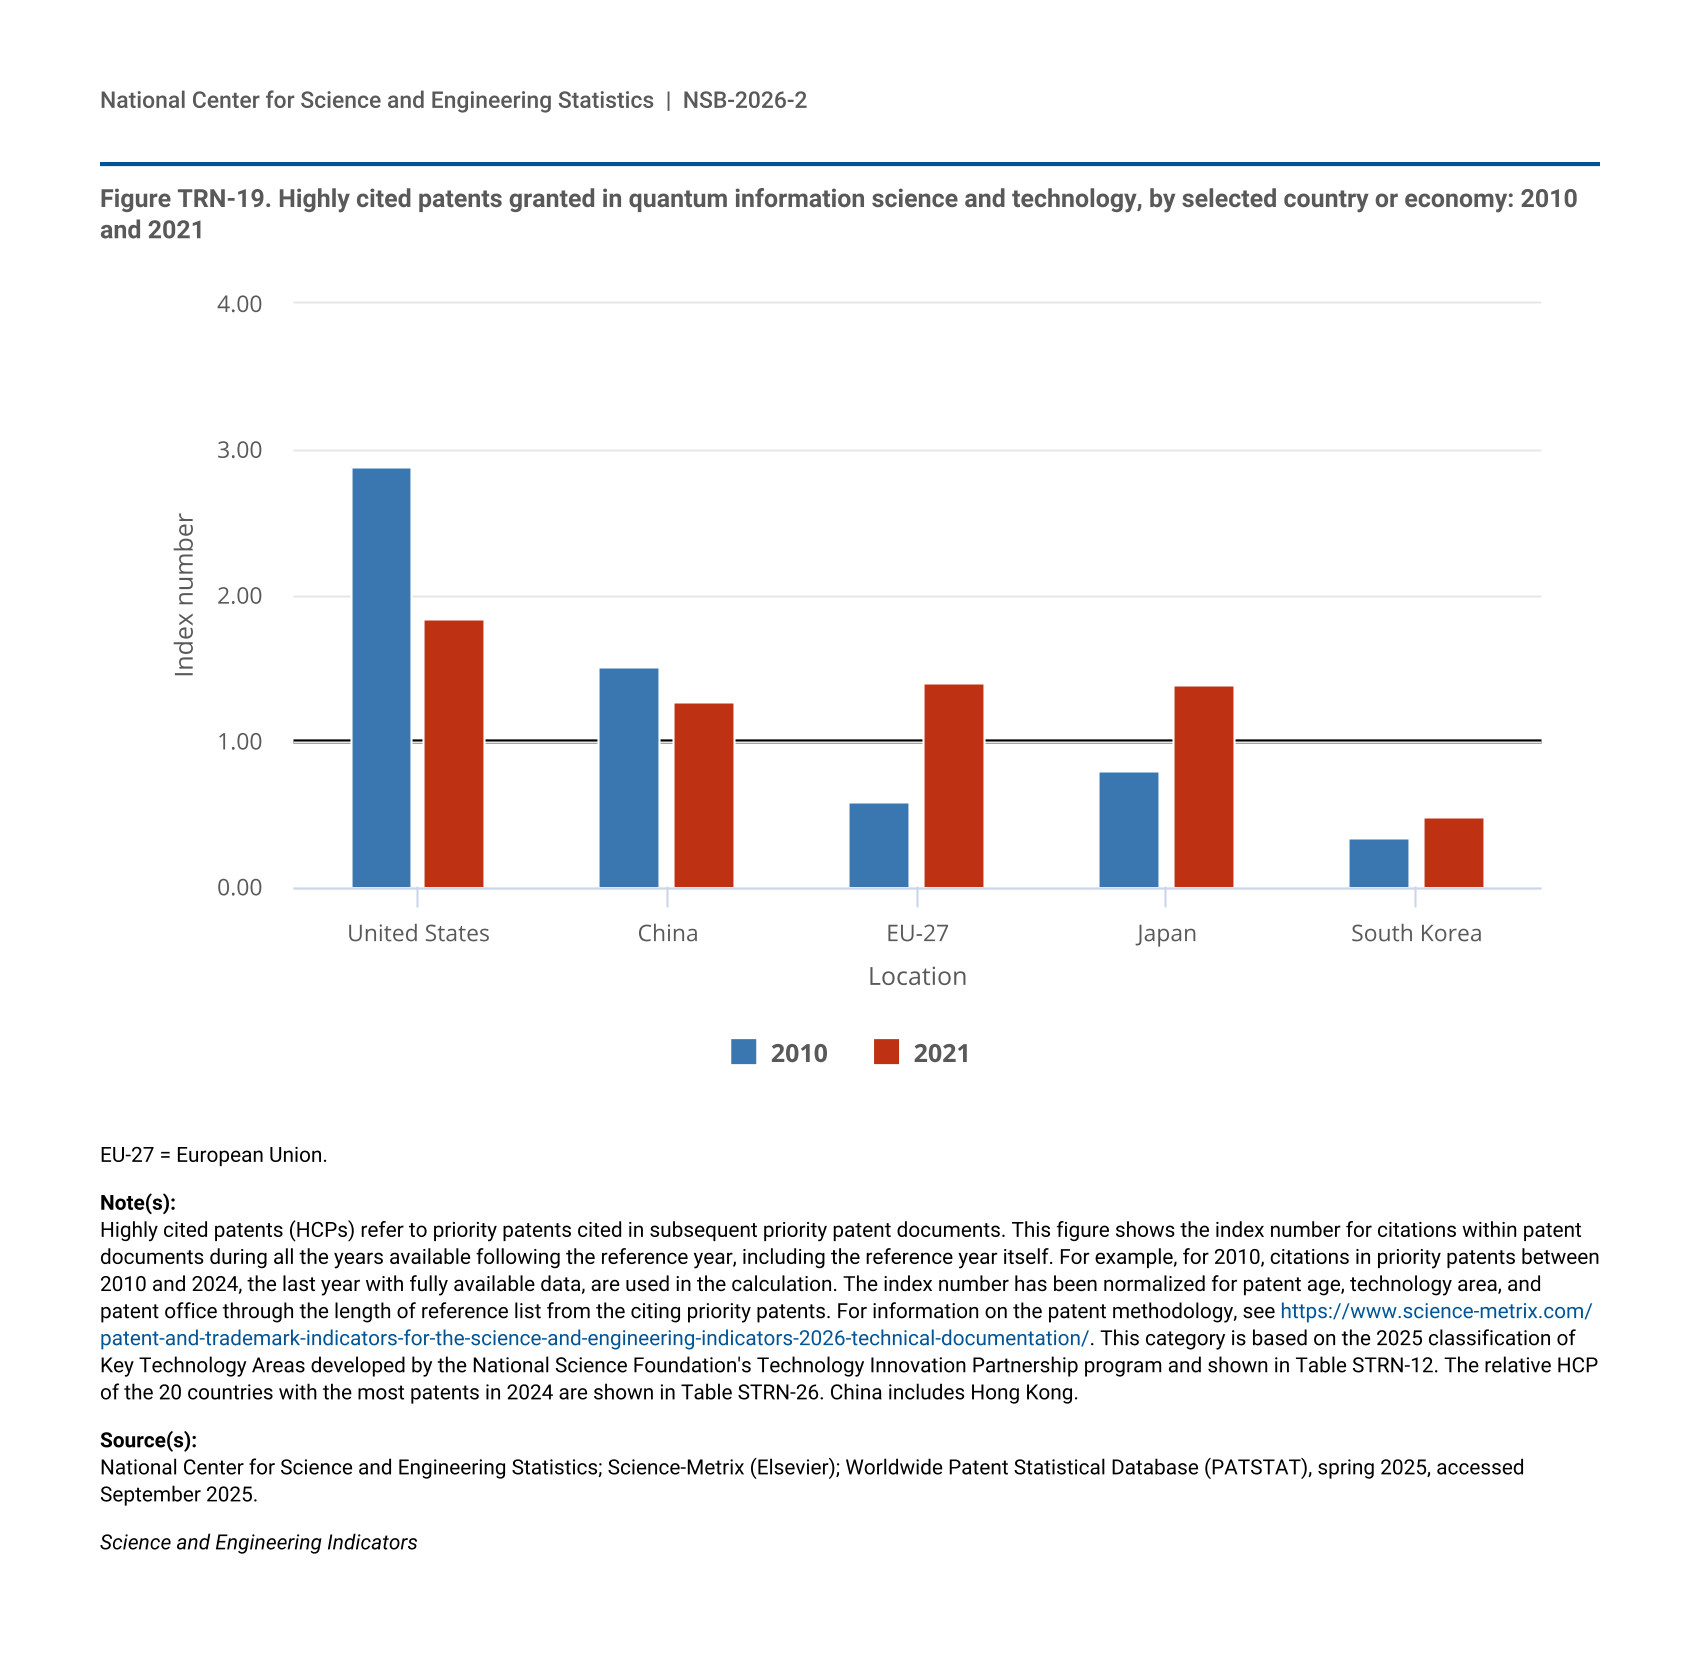
Highly cited patents granted in quantum information science and technology, by selected country or economy: 2010 and 2021
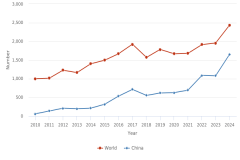
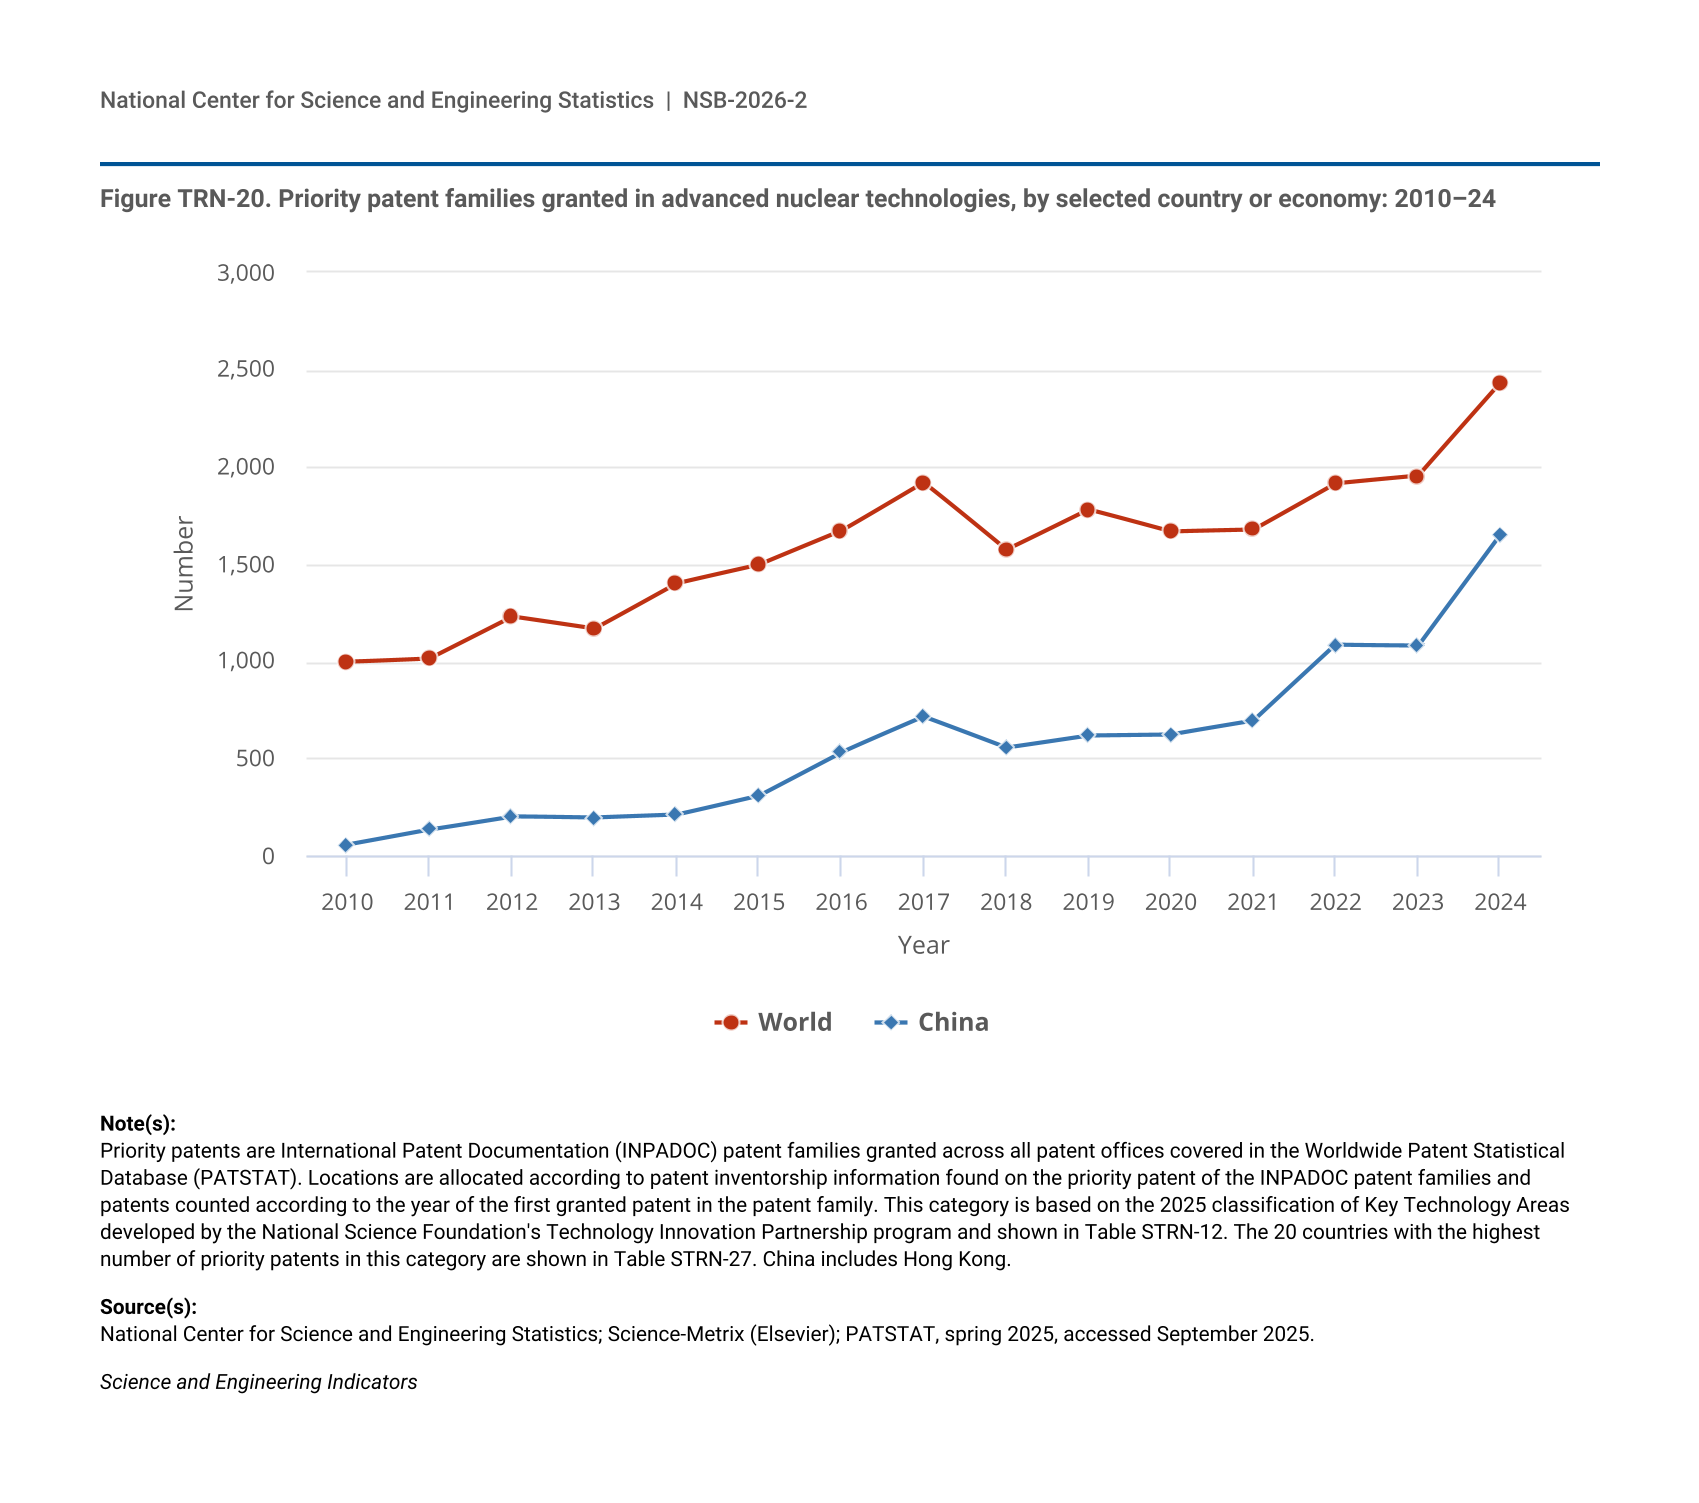
Figure TRN-20.
Priority patent families granted in advanced nuclear technologies, by selected country or economy: 2010–24
Priority patent families granted in advanced nuclear technologies, by selected country or economy: 2010–24
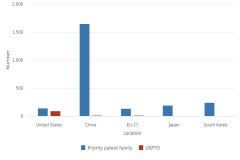
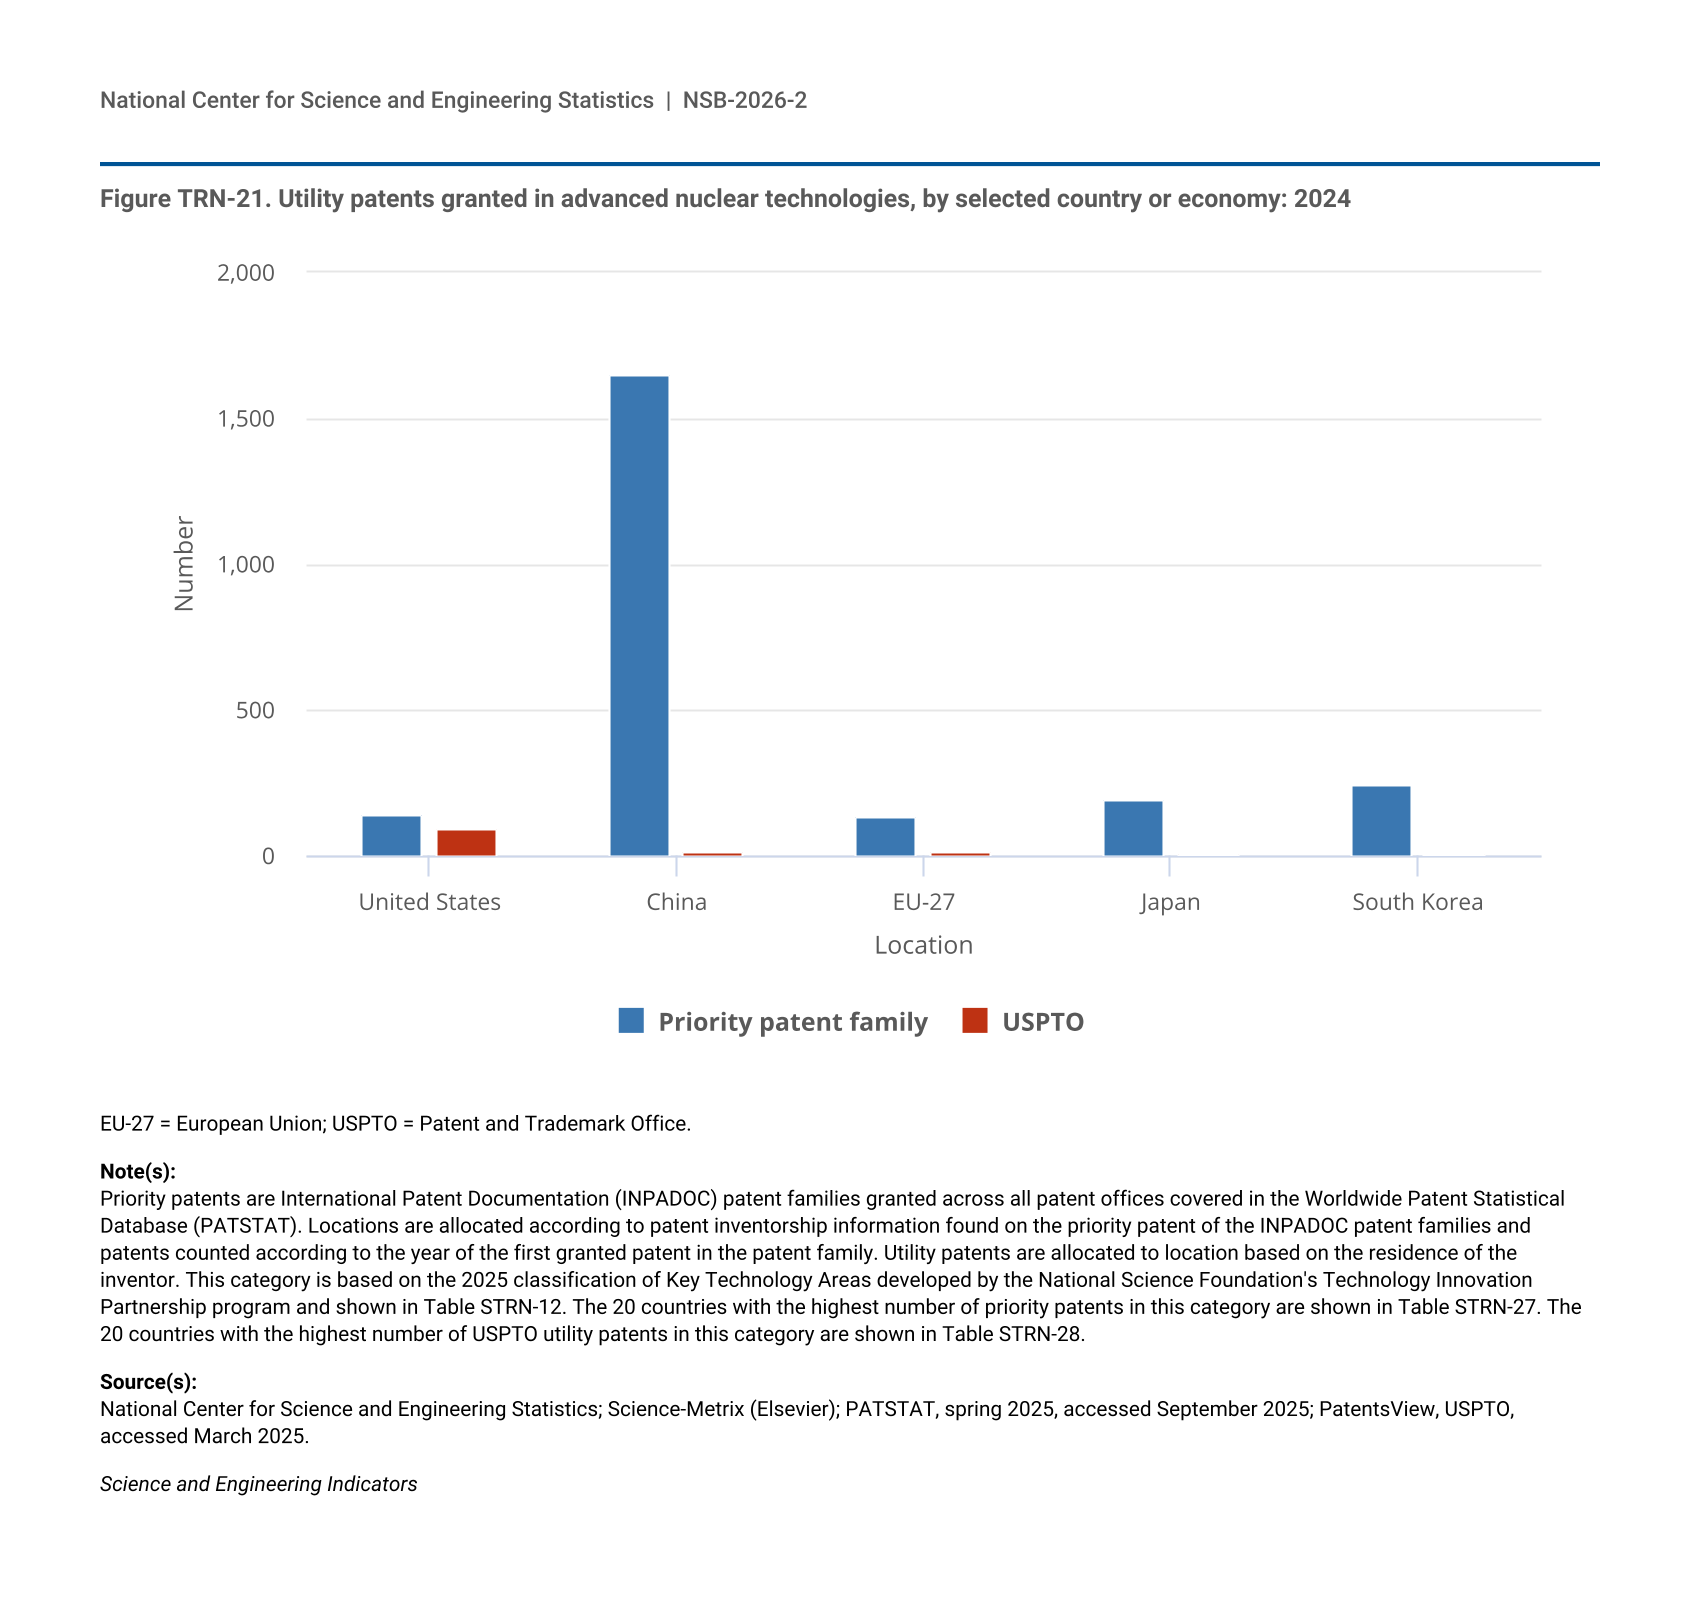
Figure TRN-21.
Utility patents granted in advanced nuclear technologies, by selected country or economy: 2024
Utility patents granted in advanced nuclear technologies, by selected country or economy: 2024
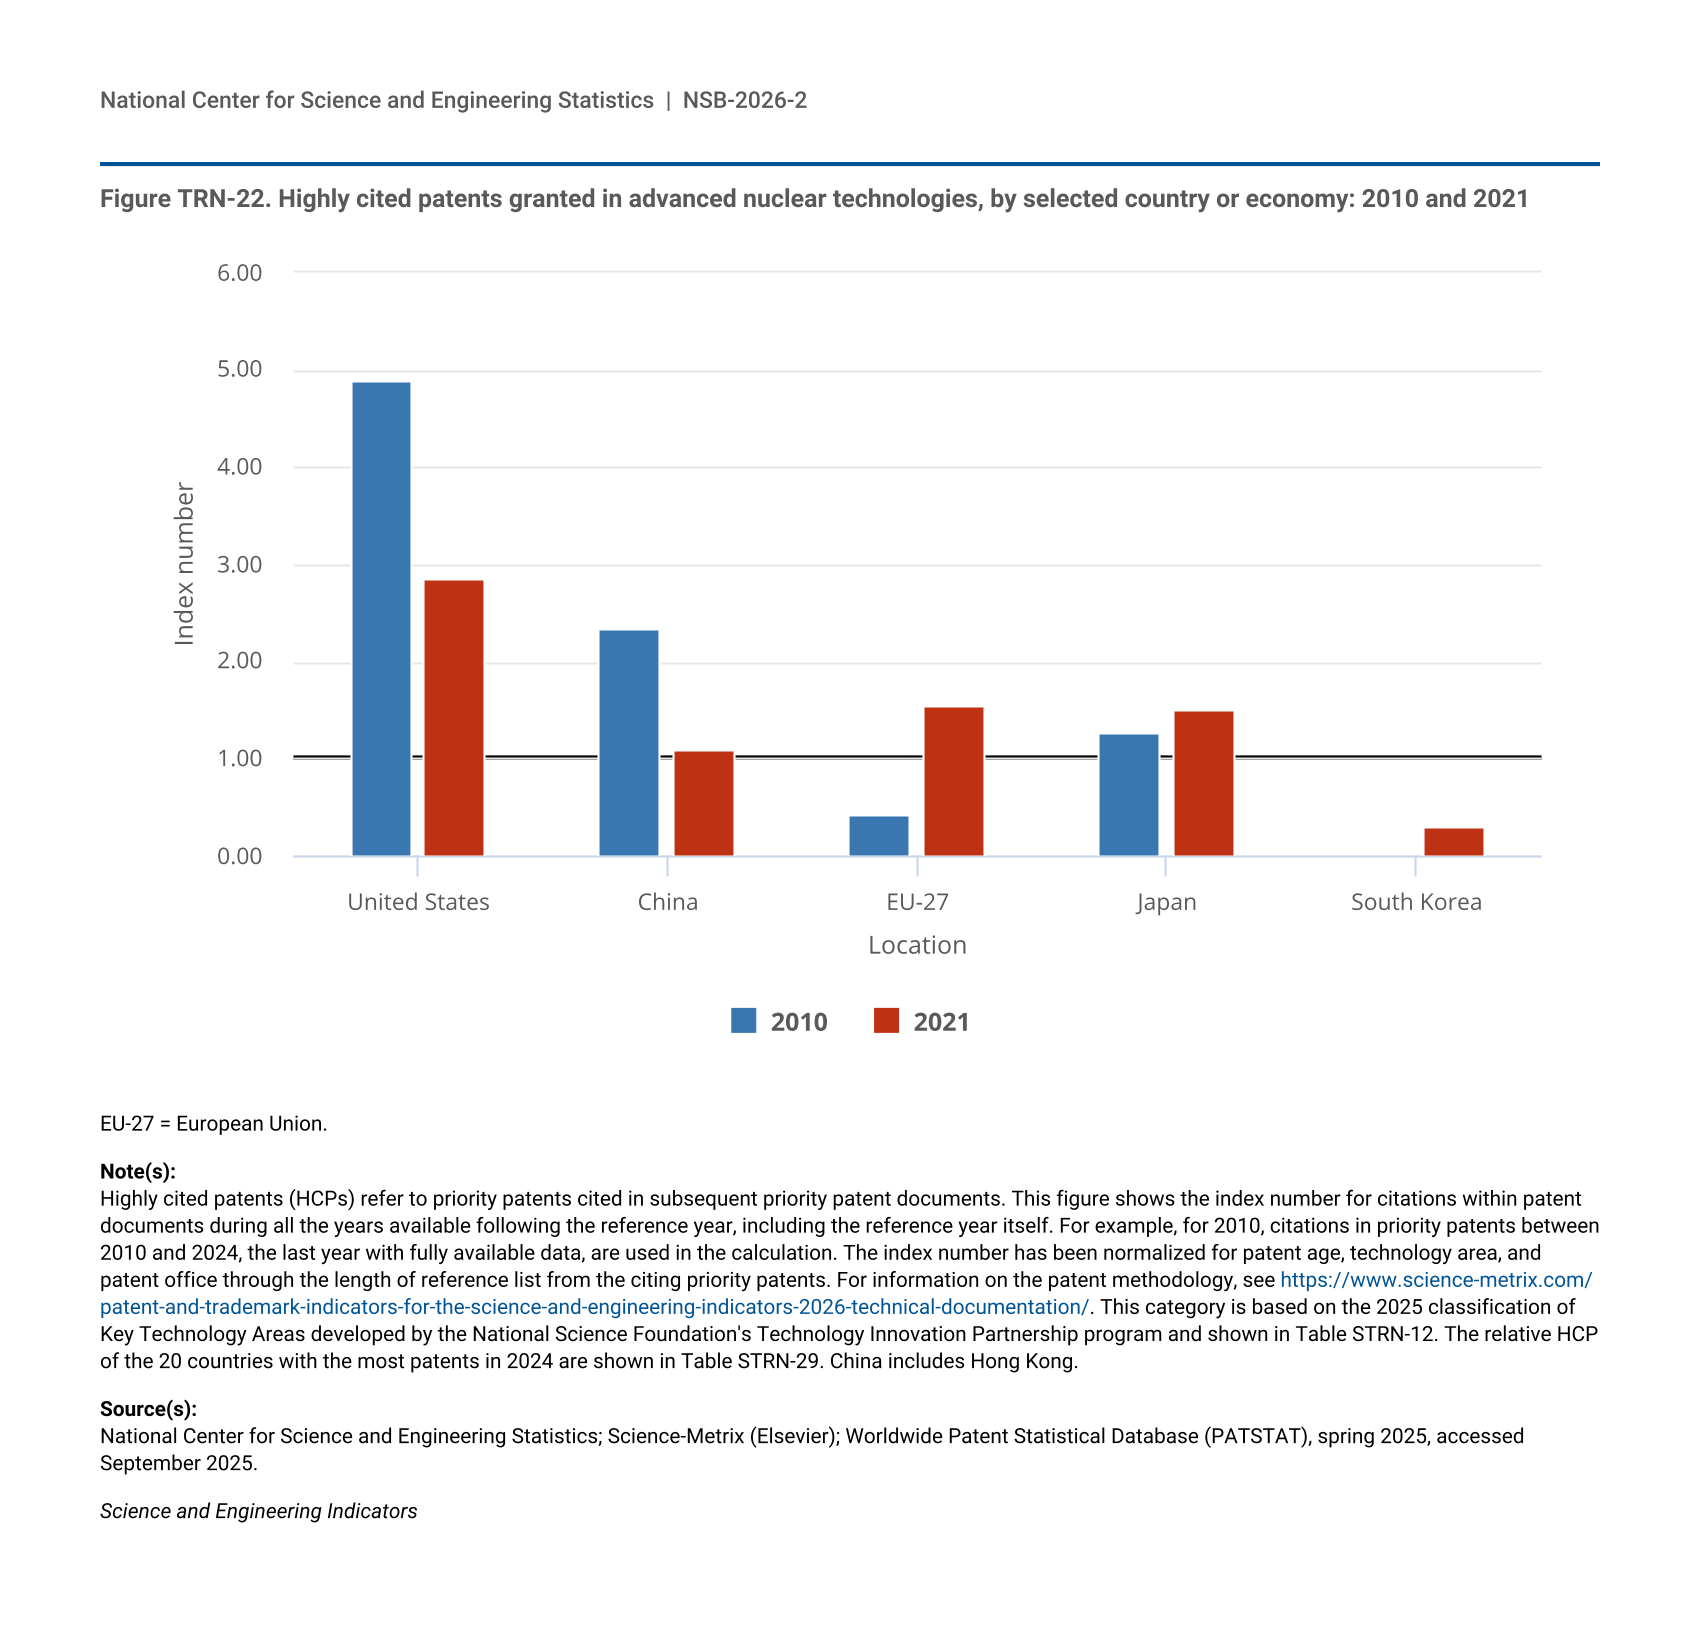
Figure TRN-22.
Highly cited patents granted in advanced nuclear technologies, by selected country or economy: 2010 and 2021
Highly cited patents granted in advanced nuclear technologies, by selected country or economy: 2010 and 2021
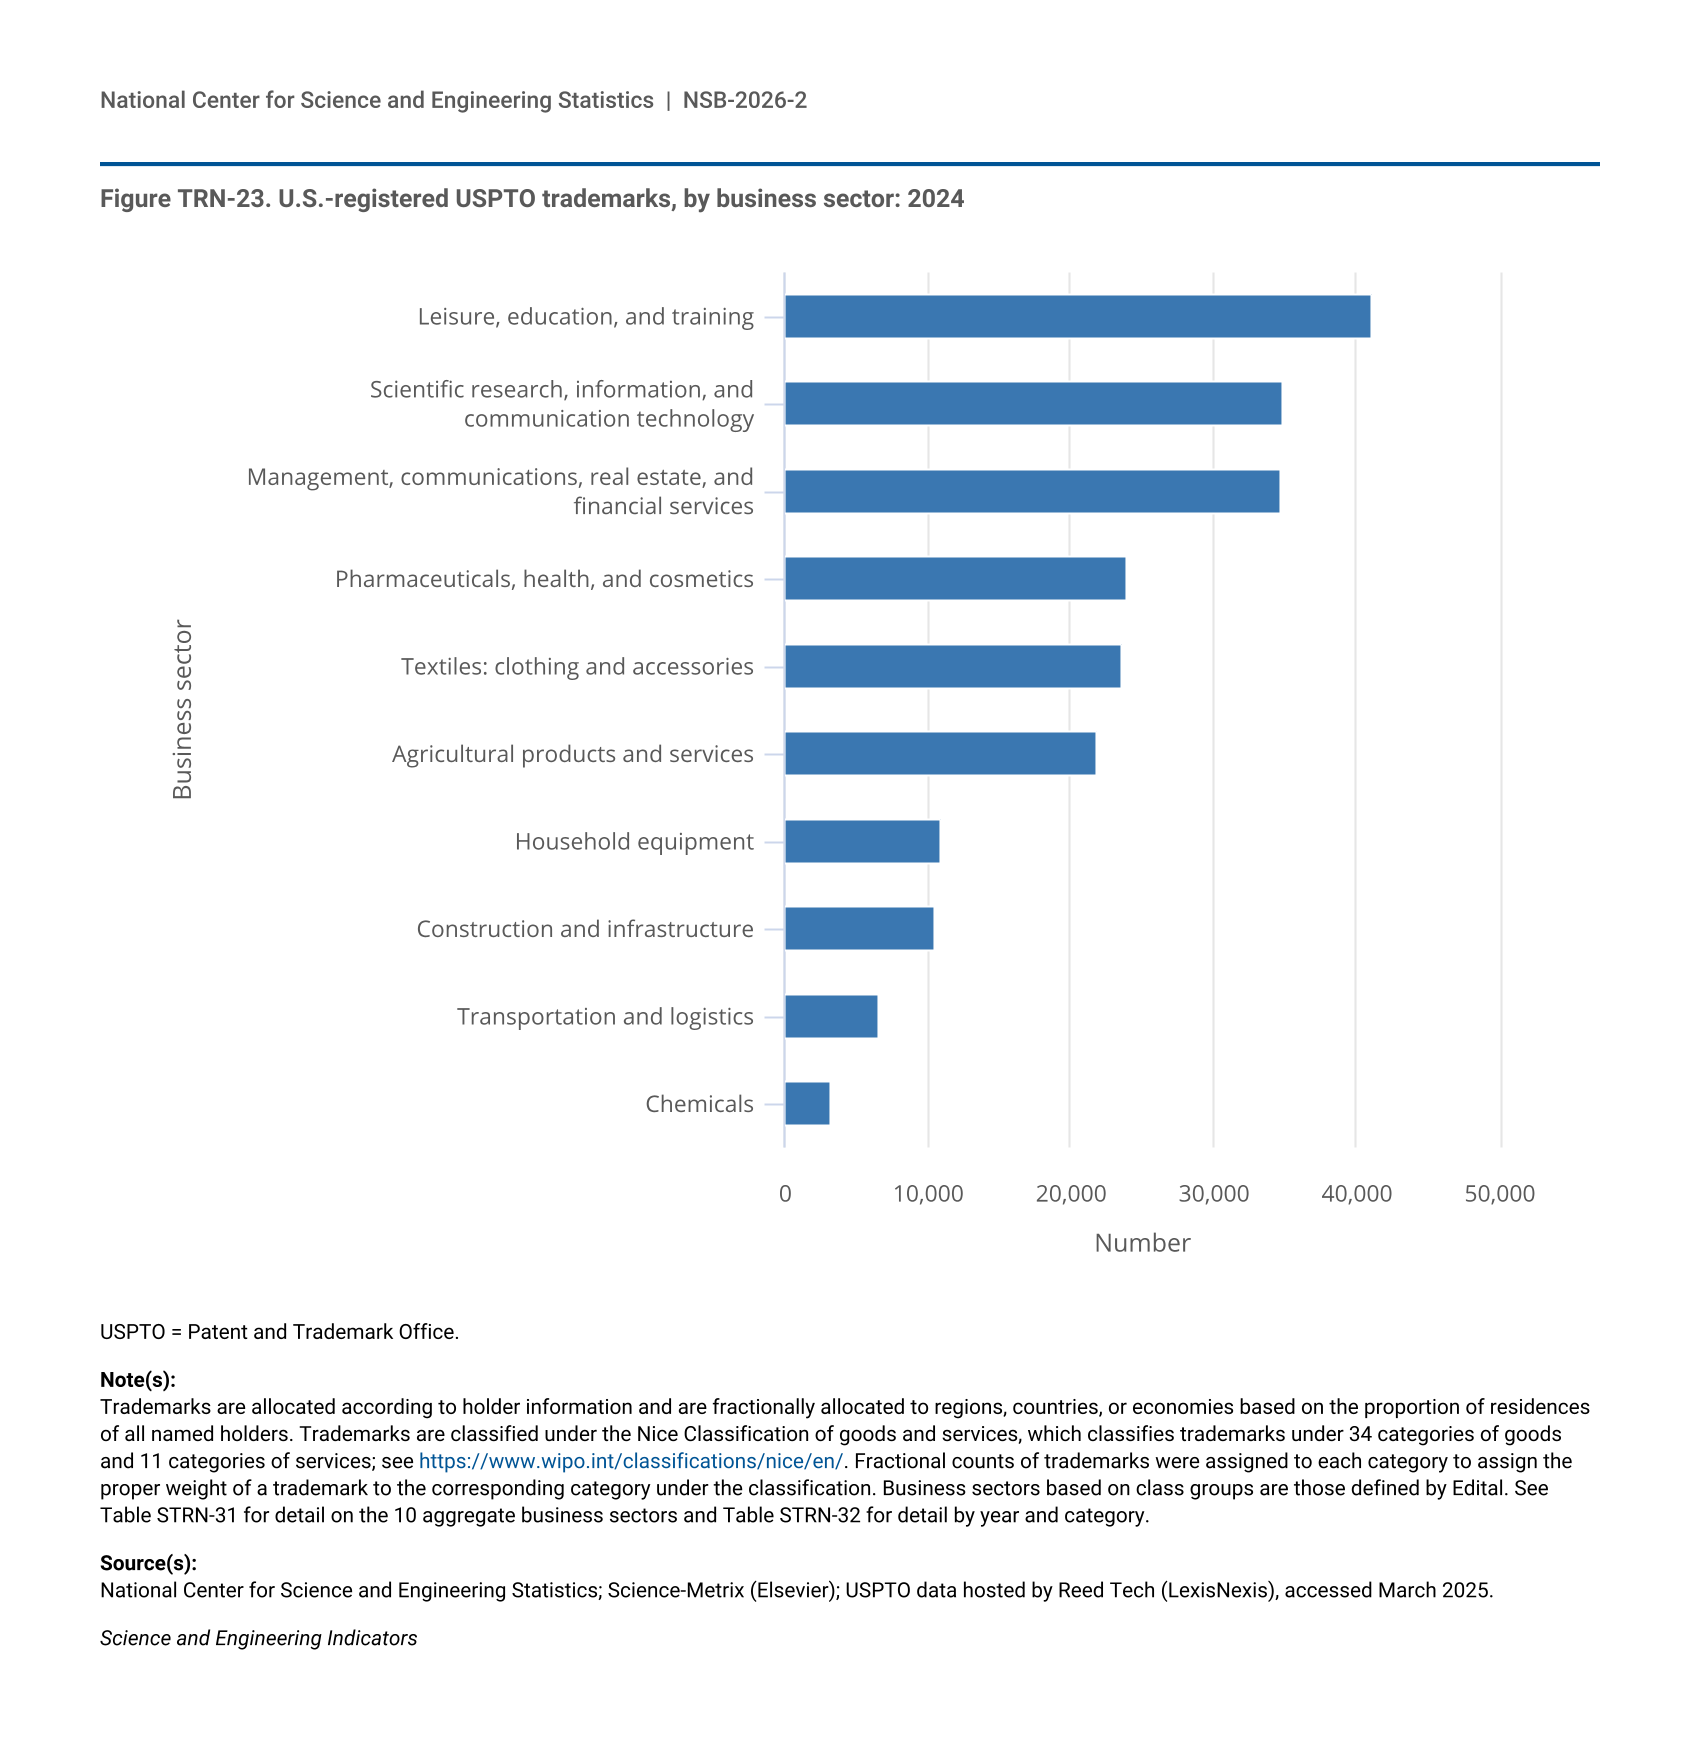
Figure TRN-23.
U.S.-registered USPTO trademarks, by business sector: 2024
U.S.-registered USPTO trademarks, by business sector: 2024
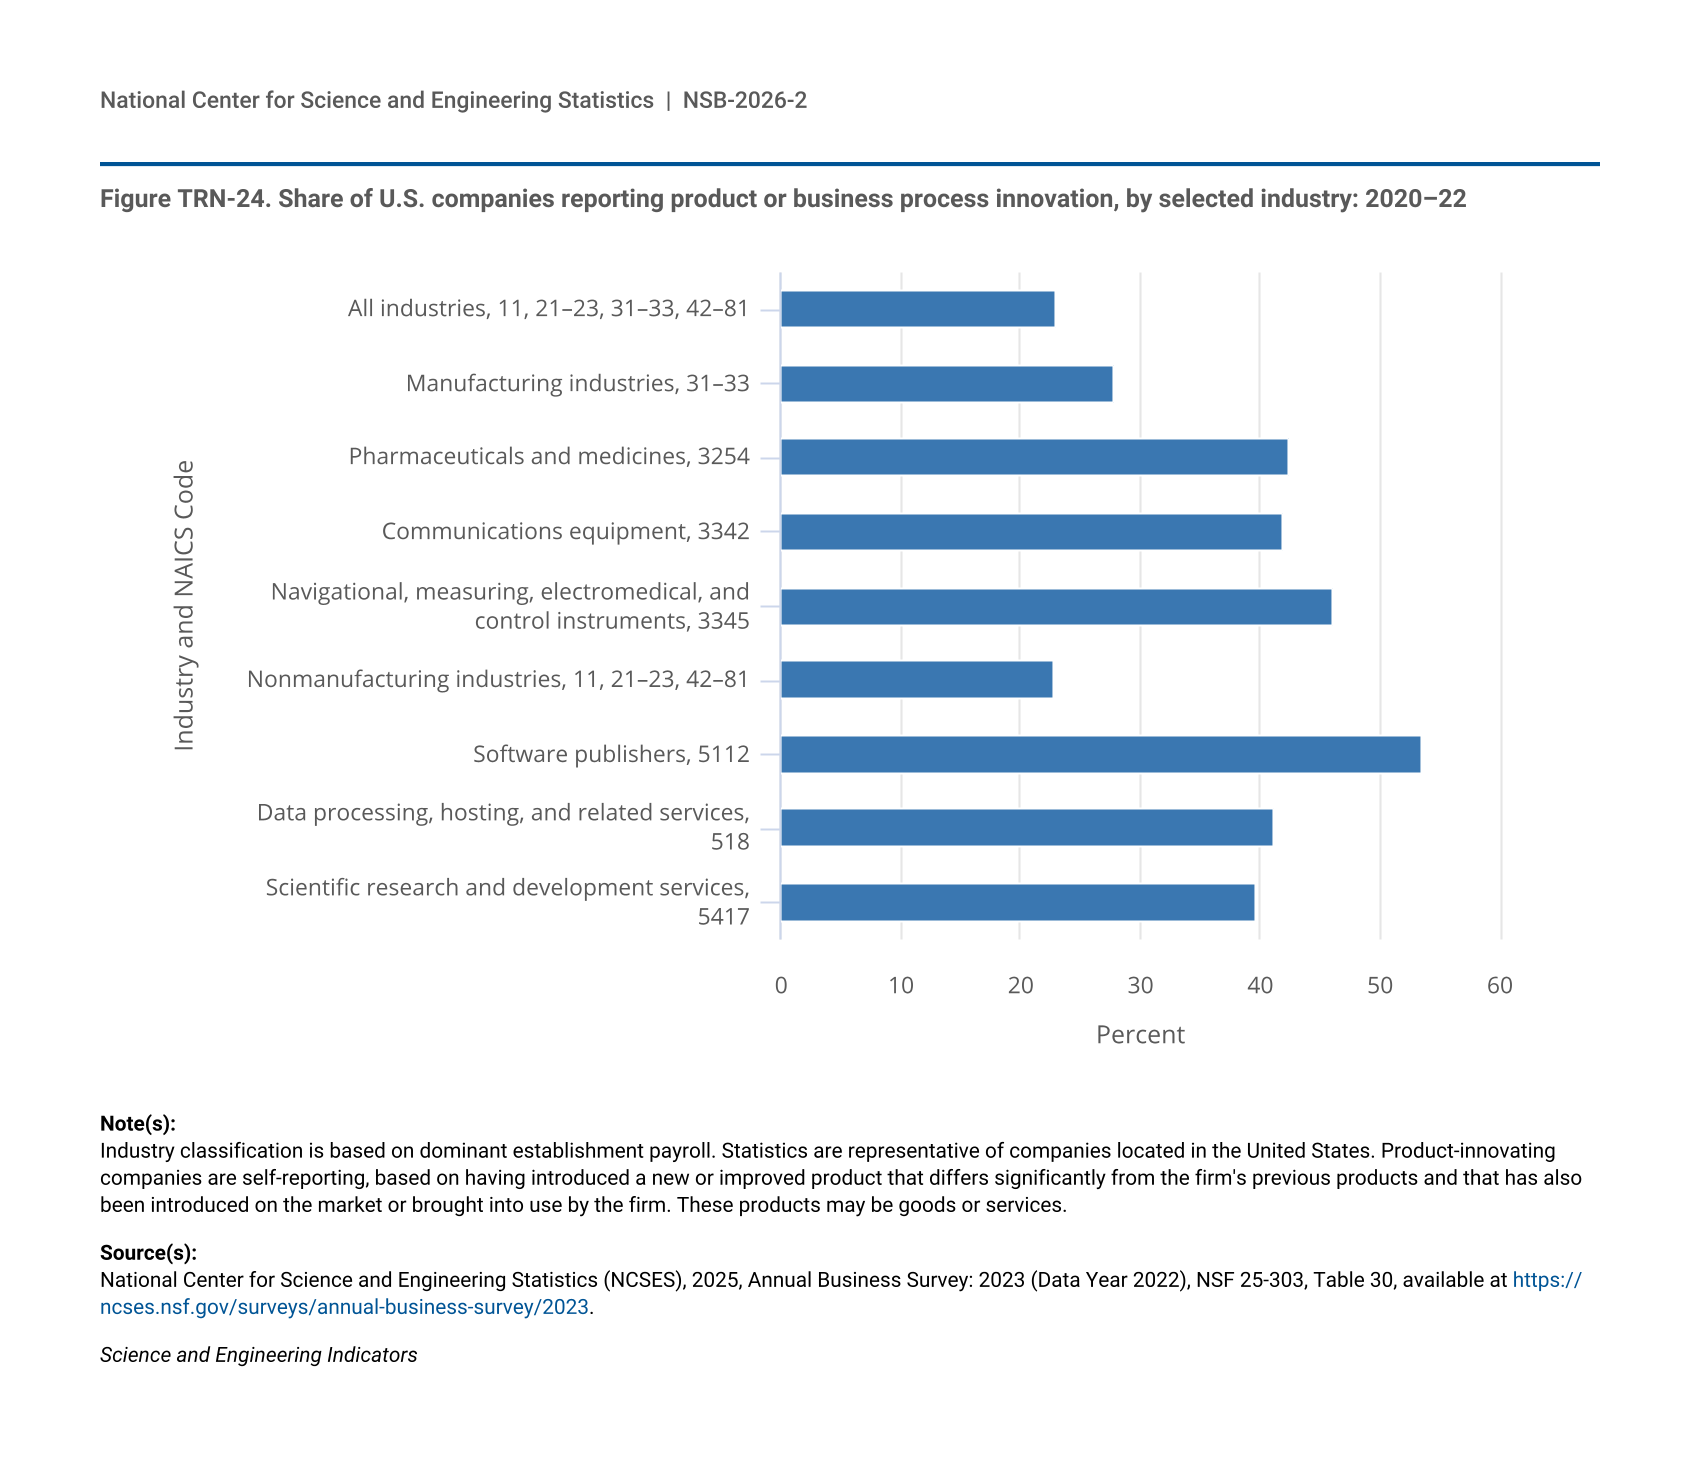
Figure TRN-24.
Share of U.S. companies reporting product or business process innovation, by selected industry: 2020–22
Share of U.S. companies reporting product or business process innovation, by selected industry: 2020–22
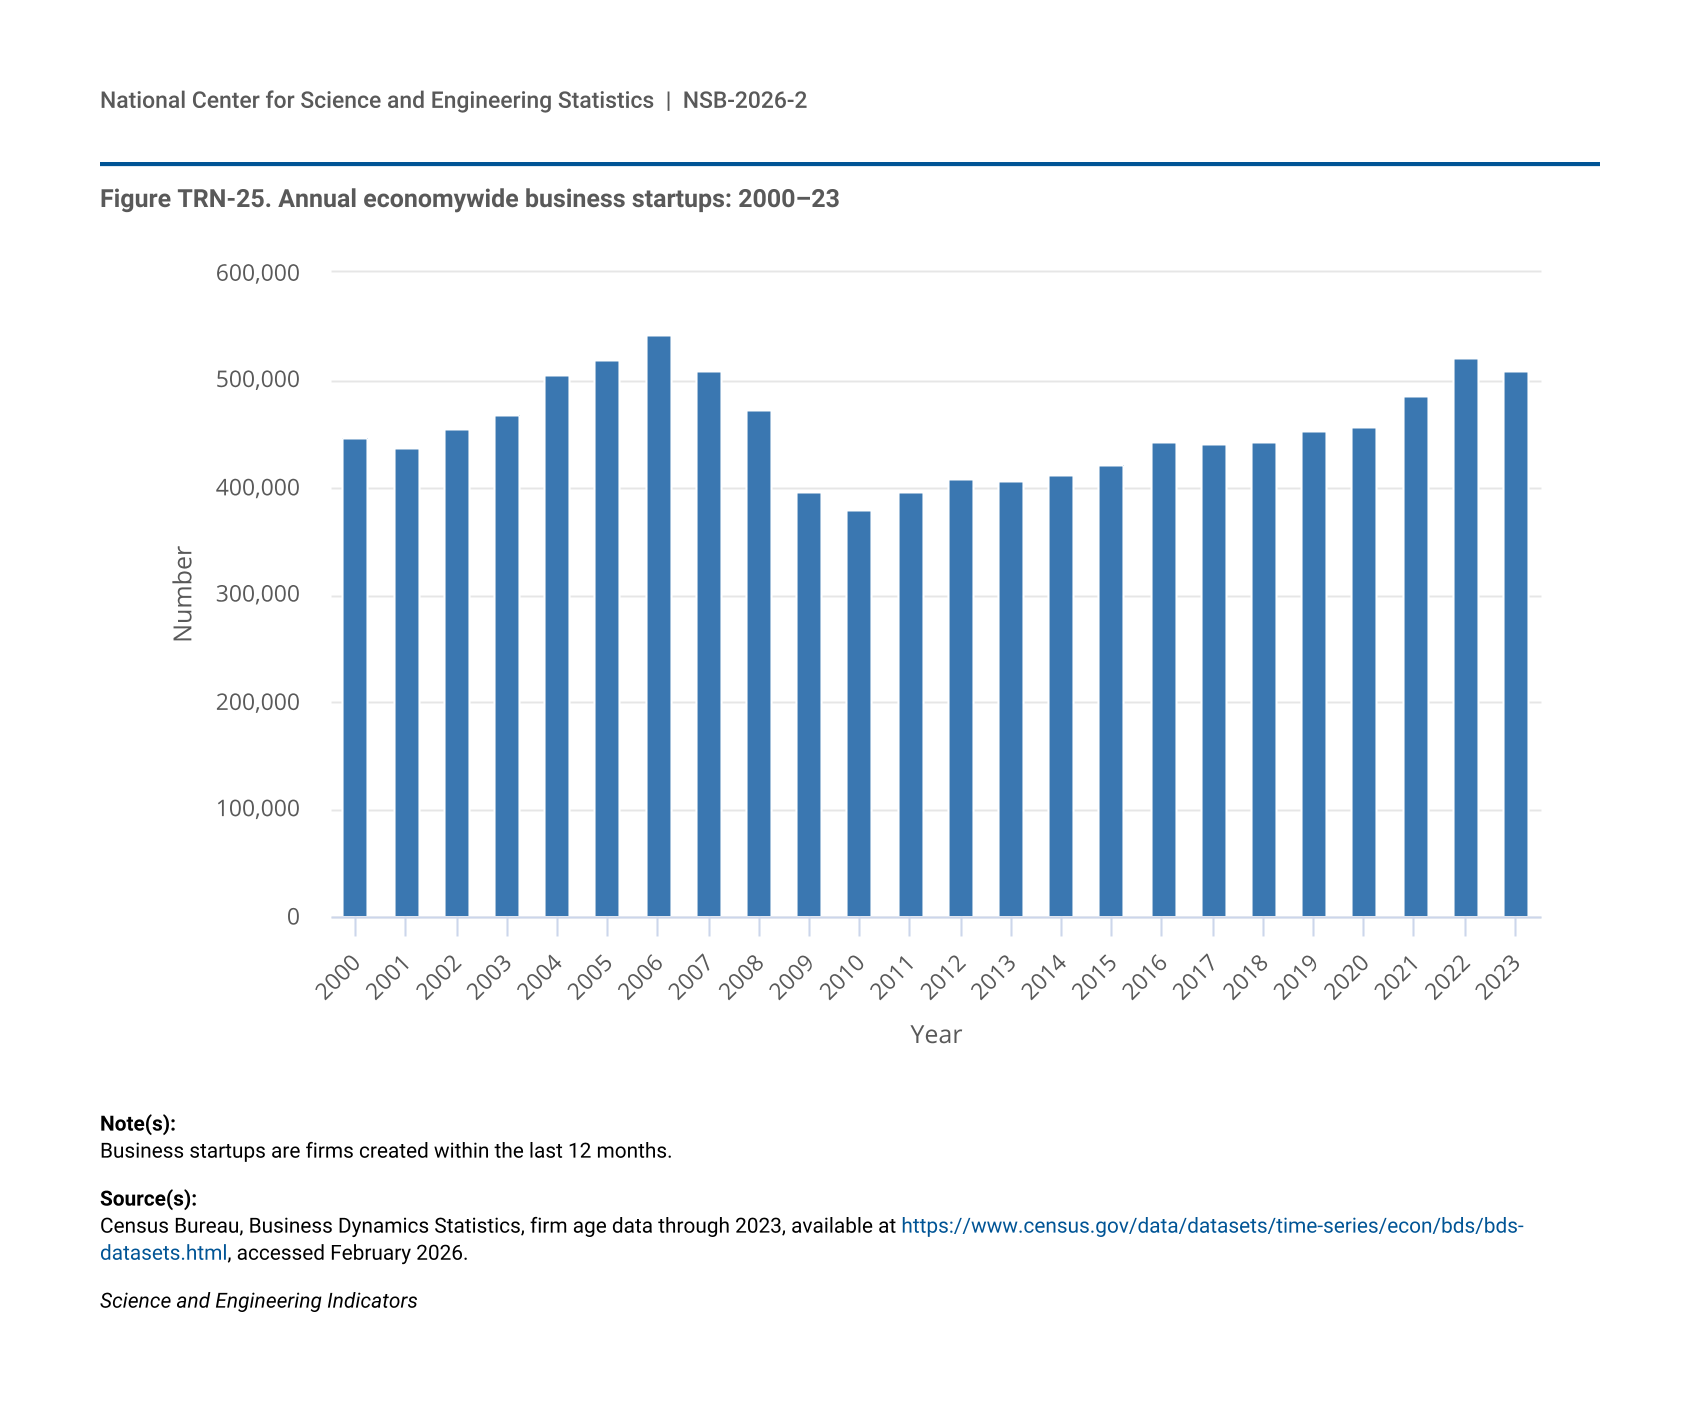
Figure TRN-25.
Annual economywide business startups: 2000–23
Annual economywide business startups: 2000–23
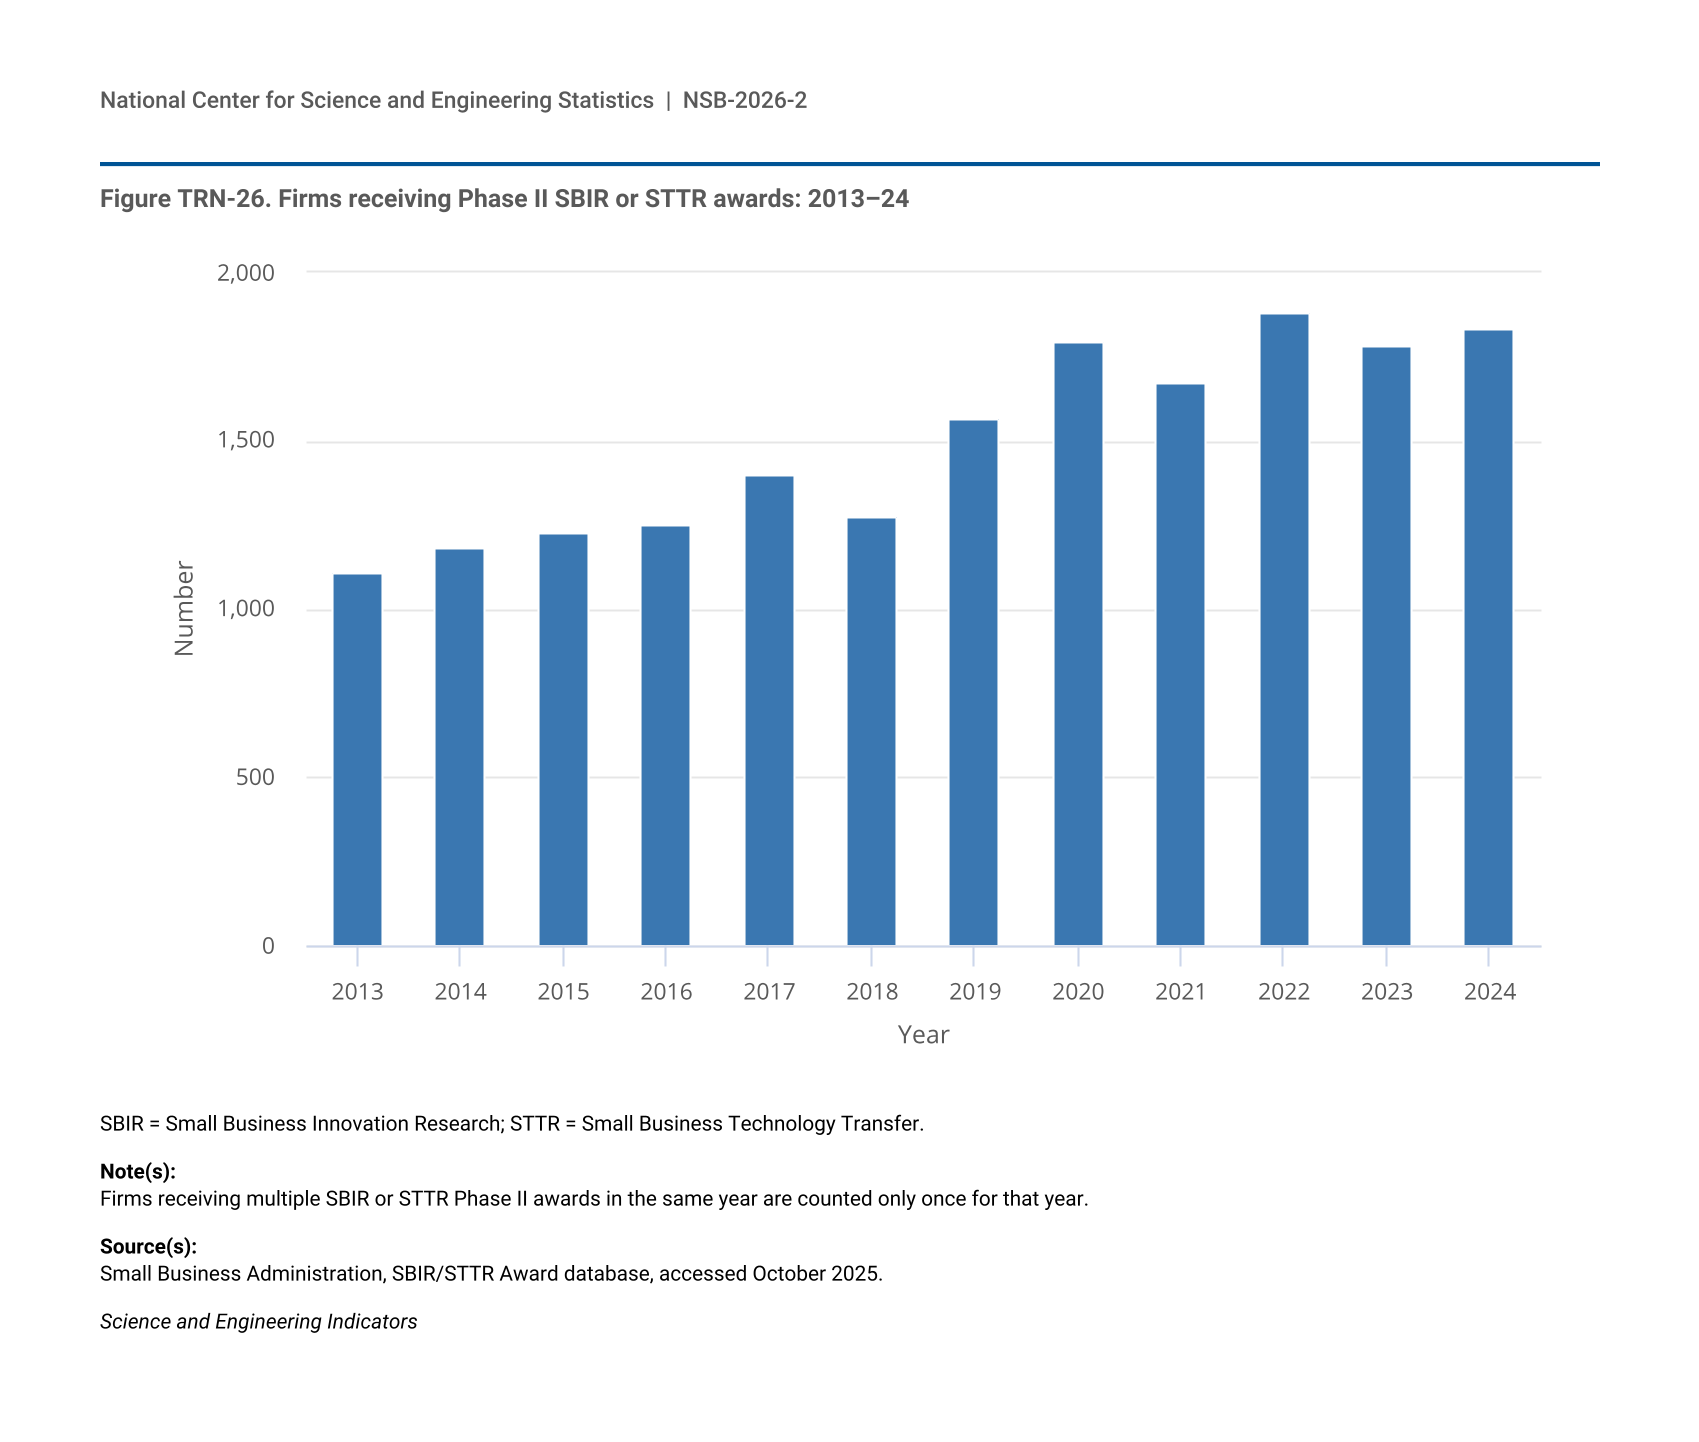
Figure TRN-26.
Firms receiving Phase II SBIR or STTR awards: 2013–24
Firms receiving Phase II SBIR or STTR awards: 2013–24
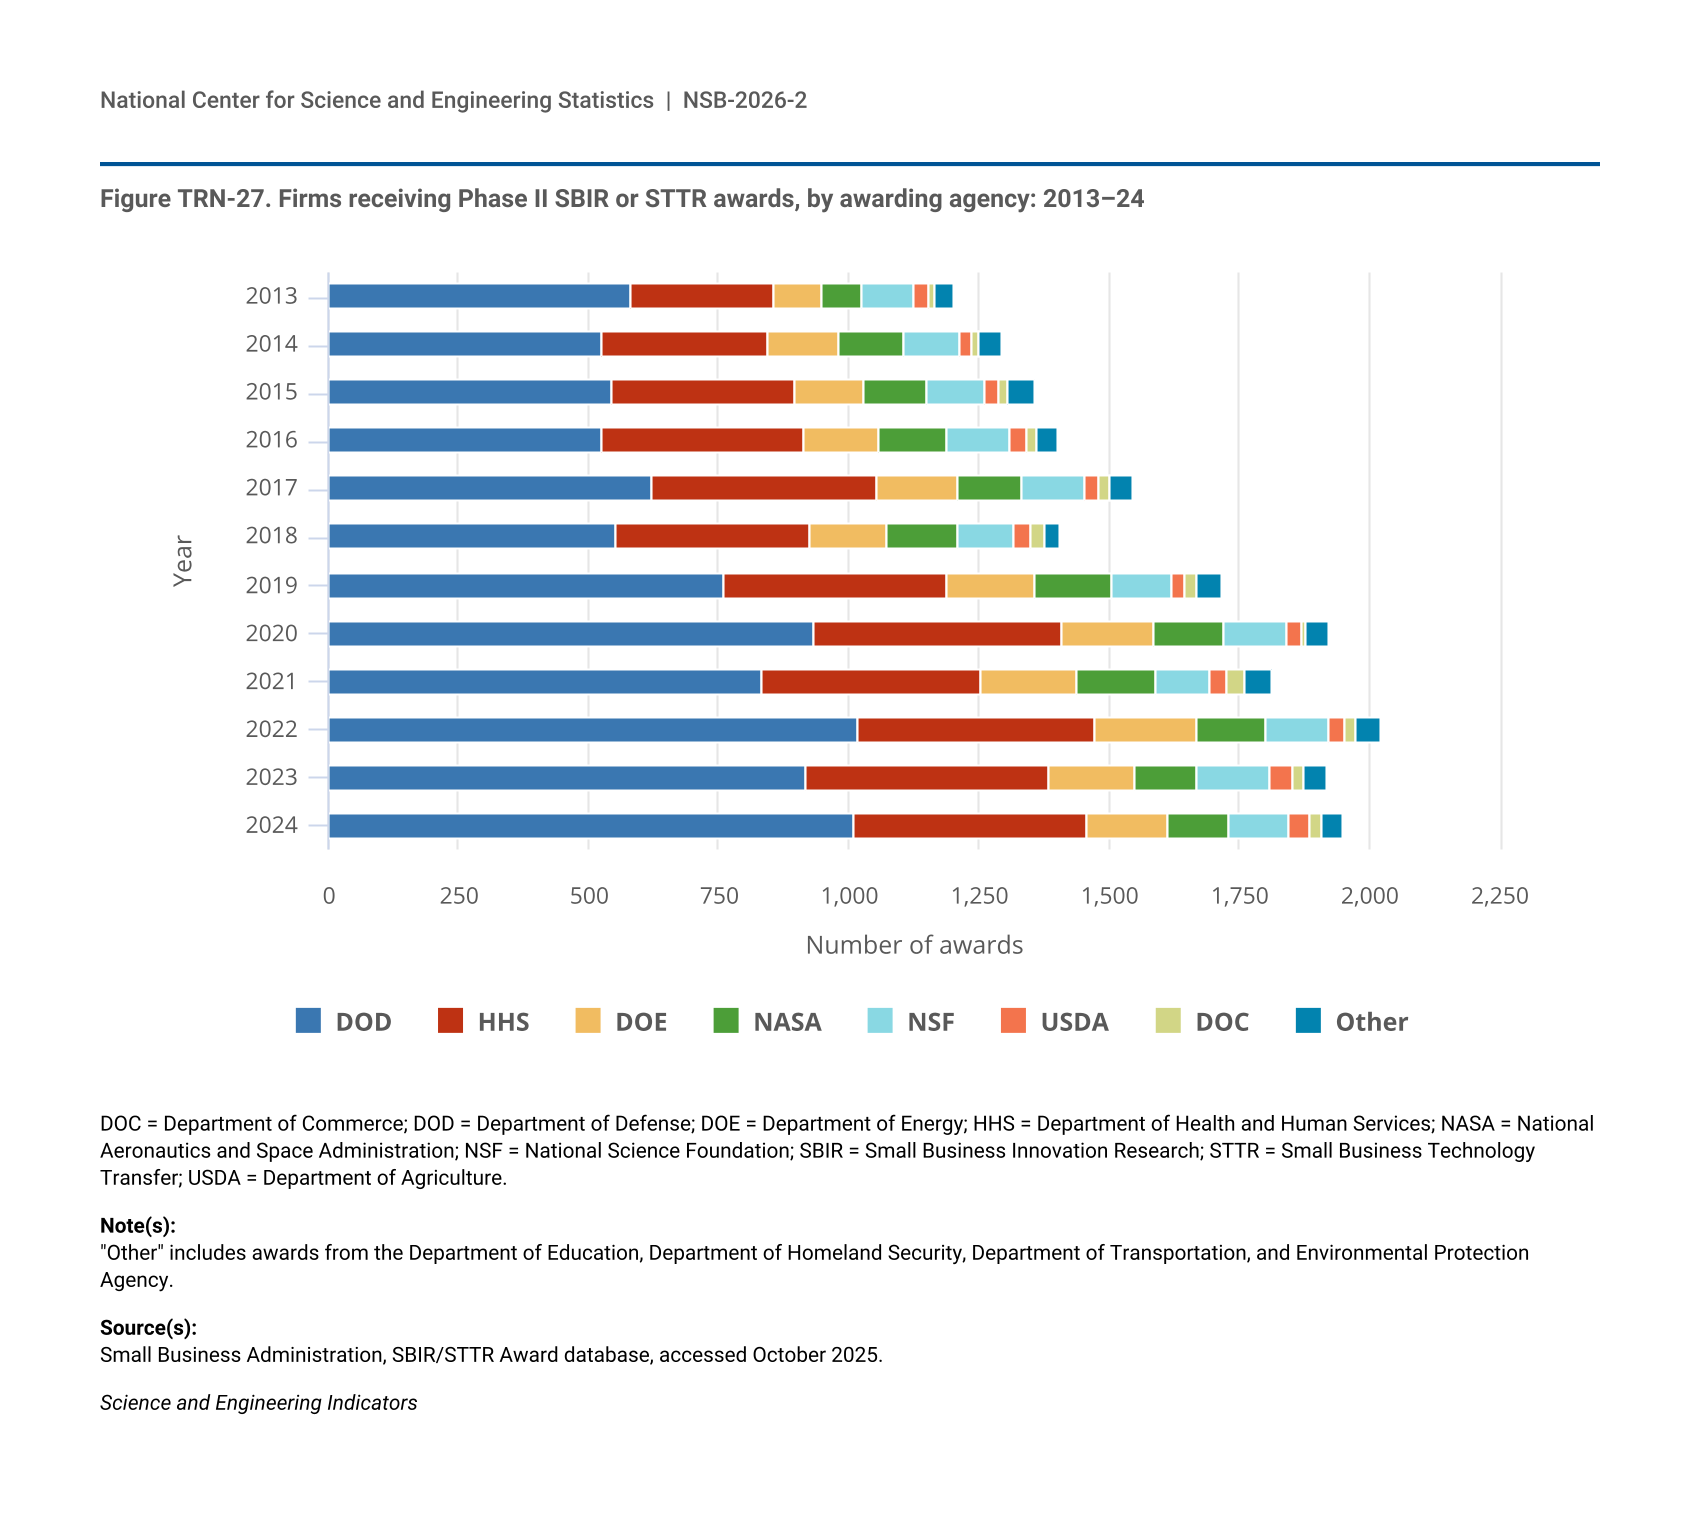
Figure TRN-27.
Firms receiving Phase II SBIR or STTR awards, by awarding agency: 2013–24
Firms receiving Phase II SBIR or STTR awards, by awarding agency: 2013–24
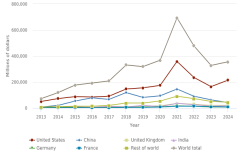
Figure TRN-28.
Venture capital investment received by firms headquartered in selected regions, countries, and economies: 2013–24
Venture capital investment received by firms headquartered in selected regions, countries, and economies: 2013–24
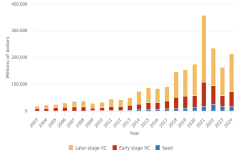
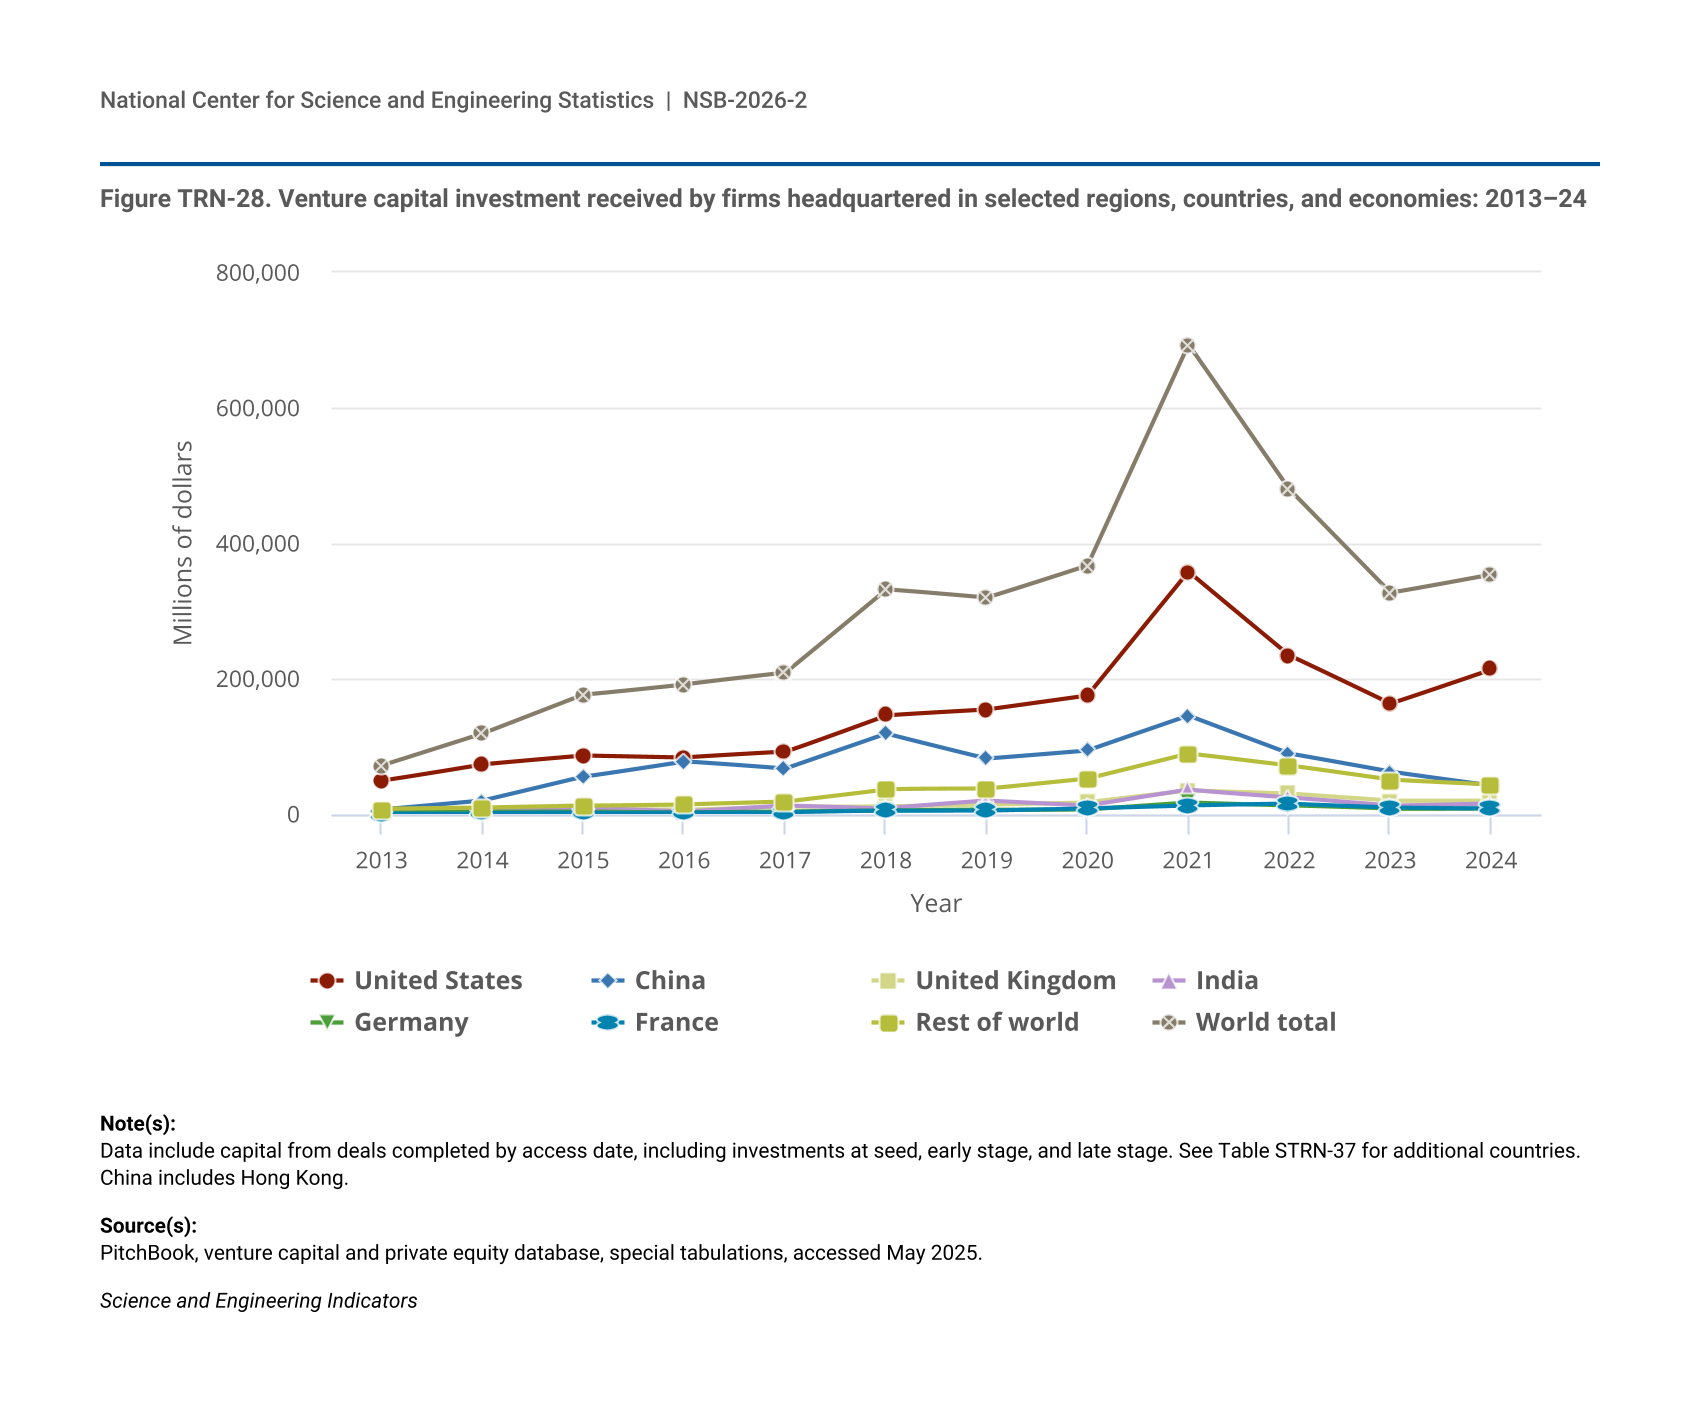
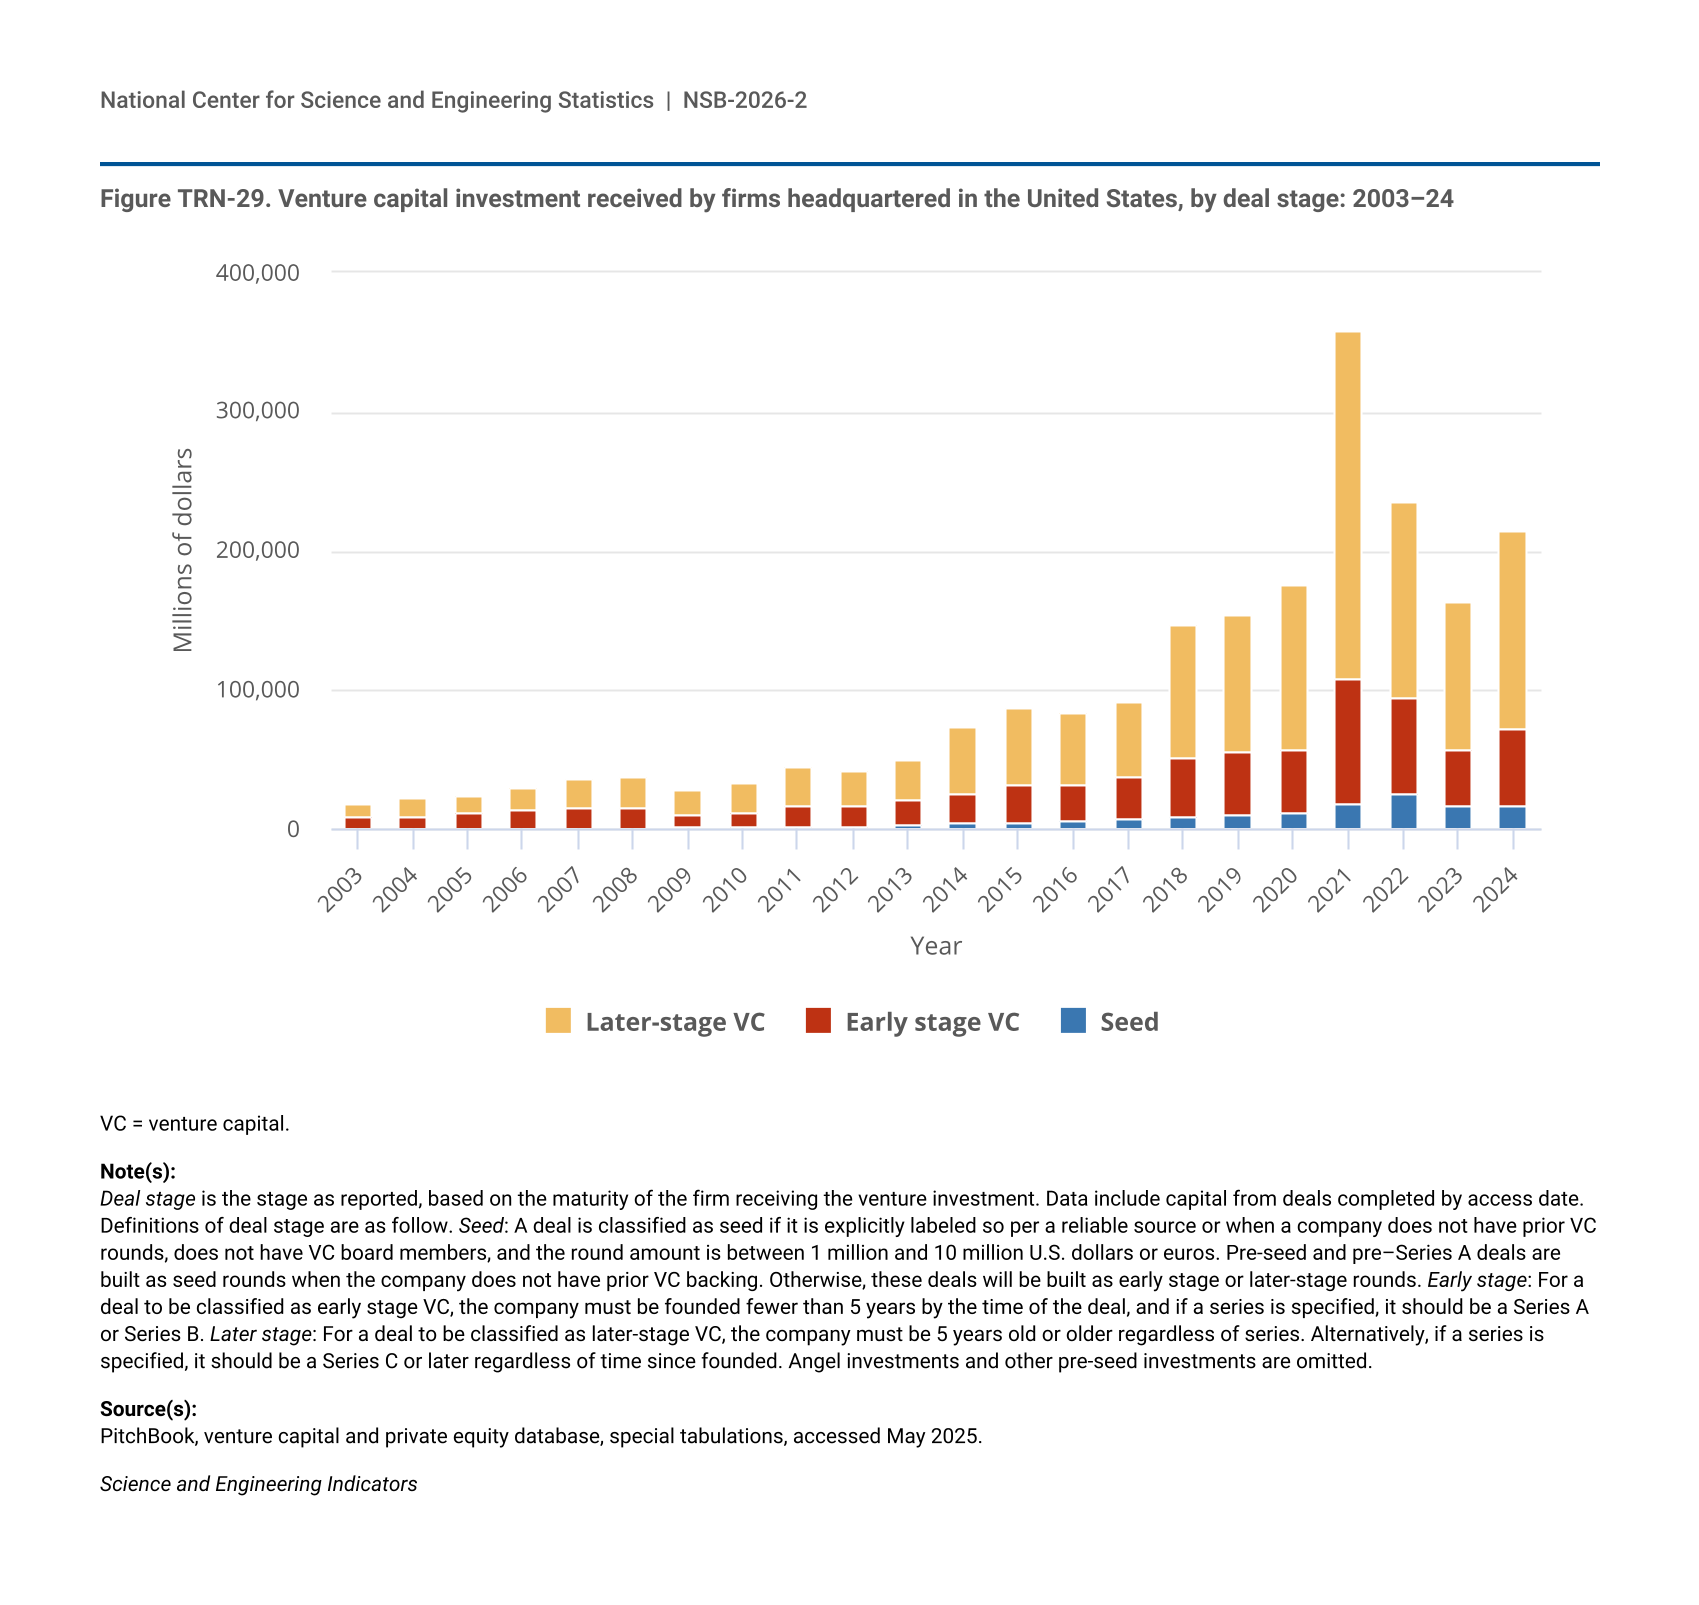
Figure TRN-29.
Venture capital investment received by firms headquartered in the United States, by deal stage: 2003–24
Venture capital investment received by firms headquartered in the United States, by deal stage: 2003–24
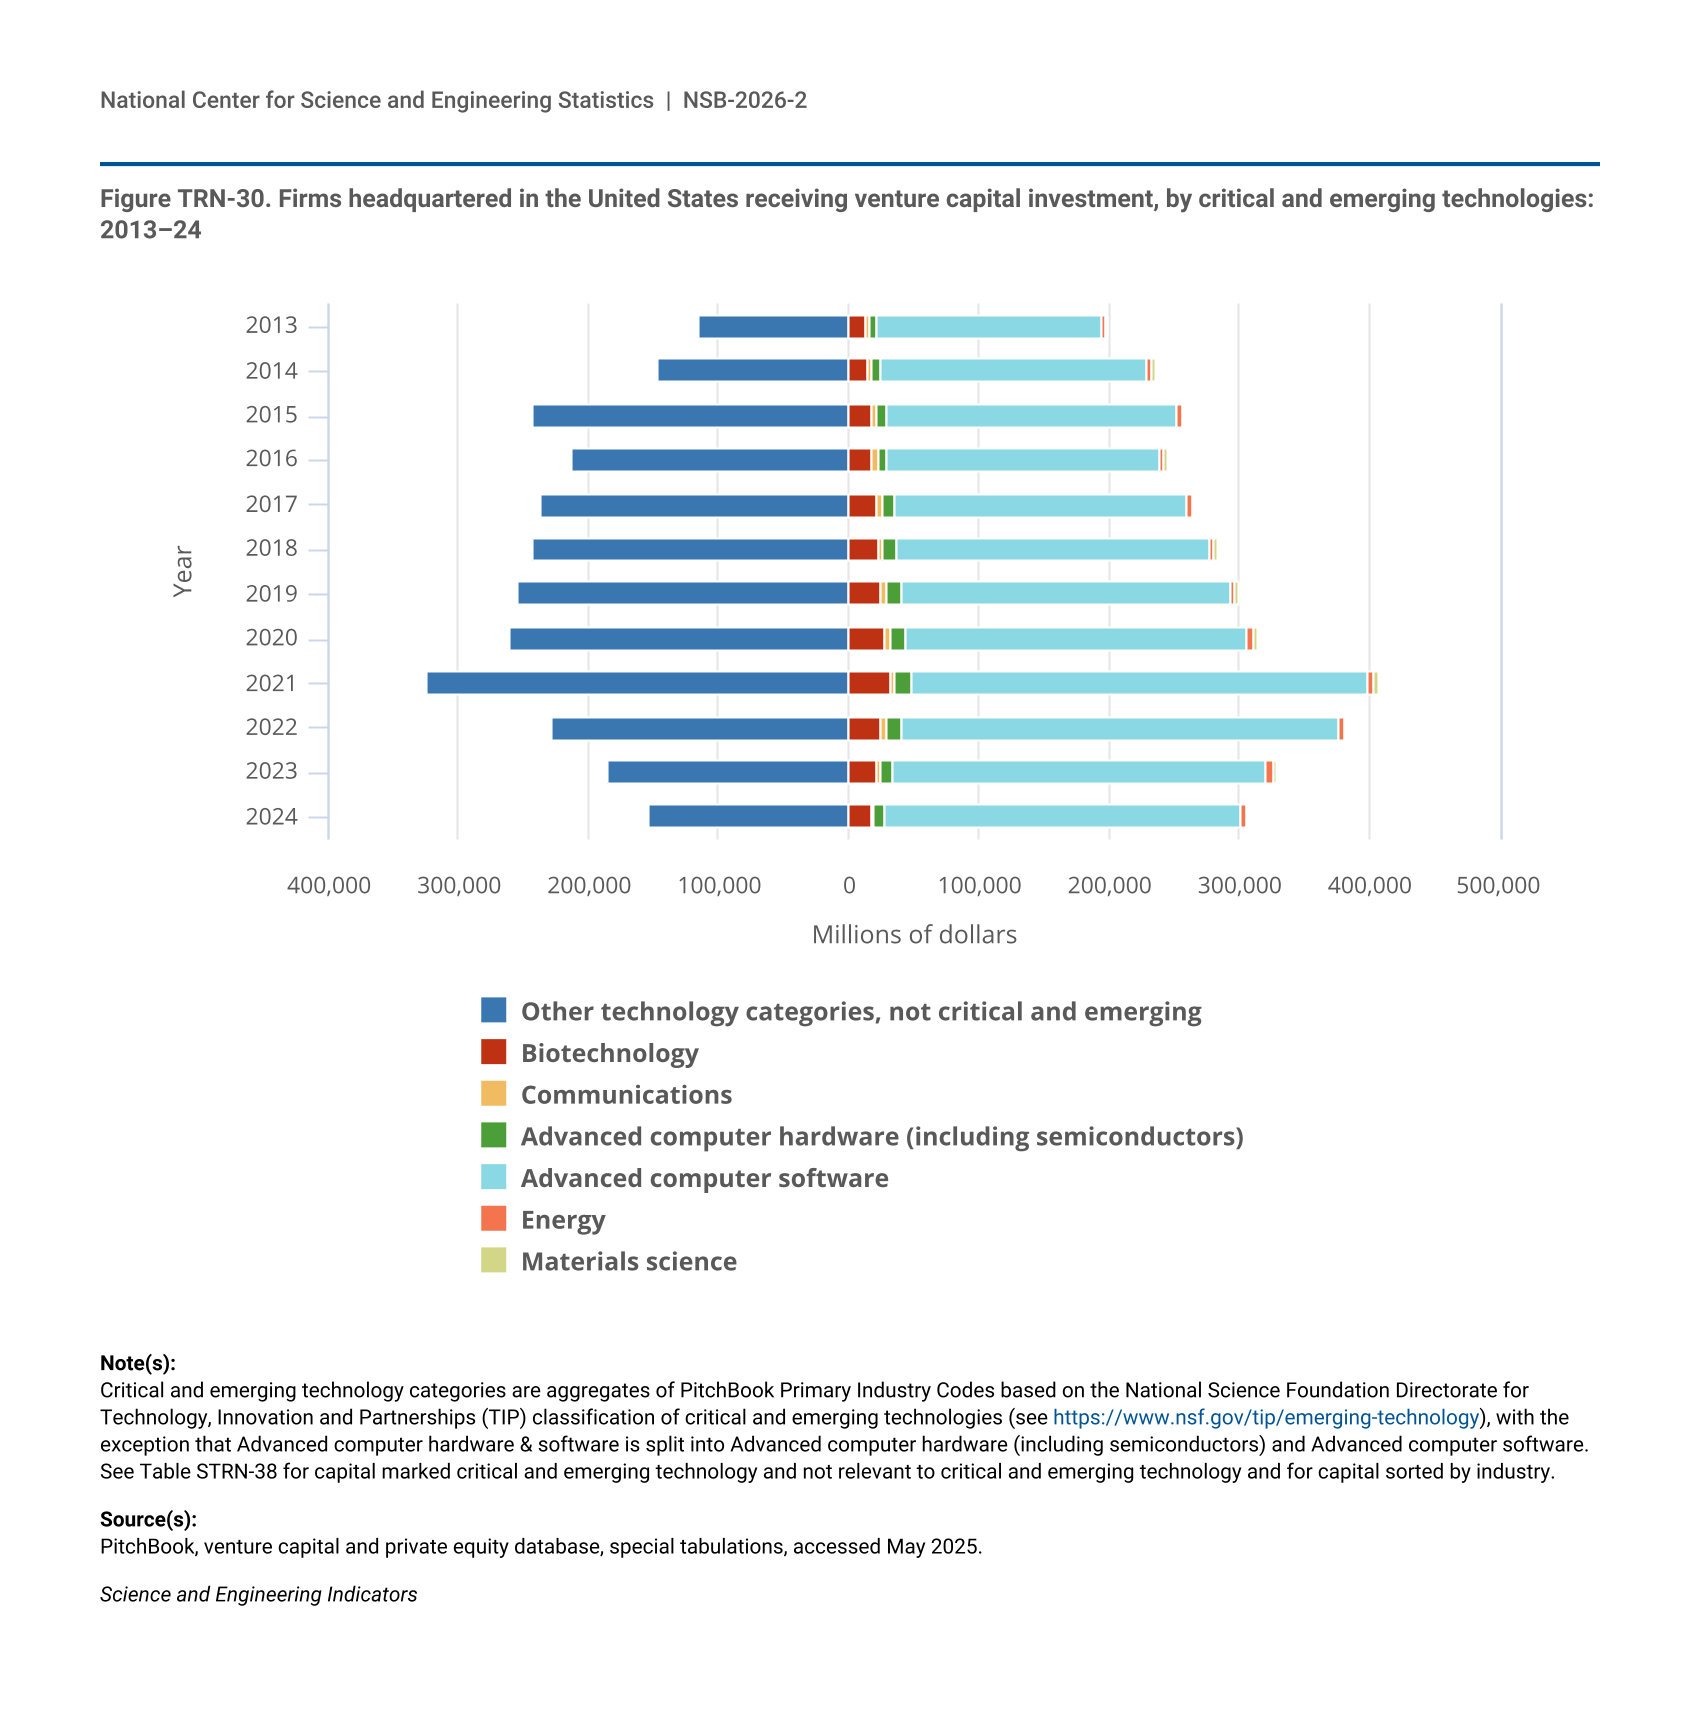
Figure TRN-30.
Firms headquartered in the United States receiving venture capital investment, by critical and emerging technologies: 2013–24
Firms headquartered in the United States receiving venture capital investment, by critical and emerging technologies: 2013–24
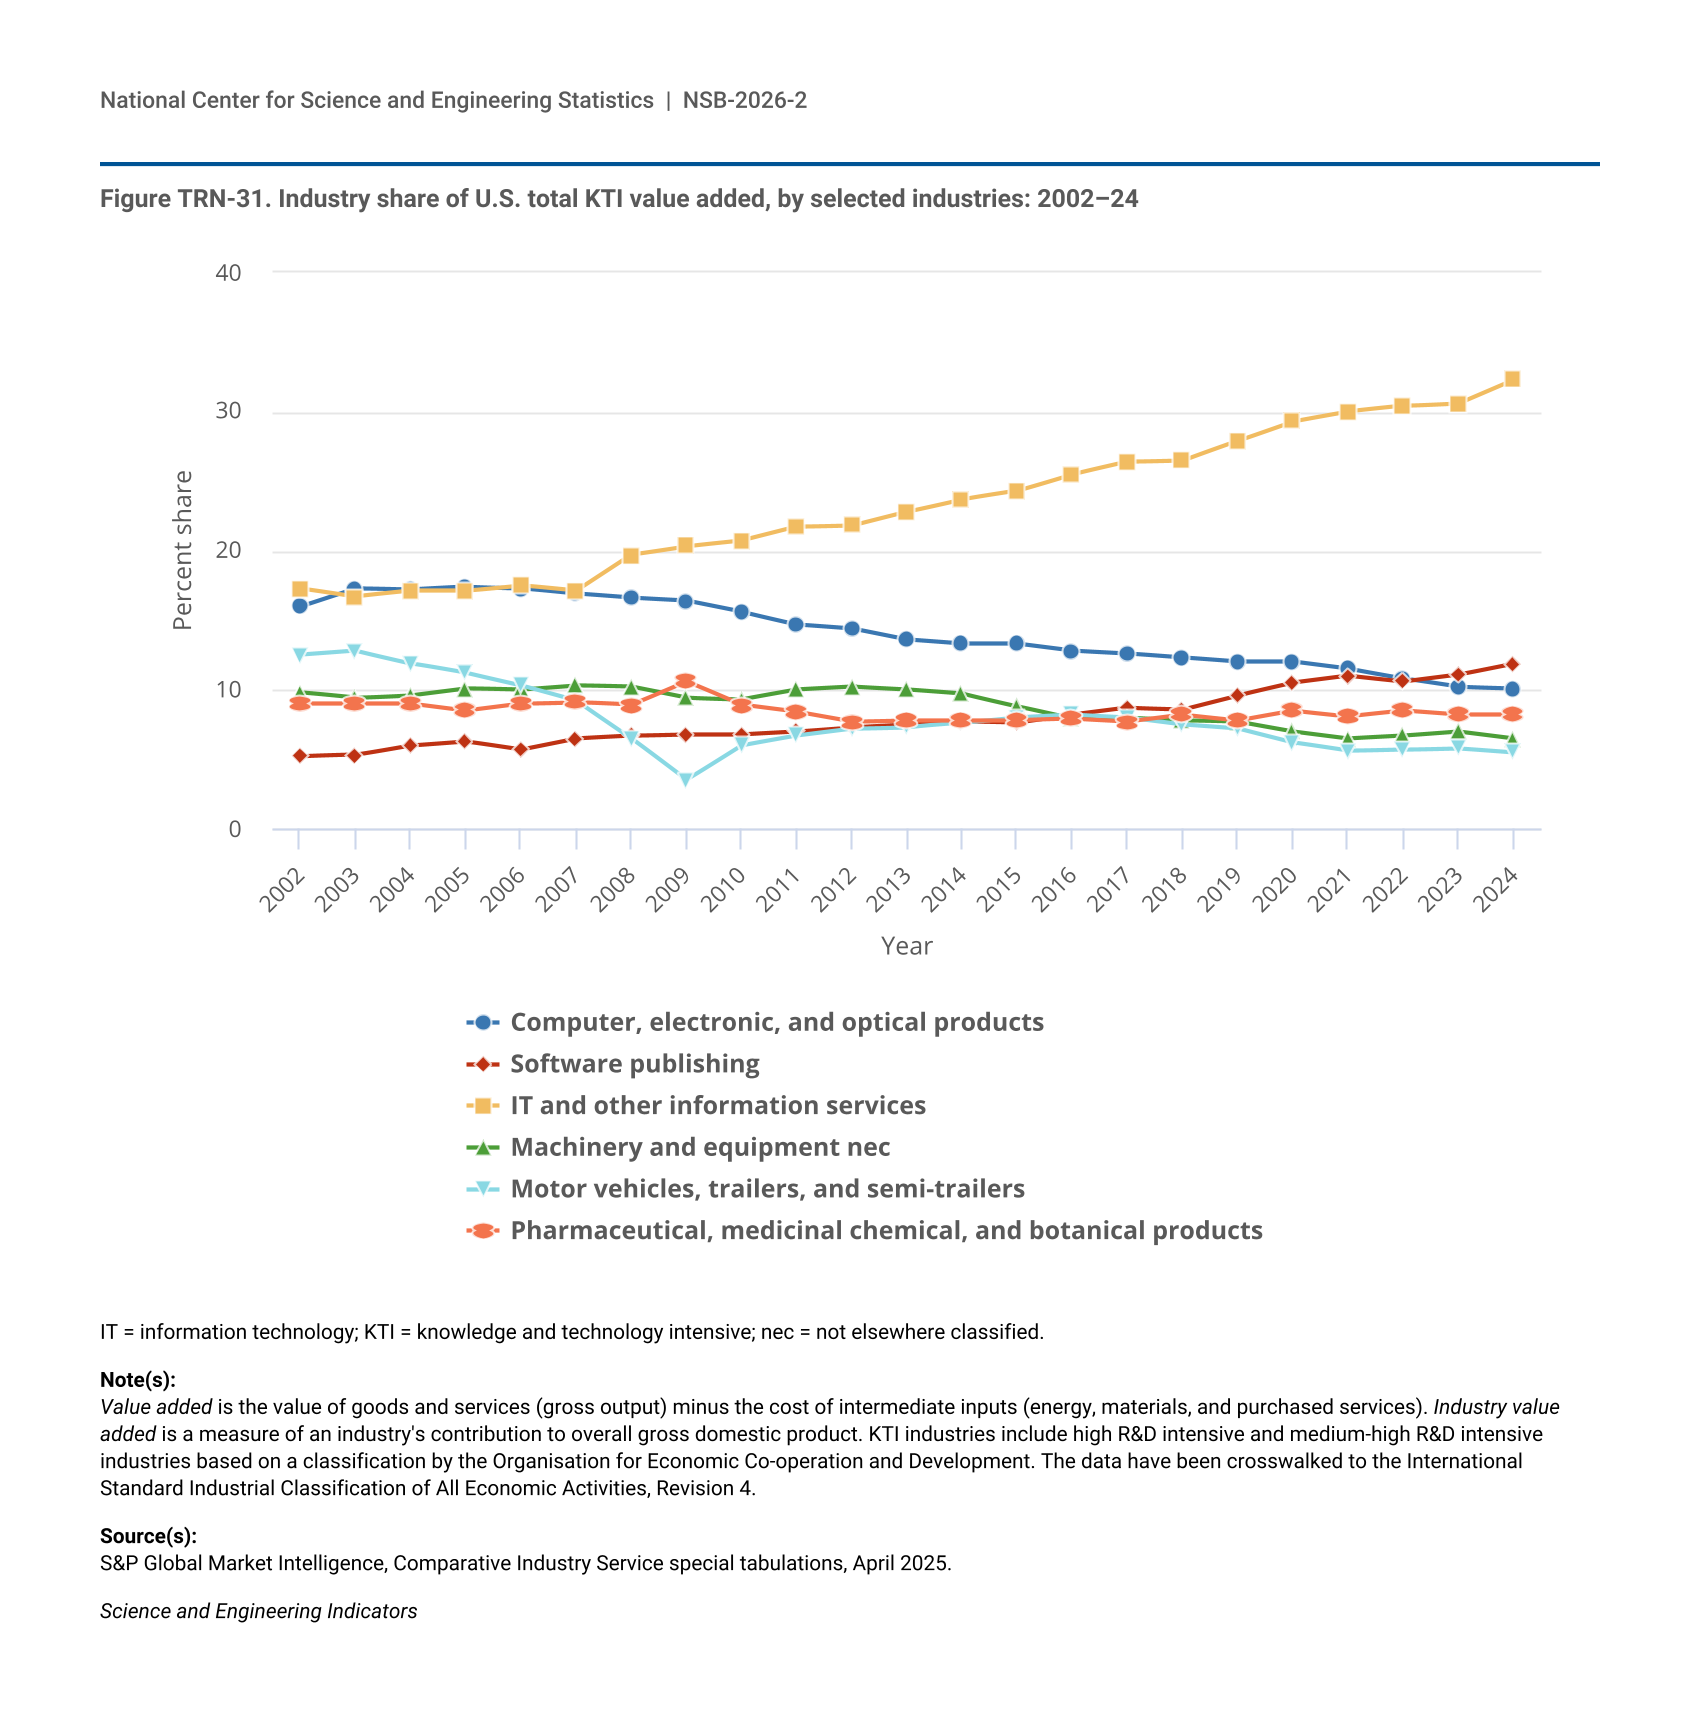
Figure TRN-31.
Industry share of U.S. total KTI value added, by selected industries: 2002–24
Industry share of U.S. total KTI value added, by selected industries: 2002–24
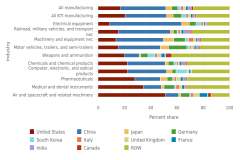
Figure TRN-32.
Country share of global KTI manufacturing value added, by KTI industry: 2024
Country share of global KTI manufacturing value added, by KTI industry: 2024
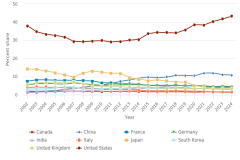
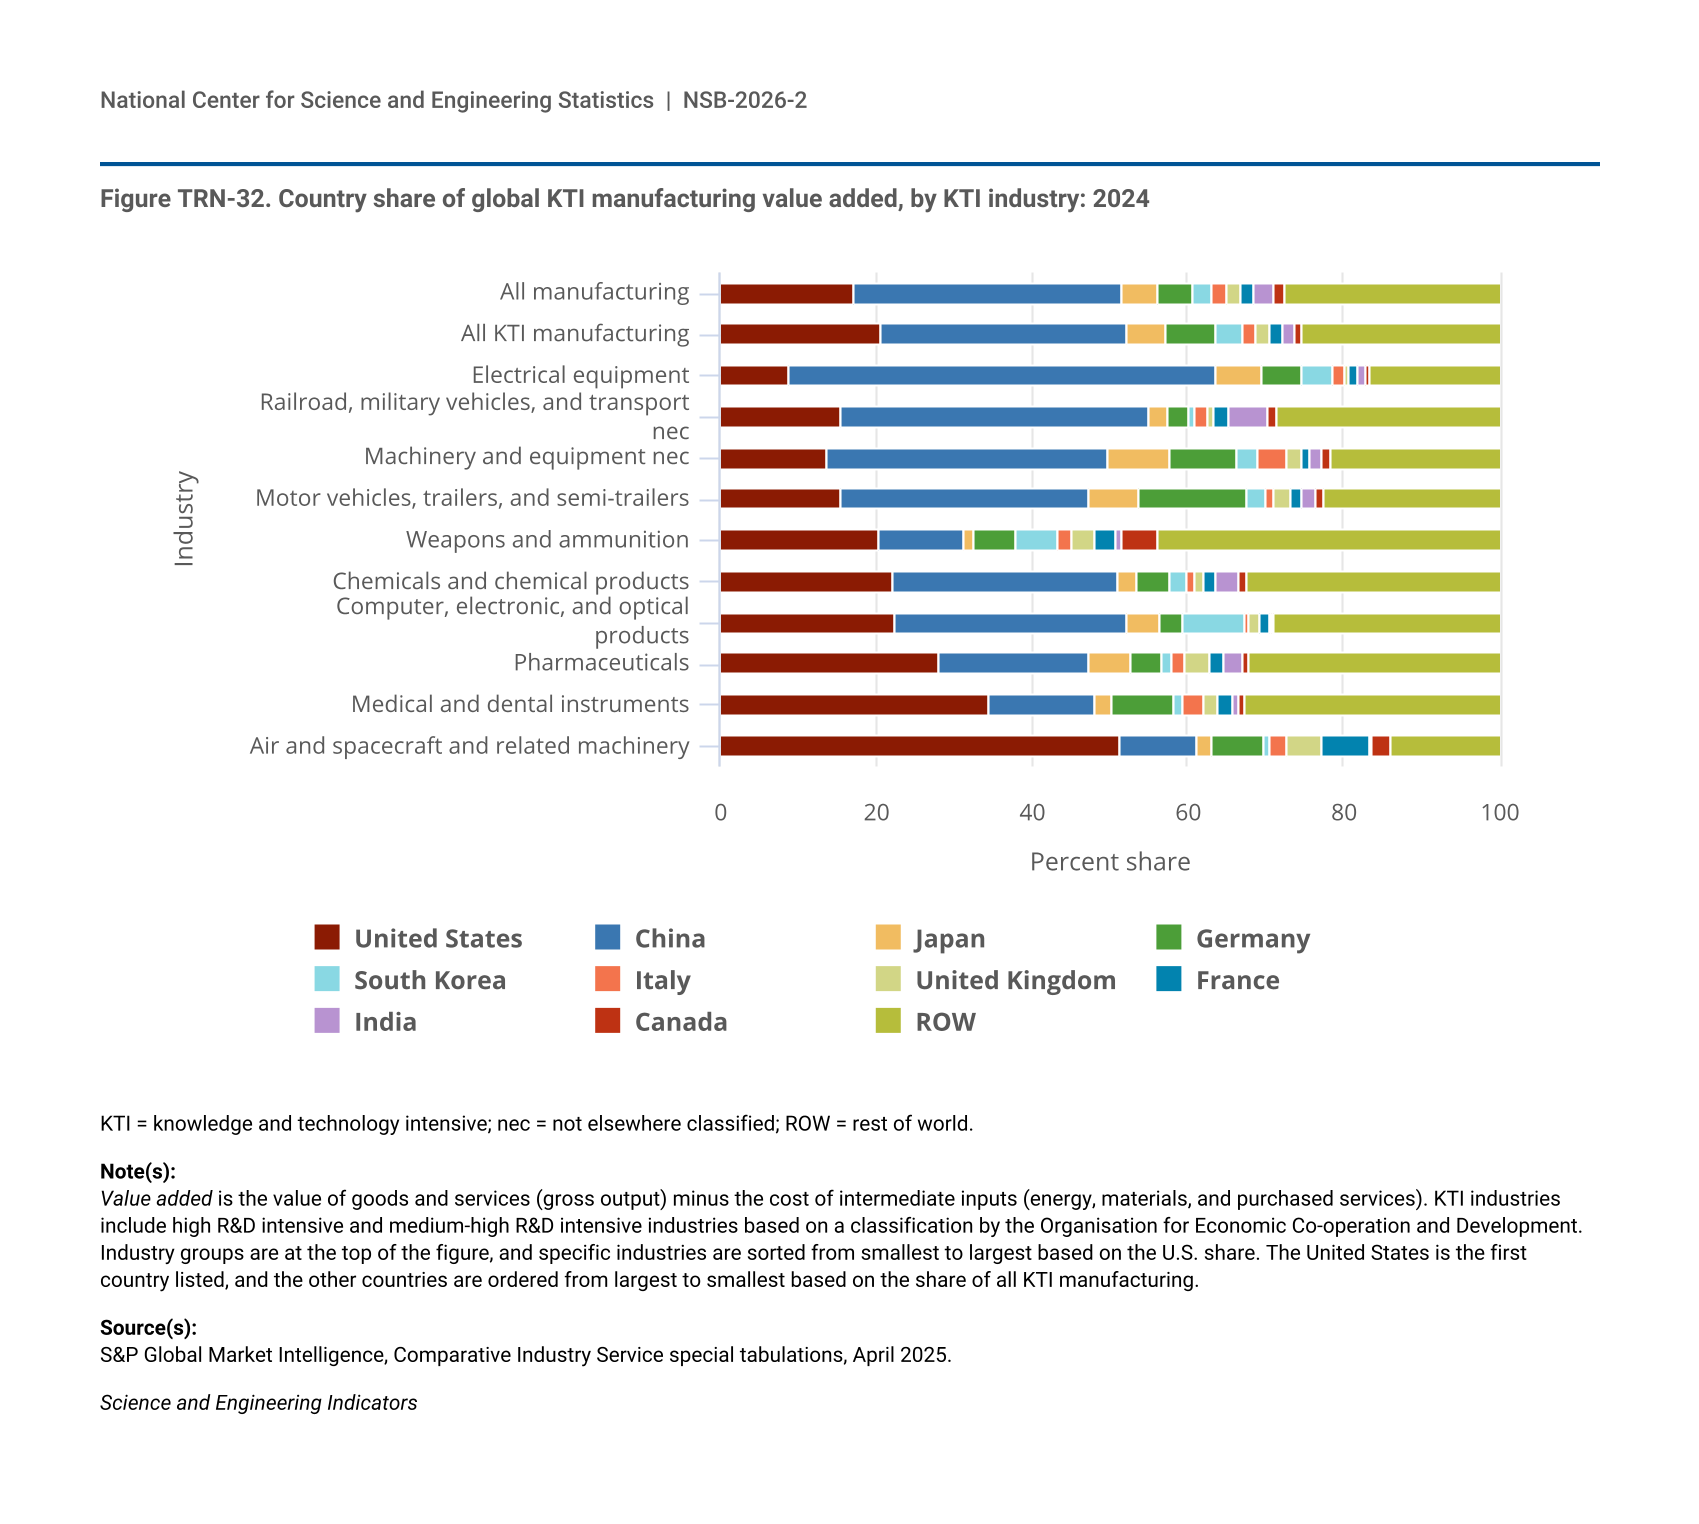
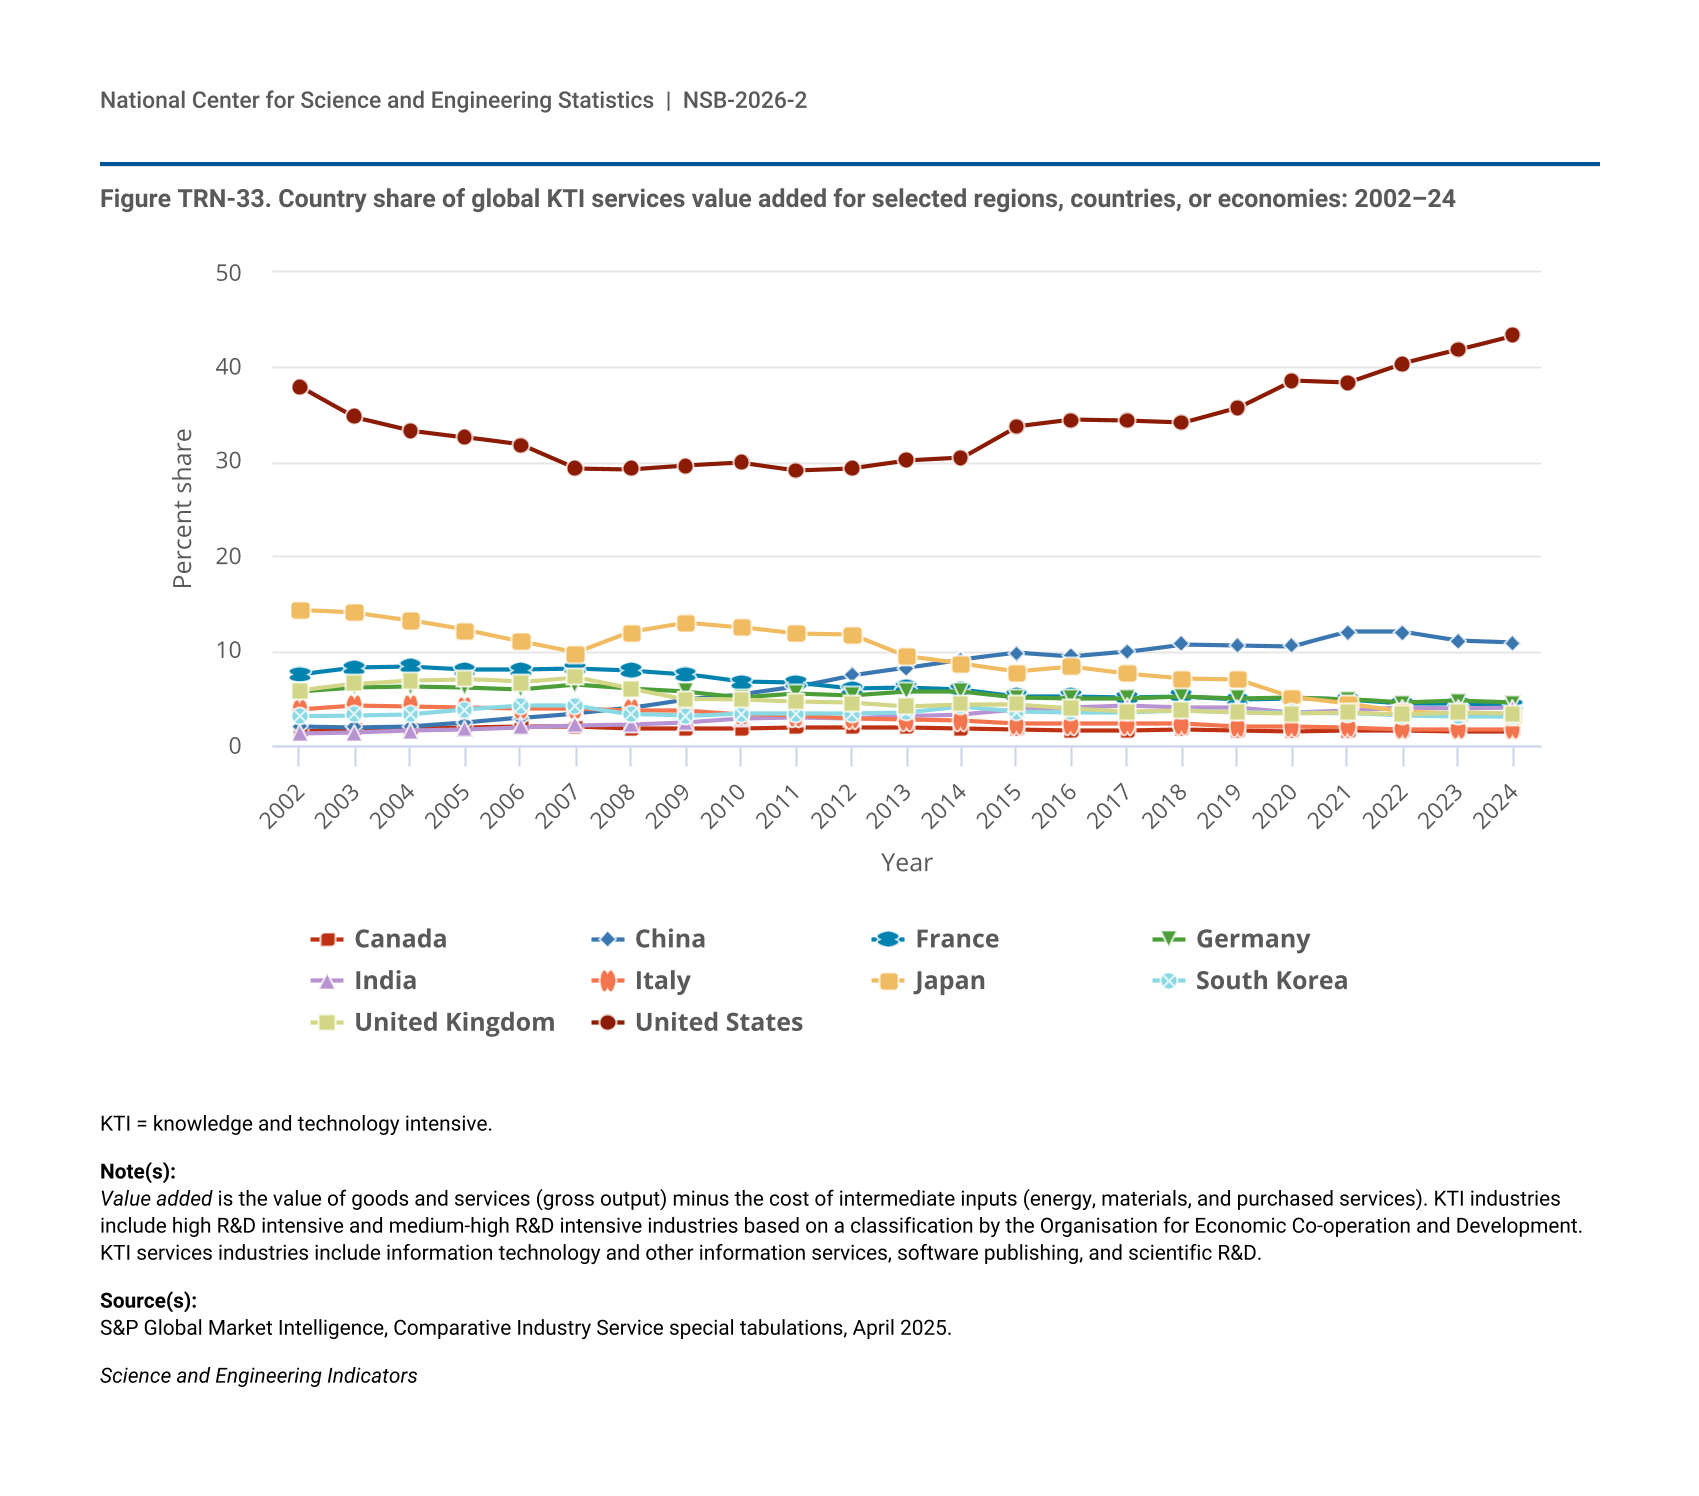
Figure TRN-33.
Country share of global KTI services value added for selected regions, countries, or economies: 2002–24
Country share of global KTI services value added for selected regions, countries, or economies: 2002–24
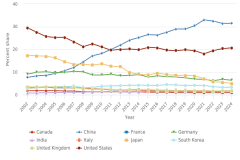
Figure TRN-34.
Country share of global KTI manufacturing value added for selected regions, countries, or economies: 2002–24
Country share of global KTI manufacturing value added for selected regions, countries, or economies: 2002–24
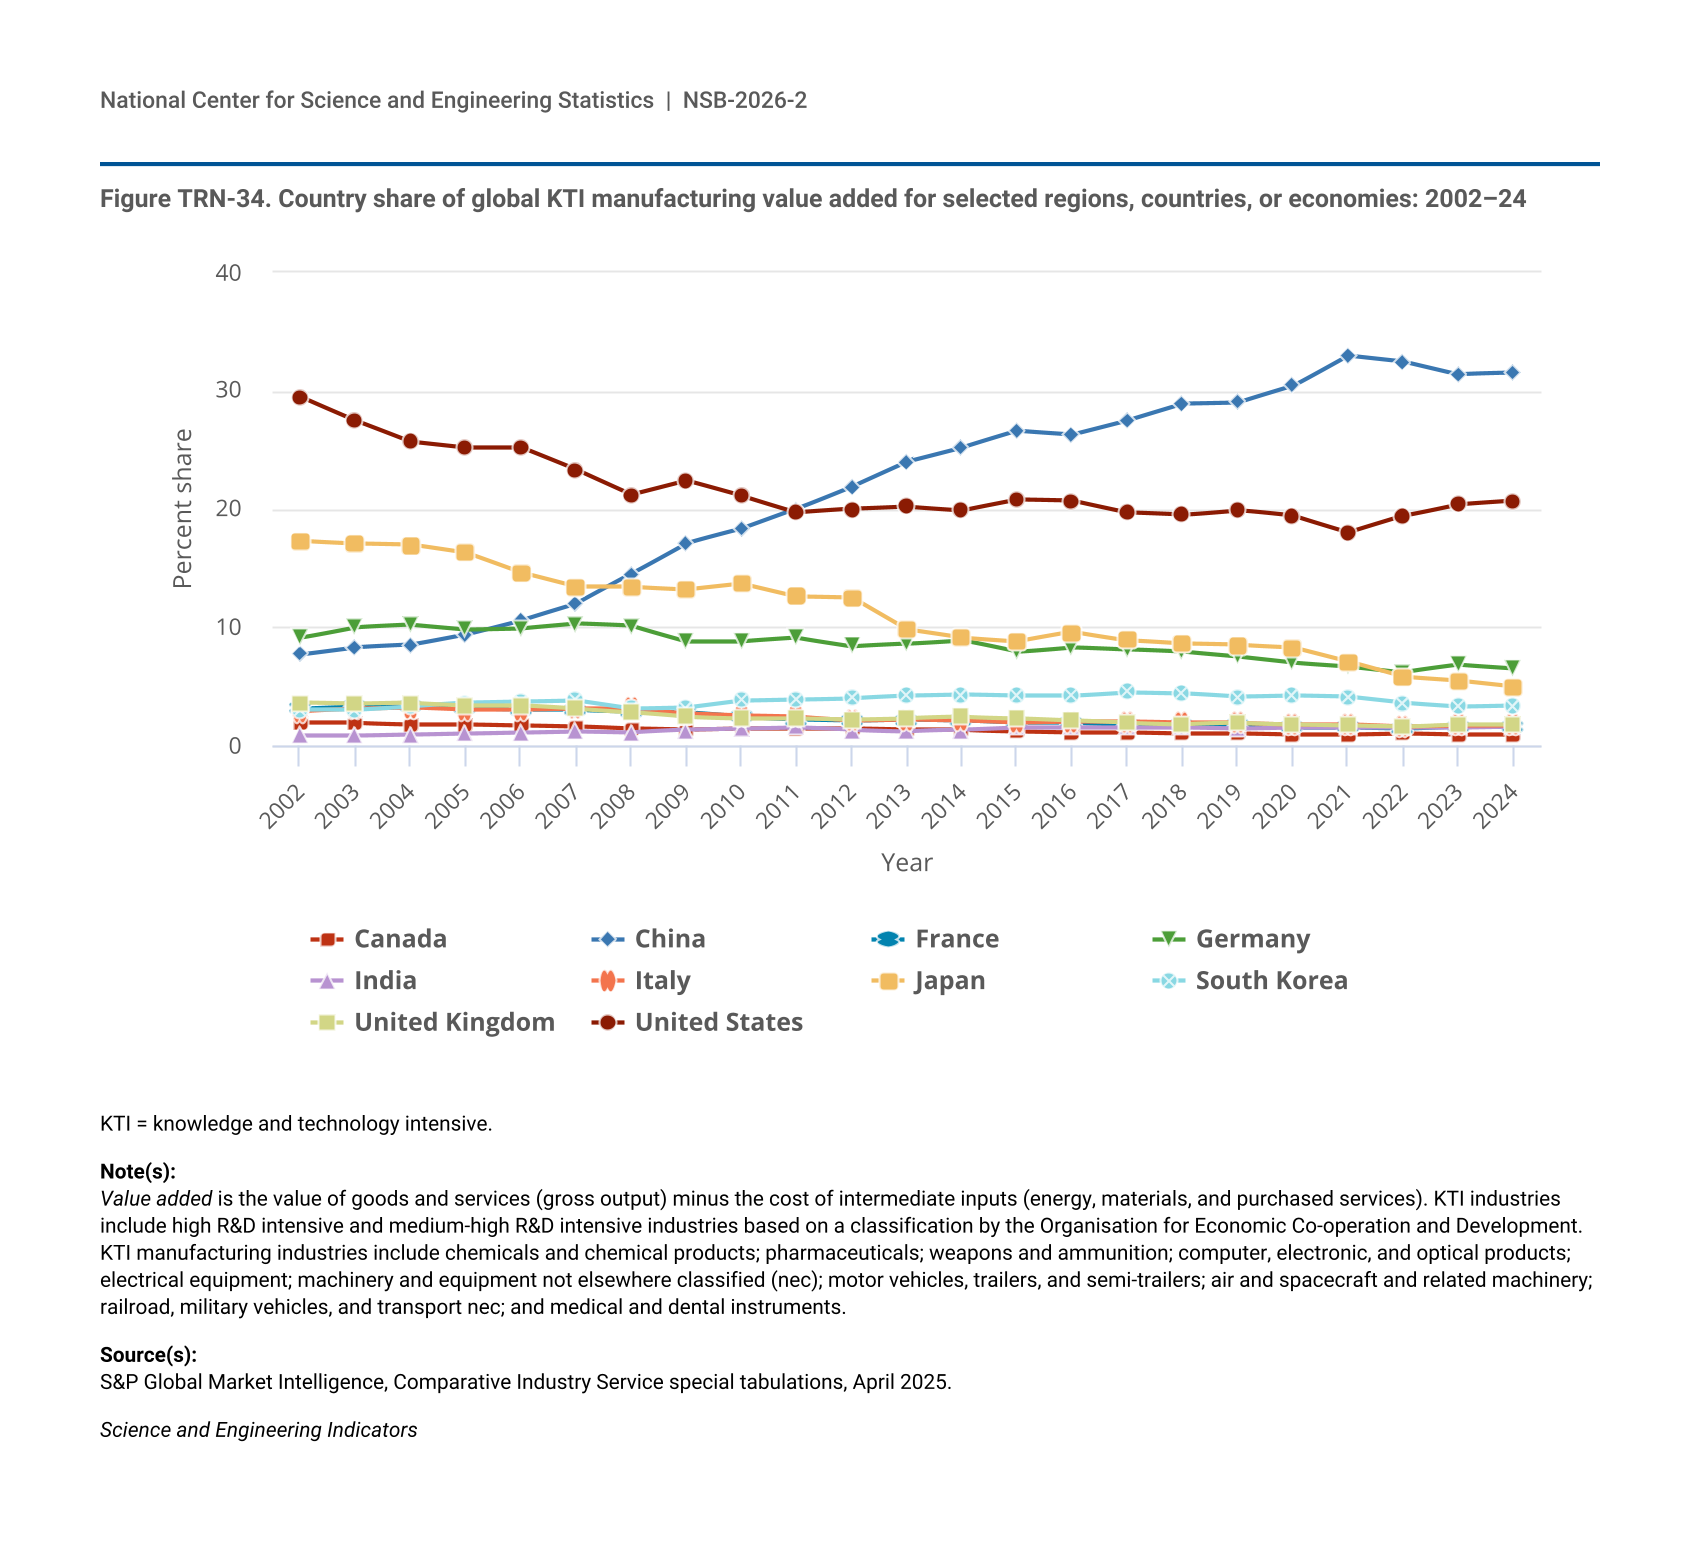
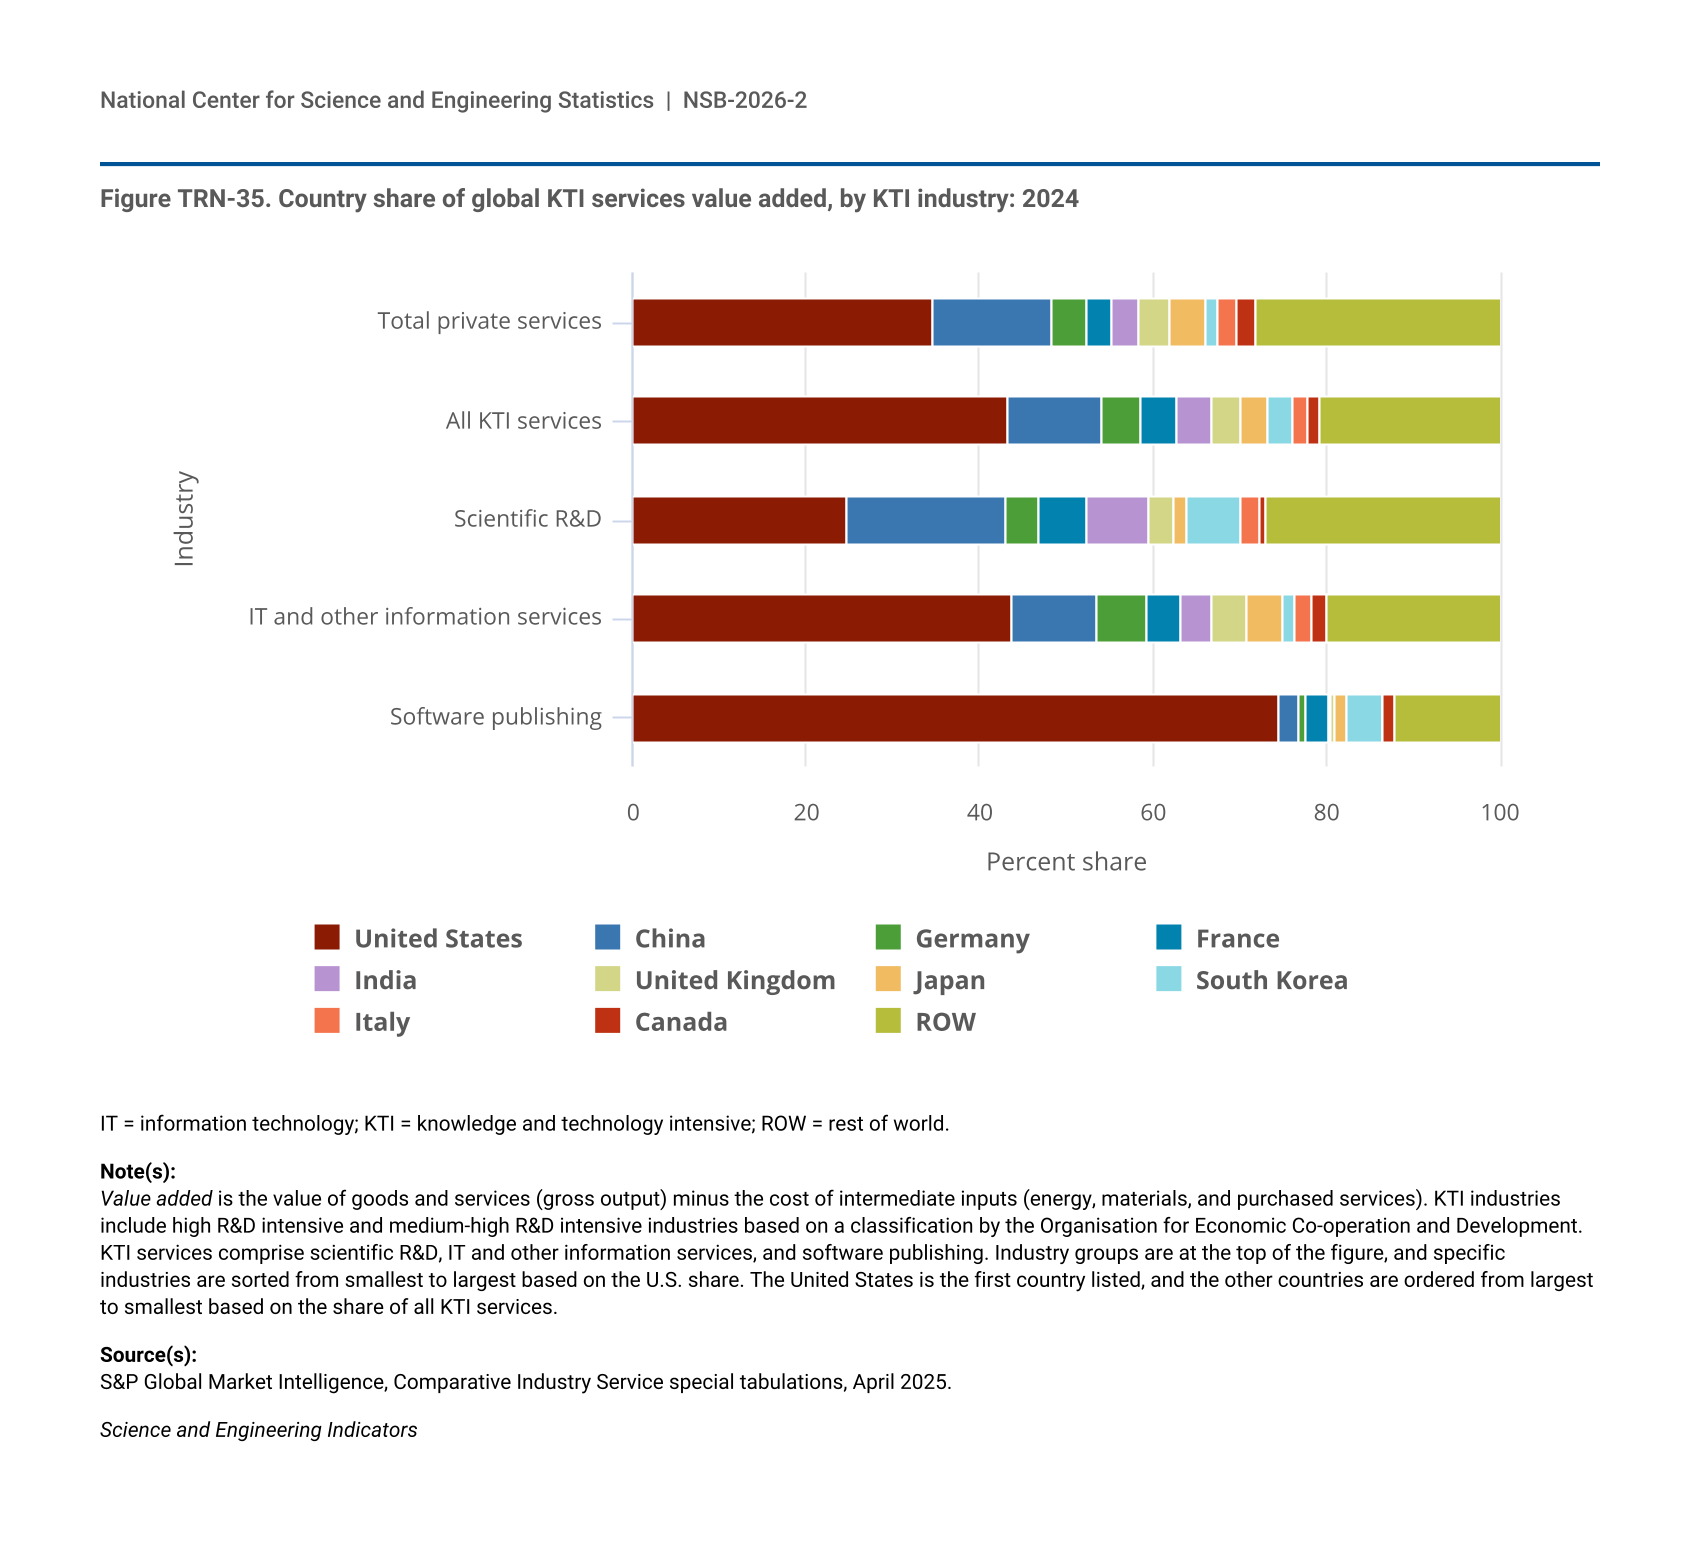
Figure TRN-35.
Country share of global KTI services value added, by KTI industry: 2024
Country share of global KTI services value added, by KTI industry: 2024
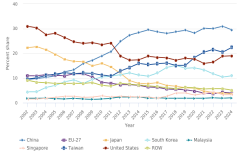
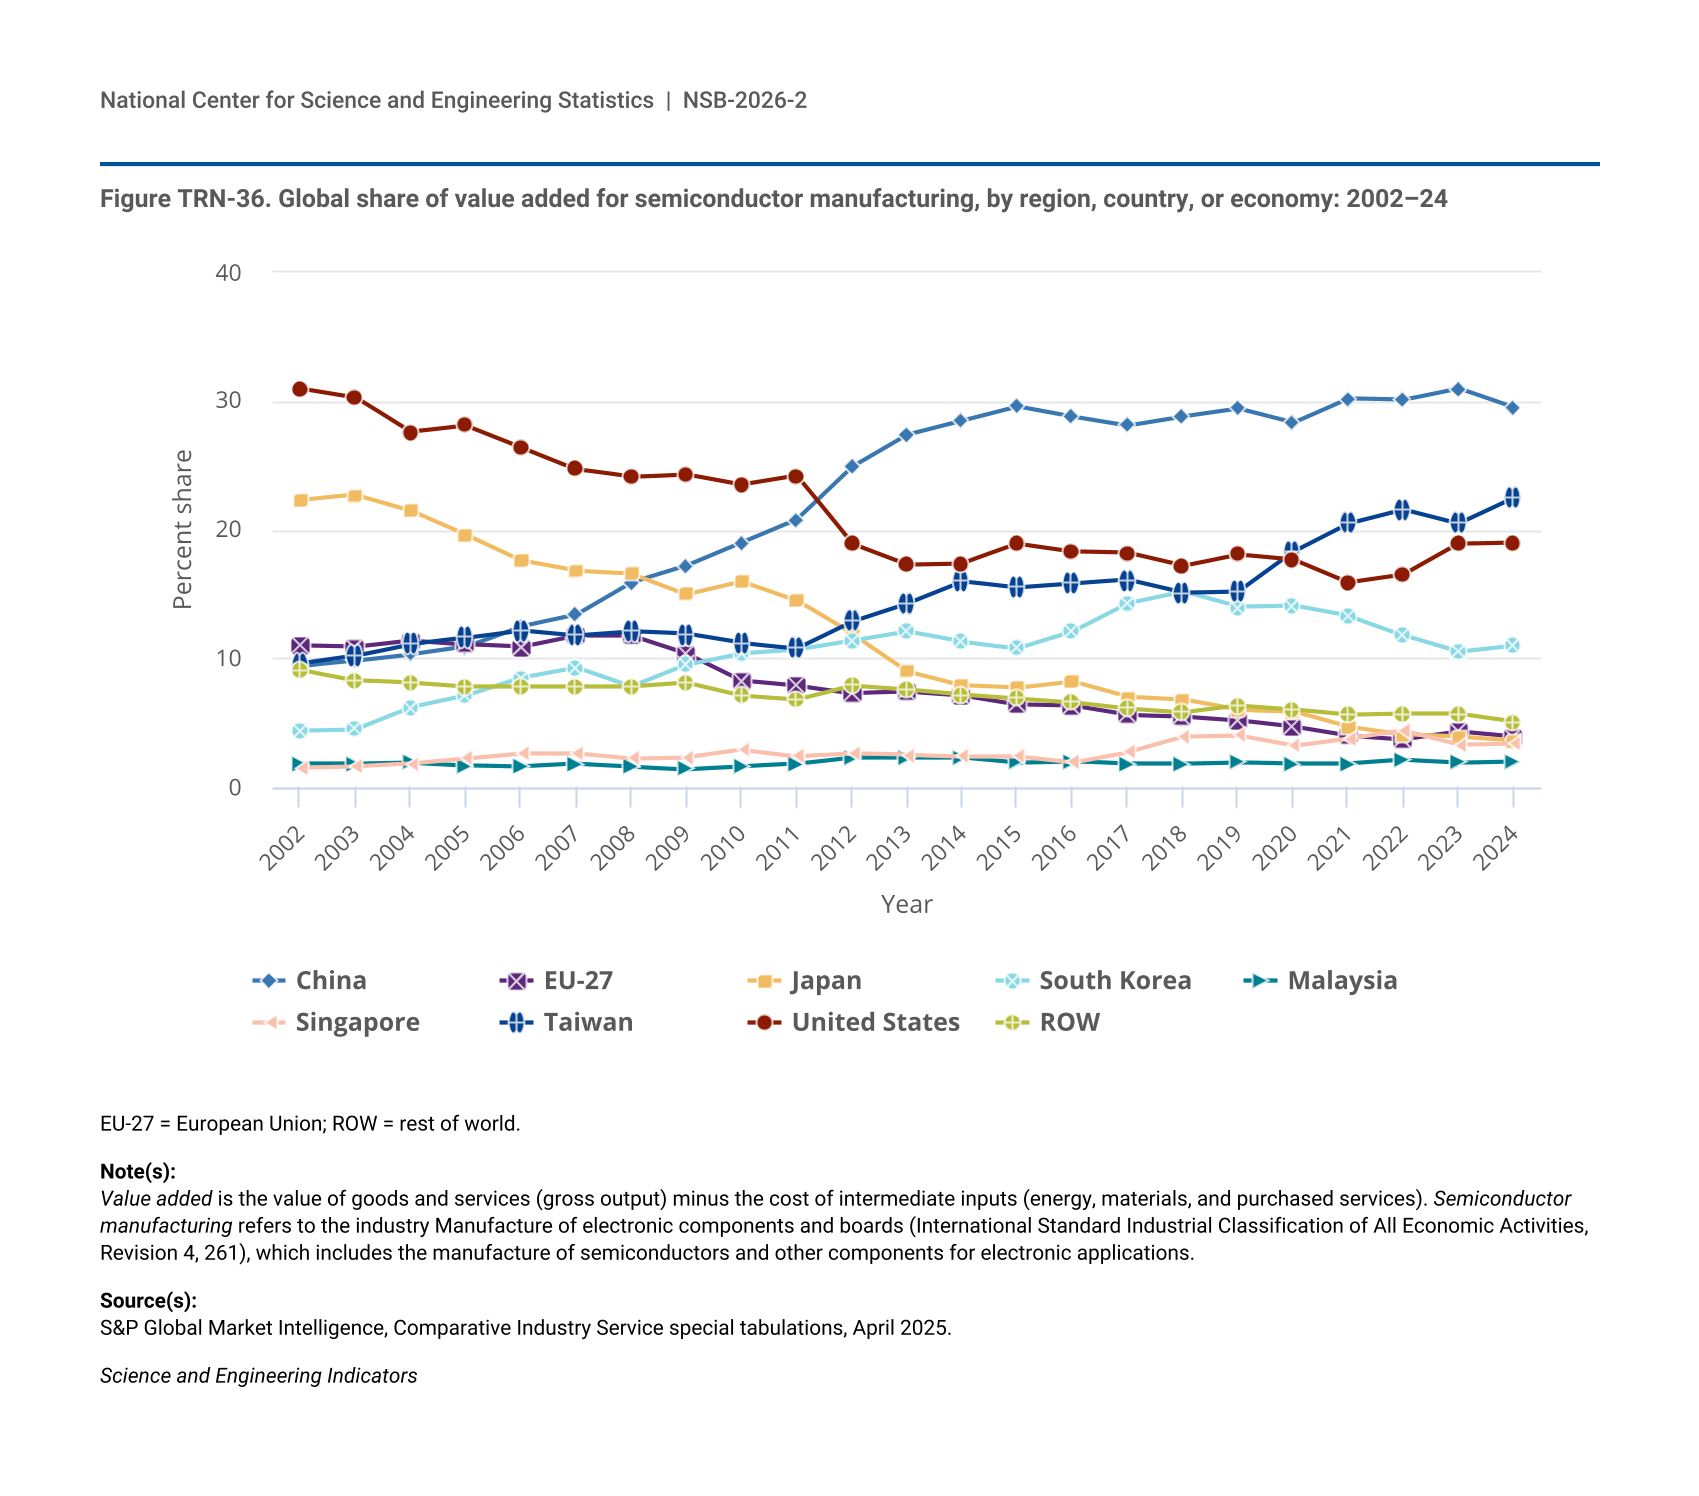
Figure TRN-36.
Global share of value added for semiconductor manufacturing, by region, country, or economy: 2002–24
Global share of value added for semiconductor manufacturing, by region, country, or economy: 2002–24
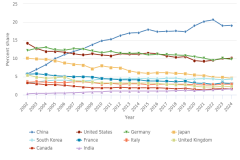
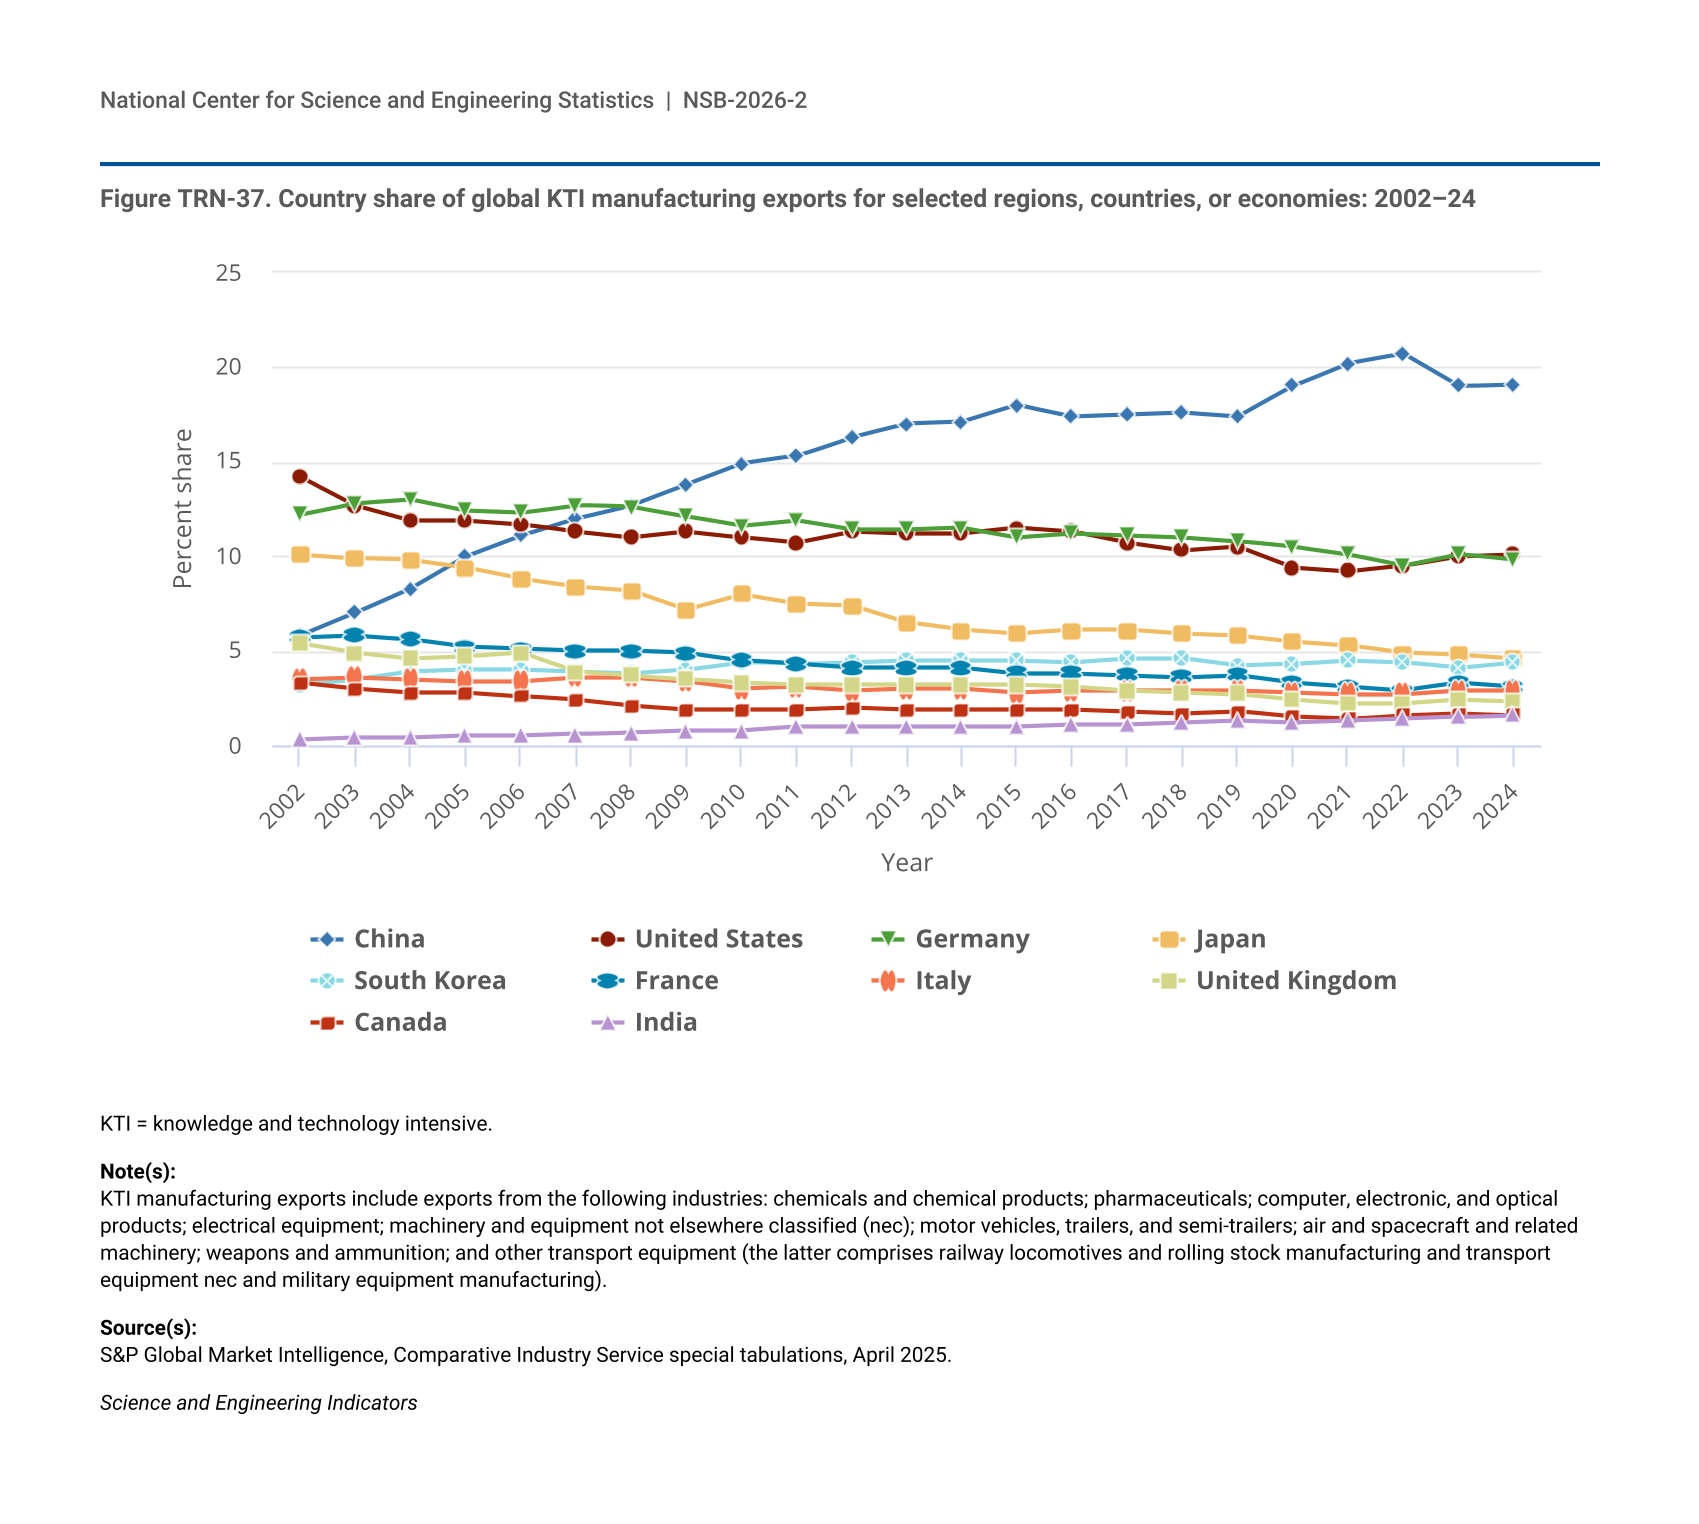
Figure TRN-37.
Country share of global KTI manufacturing exports for selected regions, countries, or economies: 2002–24
Country share of global KTI manufacturing exports for selected regions, countries, or economies: 2002–24
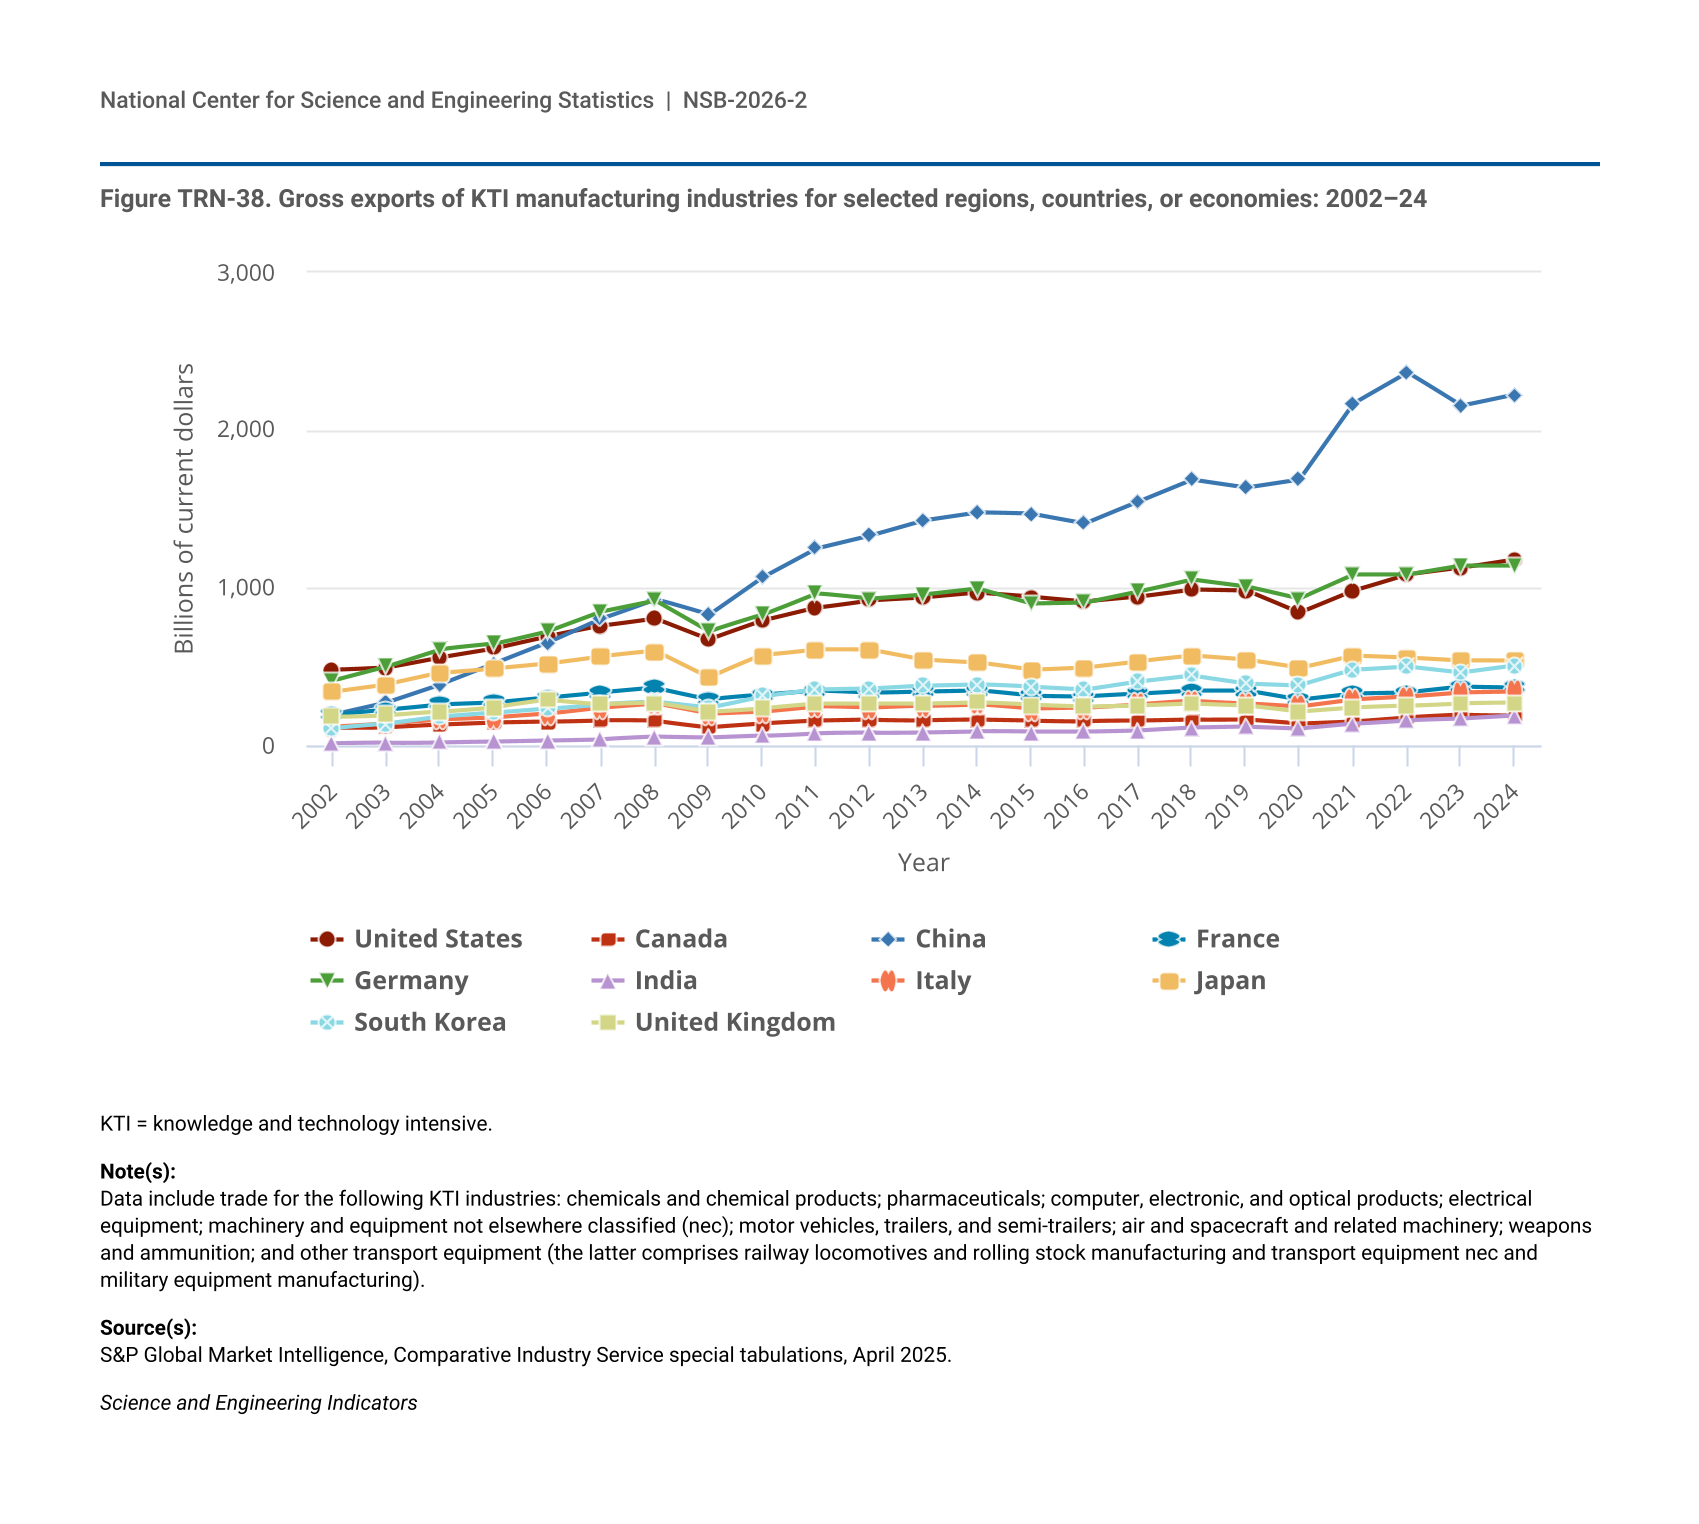
Figure TRN-38.
Gross exports of KTI manufacturing industries for selected regions, countries, or economies: 2002–24
Gross exports of KTI manufacturing industries for selected regions, countries, or economies: 2002–24
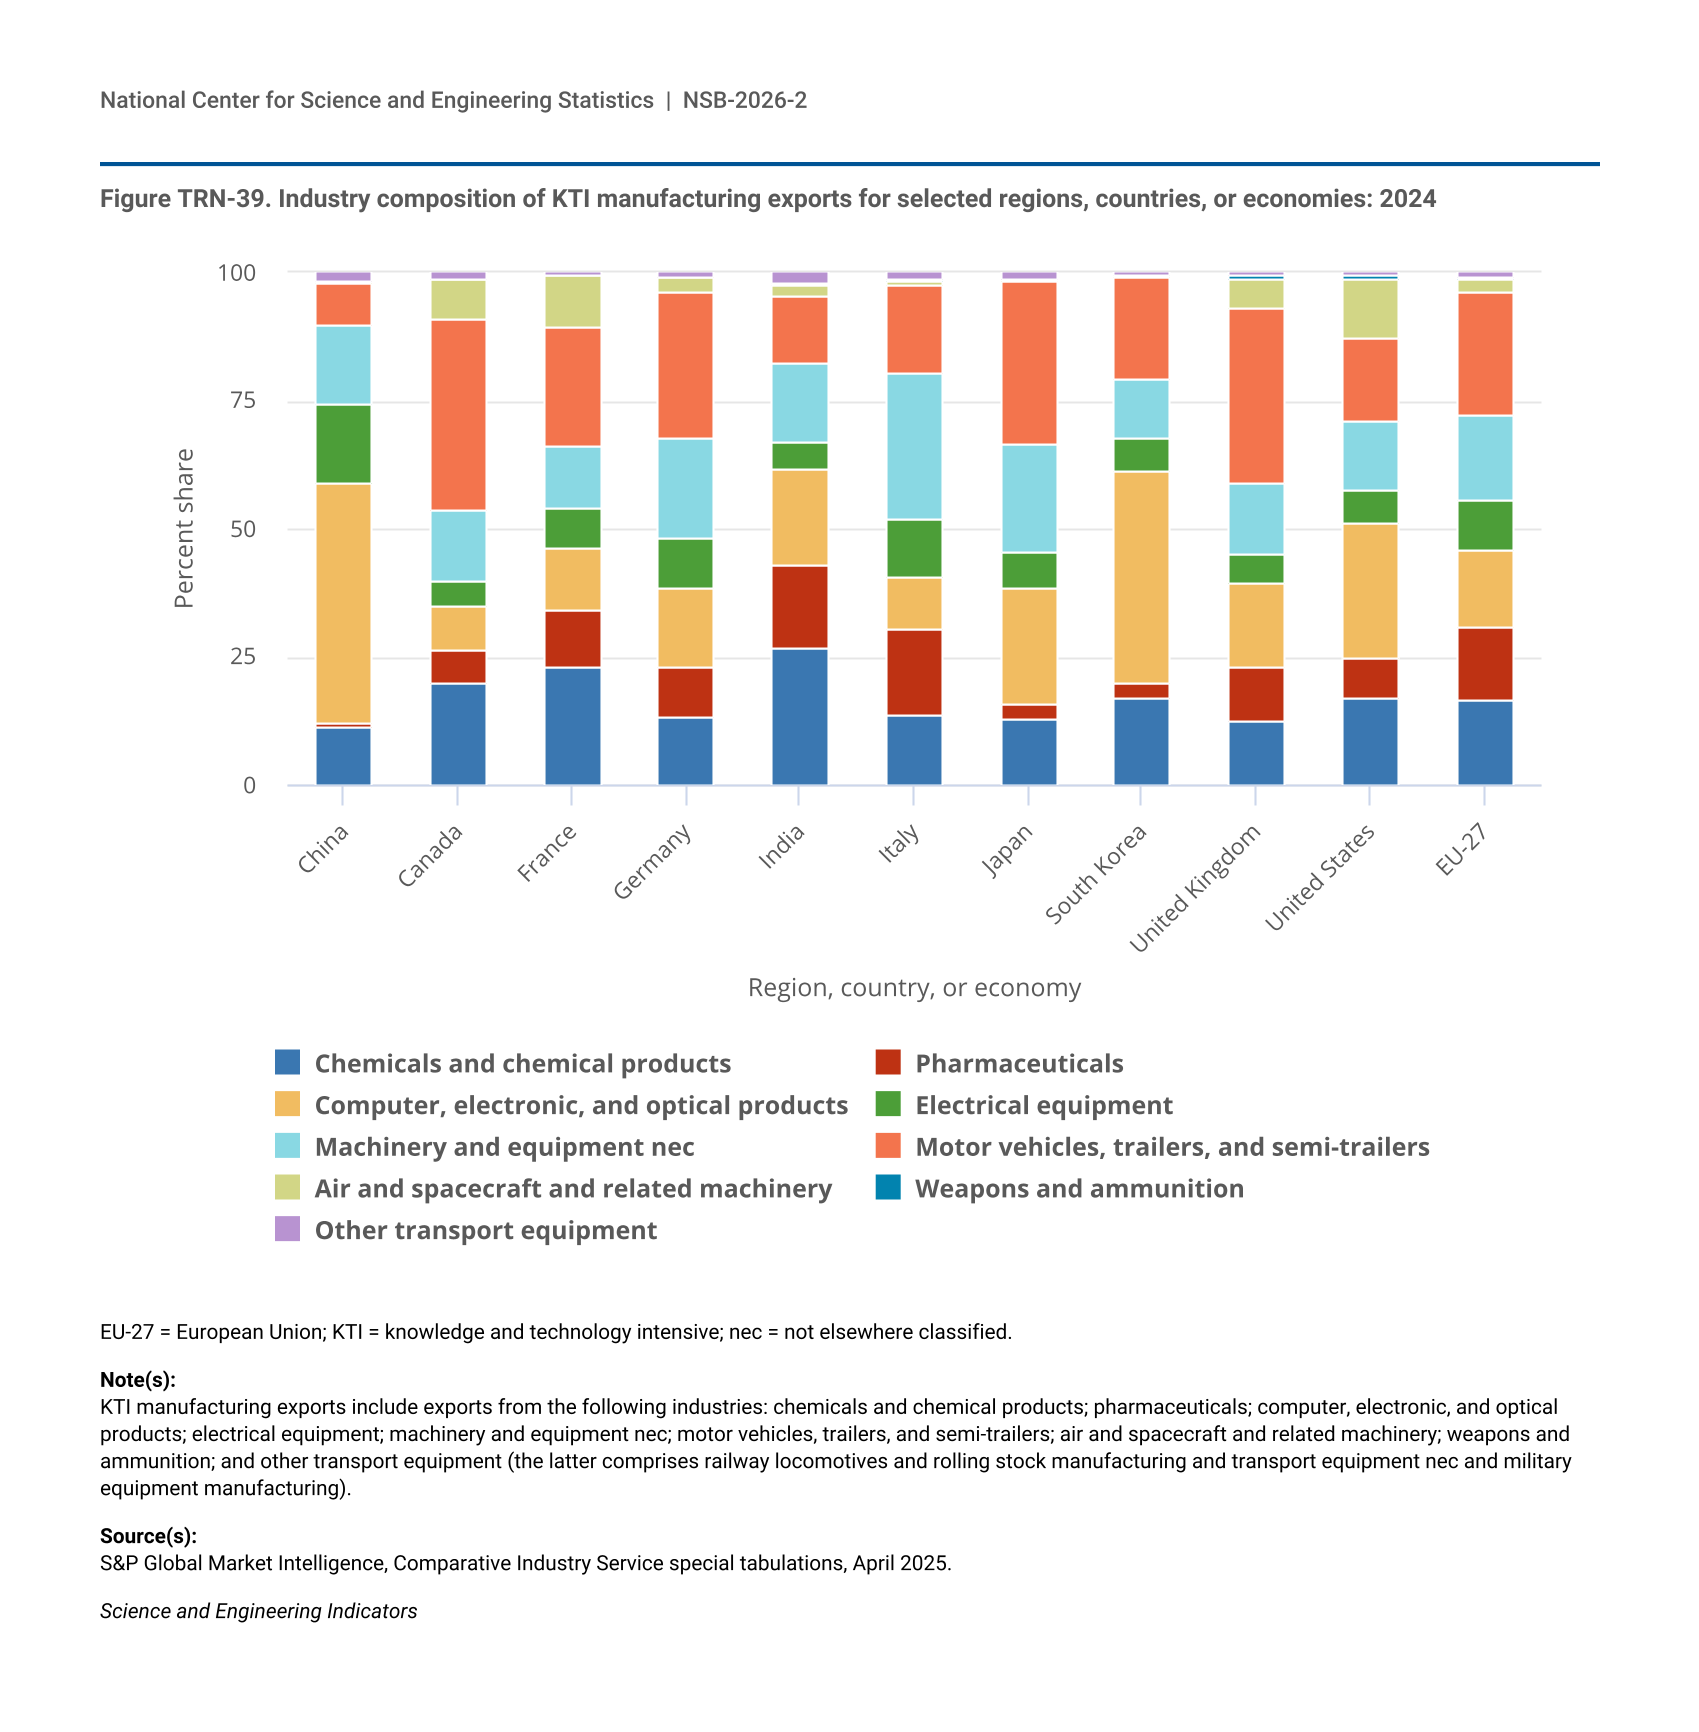
Figure TRN-39.
Industry composition of KTI manufacturing exports for selected regions, countries, or economies: 2024
Industry composition of KTI manufacturing exports for selected regions, countries, or economies: 2024
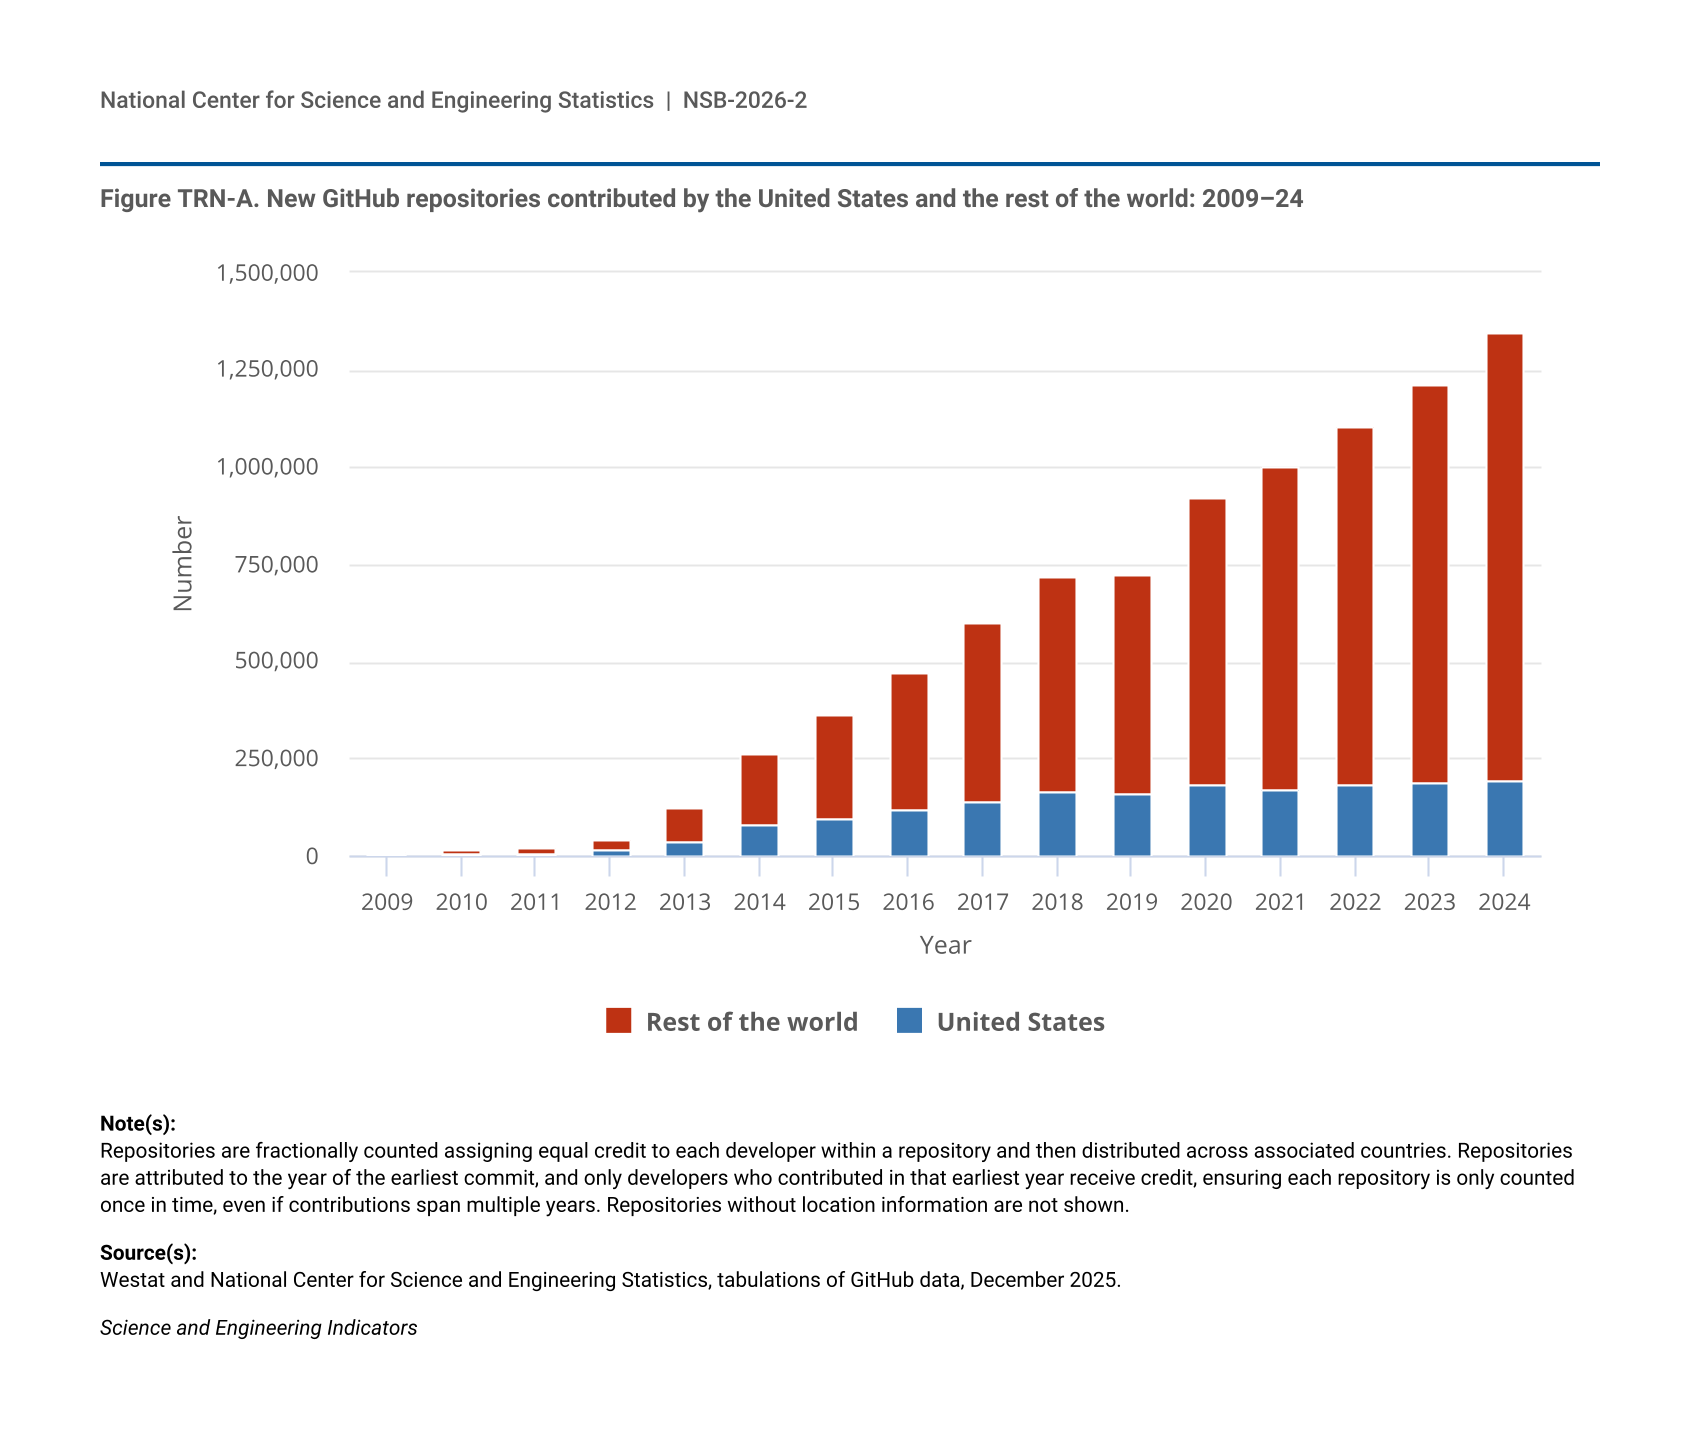
Figure TRN-A.
New GitHub repositories contributed by the United States and the rest of the world: 2009–24
New GitHub repositories contributed by the United States and the rest of the world: 2009–24
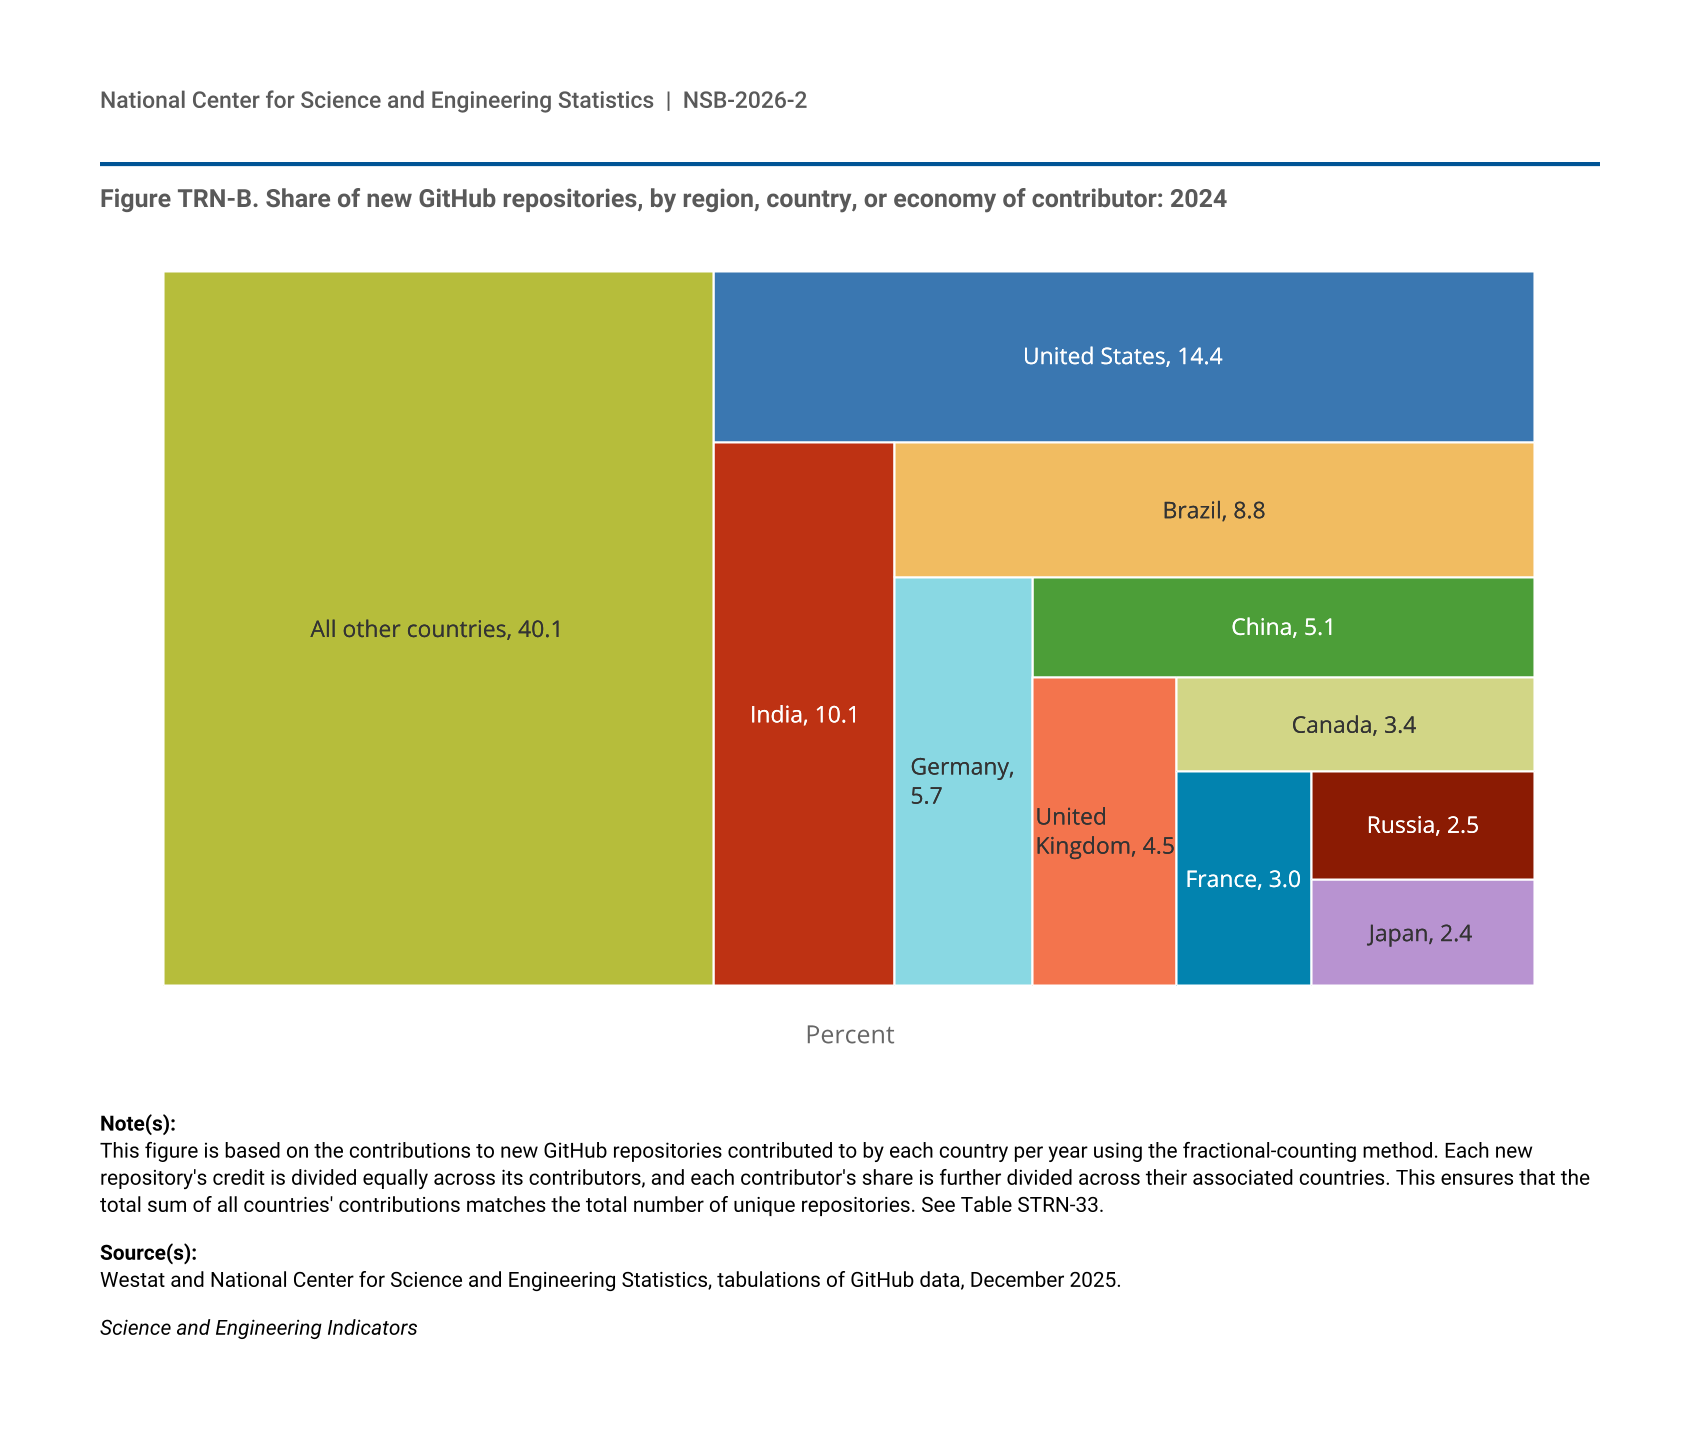
Figure TRN-B.
Share of new GitHub repositories, by region, country, or economy of contributor: 2024
Share of new GitHub repositories, by region, country, or economy of contributor: 2024
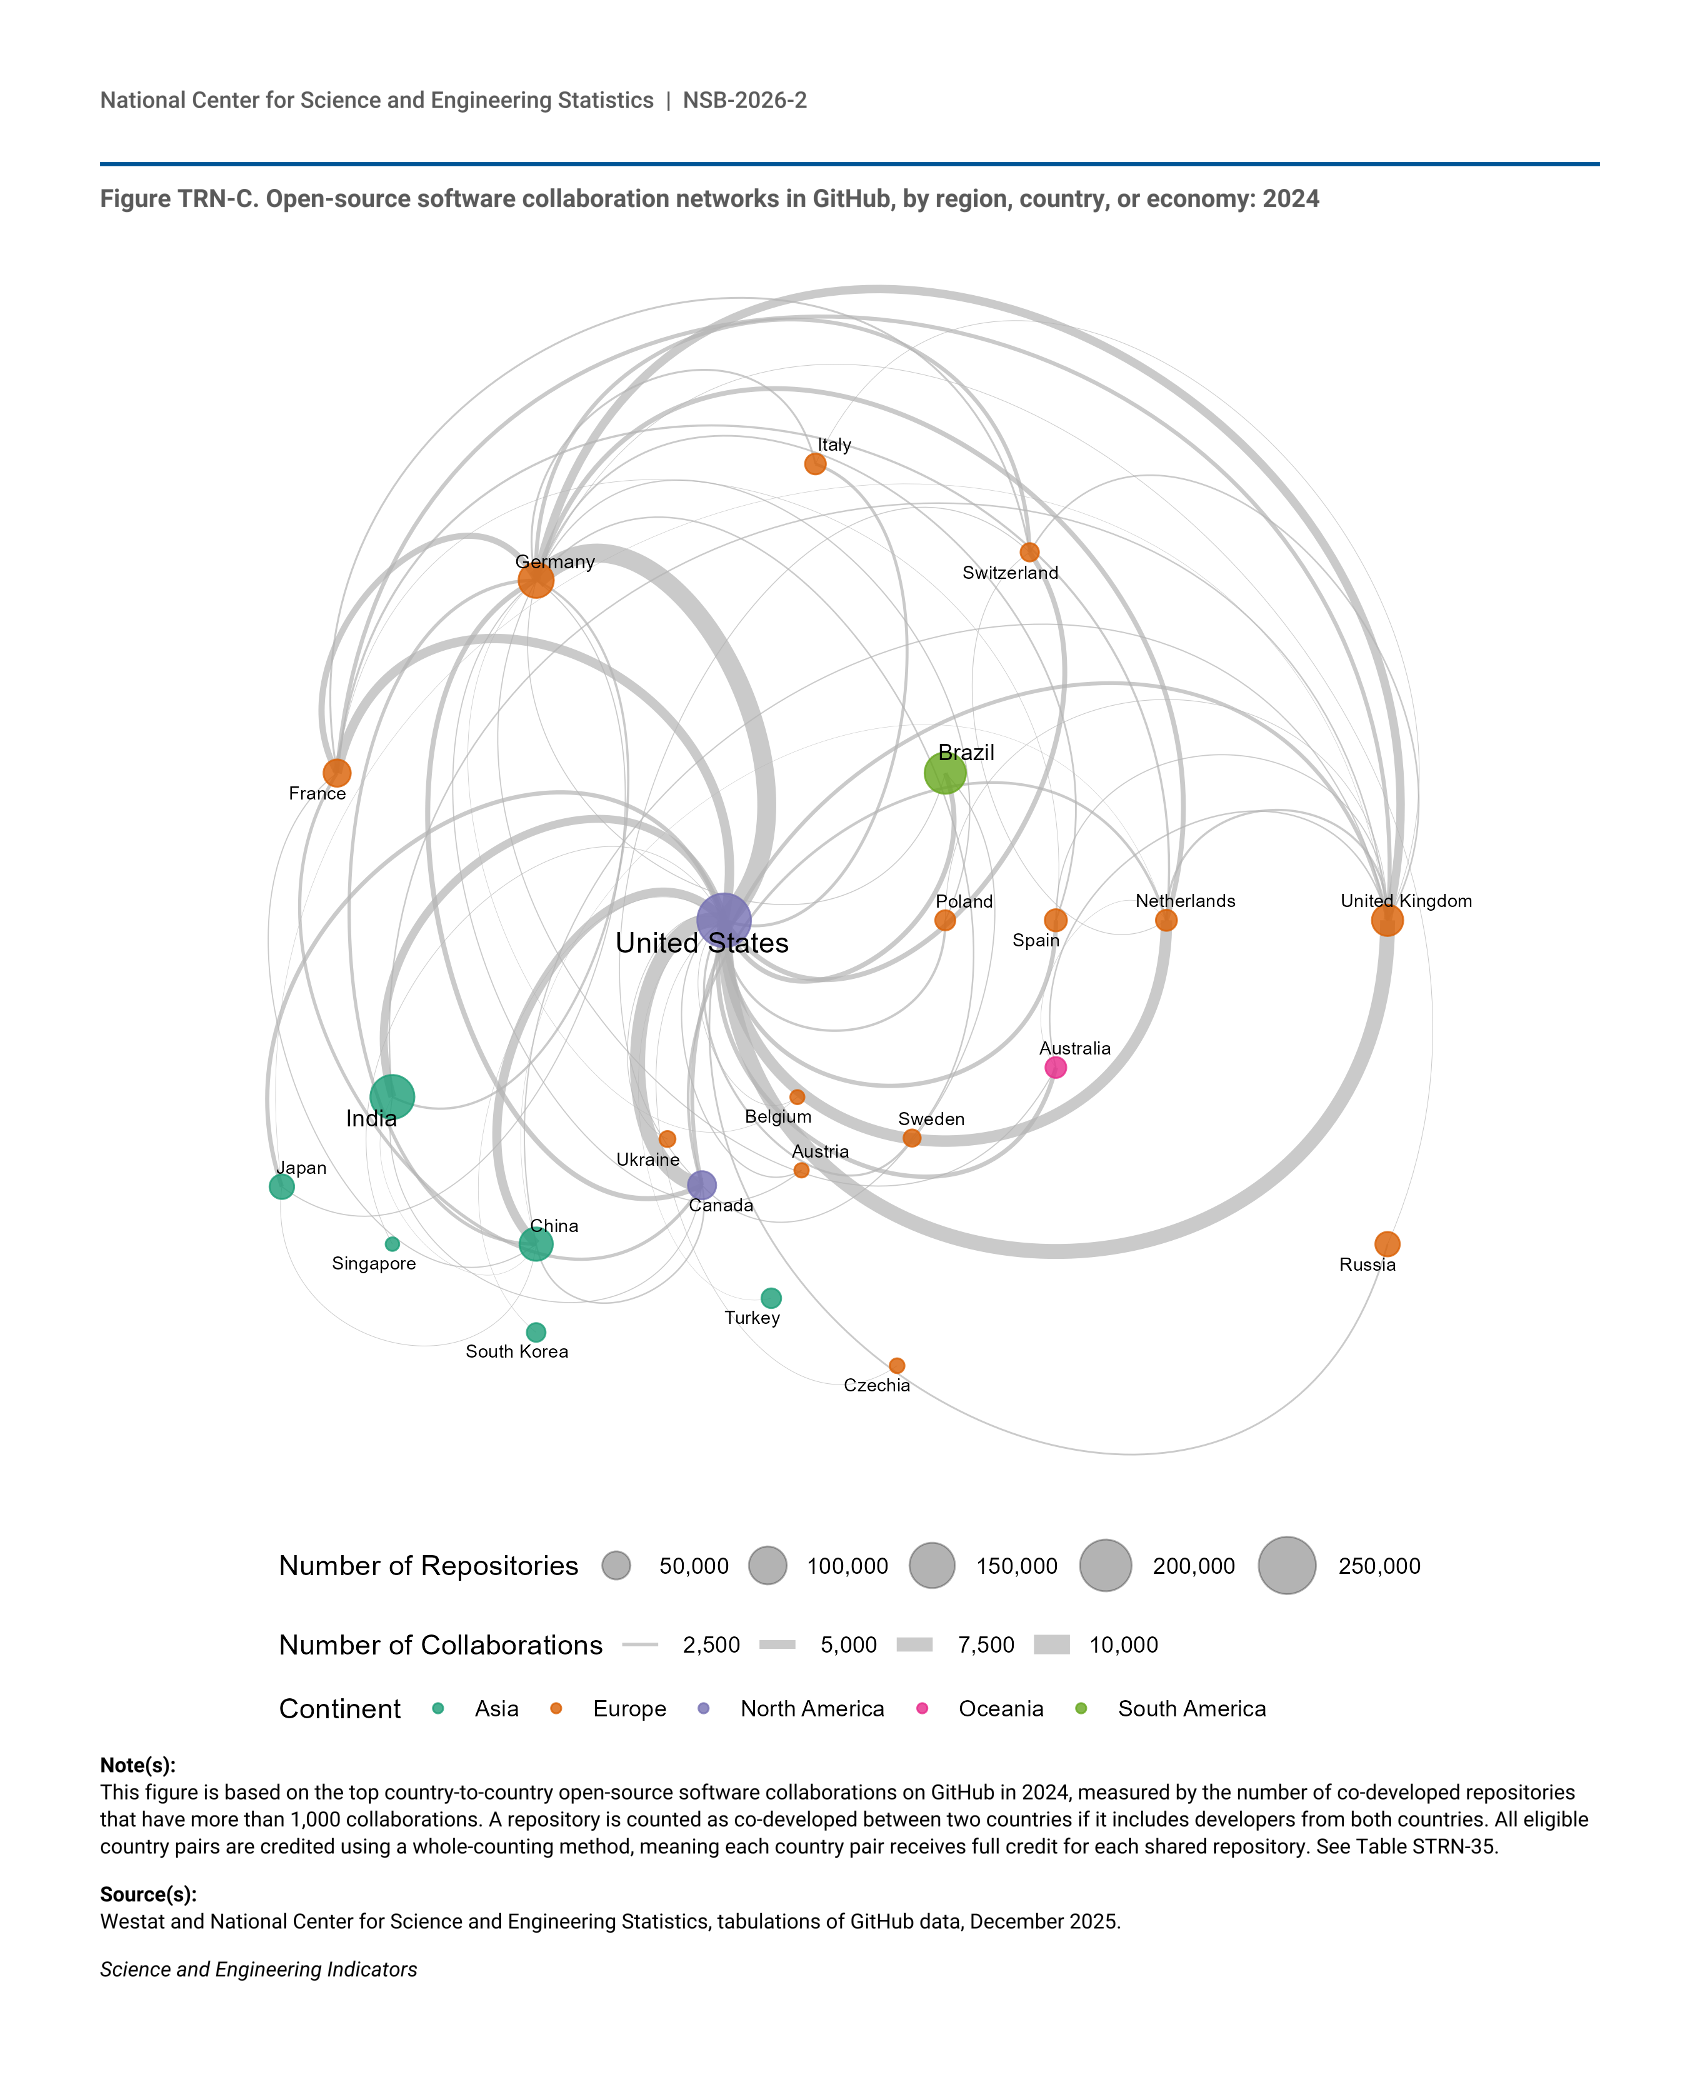
Figure TRN-C.
Open-source software collaboration networks in GitHub, by region, country, or economy: 2024
Open-source software collaboration networks in GitHub, by region, country, or economy: 2024
Data Sources
Item
Title
Provider
Product
Figure SATRN-1
Share of published articles with funding acknowledgment statements: 2002–22
Elsevier
Scopus
Figure TRN-1
Total factor productivity, U.S. nonfarm business sector and information: 2000–24
Bureau of Labor Statistics
Productivity Statistics
Figure TRN-2
Use of artificial intelligence as a production technology for goods and services, by selected industry: 2020-22
National Center for Science and Engineering Statistics
Annual Business Survey
Figure TRN-3
Use of artificial intelligence as a production technology for goods and services, by company size: 2020-22
National Center for Science and Engineering Statistics
Annual Business Survey
Figure TRN-4
University technology licenses or license options executed, by company characteristic: 2014–24
AUTM
AUTM Licensing Activity Survey
Figure TRN-5
Startup companies based on licensed university technology, by company location: 2000–24
AUTM
AUTM Licensing Activity Survey
Figure TRN-6
Citations of U.S. academic S&E articles in USPTO utility patents, by S&E field of the articles cited: 2024
Elsevier
Scopus
Figure TRN-7
USPTO utility patents granted to owners, by nationality and U.S. sector: 2004–24
United States Patent and Trademark Office
PatentsView
Figure TRN-8
Priority patent families granted in artificial intelligence, machine learning, autonomy, and related advances, for the world and China: 2010–24
European Patent Office
PATSTAT
Figure TRN-9
Utility patents granted in artificial intelligence, machine learning, autonomy, and related advances, by selected region, country, or economy: 2024
European Patent Office
PATSTAT
Figure TRN-10
Highly cited patents granted in artificial intelligence, machine learning, autonomy, and related advances, by selected region, country, or economy: 2010 and 2021
European Patent Office
PATSTAT
Figure TRN-11
Priority patent families granted in biotechnology, medical technology, genomics, and synthetic biology, by selected country or economy: 2010–24
European Patent Office
PATSTAT
Figure TRN-12
Utility patents granted in biotechnology, medical technology, genomics, and synthetic biology, by selected country or economy: 2024
European Patent Office
PATSTAT
Figure TRN-13
Highly cited patents granted in biotechnology, medical technology, genomics, and synthetic biology, by selected country or economy: 2010 and 2021
European Patent Office
PATSTAT
Figure TRN-14
Priority patent families granted in semiconductors, by selected country or economy: 2010–24
European Patent Office
PATSTAT
Figure TRN-15
Utility patents granted in semiconductors, by selected country or economy: 2024
European Patent Office
PATSTAT
Figure TRN-15
Utility patents granted in semiconductors, by selected country or economy: 2024
United States Patent and Trademark Office
PatentsView
Figure TRN-16
Highly cited patents granted in semiconductors, by selected country or economy: 2010 and 2021
European Patent Office
PATSTAT
Figure TRN-17
Priority patent families granted in quantum information science and technology, by selected country or economy: 2010–24
European Patent Office
PATSTAT
Figure TRN-18
Utility patents granted in quantum information science and technology, by selected country or economy: 2024
European Patent Office
PATSTAT
Figure TRN-18
Utility patents granted in quantum information science and technology, by selected country or economy: 2024
United States Patent and Trademark Office
PatentsView
Figure TRN-19
Highly cited patents granted in quantum information science and technology, by selected country or economy: 2010 and 2021
European Patent Office
PATSTAT
Figure TRN-20
Priority patent families granted in advanced nuclear technologies, by selected country or economy: 2010–24
European Patent Office
PATSTAT
Figure TRN-21
Utility patents granted in advanced nuclear technologies, by selected country or economy: 2024
European Patent Office
PATSTAT
Figure TRN-21
Utility patents granted in advanced nuclear technologies, by selected country or economy: 2024
United States Patent and Trademark Office
PatentsView
Figure TRN-22
Highly cited patents granted in advanced nuclear technologies, by selected country or economy: 2010 and 2021
European Patent Office
PATSTAT
Figure TRN-23
U.S.-registered USPTO trademarks, by business sector: 2024
Reed Tech, LexisNexis
USPTO Trademark Data
Figure TRN-24
Share of U.S. companies reporting product or business process innovation, by selected industry: 2020–22
National Center for Science and Engineering Statistics
Annual Business Survey
Figure TRN-25
Annual economywide business startups: 2000–23
U.S. Census Bureau
Business Dynamics Statistics
Figure TRN-26
Firms receiving Phase II SBIR or STTR awards: 2013–24
Small Business Administration
SBIR/STTR Awards Data
Figure TRN-27
Firms receiving Phase II SBIR or STTR awards, by awarding agency: 2013–24
Small Business Administration
SBIR/STTR Awards Data
Figure TRN-28
Venture capital investment received by firms headquartered in selected regions, countries, and economies: 2013–24
PitchBook
Venture Capital and Private Equity Database
Figure TRN-29
Venture capital investment received by firms headquartered in the United States, by deal stage: 2003–24
PitchBook
Venture Capital and Private Equity Database
Figure TRN-30
Firms headquartered in the United States receiving venture capital investment, by critical and emerging technologies: 2013–24
PitchBook
Venture Capital and Private Equity Database
Figure TRN-31
Industry share of U.S. total KTI value added, by selected industries: 2002–24
S&P Global
Comparative Industry Service
Figure TRN-32
Country share of global KTI manufacturing value added, by KTI industry: 2024
S&P Global
Comparative Industry Service
Figure TRN-33
Country share of global KTI services value added for selected regions, countries, or economies: 2002–24
S&P Global
Comparative Industry Service
Figure TRN-34
Country share of global KTI manufacturing value added for selected regions, countries, or economies: 2002–24
S&P Global
Comparative Industry Service
Figure TRN-35
Country share of global KTI services value added, by KTI industry: 2024
S&P Global
Comparative Industry Service
Figure TRN-36
Global share of value added for semiconductor manufacturing, by region, country, or economy: 2002–24
S&P Global
Comparative Industry Service
Figure TRN-37
Country share of global KTI manufacturing exports for selected regions, countries, or economies: 2002–24
S&P Global
Comparative Industry Service
Figure TRN-38
Gross exports of KTI manufacturing industries for selected regions, countries, or economies: 2002–24
S&P Global
Comparative Industry Service
Figure TRN-39
Industry composition of KTI manufacturing exports for selected regions, countries, or economies: 2024
S&P Global
Comparative Industry Service
Figure TRN-A
New GitHub repositories contributed by the United States and the rest of the world: 2009–24
GitHub
GitHub Platform
Figure TRN-B
Share of new GitHub repositories, by region, country, or economy of contributor: 2024
GitHub
GitHub Platform
Figure TRN-C
Open-source software collaboration networks in GitHub, by region, country, or economy: 2024
GitHub
GitHub Platform
Table SATRN-1
AUTM institution coverage and response rates: 2014–24
AUTM
AUTM Licensing Activity Survey
Table SATRN-2
AUTM coverage of institutions surveyed in the Higher Education Research and Development Survey: 2014–24
AUTM
AUTM Licensing Activity Survey
Table SATRN-3
Crosswalk of PitchBook industry codes, critical and emerging technology group codes, and industry codes
PitchBook
Venture Capital and Private Equity Database
Table STRN-1
U.S. federal and state agencies cited in the funding acknowledgement section of S&E articles, by citation frequency: 2002–22
Elsevier
Scopus
Table STRN-2
Contributions to New GitHub repositories by selected entities: 2009–24
GitHub
GitHub Platform
Table STRN-3
Annual economywide business startups and startups with licensed university technology: 2000–24
U.S. Census Bureau
Business Dynamics Statistics
Table STRN-4
Citations of S&E articles in USPTO utility patents, by cited field, cited author country, and patent sector: 2013–24
Elsevier
Scopus
Table STRN-4
Citations of S&E articles in USPTO utility patents, by cited field, cited author country, and patent sector: 2013–24
United States Patent and Trademark Office
PatentsView
Table STRN-5
S&E articles with authors at federal agencies cited by granted U.S. patents, by author's affiliated agency: 2013–24
Elsevier
Scopus
Table STRN-5
S&E articles with authors at federal agencies cited by granted U.S. patents, by author's affiliated agency: 2013–24
United States Patent and Trademark Office
PatentsView
Table STRN-6
Patents granted to U.S. federal agencies, by inventor's agency of employment: 2013–24
United States Patent and Trademark Office
PatentsView
Table STRN-7
Scholarly publications with authors from U.S. federal agencies, by S&E discipline: 2013–24
Elsevier
Scopus
Table STRN-8
S&E articles with authors from U.S. federal agencies, by author's affiliated agency: 2013–24
Elsevier
Scopus
Table STRN-9
S&E articles with authors at federal agencies cited by granted U.S. patents, by article field: 2013–24
Elsevier
Scopus
Table STRN-9
S&E articles with authors at federal agencies cited by granted U.S. patents, by article field: 2013–24
United States Patent and Trademark Office
PatentsView
Table STRN-10
Patents granted to U.S. federal agencies, by technology area: 2013–24
United States Patent and Trademark Office
PatentsView
Table STRN-11
USPTO utility patents granted to owners, by sector: 2000–24
United States Patent and Trademark Office
PatentsView
Table STRN-13
Mapping of critical technologies to CPC codes
United States Patent and Trademark Office
PatentsView
Table STRN-14
Patent citation index of international patent families granted in critical technology categories, by selected region, country, or economy of patent inventor: 2021
United States Patent and Trademark Office
PatentsView
Table STRN-15
Priority patent families granted in artificial intelligence, machine learning, autonomy, and related advances for the top 20 most-patenting regions, countries, or economies: 2010–24
European Patent Office
PATSTAT
Table STRN-16
USPTO utility patents granted in artificial intelligence, machine learning, autonomy, and related advances for the top 20 most-patenting regions, countries, or economies: 2010–24
United States Patent and Trademark Office
PatentsView
Table STRN-17
Highly cited patents in artificial intelligence, machine learning, autonomy, and related advances for the top 20 most-patenting regions, countries, or economies: 2010–21
European Patent Office
PATSTAT
Table STRN-18
Priority patent families granted in biotechnology, medical technology, genomics, and synthetic biology for the top 20 most-patenting regions, countries, or economies: 2010–24
European Patent Office
PATSTAT
Table STRN-19
USPTO utility patents granted in biotechnology, medical technology, genomics, and synthetic biology for the top 20 most-patenting regions, countries, or economies: 2010–24
United States Patent and Trademark Office
PatentsView
Table STRN-20
Highly cited patents in biotechnology, medical technology, genomics, and synthetic biology for the top 20 most-patenting regions, countries, or economies: 2010–21
European Patent Office
PATSTAT
Table STRN-21
Priority patent families granted in semiconductors for the top 20 most-patenting regions, countries, or economies: 2010–24
European Patent Office
PATSTAT
Table STRN-22
USPTO utility patents granted in semiconductors for the top 20 most-patenting regions, countries, or economies: 2010–24
United States Patent and Trademark Office
PatentsView
Table STRN-23
Highly cited patents in semiconductors for the top 20 most-patenting regions, countries, or economies: 2010–21
European Patent Office
PATSTAT
Table STRN-24
Priority patent families granted in quantum information science and technology for the top 20 most-patenting regions, countries, or economies: 2010–24
European Patent Office
PATSTAT
Table STRN-25
USPTO utility patents granted in quantum information science and technology for the top 20 most-patenting regions, countries, or economies: 2010–24
United States Patent and Trademark Office
PatentsView
Table STRN-26
Highly cited patents in quantum information science and technology for the top 20 most-patenting regions, countries, or economies: 2010–21
European Patent Office
PATSTAT
Table STRN-27
Priority patent families granted in advanced nuclear technologies for the top 20 most-patenting regions, countries, or economies: 2010–24
European Patent Office
PATSTAT
Table STRN-28
USPTO utility patents granted in advanced nuclear technologies for the top 20 most-patenting regions, countries, or economies: 2010–24
United States Patent and Trademark Office
PatentsView
Table STRN-29
Highly cited patents in advanced nuclear technologies for the top 20 most-patenting regions, countries, or economies: 2010–21
European Patent Office
PATSTAT
Table STRN-30
Registered USPTO trademarks, by region, country, or economy: 2000–24
Reed Tech, LexisNexis
USPTO Trademark Data
Table STRN-31
Nice Classifications in trademark data, by business sector: 2000–24
World Intellectual Property Organization
Nice Classification
Table STRN-32
U.S.-registered USPTO trademarks, by Nice Classification: 2000–24
Reed Tech, LexisNexis
USPTO Trademark Data
Table STRN-33
New GitHub repositories contributed to, by selected region, country, or economy: 2009–24
GitHub
GitHub Platform
Table STRN-34
Total GitHub repositories contributed to by selected entities: 2009–24
GitHub
GitHub Platform
Table STRN-35
Open-source software collaboration networks in GitHub, by region, country, or economy: 2024
GitHub
GitHub Platform
Table STRN-36
Open-source software repositories contributed to in GitHub, by country of contributor: 2024
GitHub
GitHub Platform
Table STRN-37
Venture capital investment, by region, country, or economy of receiving firm: 2013–24
PitchBook
Venture Capital and Private Equity Database
Table STRN-38
Firms headquartered in the United States receiving venture capital investment, by industry: 2013–24
PitchBook
Venture Capital and Private Equity Database
Table STRN-41
Value added, by industry, for the world and for selected economies: 2002–24
S&P Global
Comparative Industry Service
Table STRN-42
KTI value added, GDP, and KTI value added as a share of domestic GDP for selected economies: 2002–24
S&P Global
Comparative Industry Service
Table STRN-43
Gross exports of goods trade, for the world and for selected economies: 2002–24
S&P Global
Comparative Industry Service
Table STRN-44
KTI manufacturing exports as a share of total manufacturing exports for selected economies: 2002–24
S&P Global
Comparative Industry Service
Table STRN-45
KTI manufacturing exports, imports, and trade balance for selected economies: 2002–24
S&P Global
Comparative Industry Service
Table TRN-2
U.S. federal agencies cited in the funding acknowledgement section of S&E articles, by citation frequency: 2002–22
Elsevier
Scopus
Table TRN-3
U.S. federal agency activity in granted patents, S&E articles, and articles cited by patents, by inventor's or author's affiliated agency: 2013–24
Elsevier
Scopus
Table TRN-3
U.S. federal agency activity in granted patents, S&E articles, and articles cited by patents, by inventor's or author's affiliated agency: 2013–24
United States Patent and Trademark Office
PatentsView
Table TRN-4
Top cited organizations at USPTO, according to the share of patents in top 1% most cited: 2021
United States Patent and Trademark Office
PatentsView
Table TRN-5
Top venture capital–funded firms headquartered in the United States: 2024
PitchBook
Venture Capital and Private Equity Database
Table TRN-6
Global KTI industries, by value added and share of global GDP: 2018–24
S&P Global
Comparative Industry Service