Report
Notes
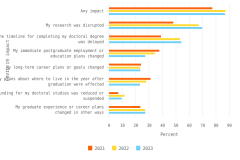
1 The analysis on the effect of the COVID-19 pandemic on doctorate recipients is limited to the 51,173 doctorate recipients in 2023 who were asked about the impact of the pandemic on their graduate experience.
2 The calculation of these proportions excluded doctorate recipients who did not report citizenship. Counts of unreported citizenship fluctuated between 610 and 3,022.
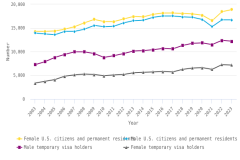
3 The exact percentage of women among all doctorate awards in figure 3, which excludes respondents who did not report sex or citizenship, is 47.48%.
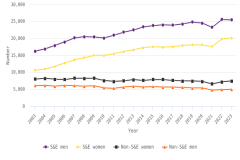
4 The calculation of these proportions excluded respondents who did not report sex or citizenship.
5 For detailed data on racial and ethnic representation, see National Center for Science and Engineering Statistics. 2023. Diversity and STEM: Women, Minorities, and Persons with Disabilities: 2023. NSF 23-315. Alexandria, VA: U.S. National Science Foundation. Available at https://ncses.nsf.gov/pubs/nsf23315.
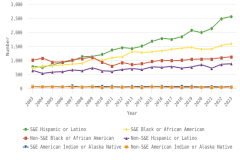
6 For additional data on the race and ethnicity of doctorate recipients, see SED 2023 related detailed table 1-11. Race categories exclude Hispanic origin; Hispanic may be any race. From 2003 to 2023, counts of unreported race or ethnicity fluctuated between 434 and 982.
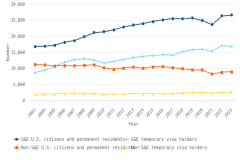
7 In 2003, there were 16,867 S&E U.S. citizen and permanent resident doctorate recipients; in 2023, there were 26,622 (see figure 2).
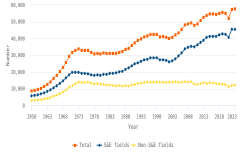
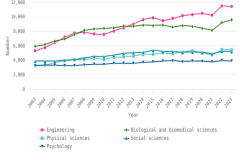
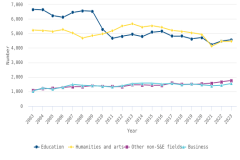
8 The proportion of doctorate recipients by trend broad field out of all doctorate recipients can be derived using data from figure 1 and figure 6.
9 Beginning in 2021, field of doctorate data are collected using a modified version of the 2020 Classification of Instructional Programs (CIP) codes and reported using a new SED-specific taxonomy (table A-4). For more details on data comparability, see the 2023 “Technical Notes” and the SED 2021 Taxonomy Changes Working Paper.
10 Other non-S&E fields include fields such as communications and journalism, public administration and social services, and multidisciplinary/interdisciplinary studies. Some of the overall increase in “other non-S&E fields” after 2021 may be due to the changes in the SED taxonomy in 2021 (see “Data source” section for details).
11 The drop in the number of doctorate recipients in the field of education between 2009 and 2011 is at least partly attributable to the reclassification of Doctor of Education (EdD) programs. For details, see “Time series data changes” in the “Data source” section.
12 The data in this section are based on the trend broad fields, that is, the set of broad fields used for trend data across all years that offer data that are generally comparable across years. However, the increase in the number of doctorate recipients in non-S&E fields between 2021 and 2023 can also be observed when comparing the data on non-S&E fields using the SED-CIP taxonomy implemented since the 2021 SED.
13 For additional data by citizenship status of doctorate recipients, see related detailed table 1-6.
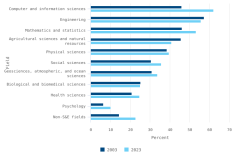
14 In non-S&E fields, the proportion of temporary visa holders increased the most in business, from 37% in 2003 to 53% in 2023. See detailed table 1-6.
15 For detailed data on racial and ethnic representation, see Diversity and STEM: Women, Minorities, and Persons with Disabilities: 2023.
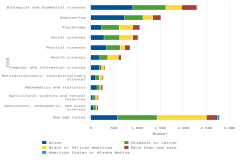
16 In 2023, the count of White doctorate recipients in each field is as follows: biological and biomedical sciences (4,549); engineering (2,875); physical sciences (2,183); social sciences (1,950); psychology (2,005); health sciences (1,199); mathematics and statistics (648); geosciences, atmospheric, and ocean sciences (597); computer and information sciences (475); multidisciplinary/interdisciplinary sciences (526); agricultural sciences and natural resources (578); non-S&E fields (5,472). See also SED 2023 related detailed table 3-4.
17 For additional details by field, see SED 2023 related detailed table 1-11.
18 For additional data on the fields of education, humanities and arts, and other non-S&E fields, see SED 2023 related detailed table 1-4.
19 For data on doctorate recipients with definite postgraduation commitments for employment or postdoctoral training, see SED 2023 related detailed table 2-1.
20 See SED 2023 related detailed table 2-1.
21 See SED 2023 related detailed table 2-1.
22 In 2023, 35,280 of the 57,862 doctorate recipients had definite employment or postdoctoral training commitments in the United States; 13,176 of those reporting their postgraduation location as the United States either did not have definite commitments or did not report their status. Of the 35,280 who reported definite employment or postdoctoral training, 22,462 (64%) had definite commitments in employment, and 12,818 (36%) in postdoc positions.
23 For data on doctorate recipients with definite postgraduation employment commitments in academia, see SED 2023 related detailed table 2-6. Academia includes 4-year colleges or universities; medical schools; university-affiliated research institutes; community or 2-year colleges; and foreign educational institutions.
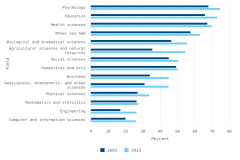
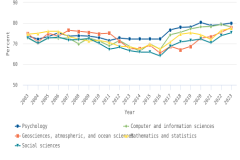
24 In 2003, 226 of 325 doctorate recipients in mathematics and statistics had non-postdoc academic employment commitments, compared to 220 out of 814 doctorate recipients in 2023. In 2003, 235 out of 400 doctorate recipients in computer and information sciences had non-postdoc academic employment commitments, compared to 299 out of 1,385 doctorate recipients. These counts are the underlying numbers used to calculate the percentages in related detailed table 2-6.
25 For data on doctorate recipients with definite postgraduation employment commitments in industry or business, see related detailed table 2-6.
26 For a discussion on recent trends in employment commitment, please see Heuer R, Einaudi P, Kang K; National Center for Science and Engineering Statistics (NCSES). 2023. Research Doctorate Conferrals Rebound, Leading to Record Number of U.S. Doctorate Recipients in 2022. NSF 23-353. Alexandria, VA: U.S. National Science Foundation. Available at https://ncses.nsf.gov/pubs/nsf23353/.
27 In 2023, 10,212 of 12,041 S&E temporary visa holder doctorate recipients reported that the location of their postdoc or employment position was in the United States, compared with 4,063 of 5,676 S&E temporary visa holder doctorate recipients in 2003.
 An official website of the United States government


