 An official website of the United States government
 Data
Tables
Number
Title
Download
View
Number1
1
U.S. R&D expenditures, by type of R&D: Selected years, 2000–24
TitleU.S. R&D expenditures, by type of R&D: Selected years, 2000–24
Number2
2
Workforce, occupational groups, and examples
TitleWorkforce, occupational groups, and examples
Number3
3
Average and percentile student scores on the grade 8 NAEP science assessment: 2009–24
TitleAverage and percentile student scores on the grade 8 NAEP science assessment: 2009–24
Number4
4
Median earnings of full-time, year-round workers, by educational attainment and occupational group: 2024
TitleMedian earnings of full-time, year-round workers, by educational attainment and occupational group: 2024
Number5
5
Select characteristics of veterans and nonveterans: 2024
TitleSelect characteristics of veterans and nonveterans: 2024
Number6
6
U.S. federal agencies cited in the funding acknowledgment section of S&E articles, by citation frequency: 2002–23
TitleU.S. federal agencies cited in the funding acknowledgment section of S&E articles, by citation frequency: 2002–23
Number7
7
Top patenting organizations at the USPTO: 2024
TitleTop patenting organizations at the USPTO: 2024
NumberS1
S1
S&E degrees as a percentage of total degrees awarded: 2014 and 2024
TitleS&E degrees as a percentage of total degrees awarded: 2014 and 2024
NumberS2
S2
S&E graduate degrees awarded, by field: 2014 and 2024
TitleS&E graduate degrees awarded, by field: 2014 and 2024
NumberS3
S3
S&E and S&E-related degrees awarded, by sex, field, and degree level: 2024
TitleS&E and S&E-related degrees awarded, by sex, field, and degree level: 2024
NumberS4
S4
S&E doctoral degrees awarded, by sex and field: 2024
TitleS&E doctoral degrees awarded, by sex and field: 2024
NumberS5
S5
Race and ethnicity of U.S. resident population, ages 20–34, and U.S. citizen and permanent resident S&E award recipients, by degree level: 2024
TitleRace and ethnicity of U.S. resident population, ages 20–34, and U.S. citizen and permanent resident S&E award recipients, by degree level: 2024
NumberS6
S6
Degrees awarded, by degree level, citizenship status, and field: 2024
TitleDegrees awarded, by degree level, citizenship status, and field: 2024
NumberS7
S7
Size of the workforce, by occupational group: 2014–24
TitleSize of the workforce, by occupational group: 2014–24
NumberS8
S8
Projected employment size, by occupational group: 2024 and 2034
TitleProjected employment size, by occupational group: 2024 and 2034
NumberS9
S9
Unemployment rate, by occupational group: 2014–24
TitleUnemployment rate, by occupational group: 2014–24
NumberS10
S10
Workers, by state, occupational group, and educational attainment: 2024
TitleWorkers, by state, occupational group, and educational attainment: 2024
NumberS12
S12
Industries with R&D intensity higher than the average across industries: 2023
TitleIndustries with R&D intensity higher than the average across industries: 2023
NumberS13
S13
Workers, by occupational group and industry type: 2024
TitleWorkers, by occupational group and industry type: 2024
NumberS14
S14
Workers, by occupational group, sex, and race and ethnicity: 2024
TitleWorkers, by occupational group, sex, and race and ethnicity: 2024
NumberS15
S15
Workers, by occupational group, place of birth, and selected region, country, or economy of origin: 2024
TitleWorkers, by occupational group, place of birth, and selected region, country, or economy of origin: 2024
NumberS16
S16
Citizenship status of STEM workers with a bachelor's degree or higher, by occupational group and educational attainment: 2023
TitleCitizenship status of STEM workers with a bachelor's degree or higher, by occupational group and educational attainment: 2023
NumberS17
S17
S&E articles in all fields combined, by coauthorship attribute and selected region, country, or economy: 2002–24
TitleS&E articles in all fields combined, by coauthorship attribute and selected region, country, or economy: 2002–24
NumberS18
S18
U.S. international articles with coauthor from selected countries: Selected years, 2004–24
TitleU.S. international articles with coauthor from selected countries: Selected years, 2004–24
Figures
Thumbnail
Number & Title
Download
View
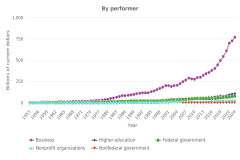
Figure 1.
U.S. R&D expenditures, by performer or funder: 1953–2024
U.S. R&D expenditures, by performer or funder: 1953–2024
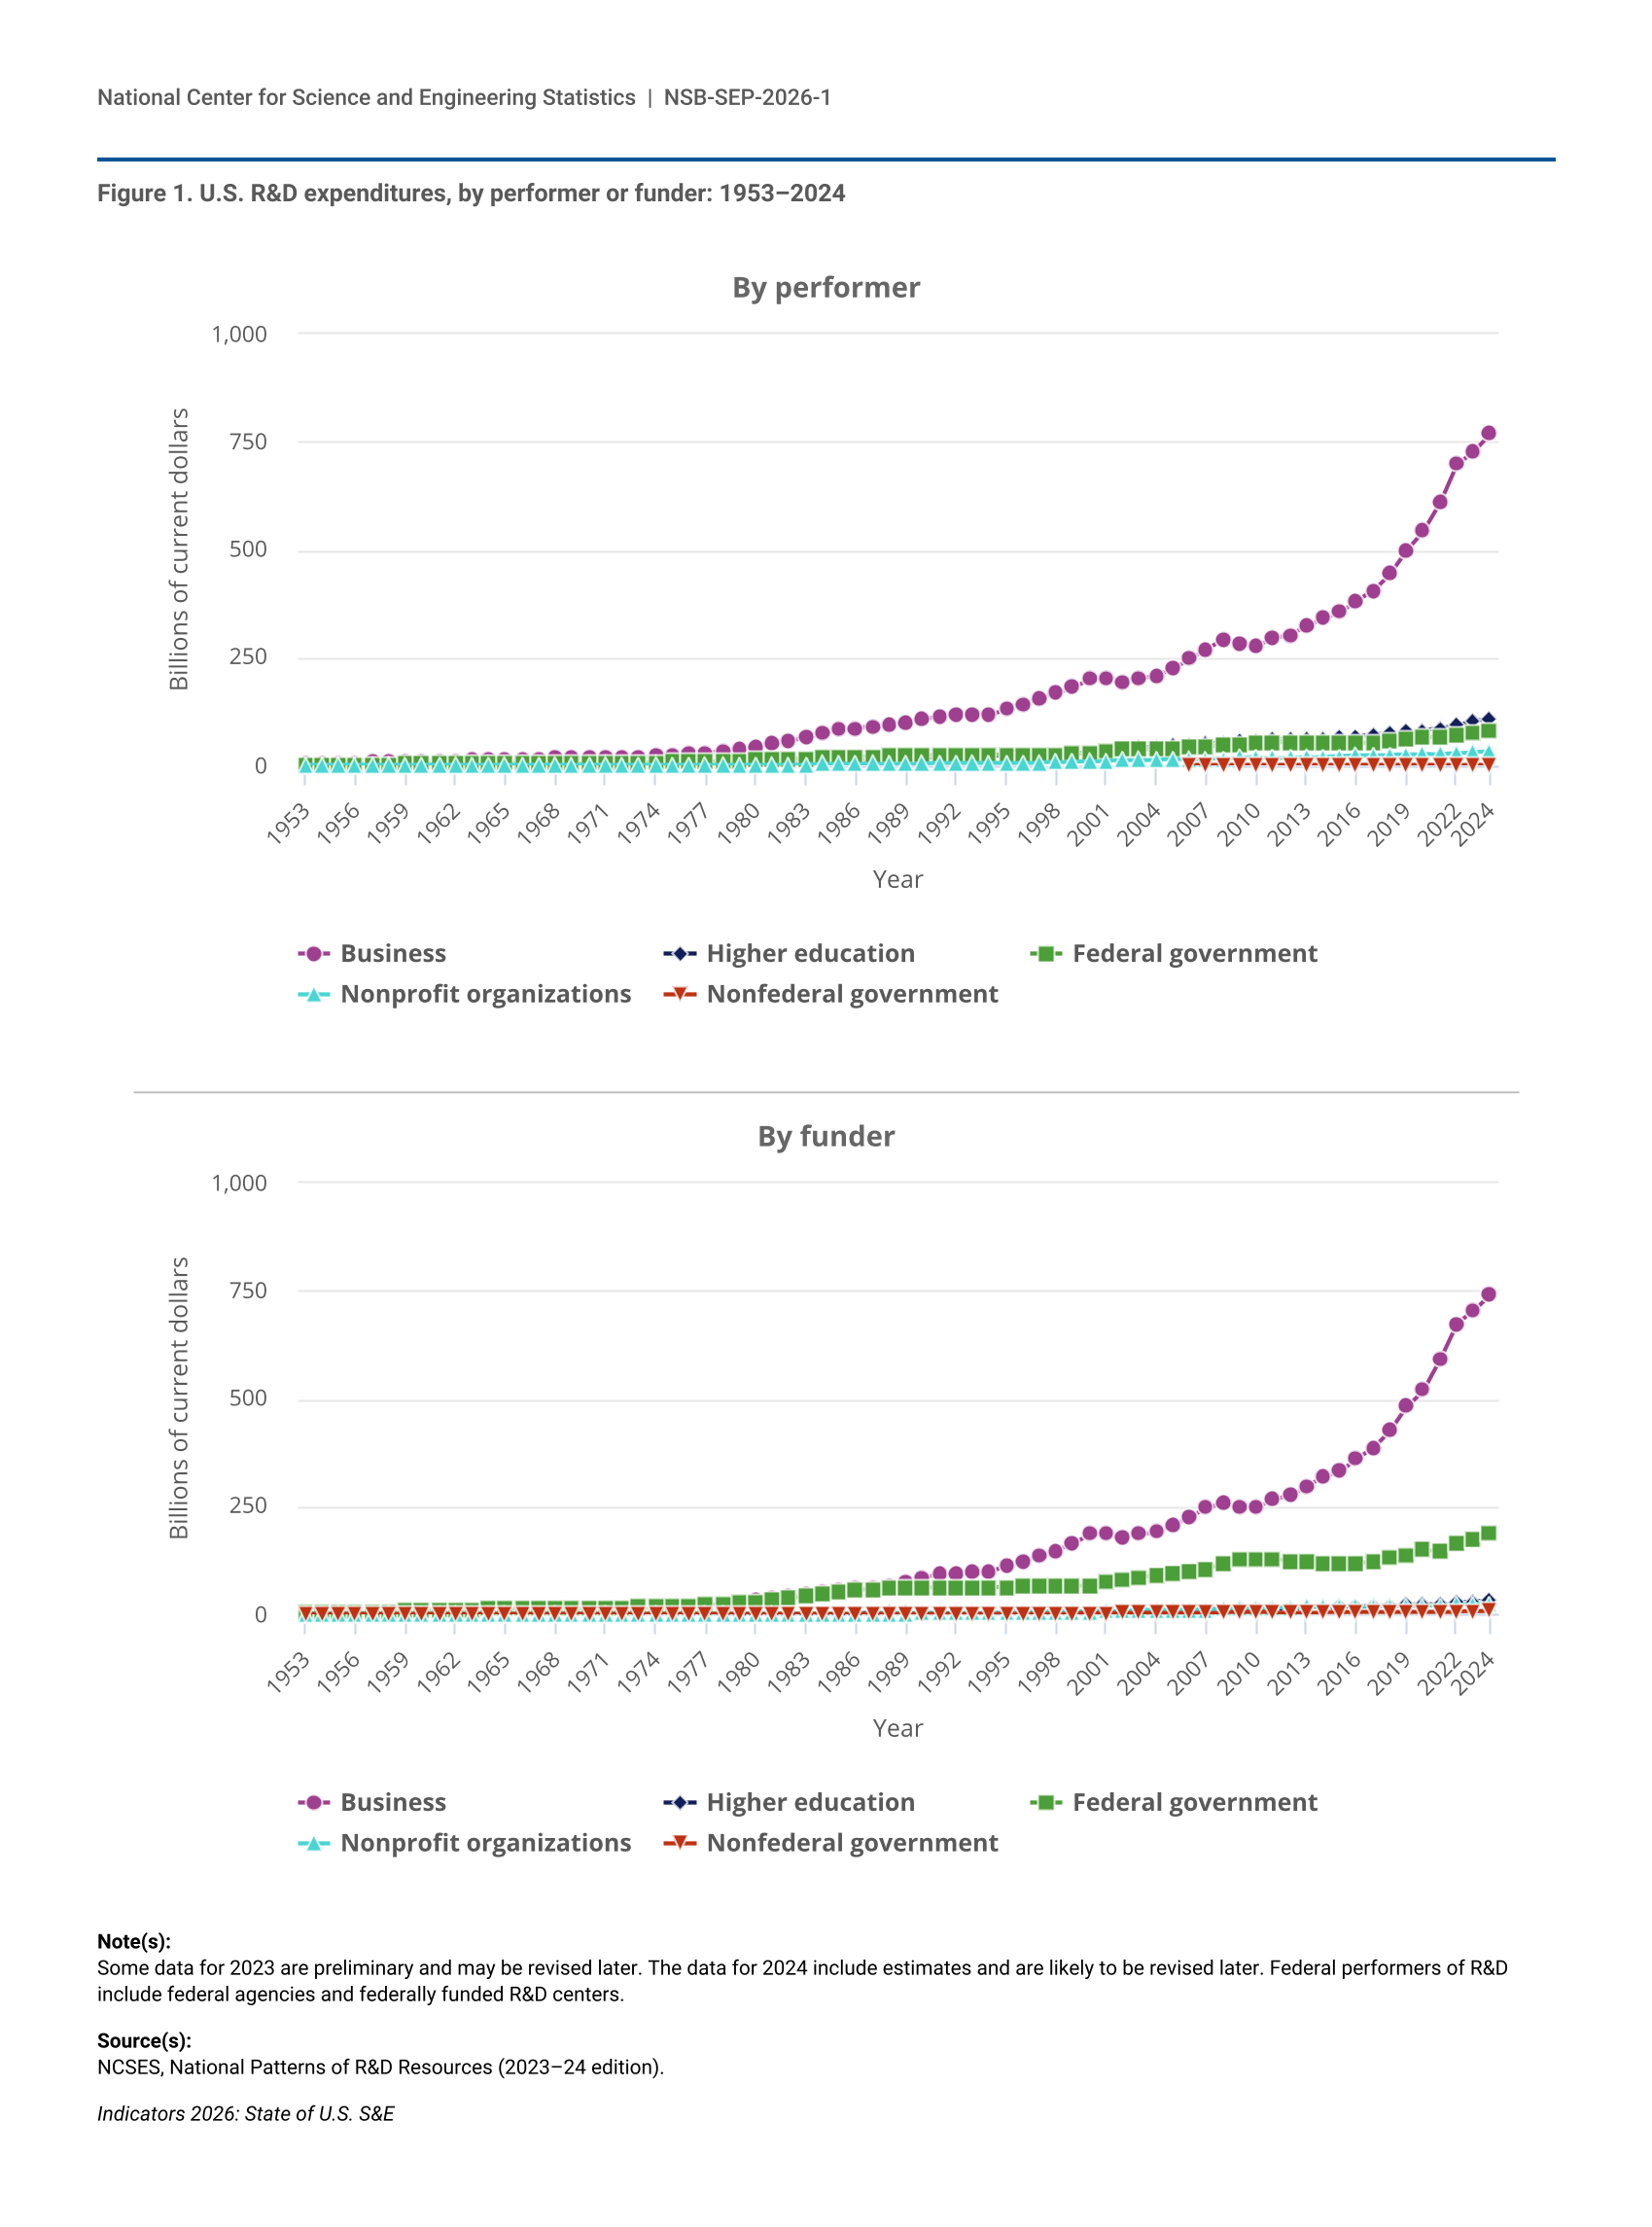
Figure 2.
Federal obligations for research and development, top 5 agencies: FYs 2000–25
Federal obligations for research and development, top 5 agencies: FYs 2000–25
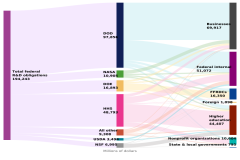
Figure 3.
Federal obligations for research and experimental development, by agency and performer: FY 2024
Federal obligations for research and experimental development, by agency and performer: FY 2024
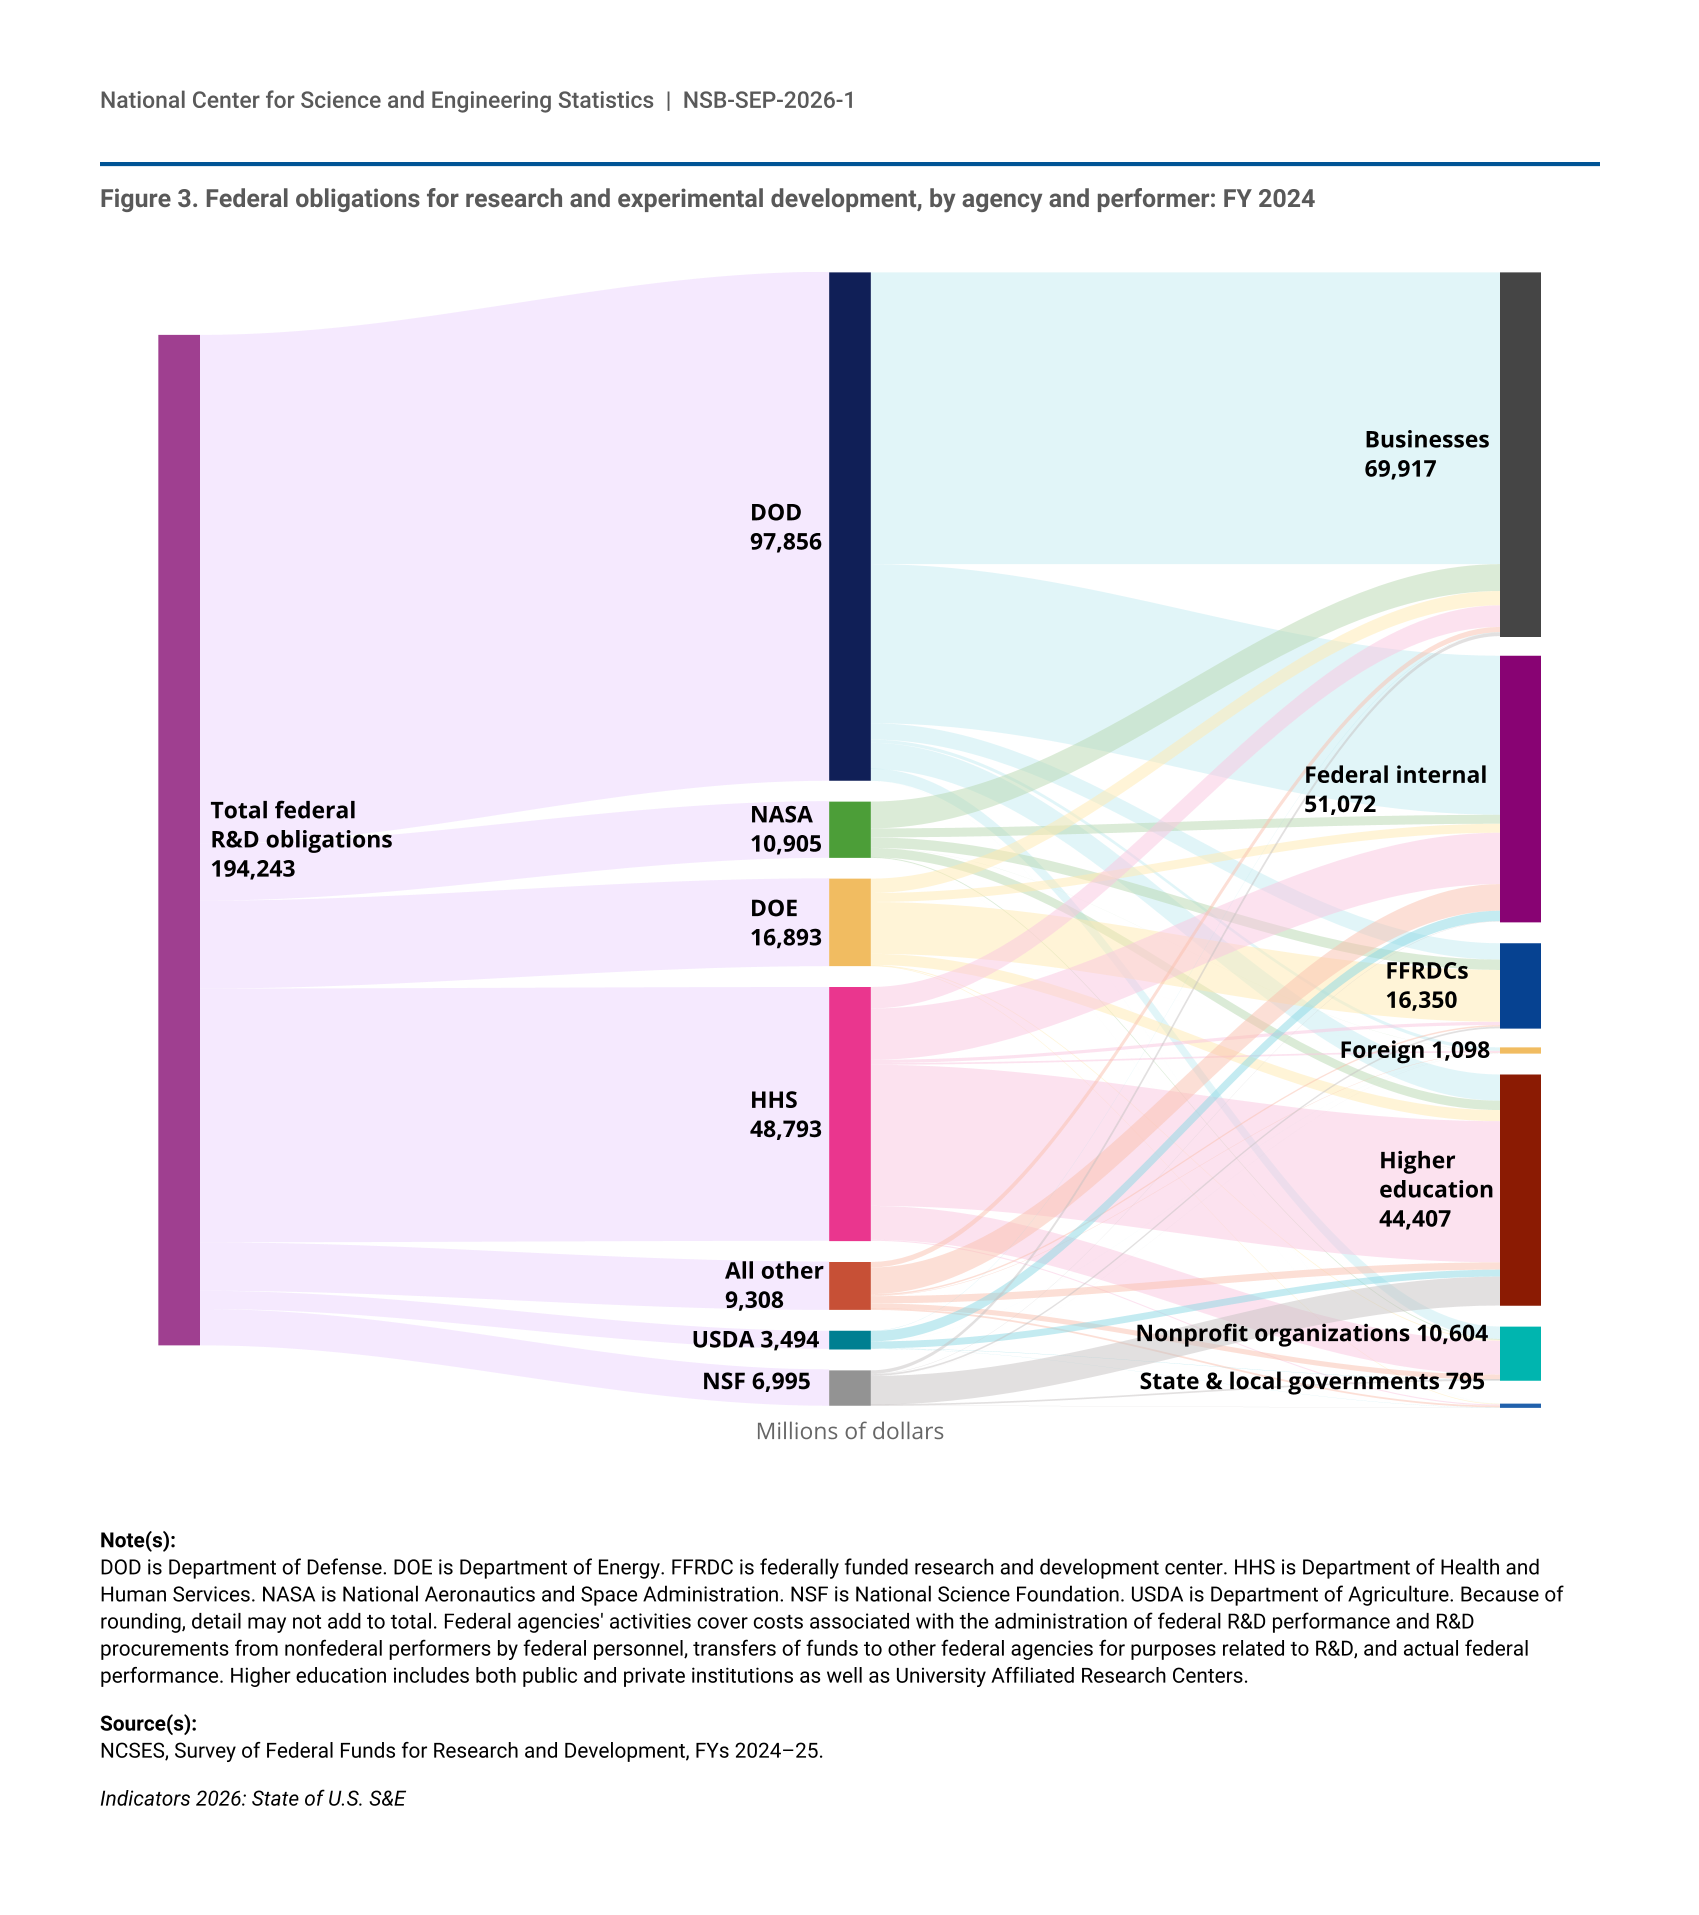
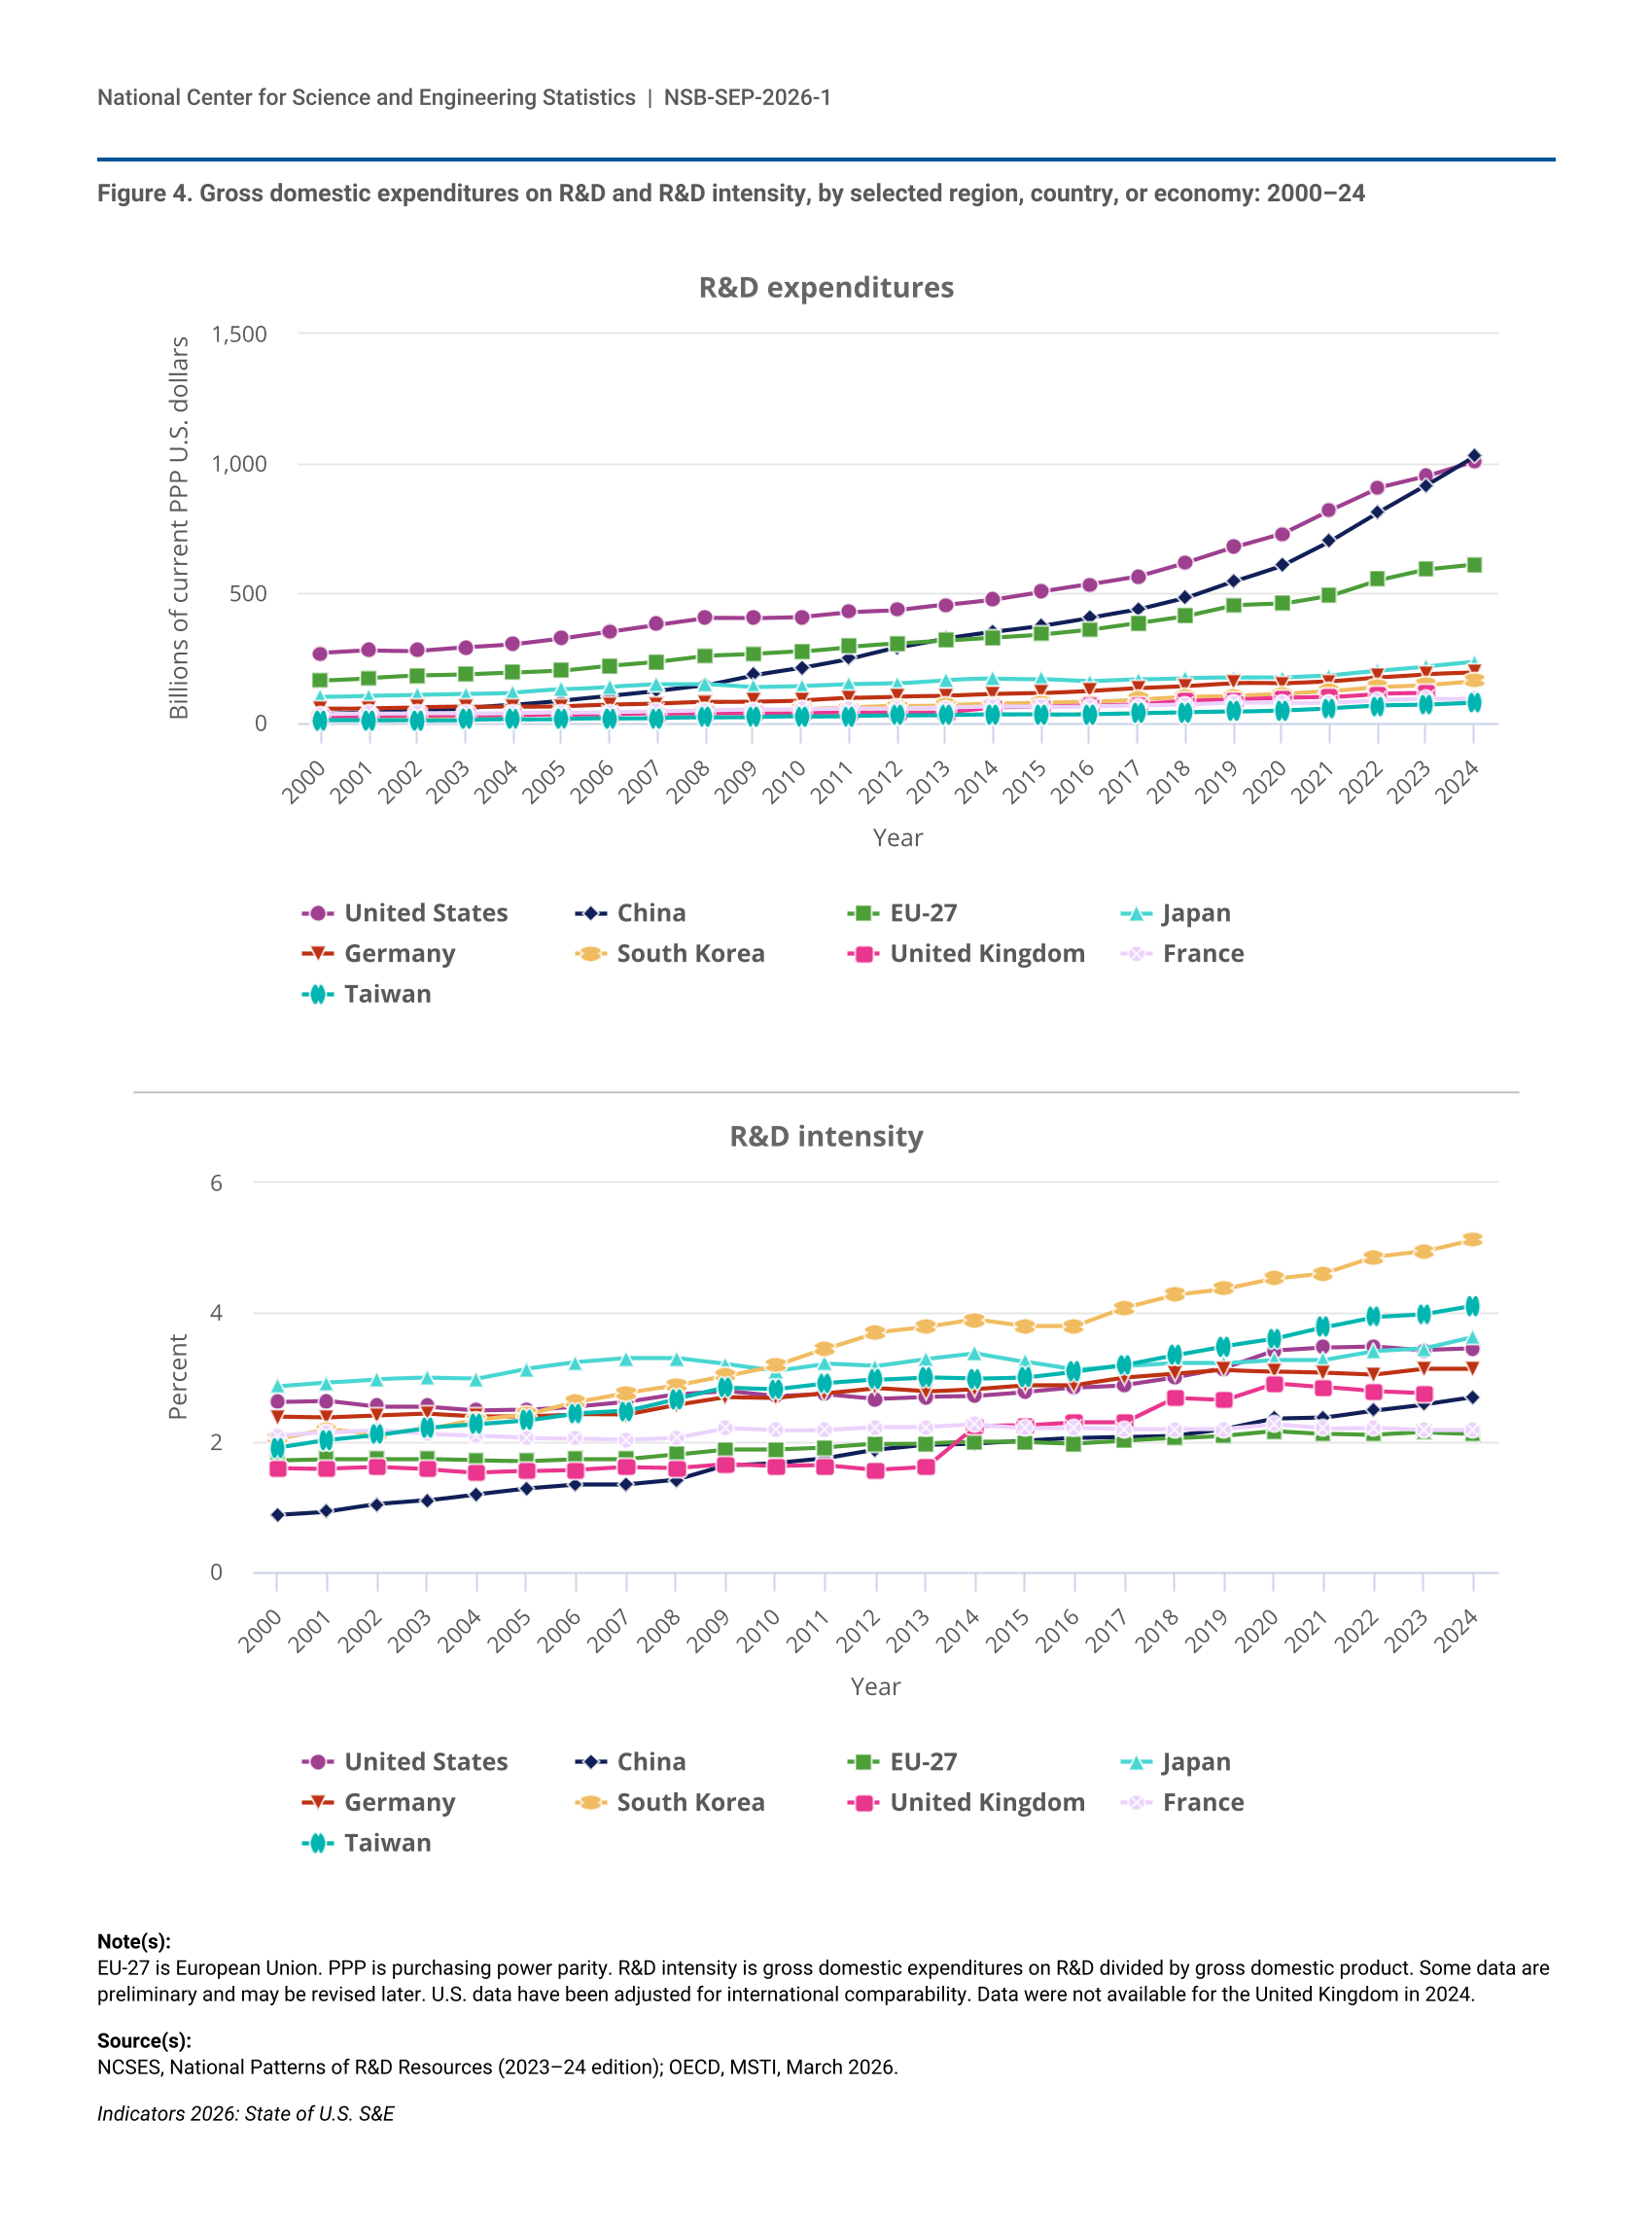
Figure 4.
Gross domestic expenditures on R&D and R&D intensity, by selected region, country, or economy: 2000–24
Gross domestic expenditures on R&D and R&D intensity, by selected region, country, or economy: 2000–24
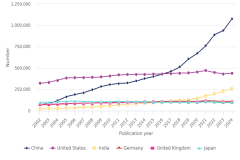
Figure 5.
S&E publications, by selected country: 2002–24
S&E publications, by selected country: 2002–24
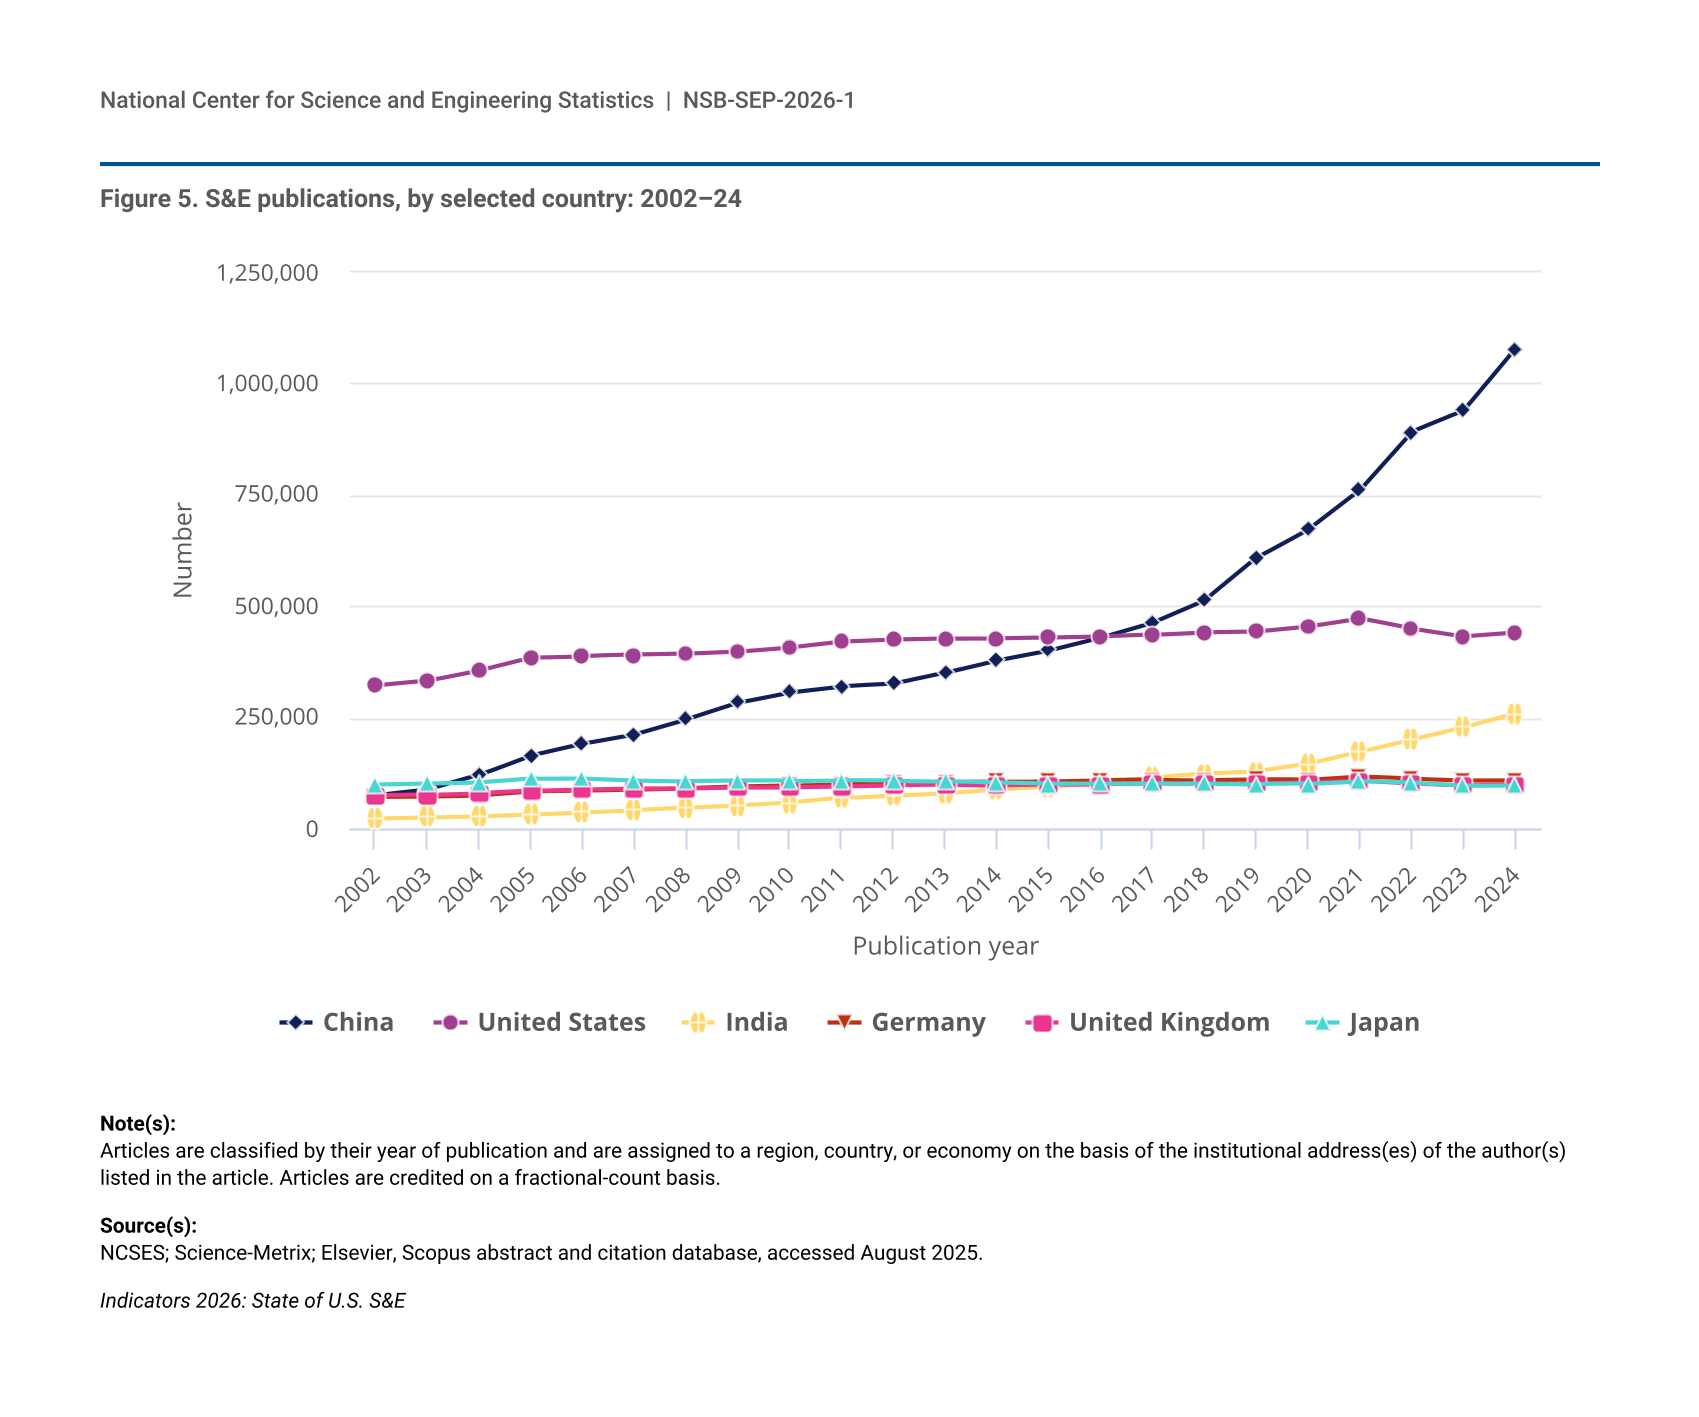
Figure 6.
S&E publications in the top 1% most-cited journal articles as a share of all S&E journal articles, by selected region, country, or economy: 2006–22
S&E publications in the top 1% most-cited journal articles as a share of all S&E journal articles, by selected region, country, or economy: 2006–22
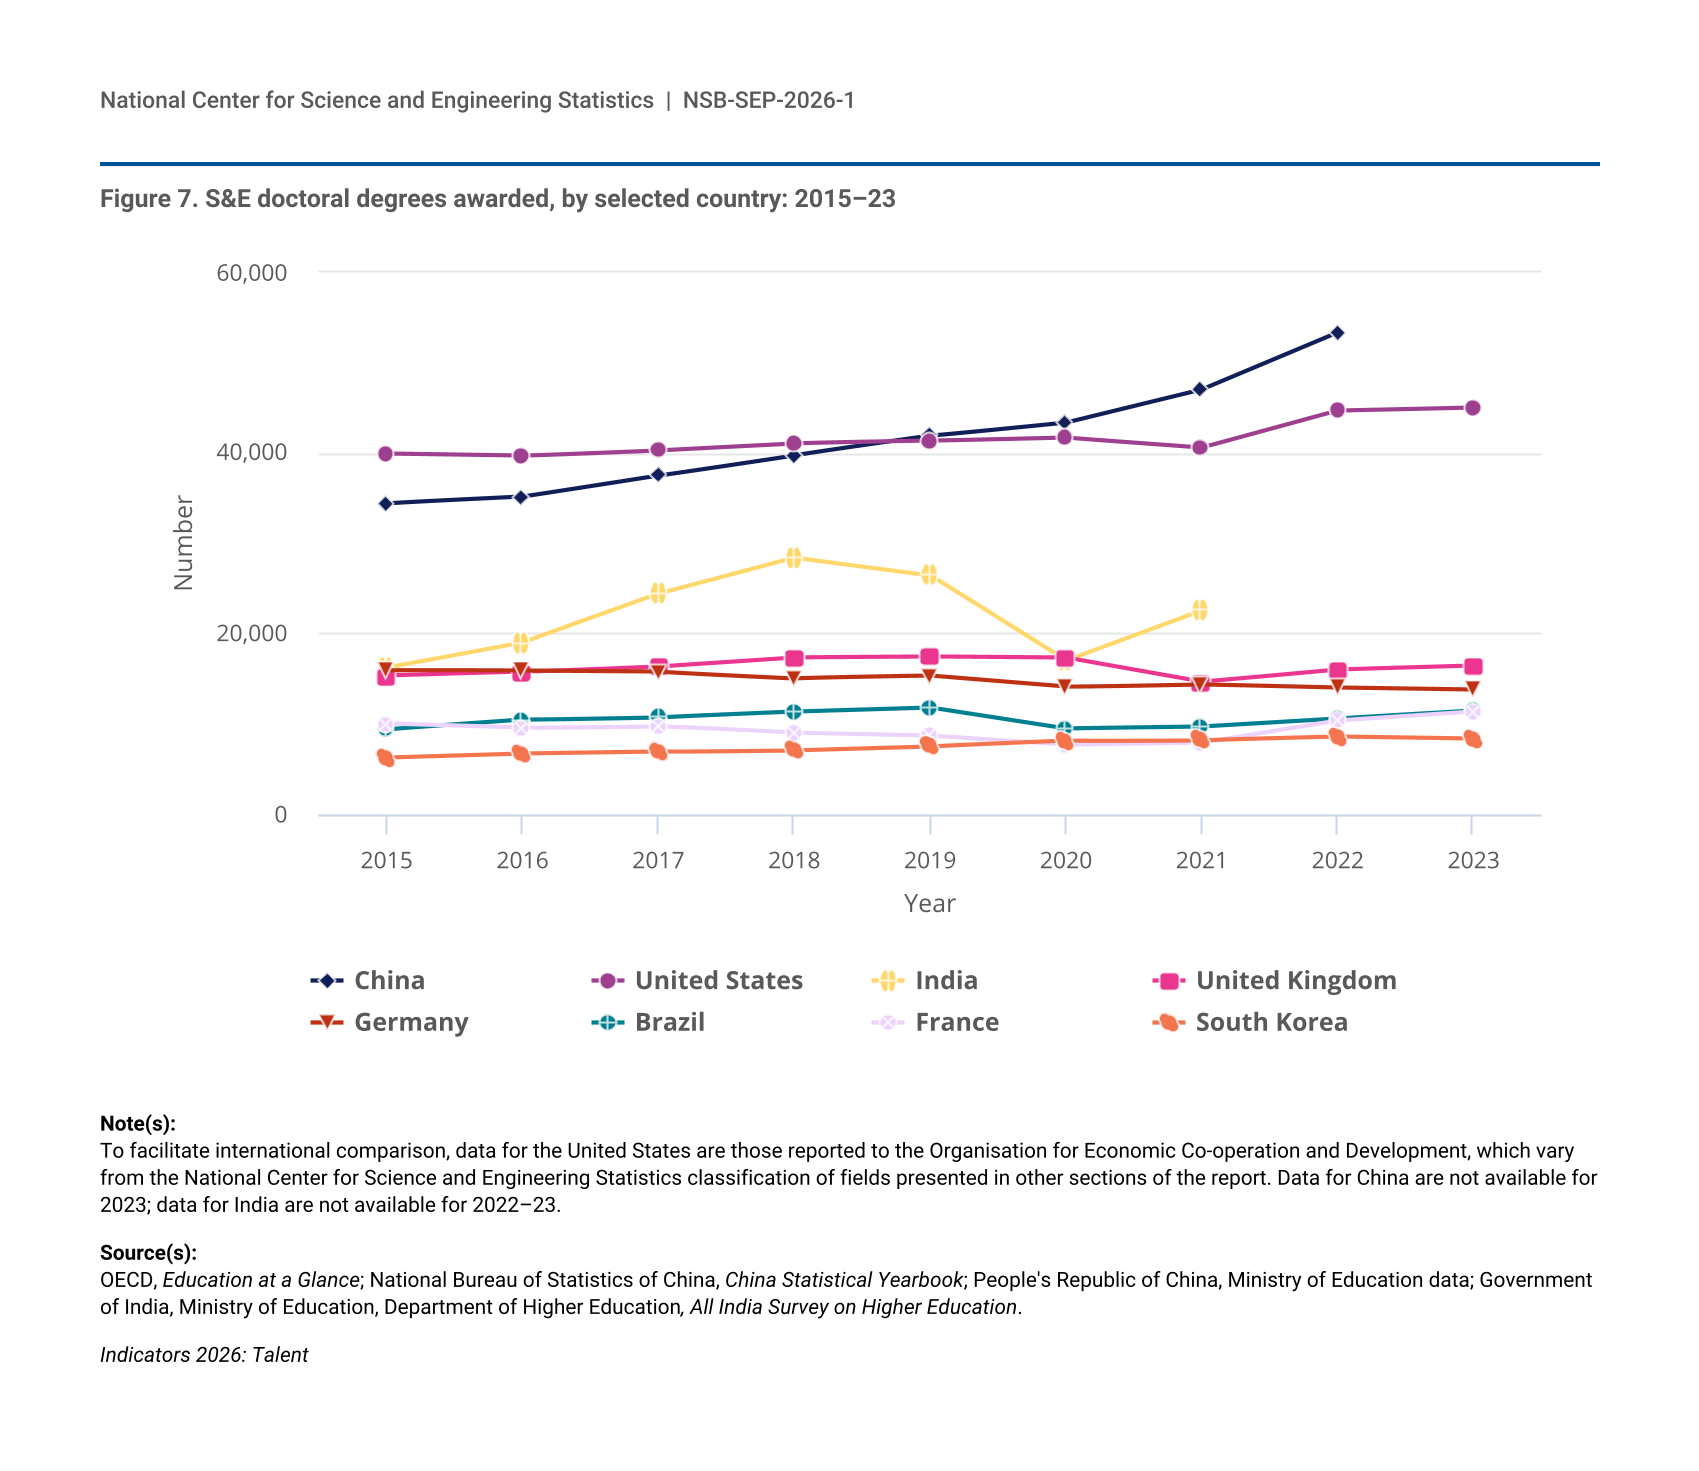
Figure 7.
S&E doctoral degrees awarded, by selected country: 2015–23
S&E doctoral degrees awarded, by selected country: 2015–23
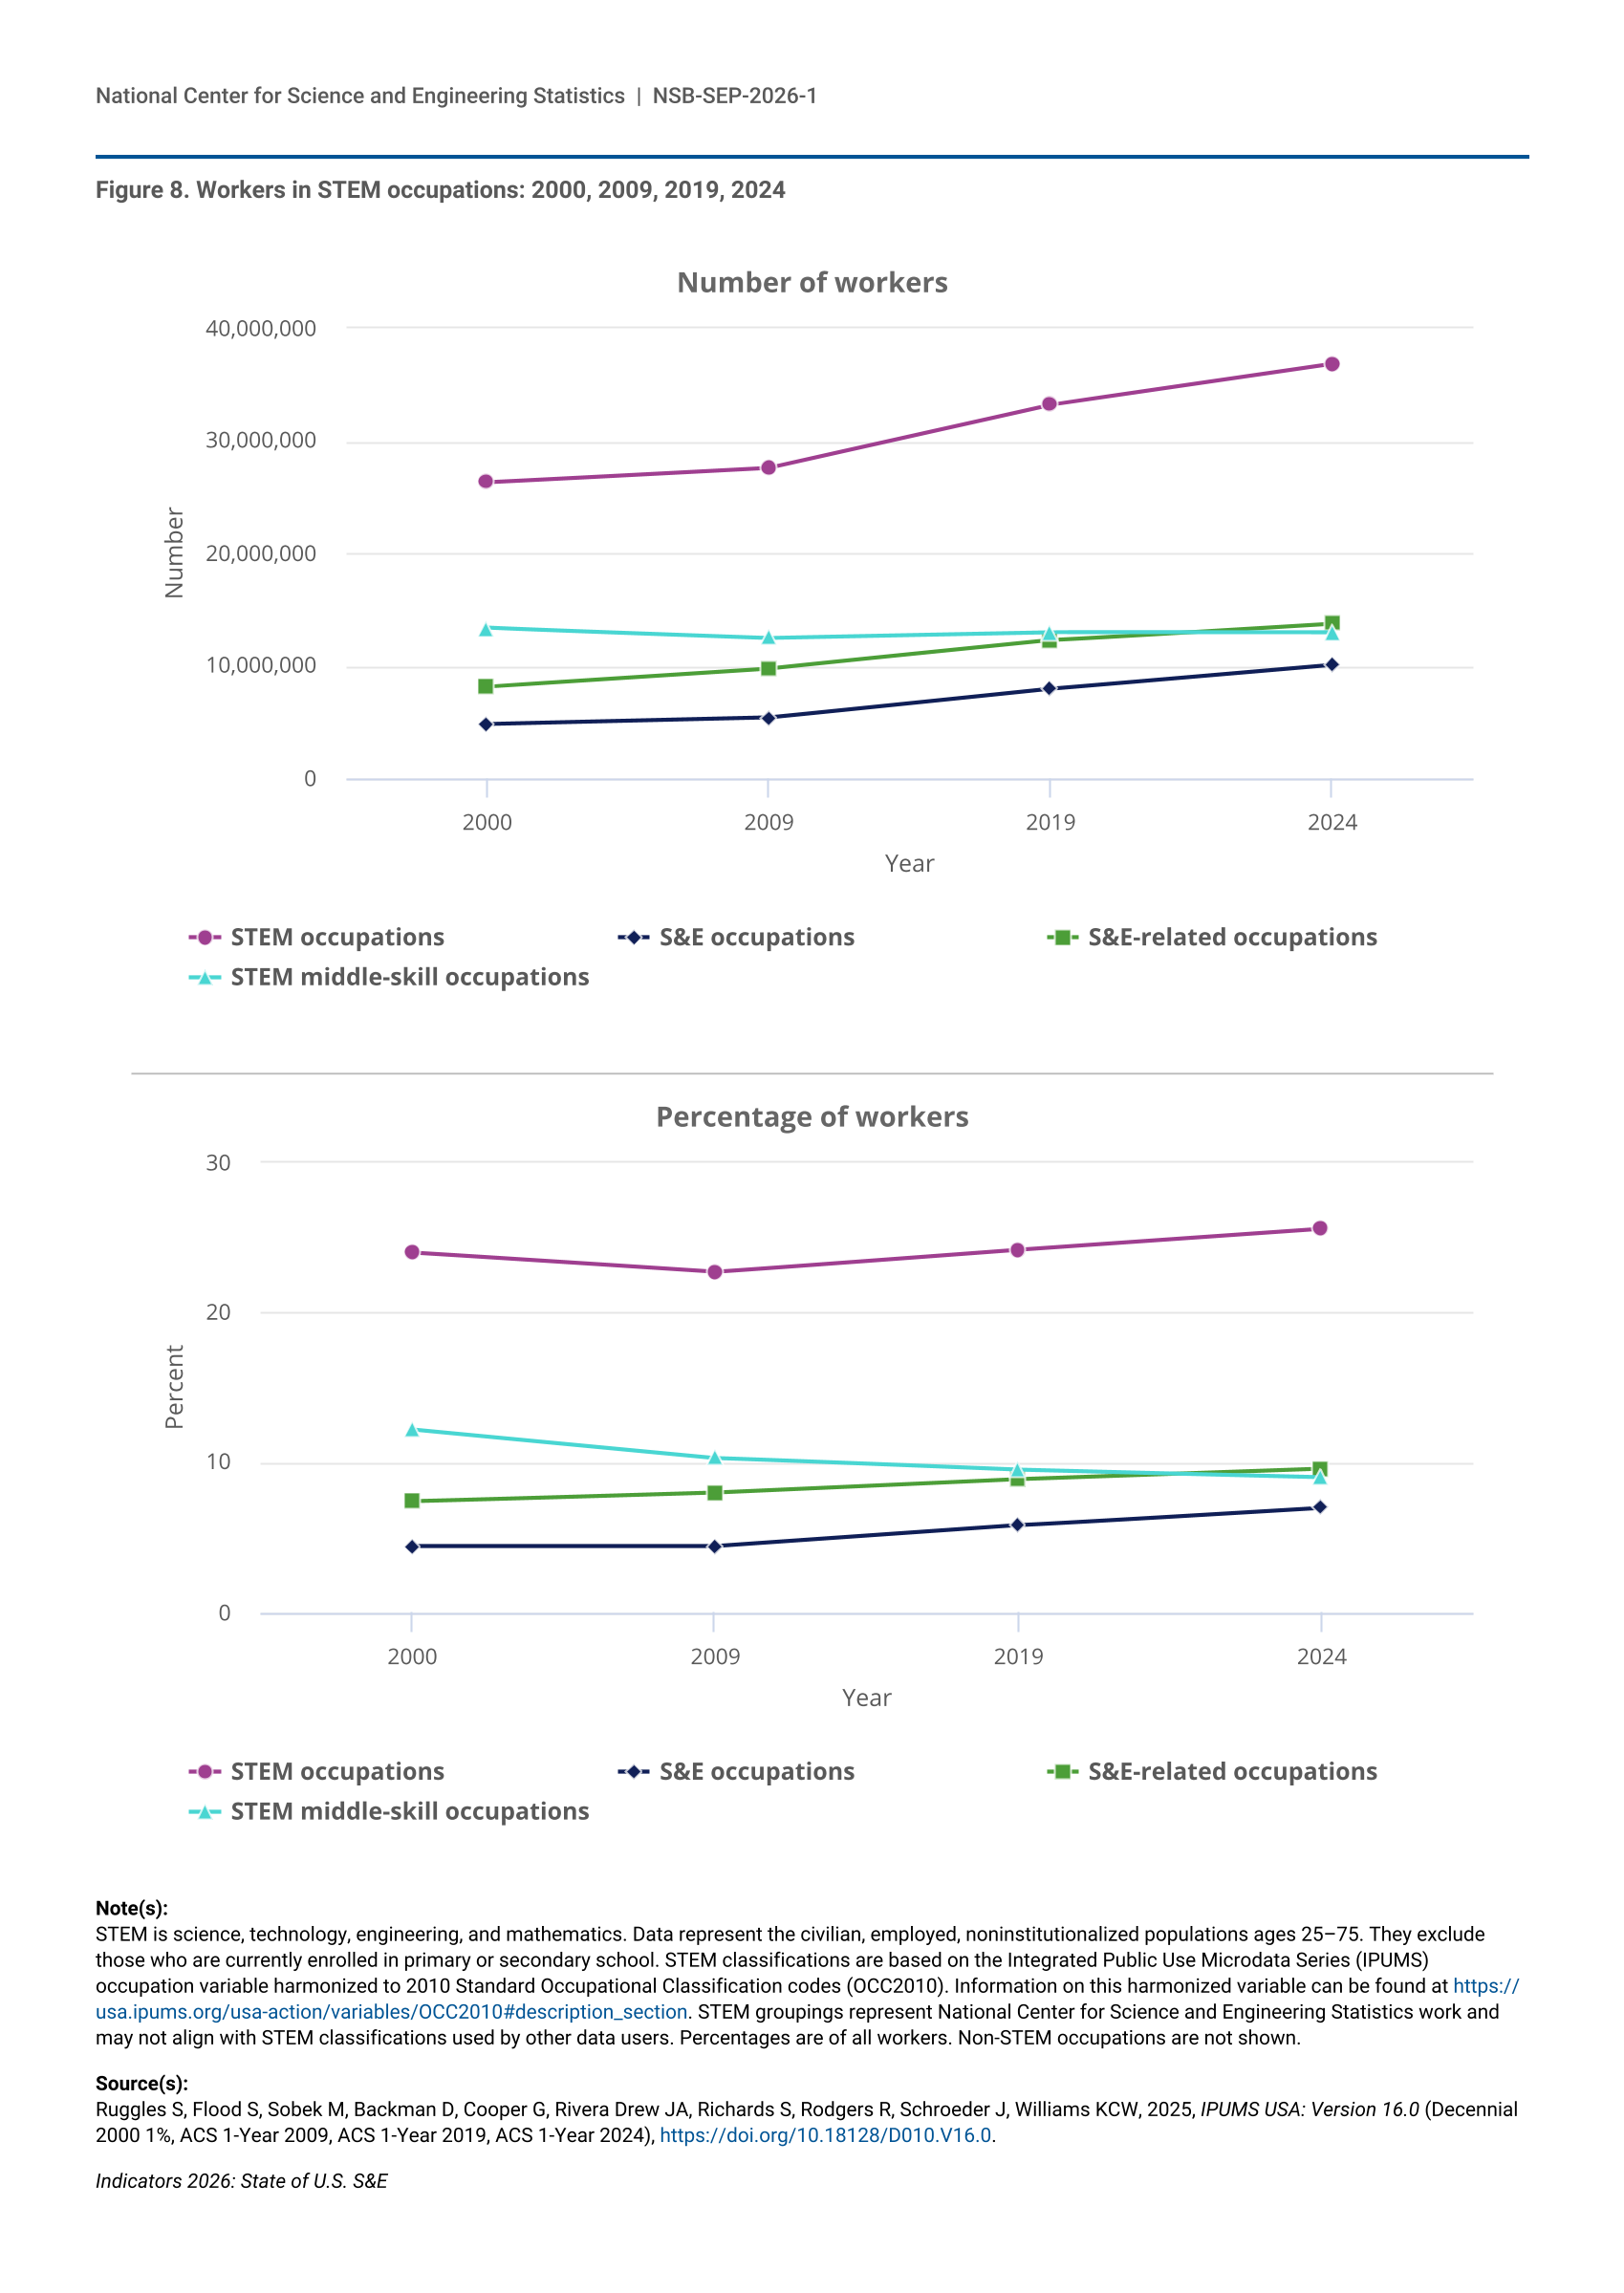
Figure 8.
Workers in STEM occupations: 2000, 2009, 2019, 2024
Workers in STEM occupations: 2000, 2009, 2019, 2024
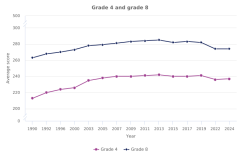
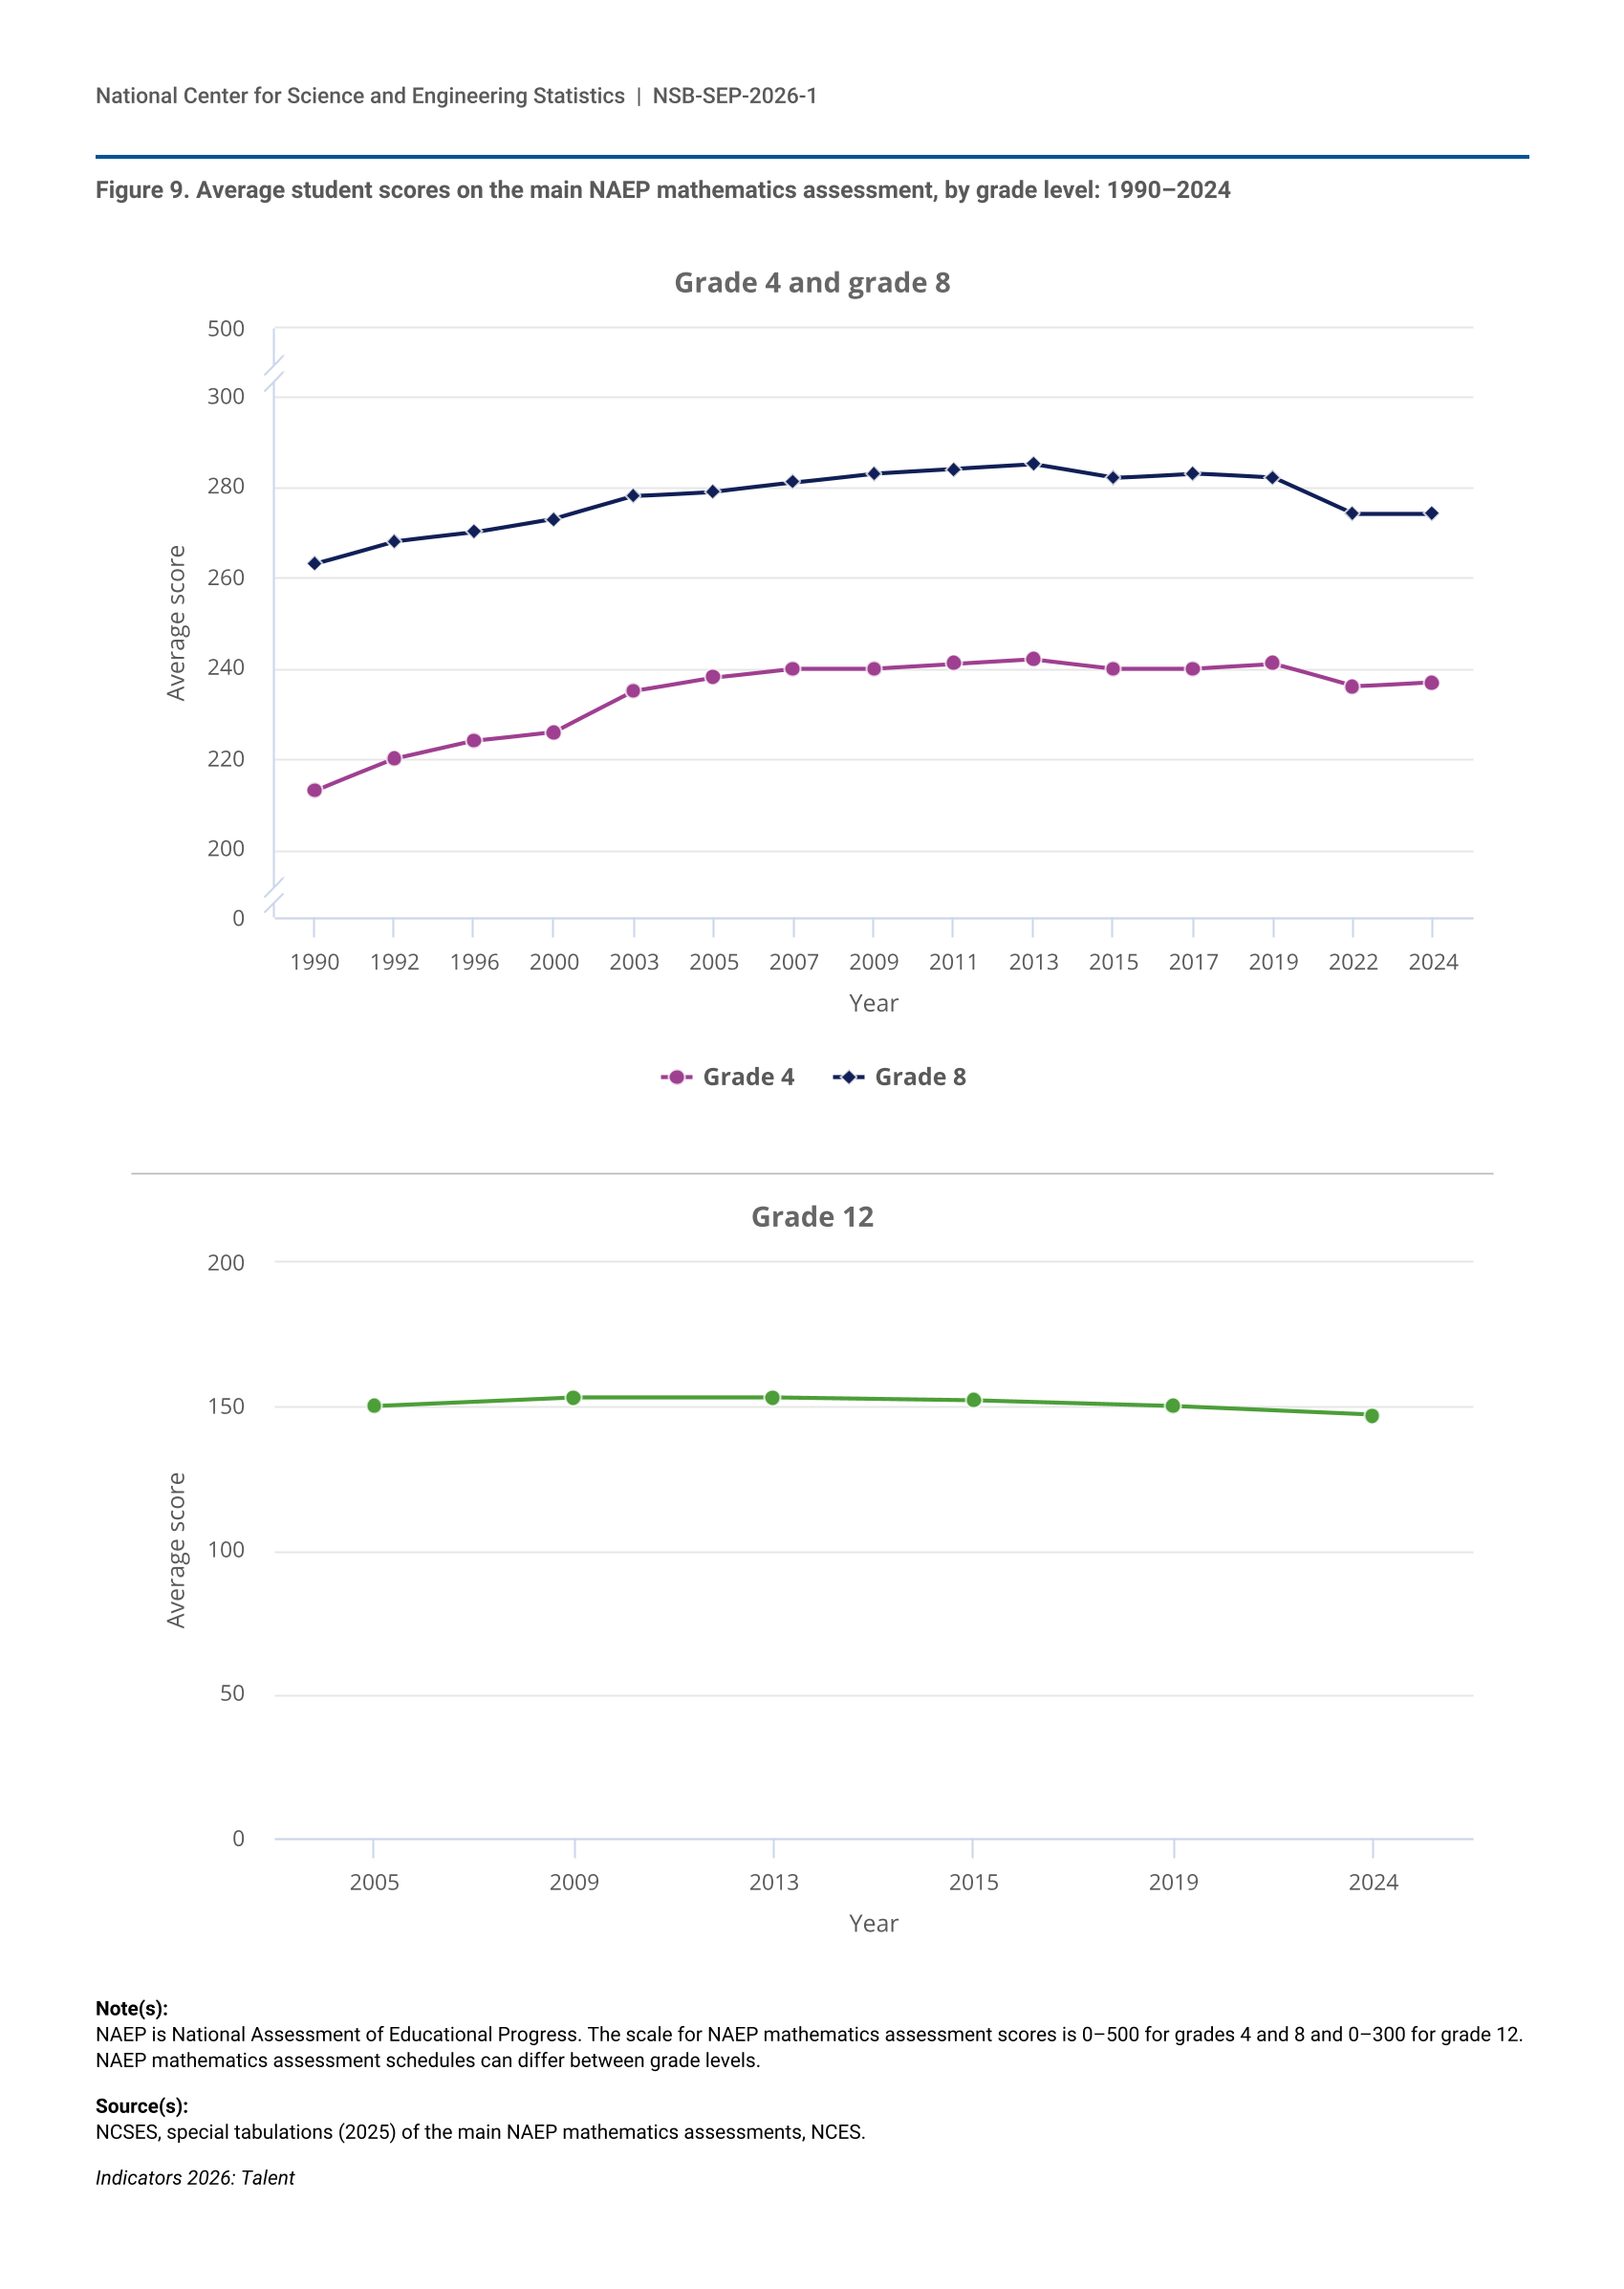
Figure 9.
Average student scores on the main NAEP mathematics assessment, by grade level: 1990–2024
Average student scores on the main NAEP mathematics assessment, by grade level: 1990–2024
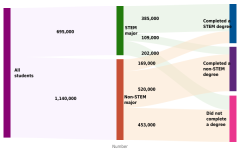
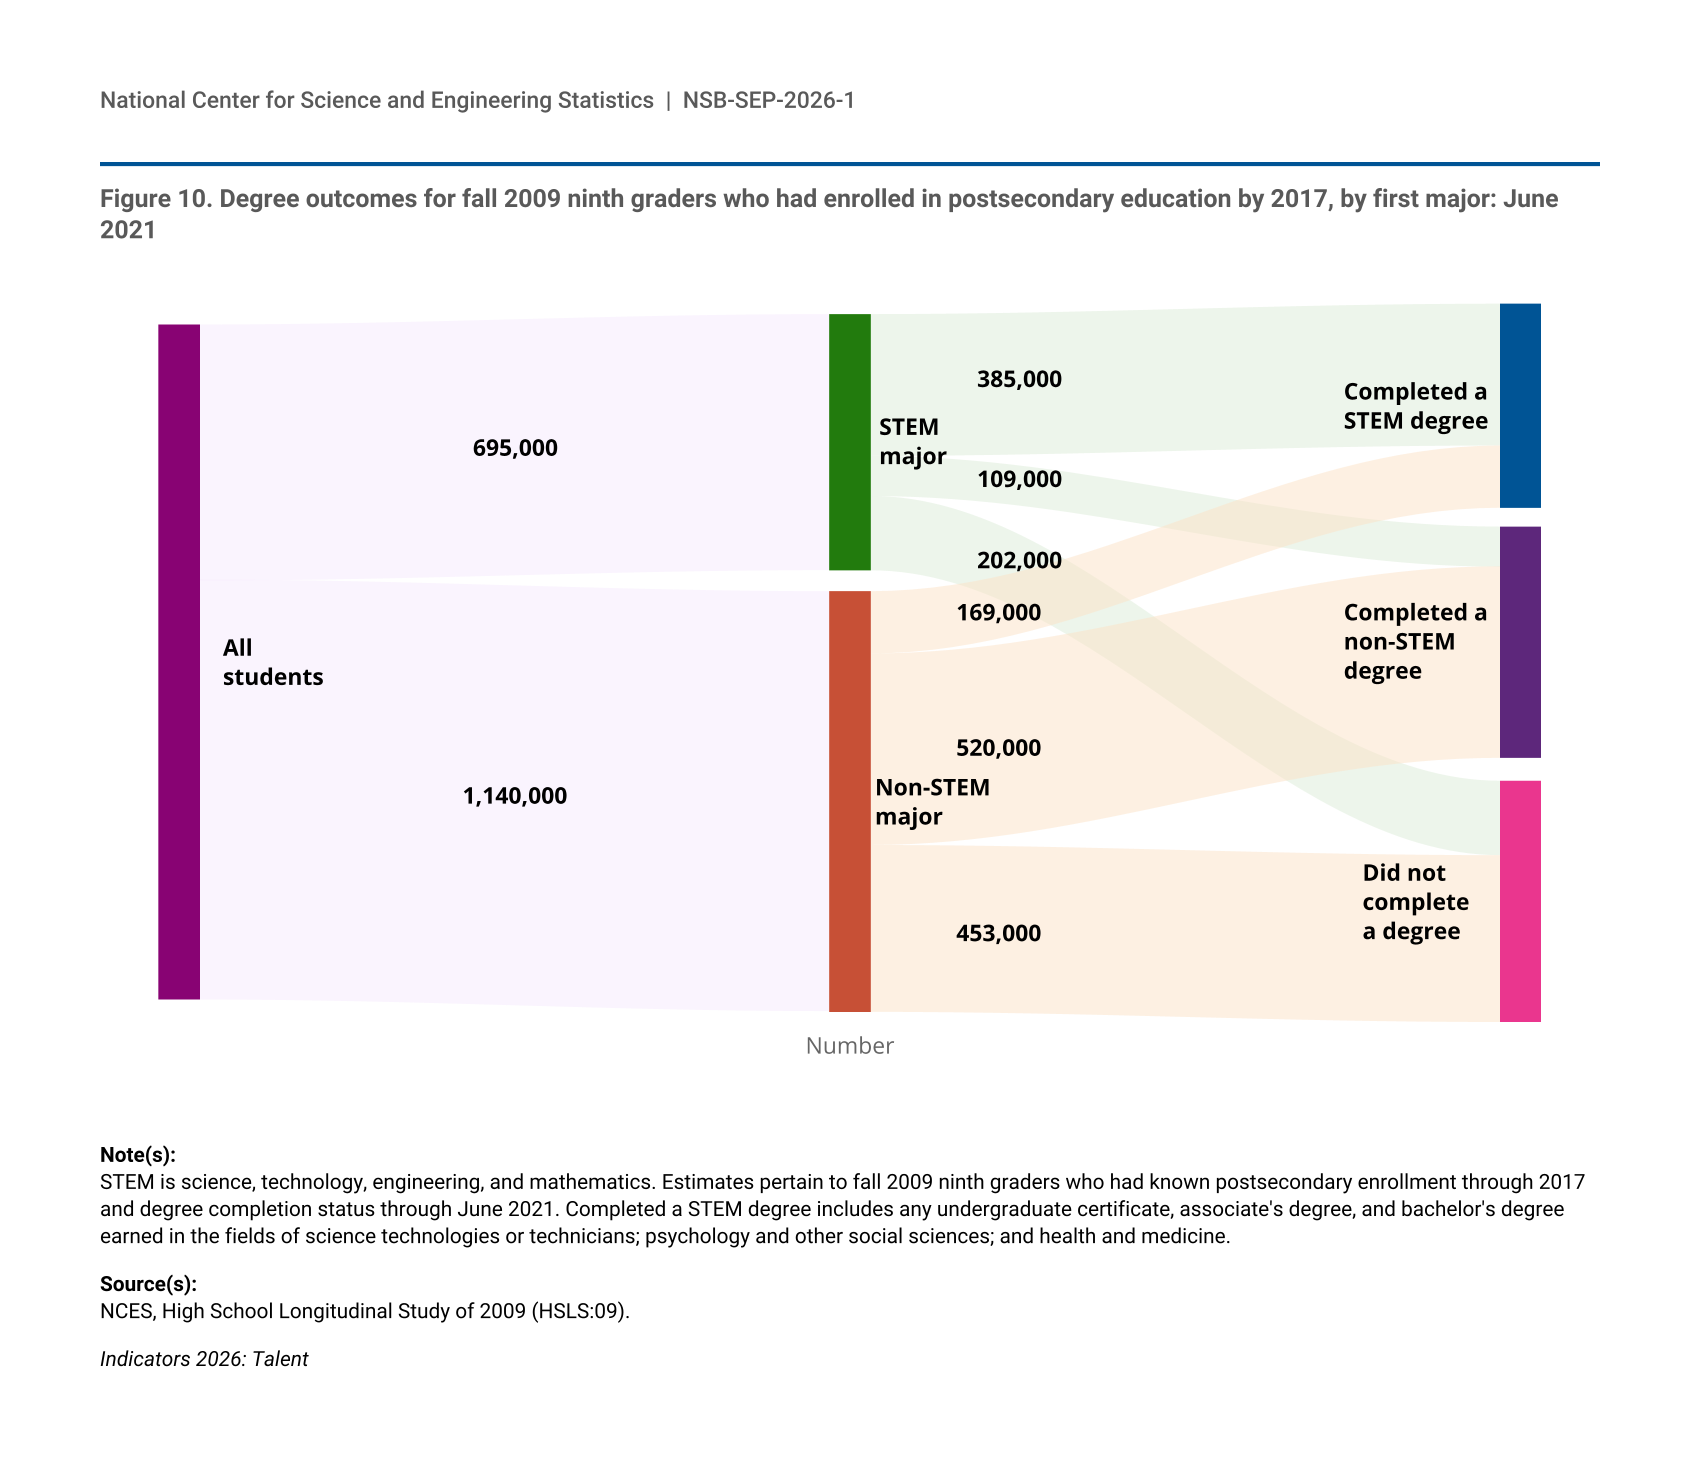
Figure 10.
Degree outcomes for fall 2009 ninth graders who had enrolled in postsecondary education by 2017, by first major: June 2021
Degree outcomes for fall 2009 ninth graders who had enrolled in postsecondary education by 2017, by first major: June 2021
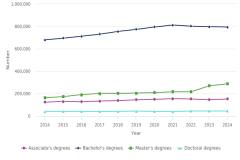
Figure 11.
S&E degrees awarded, by degree level: 2014–24
S&E degrees awarded, by degree level: 2014–24
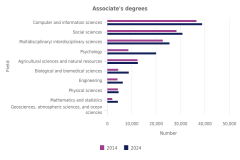
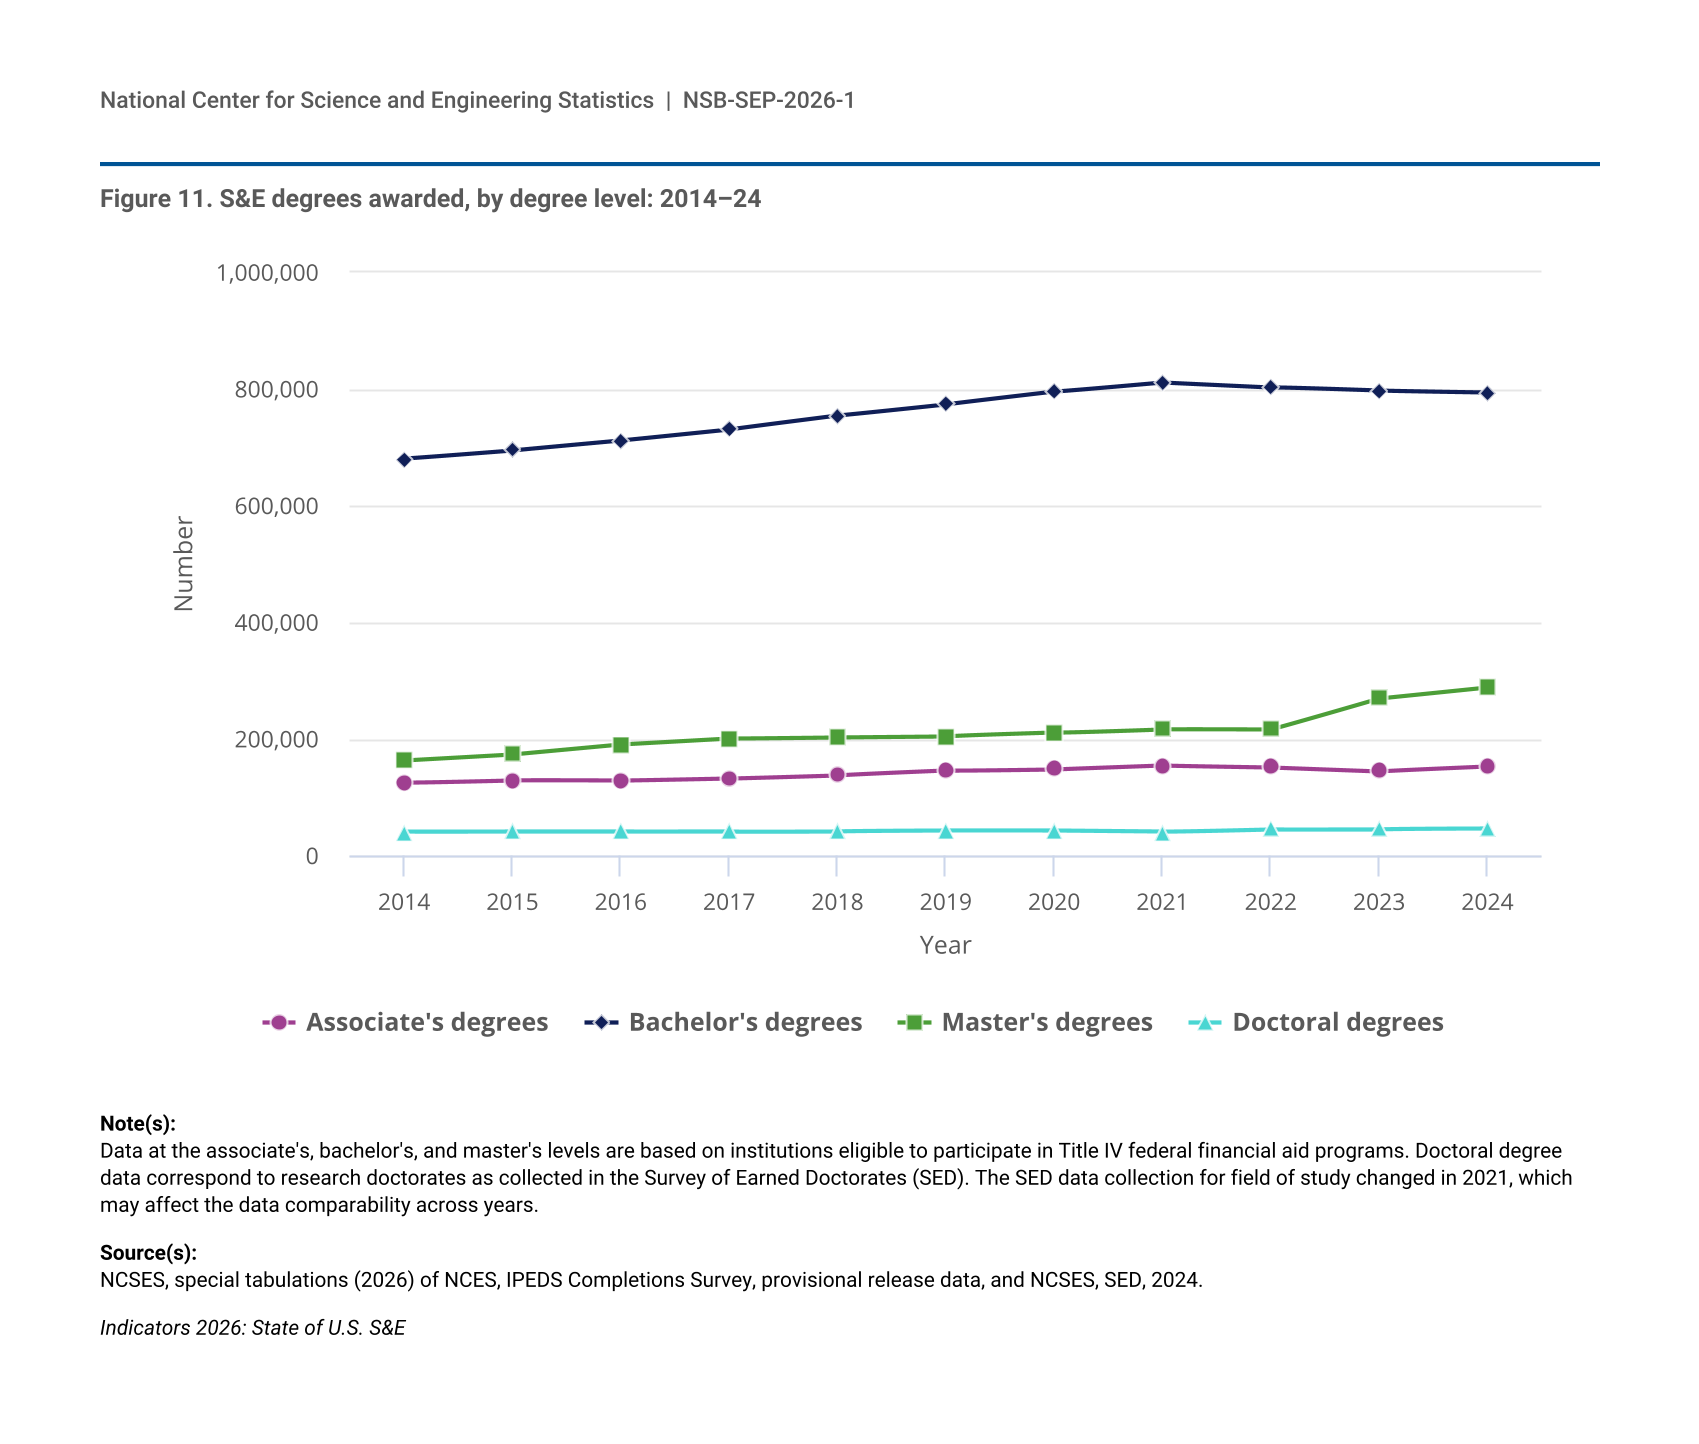
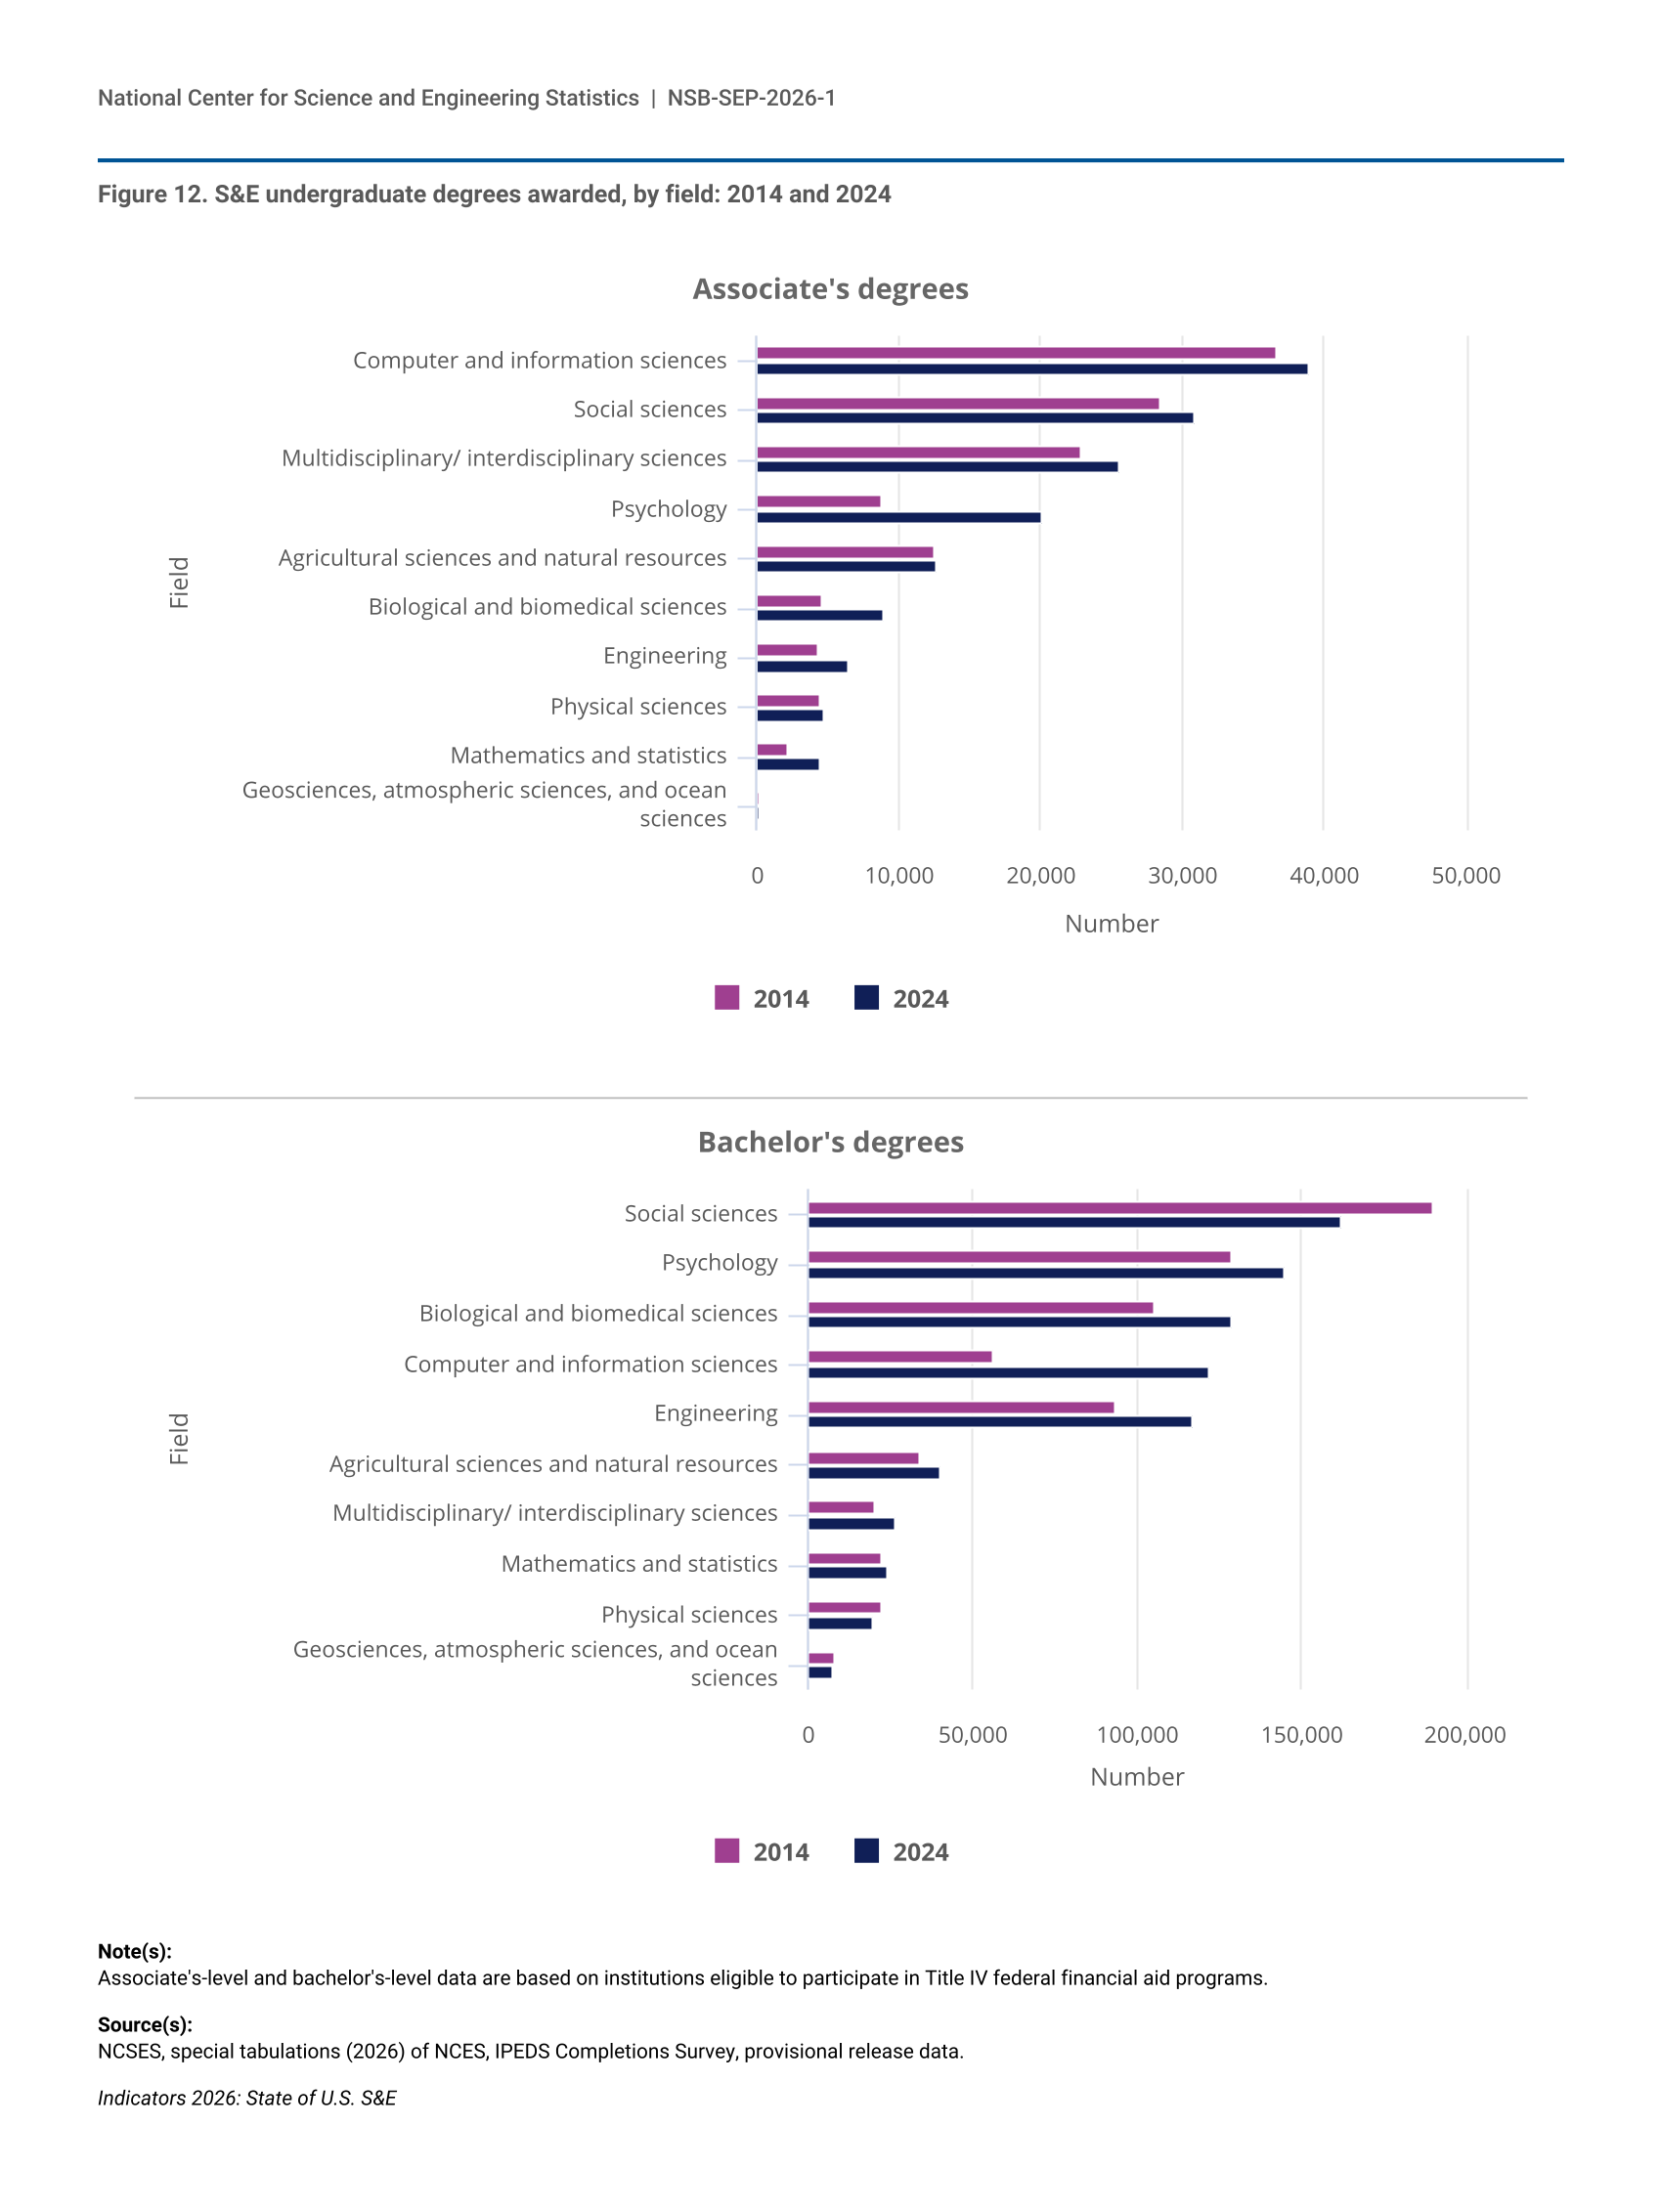
Figure 12.
S&E undergraduate degrees awarded, by field: 2014 and 2024
S&E undergraduate degrees awarded, by field: 2014 and 2024
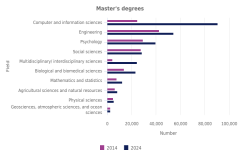
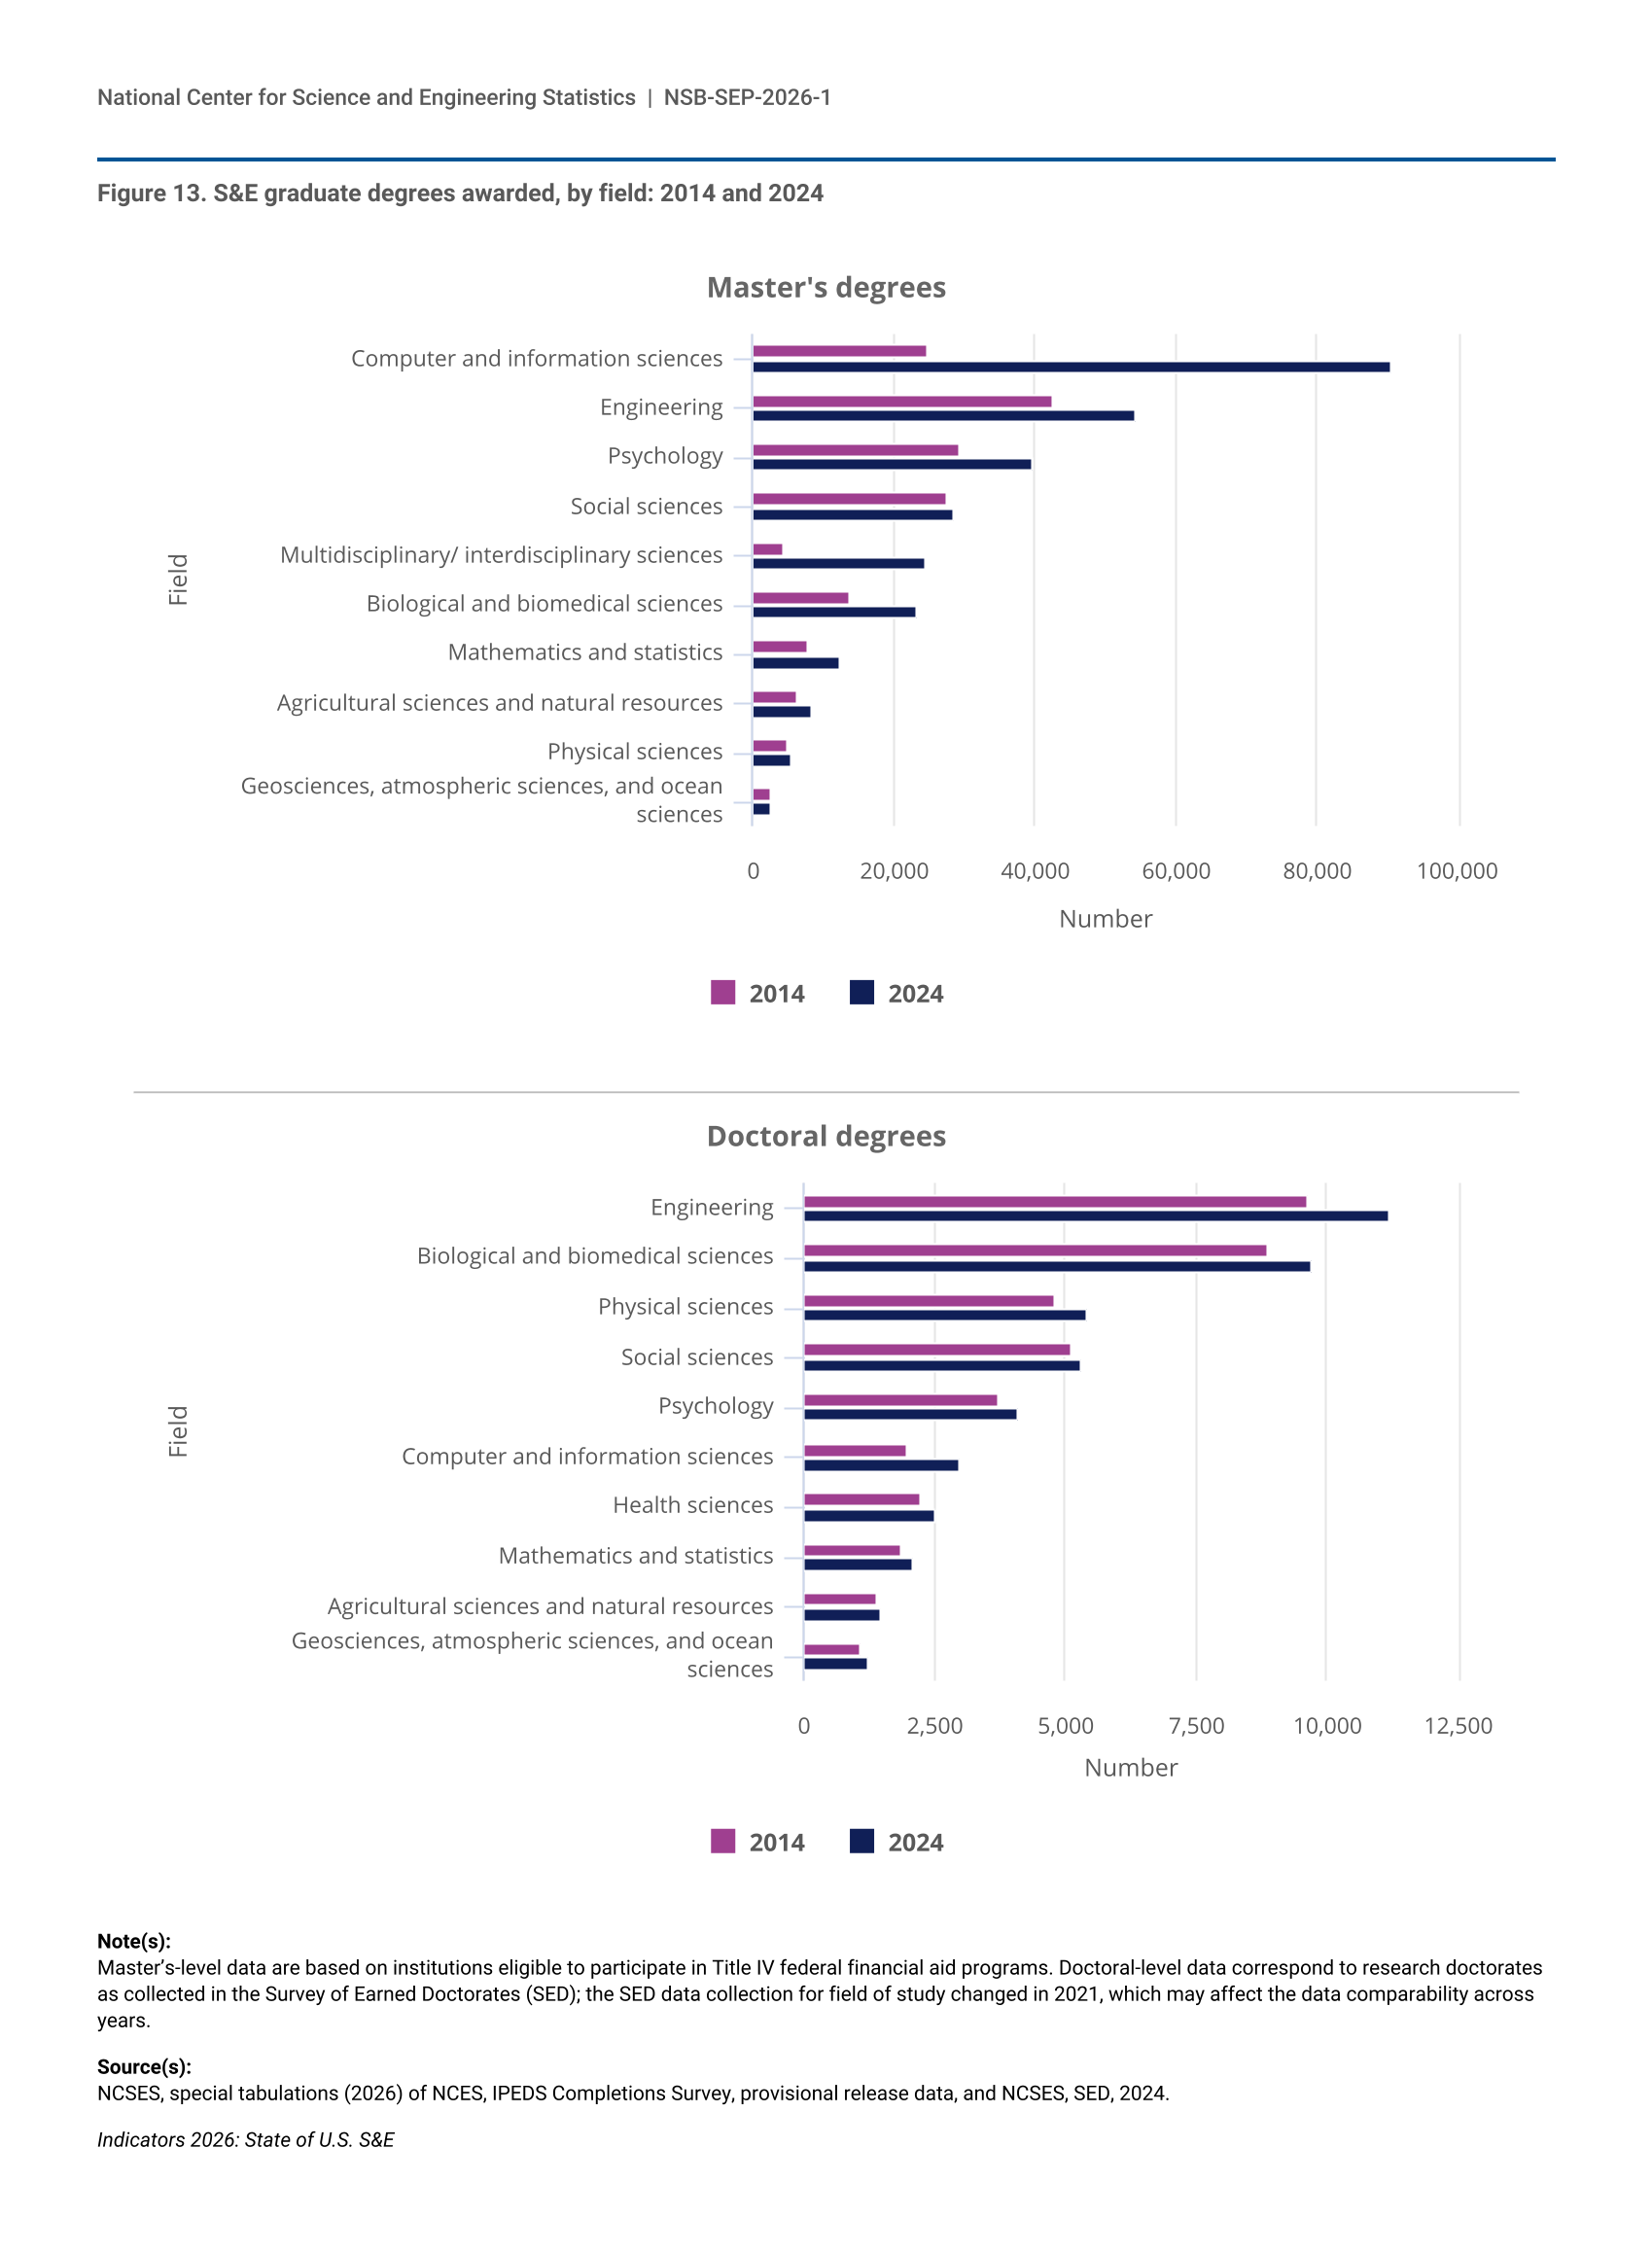
Figure 13.
S&E graduate degrees awarded, by field: 2014 and 2024
S&E graduate degrees awarded, by field: 2014 and 2024
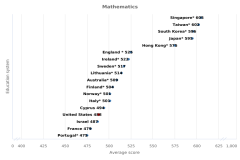
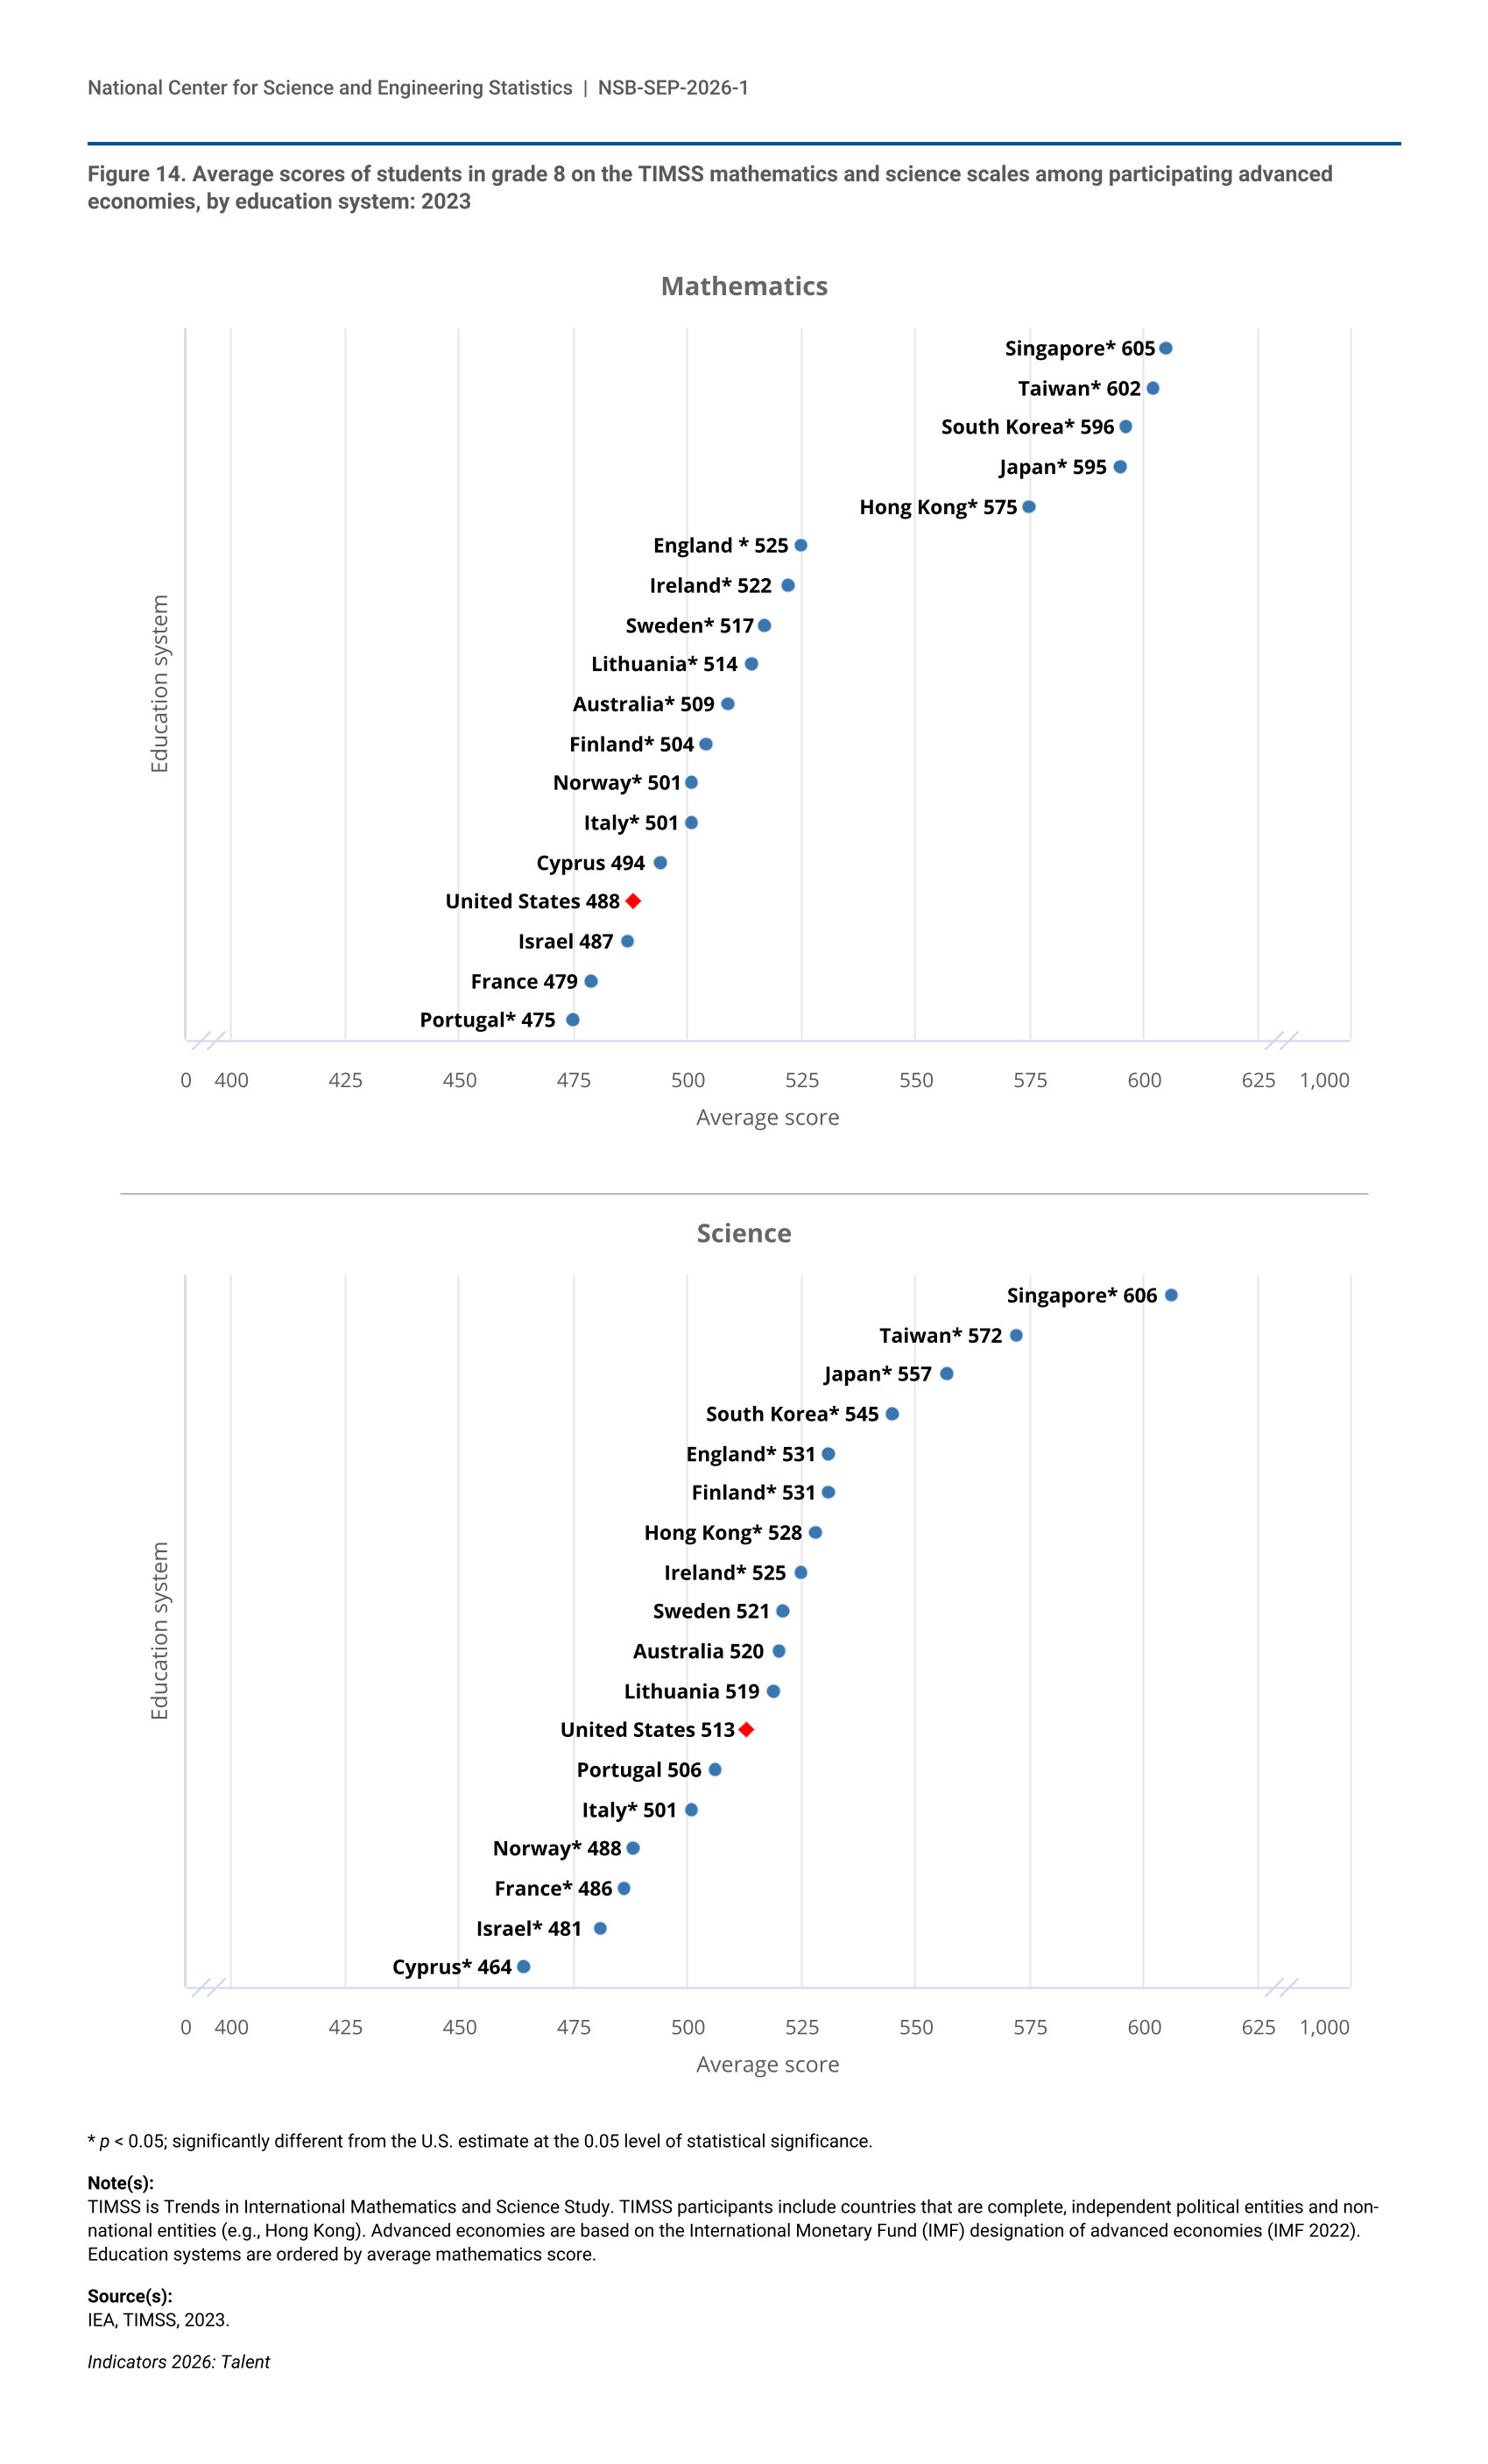
Figure 14.
Average scores of students in grade 8 on the TIMSS mathematics and science scales among participating advanced economies, by education system: 2023
Average scores of students in grade 8 on the TIMSS mathematics and science scales among participating advanced economies, by education system: 2023
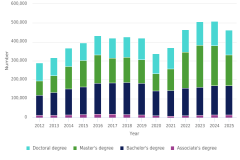
Figure 15.
International S&E students on visas enrolled in U.S. higher education institutions, by level of enrollment: 2012–25
International S&E students on visas enrolled in U.S. higher education institutions, by level of enrollment: 2012–25
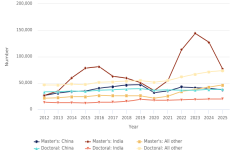
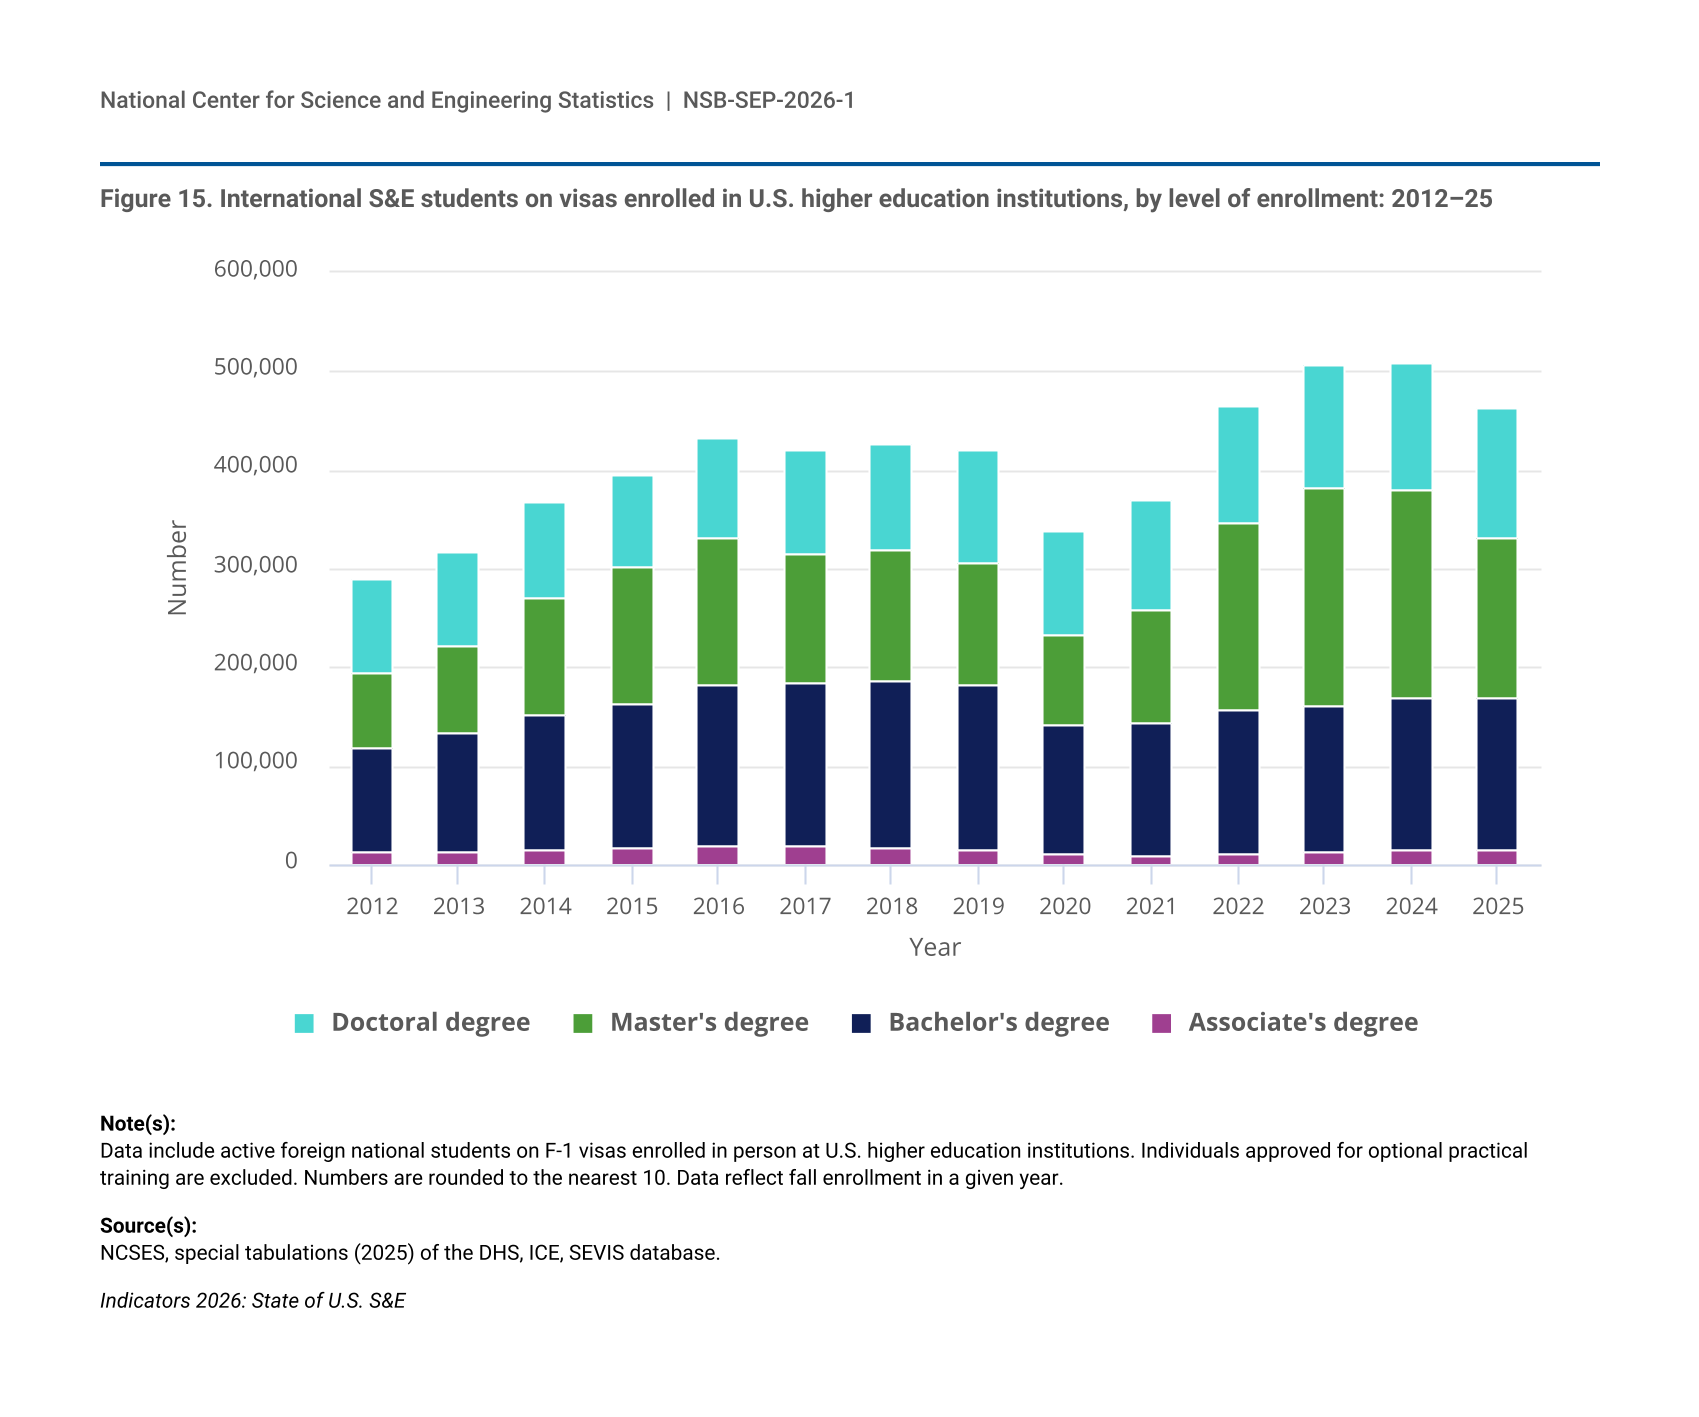
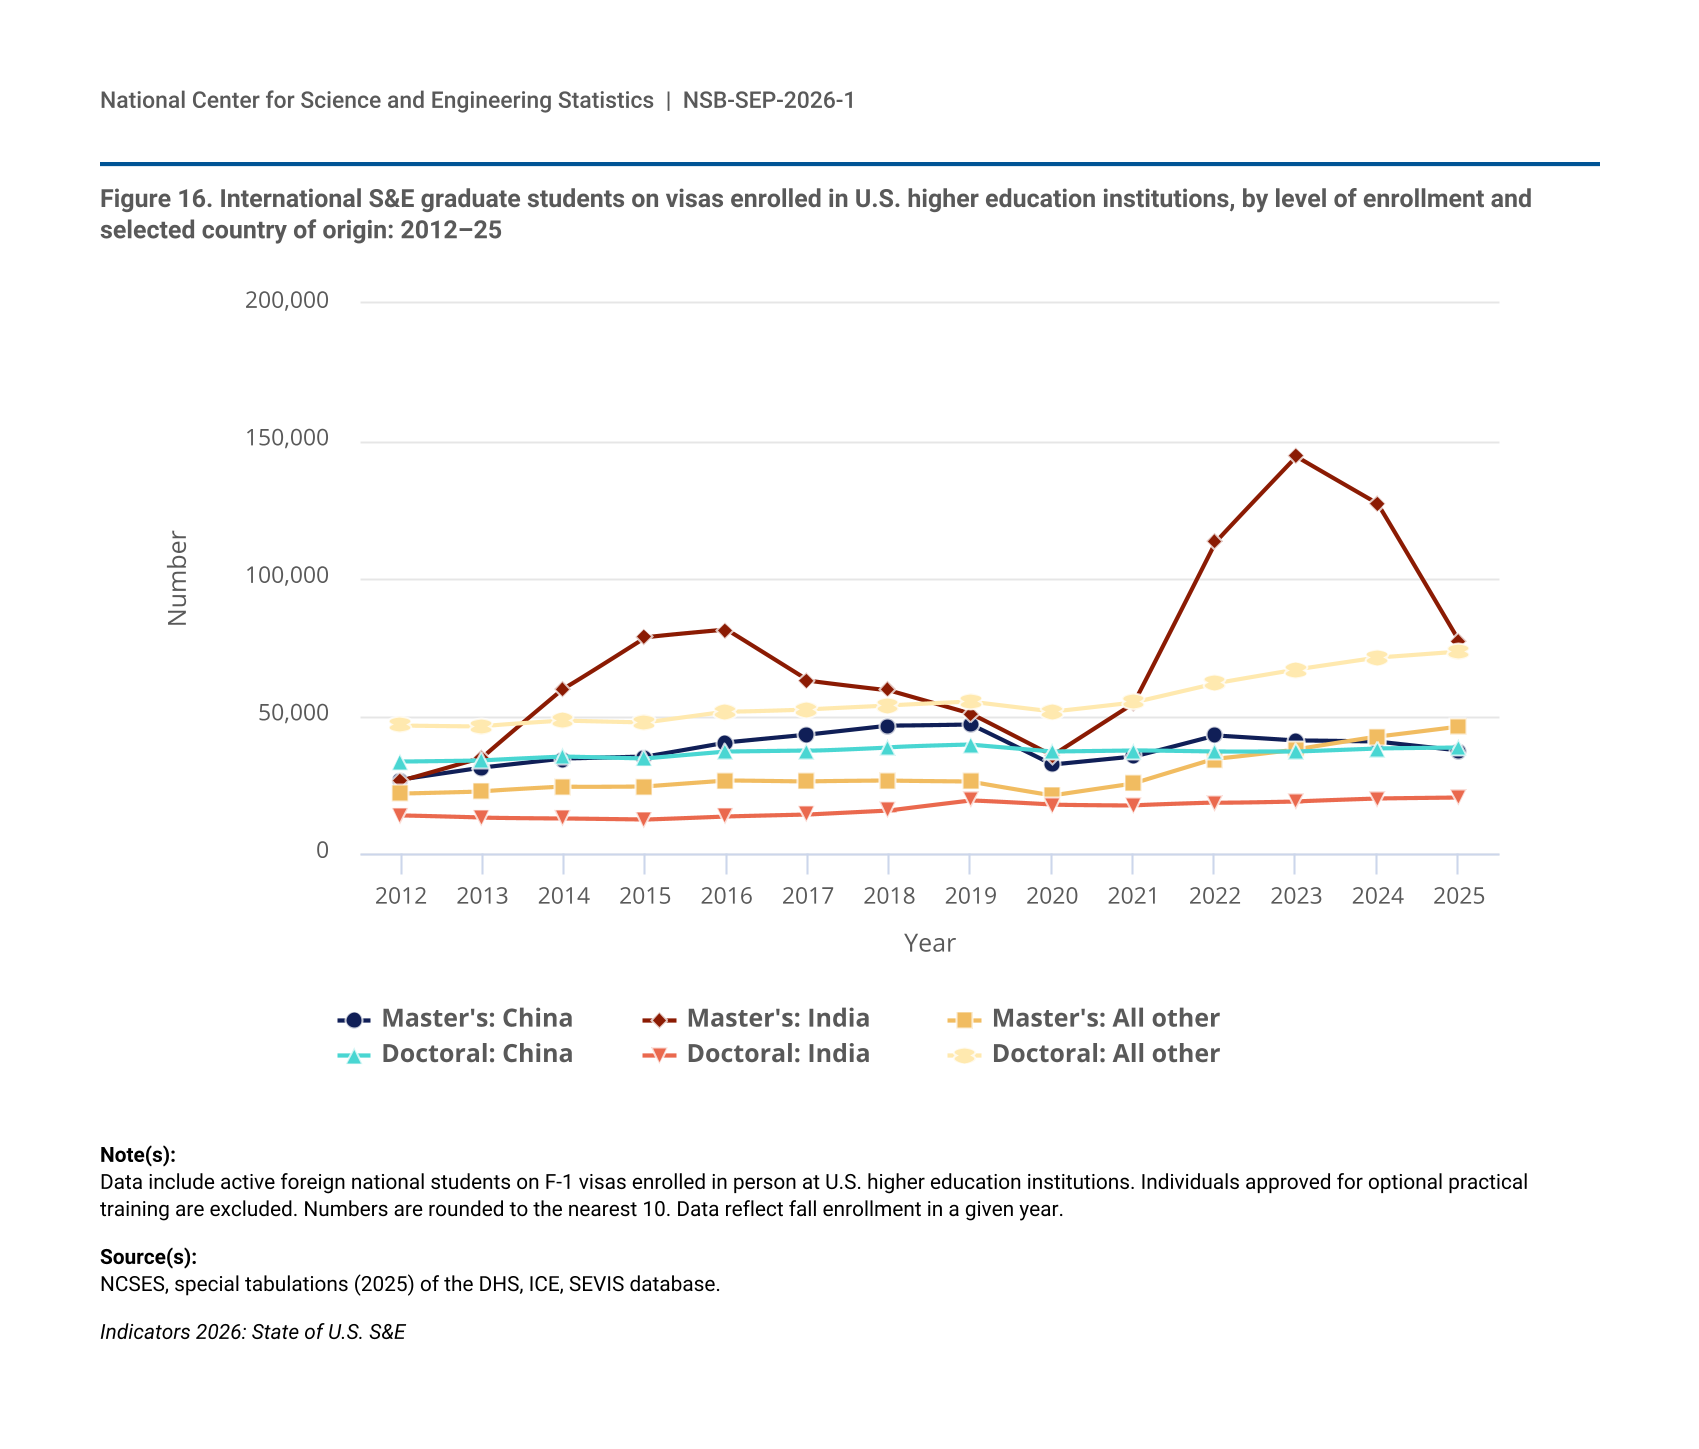
Figure 16.
International S&E graduate students on visas enrolled in U.S. higher education institutions, by level of enrollment and selected country of origin: 2012–25
International S&E graduate students on visas enrolled in U.S. higher education institutions, by level of enrollment and selected country of origin: 2012–25
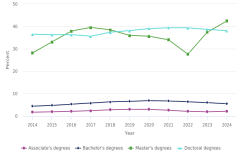
Figure 17.
Share of S&E degrees awarded to temporary visa holders, by degree level: 2014–24
Share of S&E degrees awarded to temporary visa holders, by degree level: 2014–24
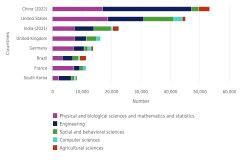
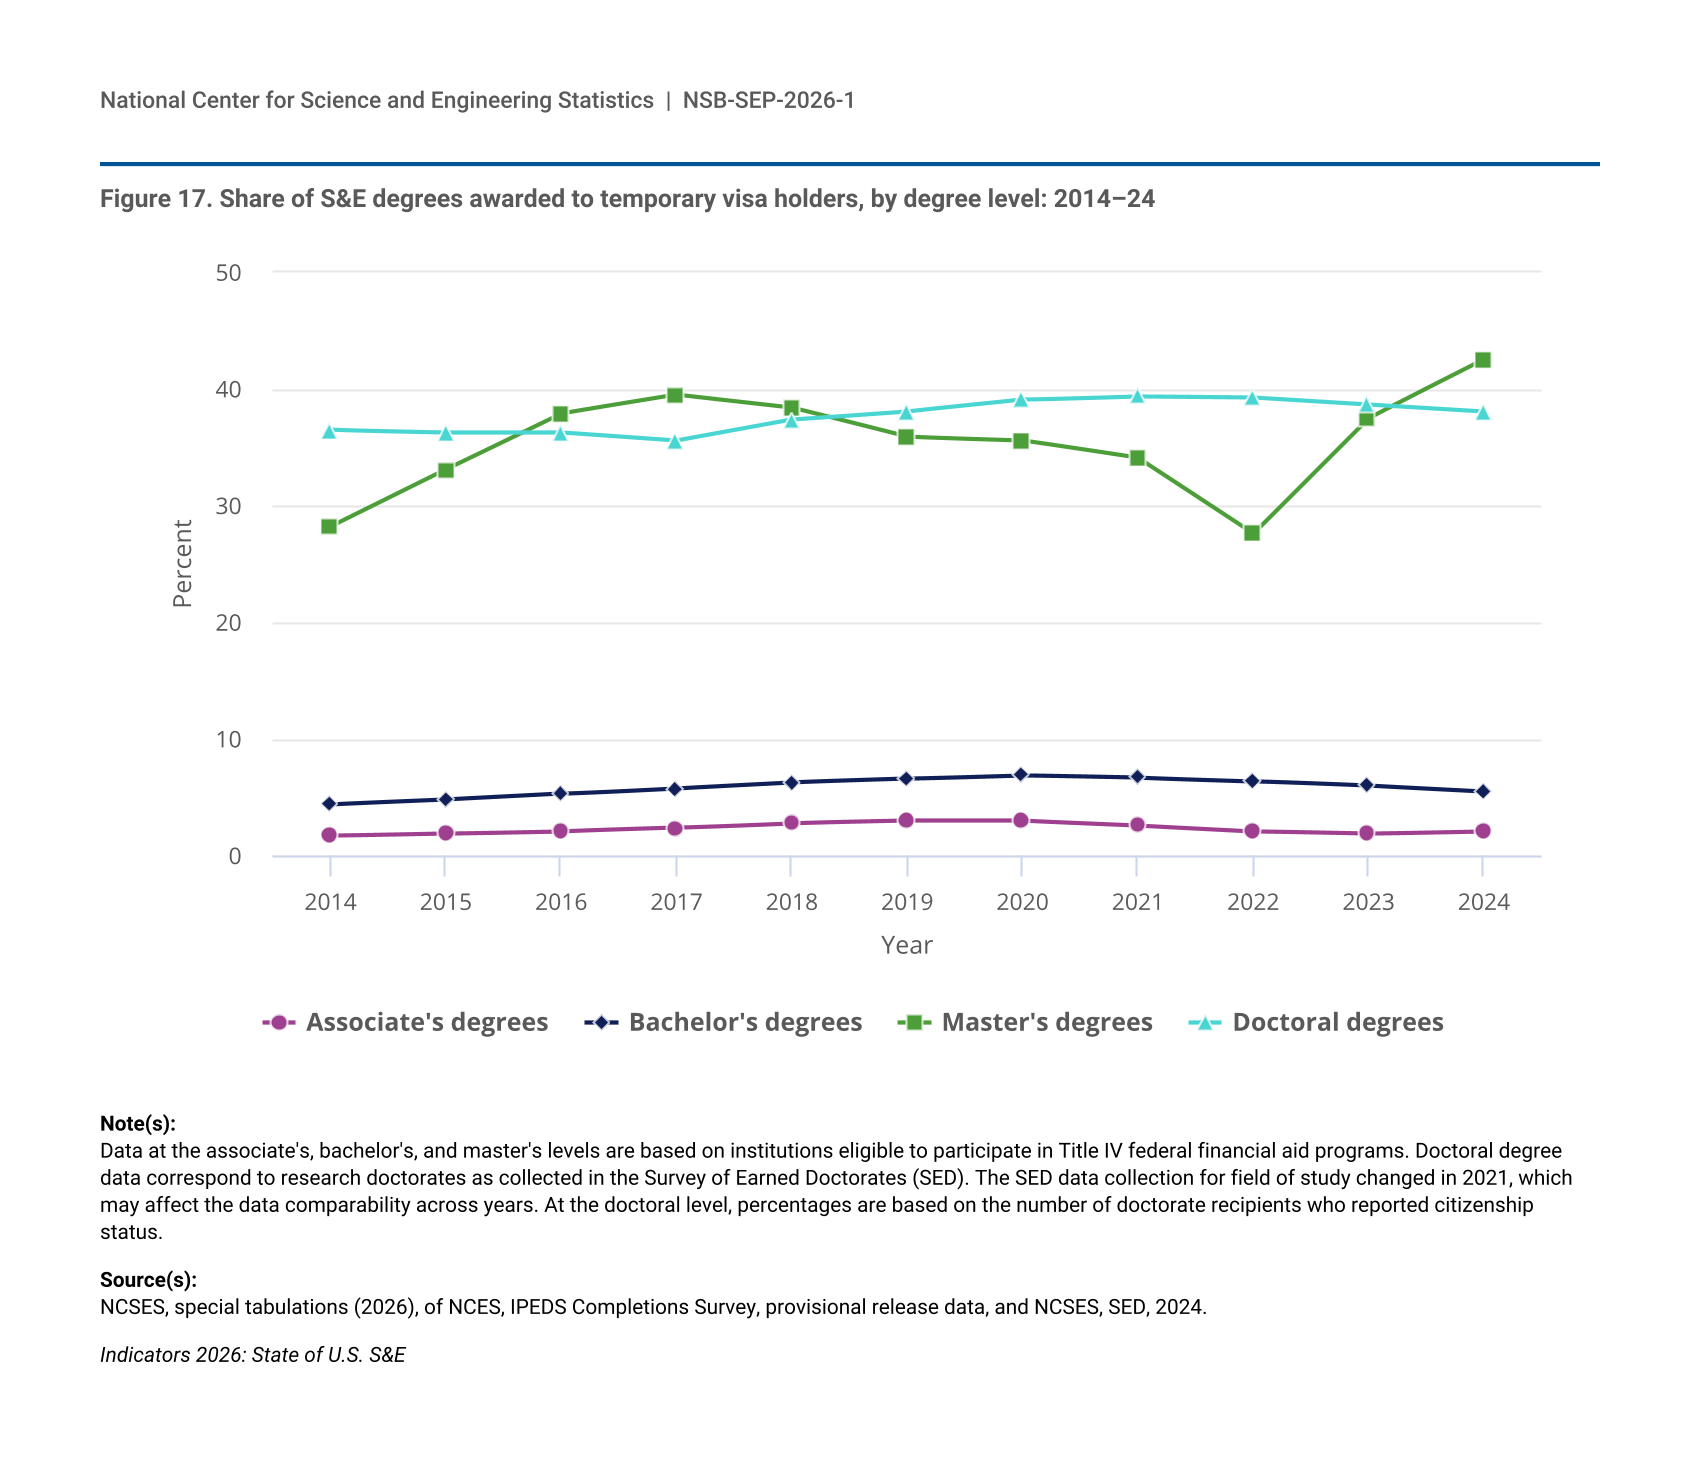
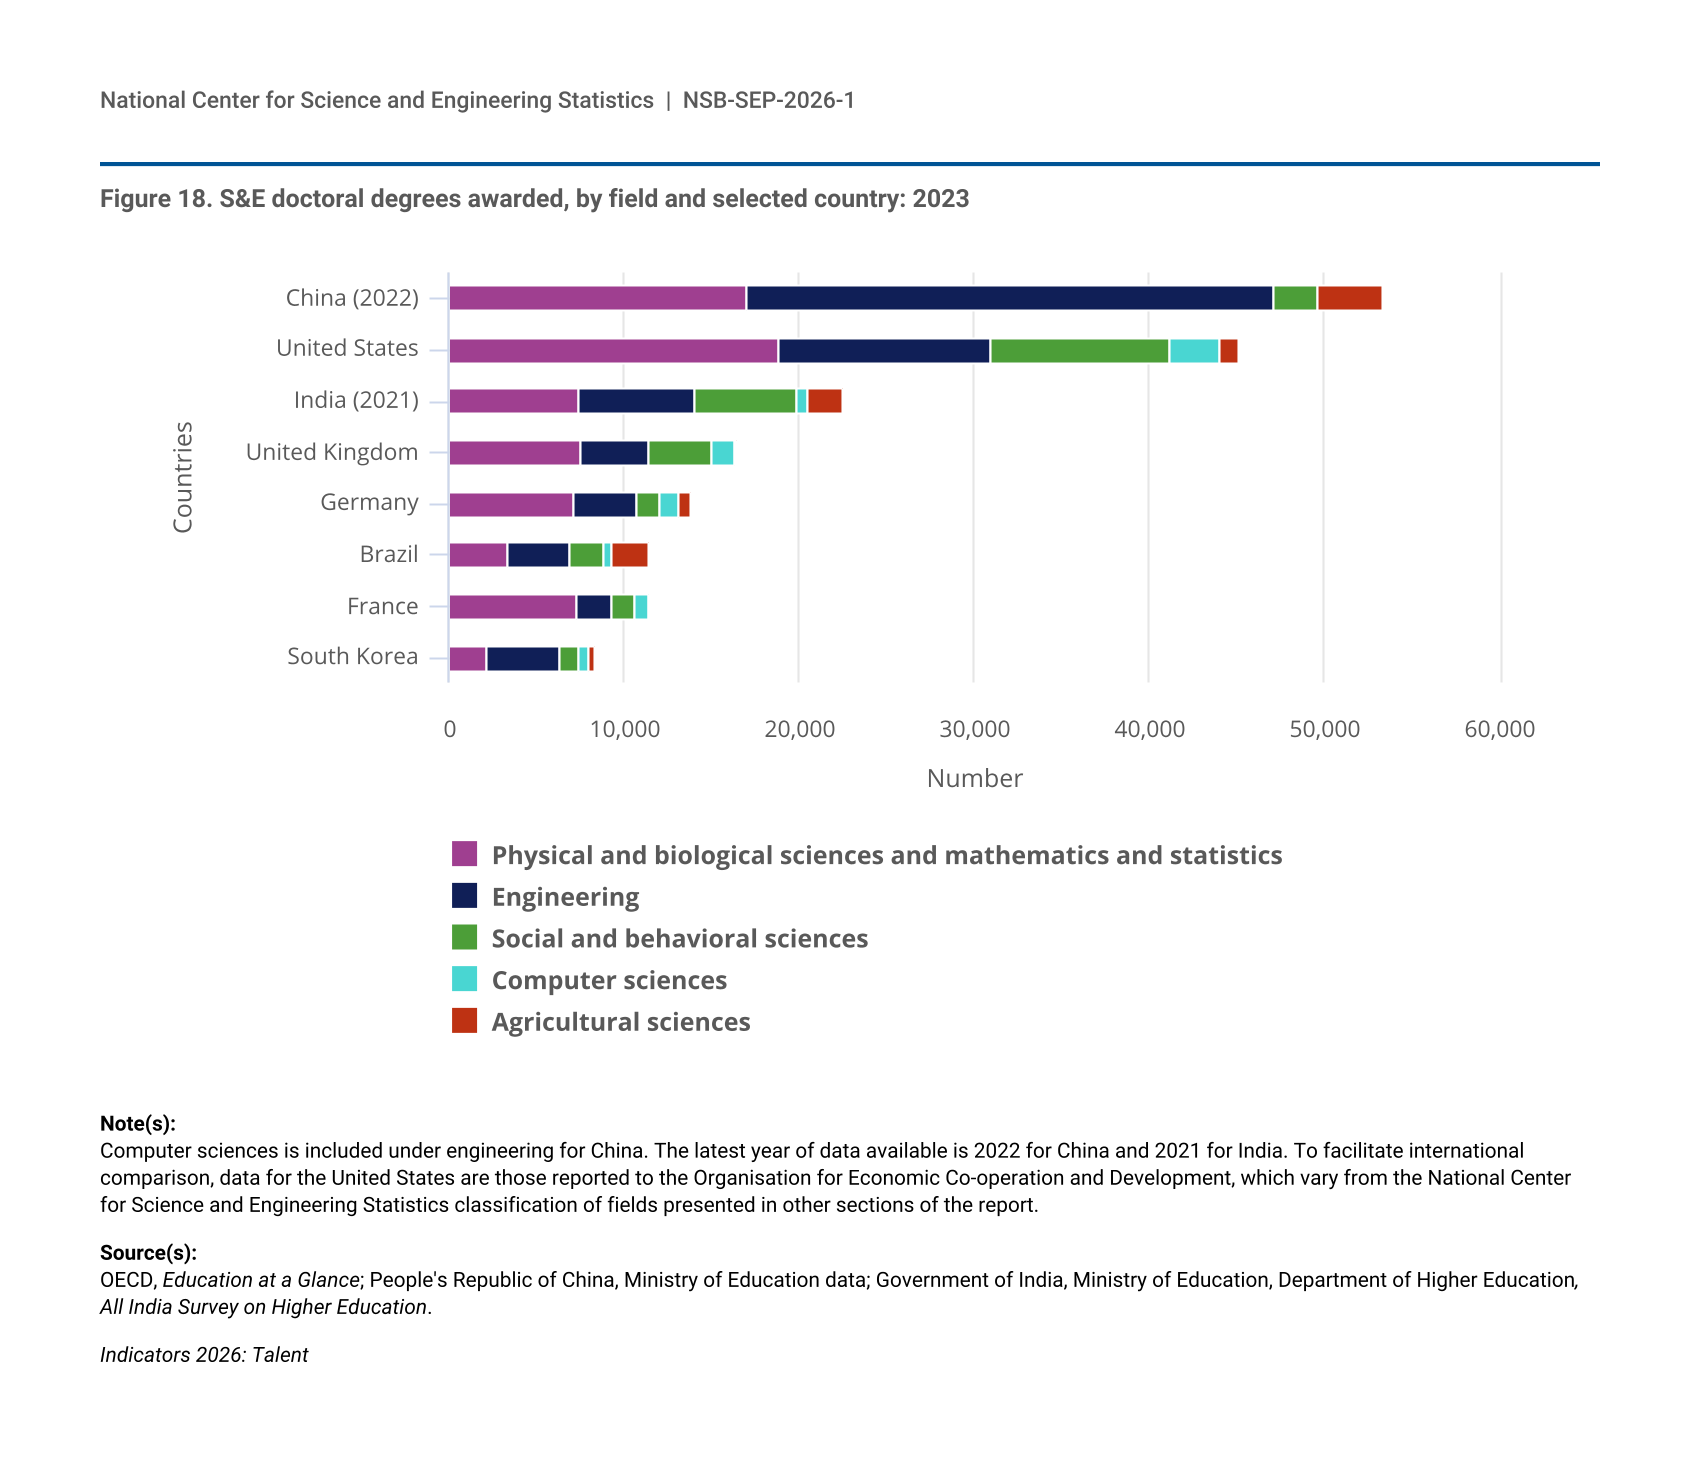
Figure 18.
S&E doctoral degrees awarded, by field and selected country: 2023
S&E doctoral degrees awarded, by field and selected country: 2023
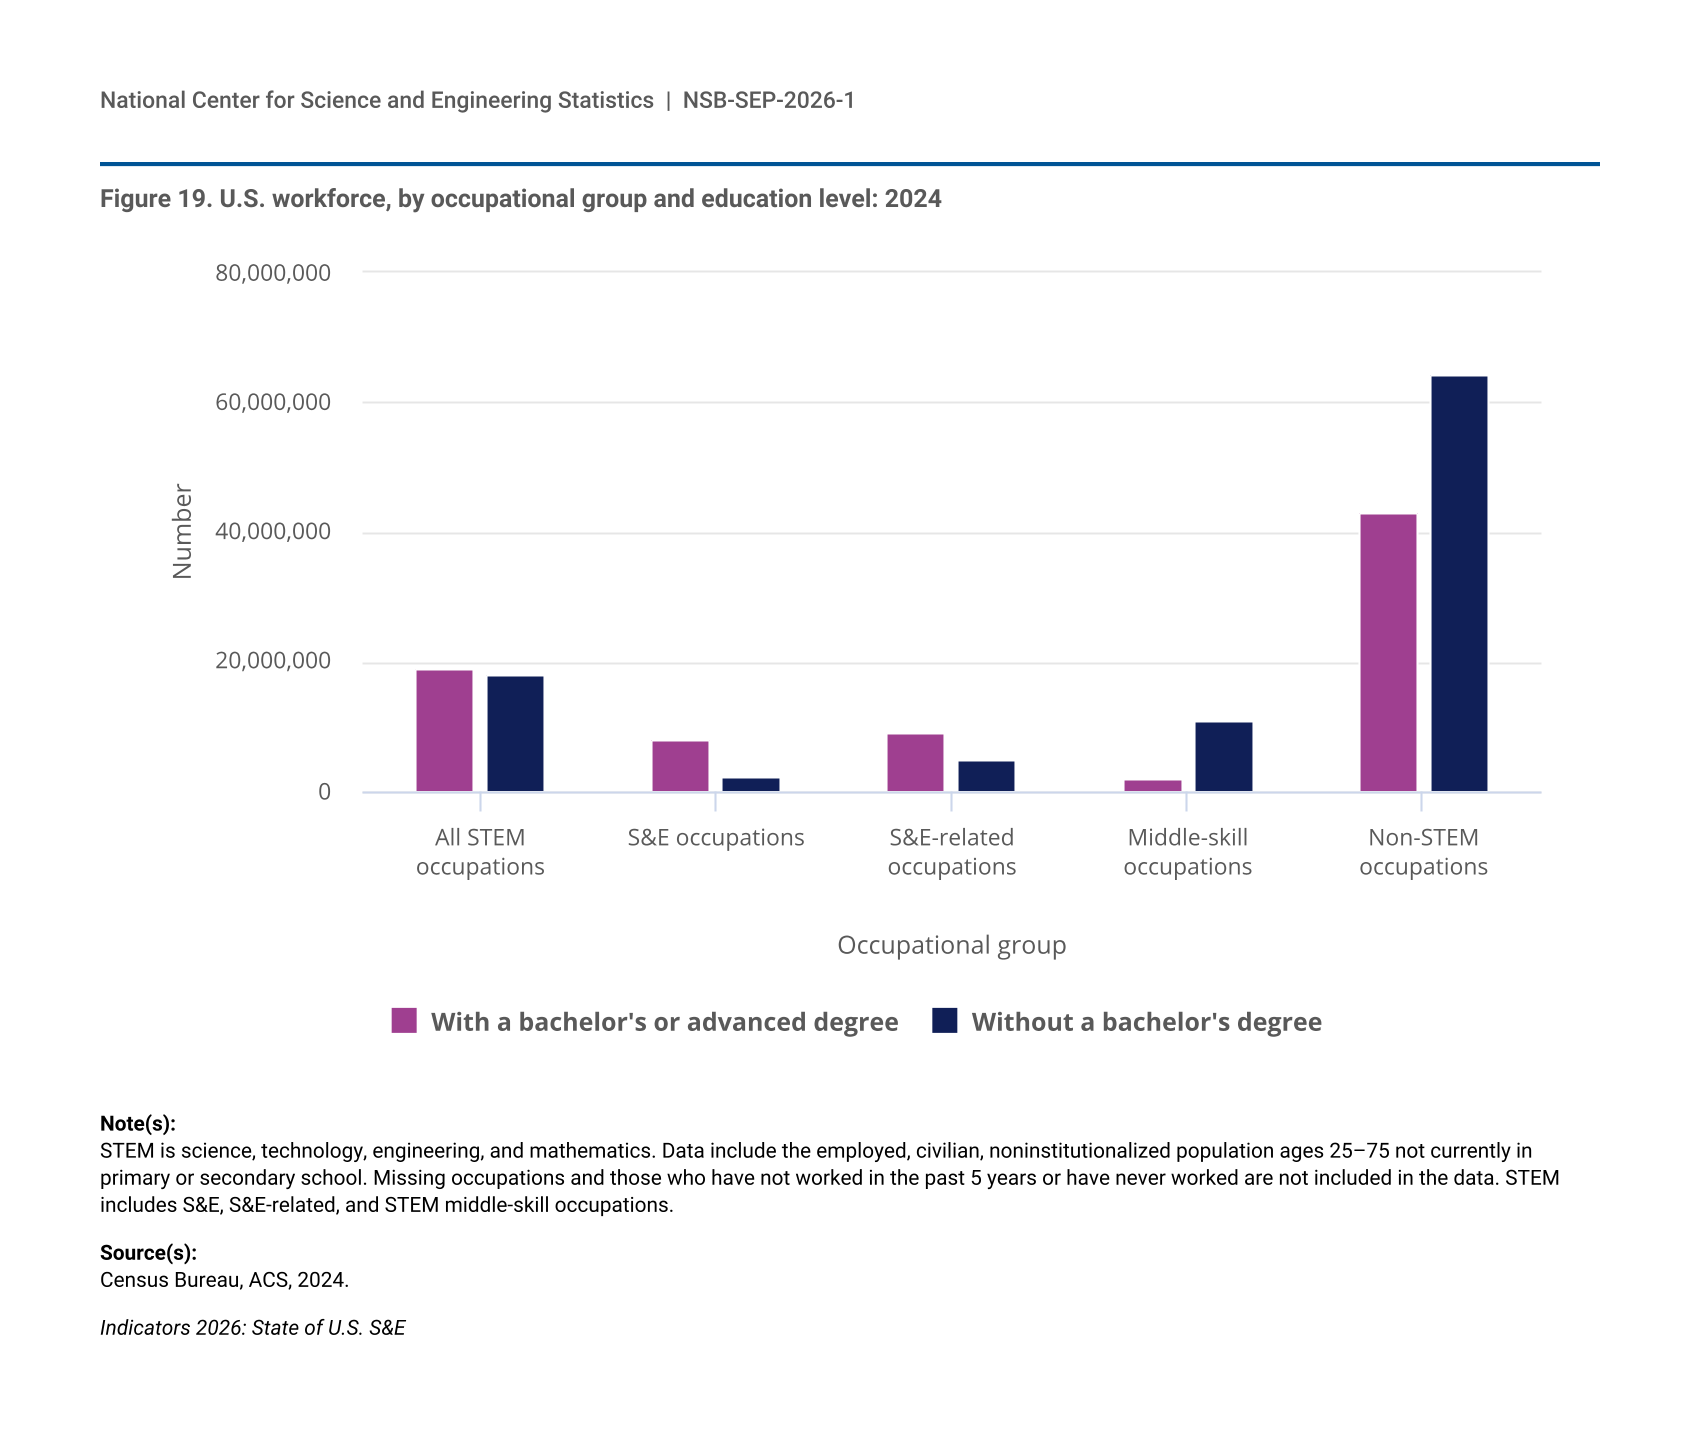
Figure 19.
U.S. workforce, by occupational group and education level: 2024
U.S. workforce, by occupational group and education level: 2024
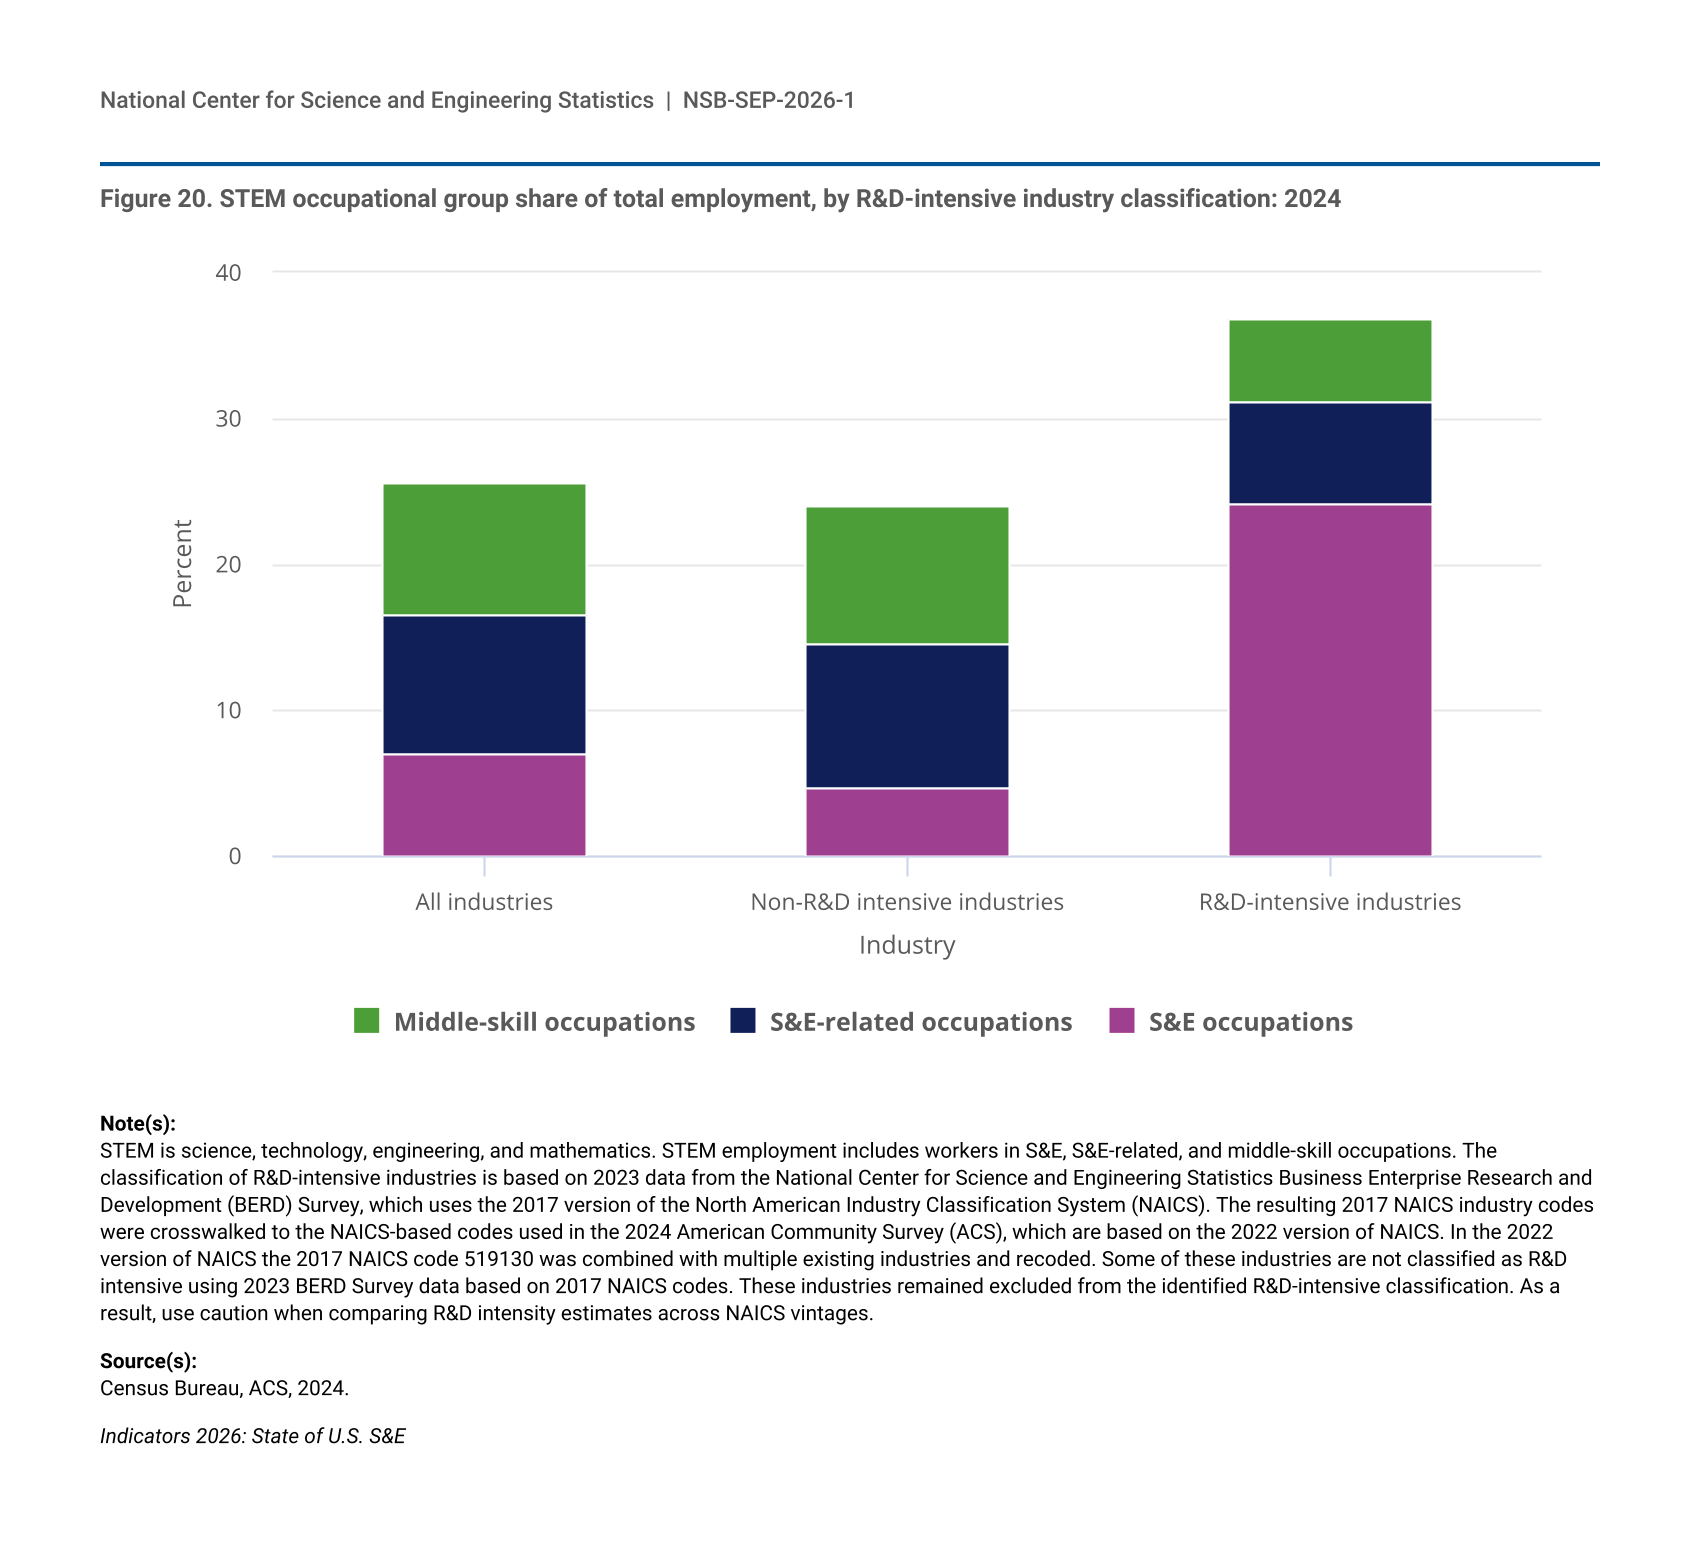
Figure 20.
STEM occupational group share of total employment, by R&D-intensive industry classification: 2024
STEM occupational group share of total employment, by R&D-intensive industry classification: 2024
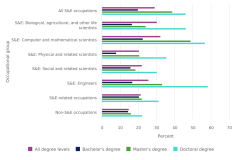
Figure 21.
Foreign-born share of workers with a bachelor's degree or higher, by highest degree level and occupational group: 2023
Foreign-born share of workers with a bachelor's degree or higher, by highest degree level and occupational group: 2023
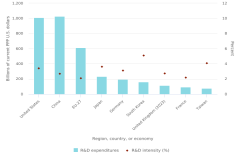
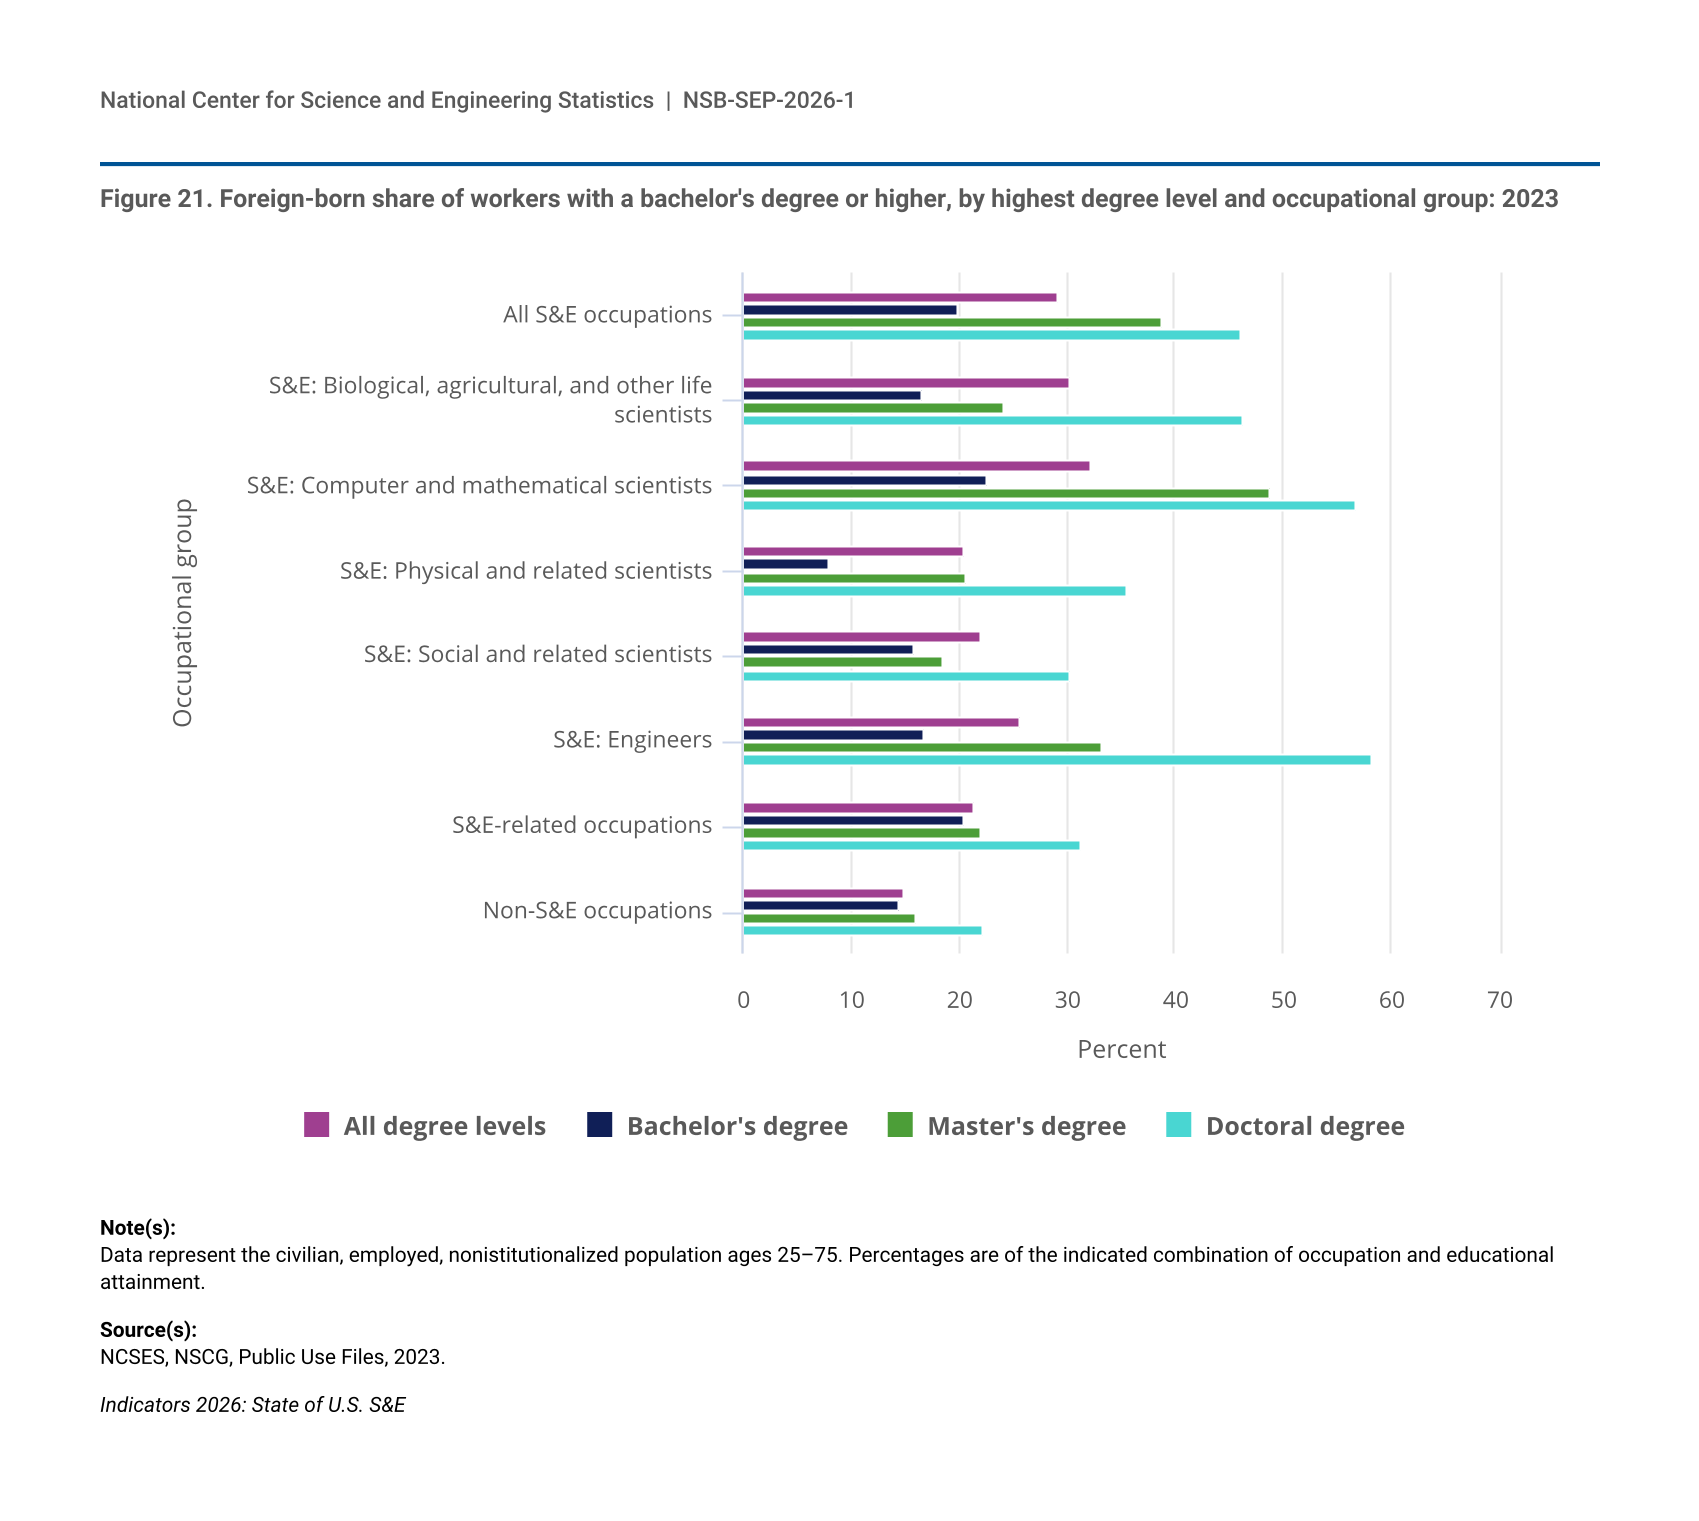
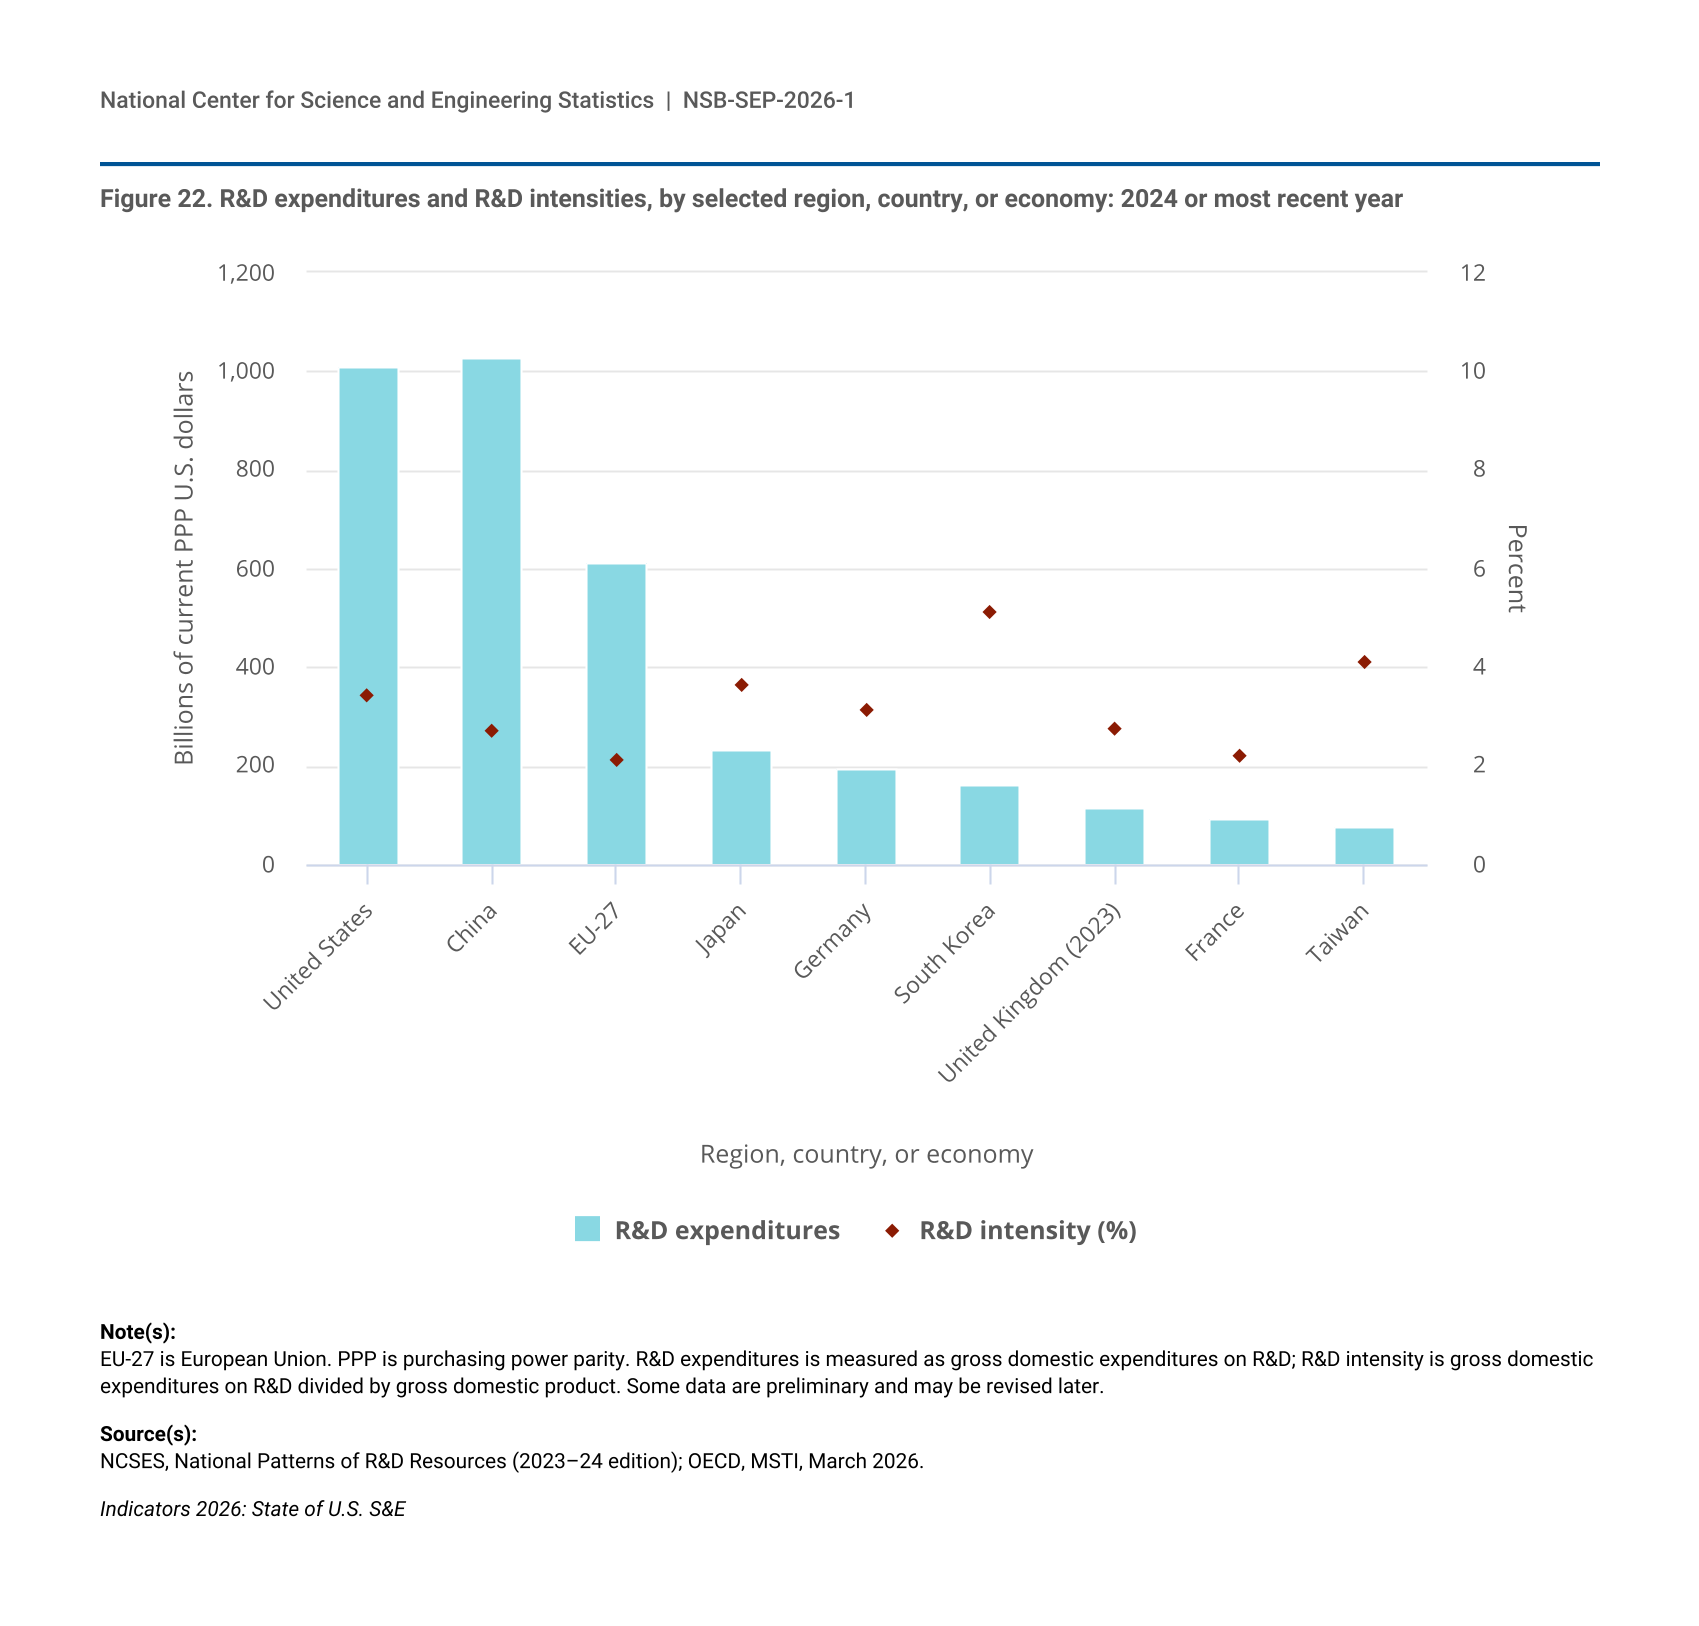
Figure 22.
R&D expenditures and R&D intensities, by selected region, country, or economy: 2024 or most recent year
R&D expenditures and R&D intensities, by selected region, country, or economy: 2024 or most recent year
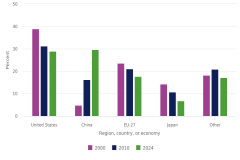
Figure 23.
Share of global R&D expenditures, by selected region, country, or economy: 2000, 2010, and 2024
Share of global R&D expenditures, by selected region, country, or economy: 2000, 2010, and 2024
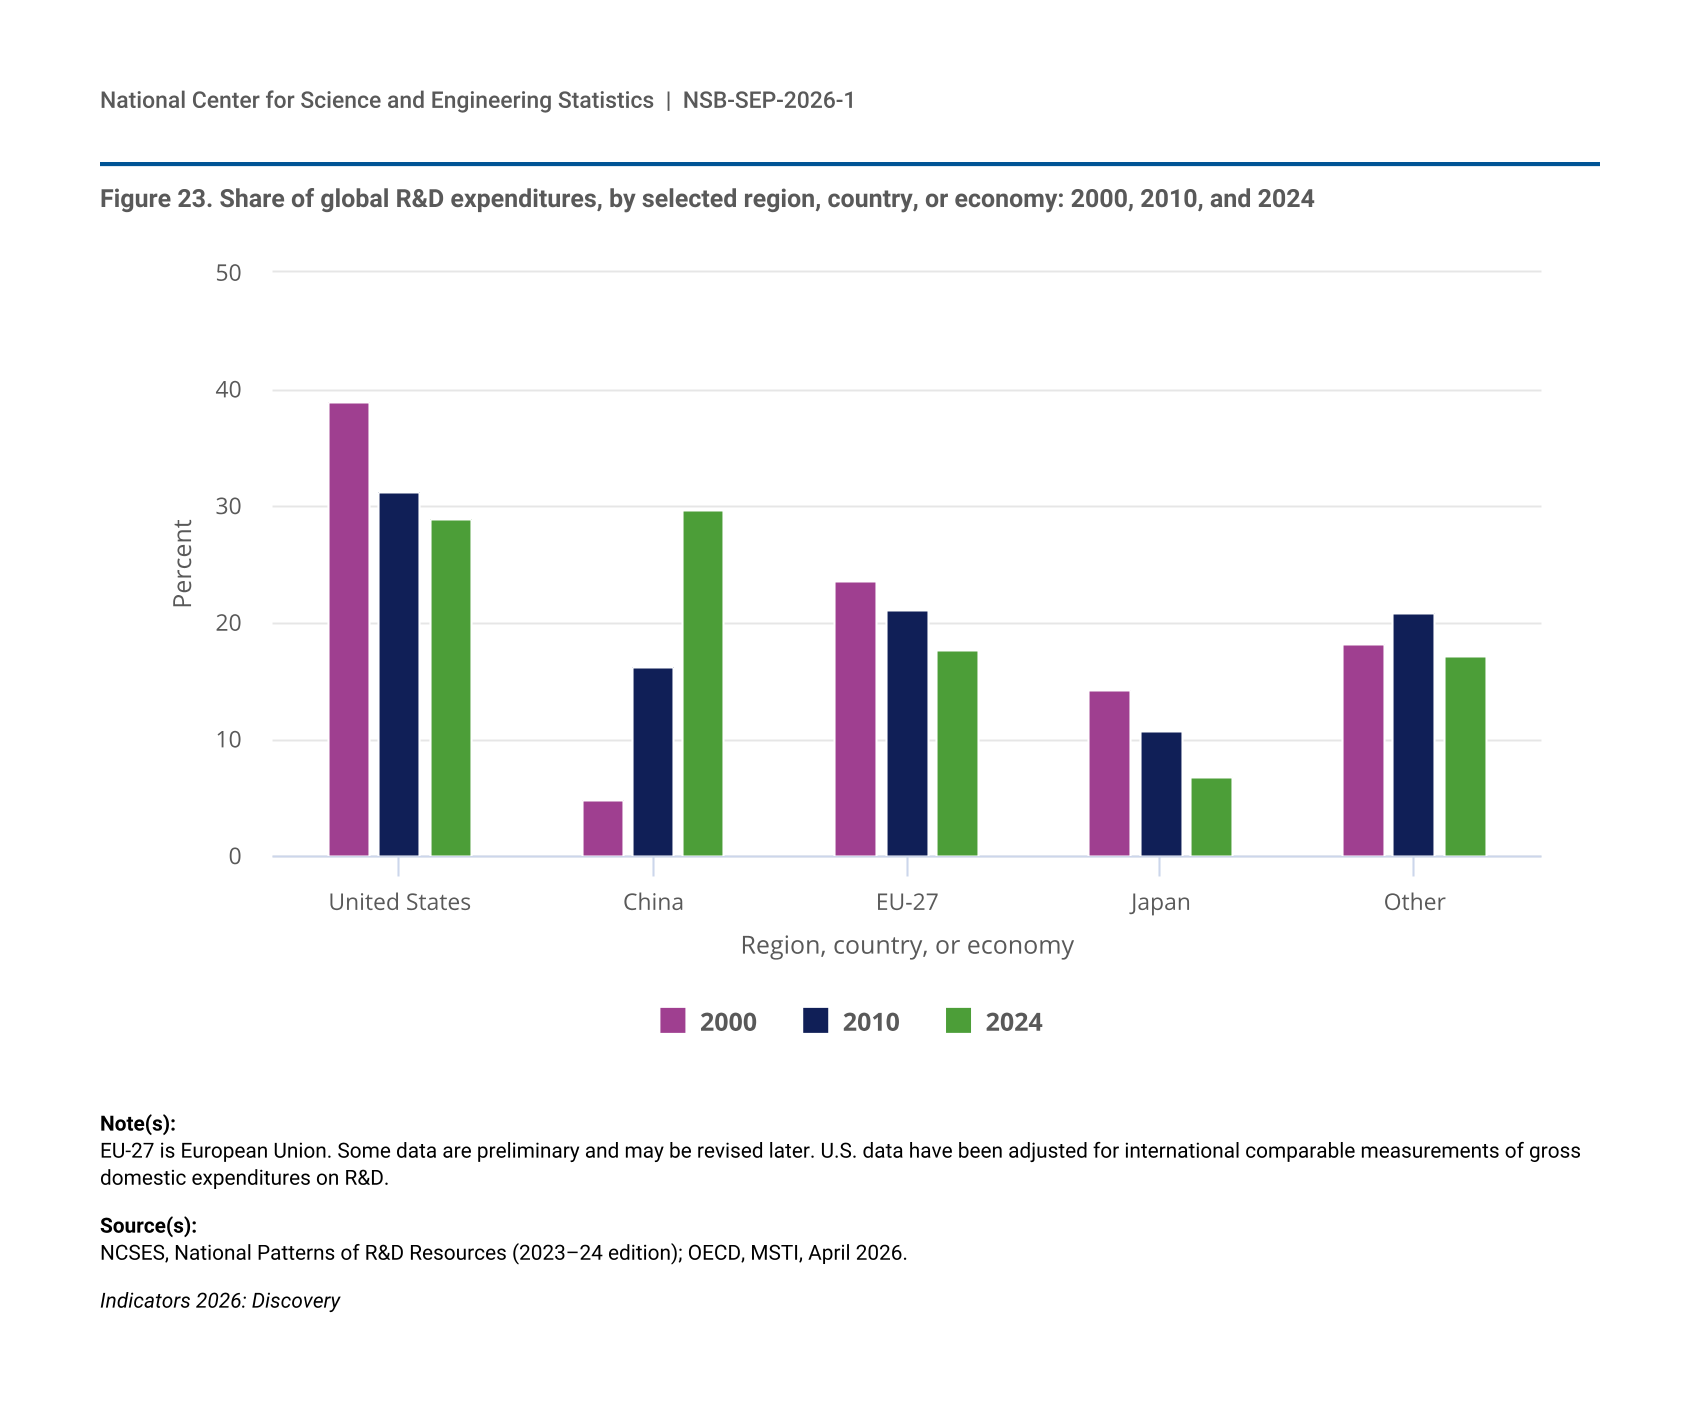
Figure 24.
Business R&D expenditures, by selected industry and selected region, country, or economy: 2022
Business R&D expenditures, by selected industry and selected region, country, or economy: 2022
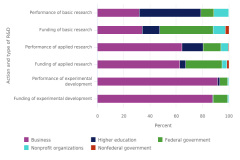
Figure 25.
U.S. R&D expenditures, by type of R&D and performer or funder: 2024
U.S. R&D expenditures, by type of R&D and performer or funder: 2024
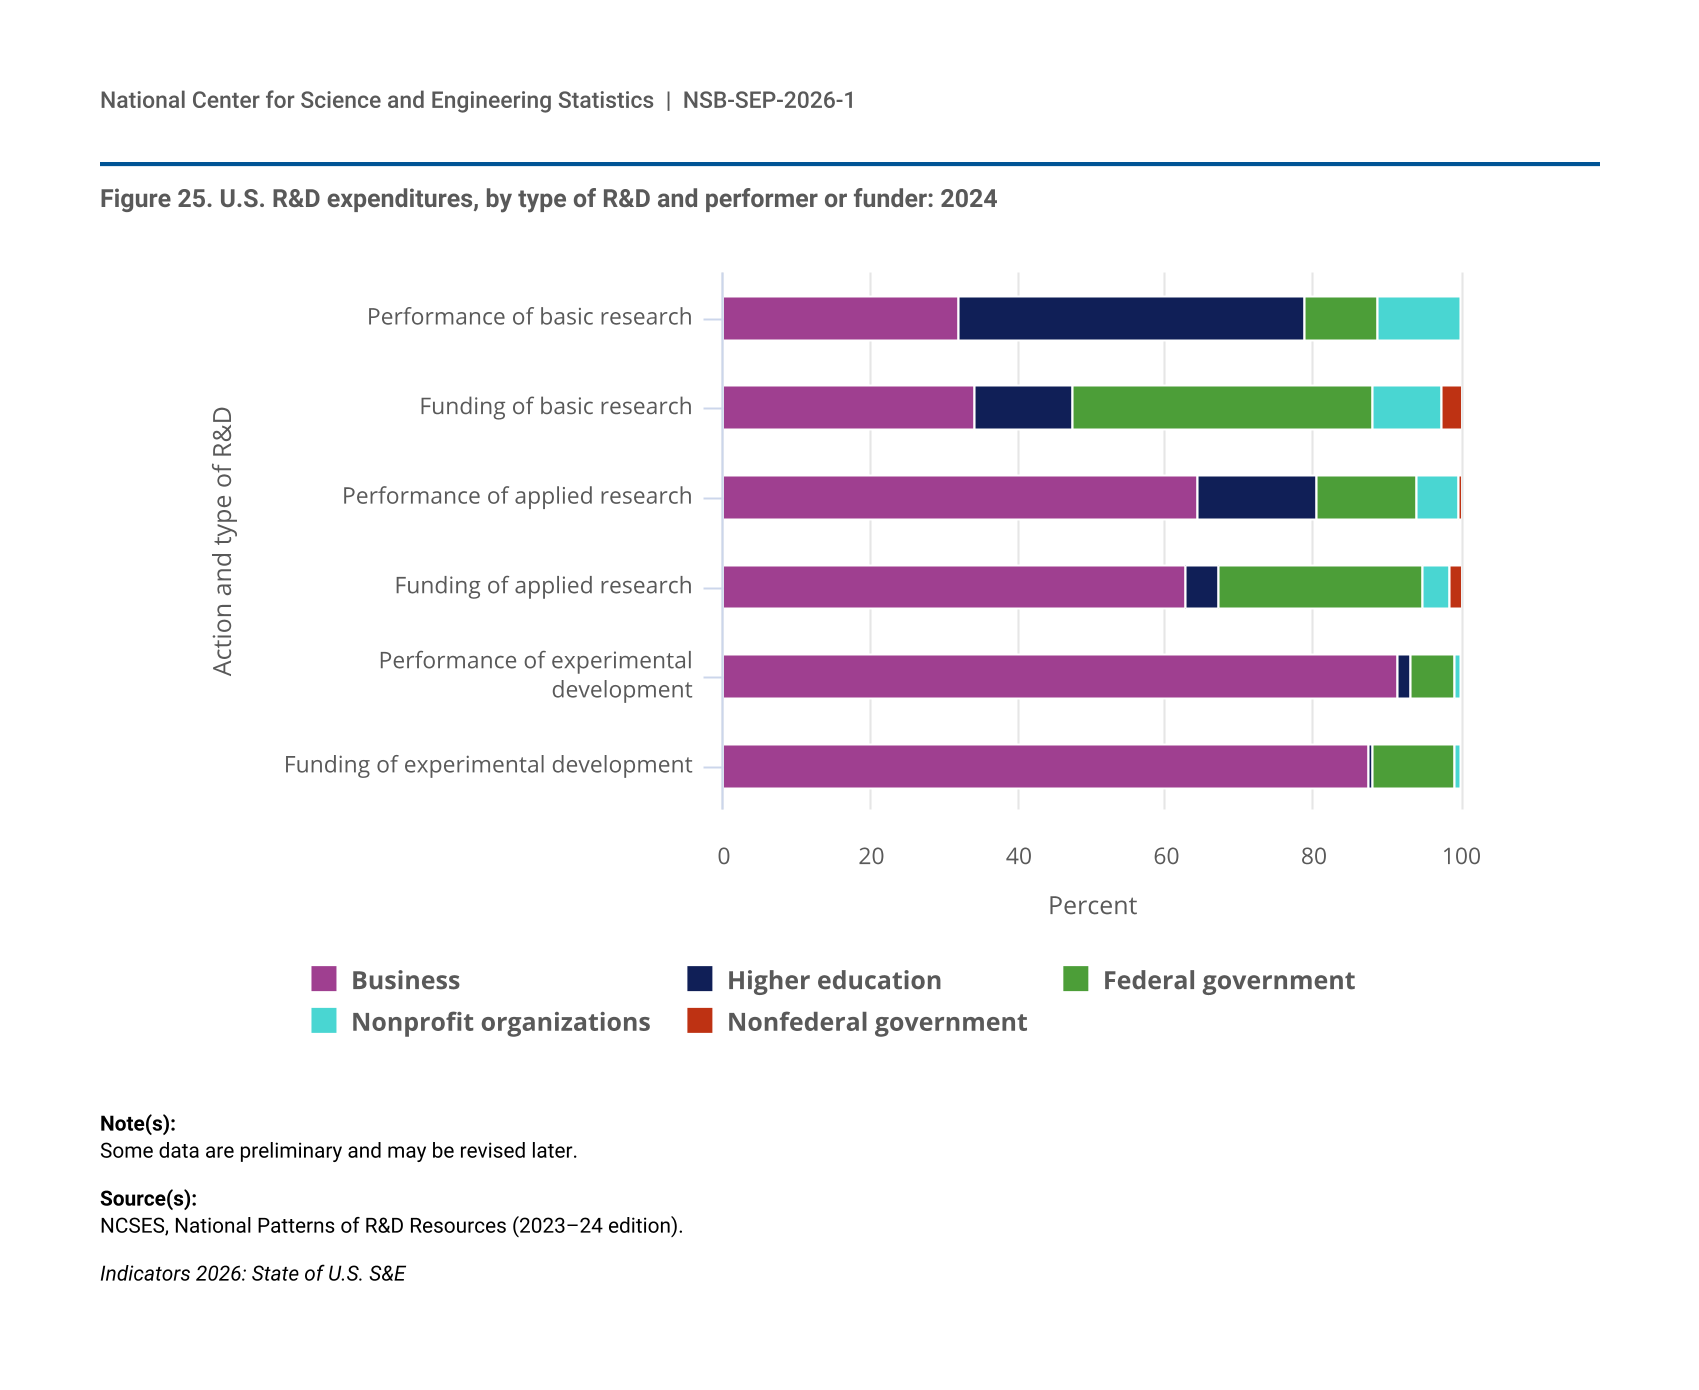
Figure 26.
U.S. business R&D expenditures, by selected manufacturing or services industry: 2023
U.S. business R&D expenditures, by selected manufacturing or services industry: 2023
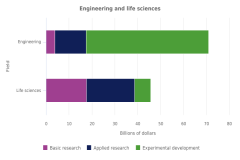
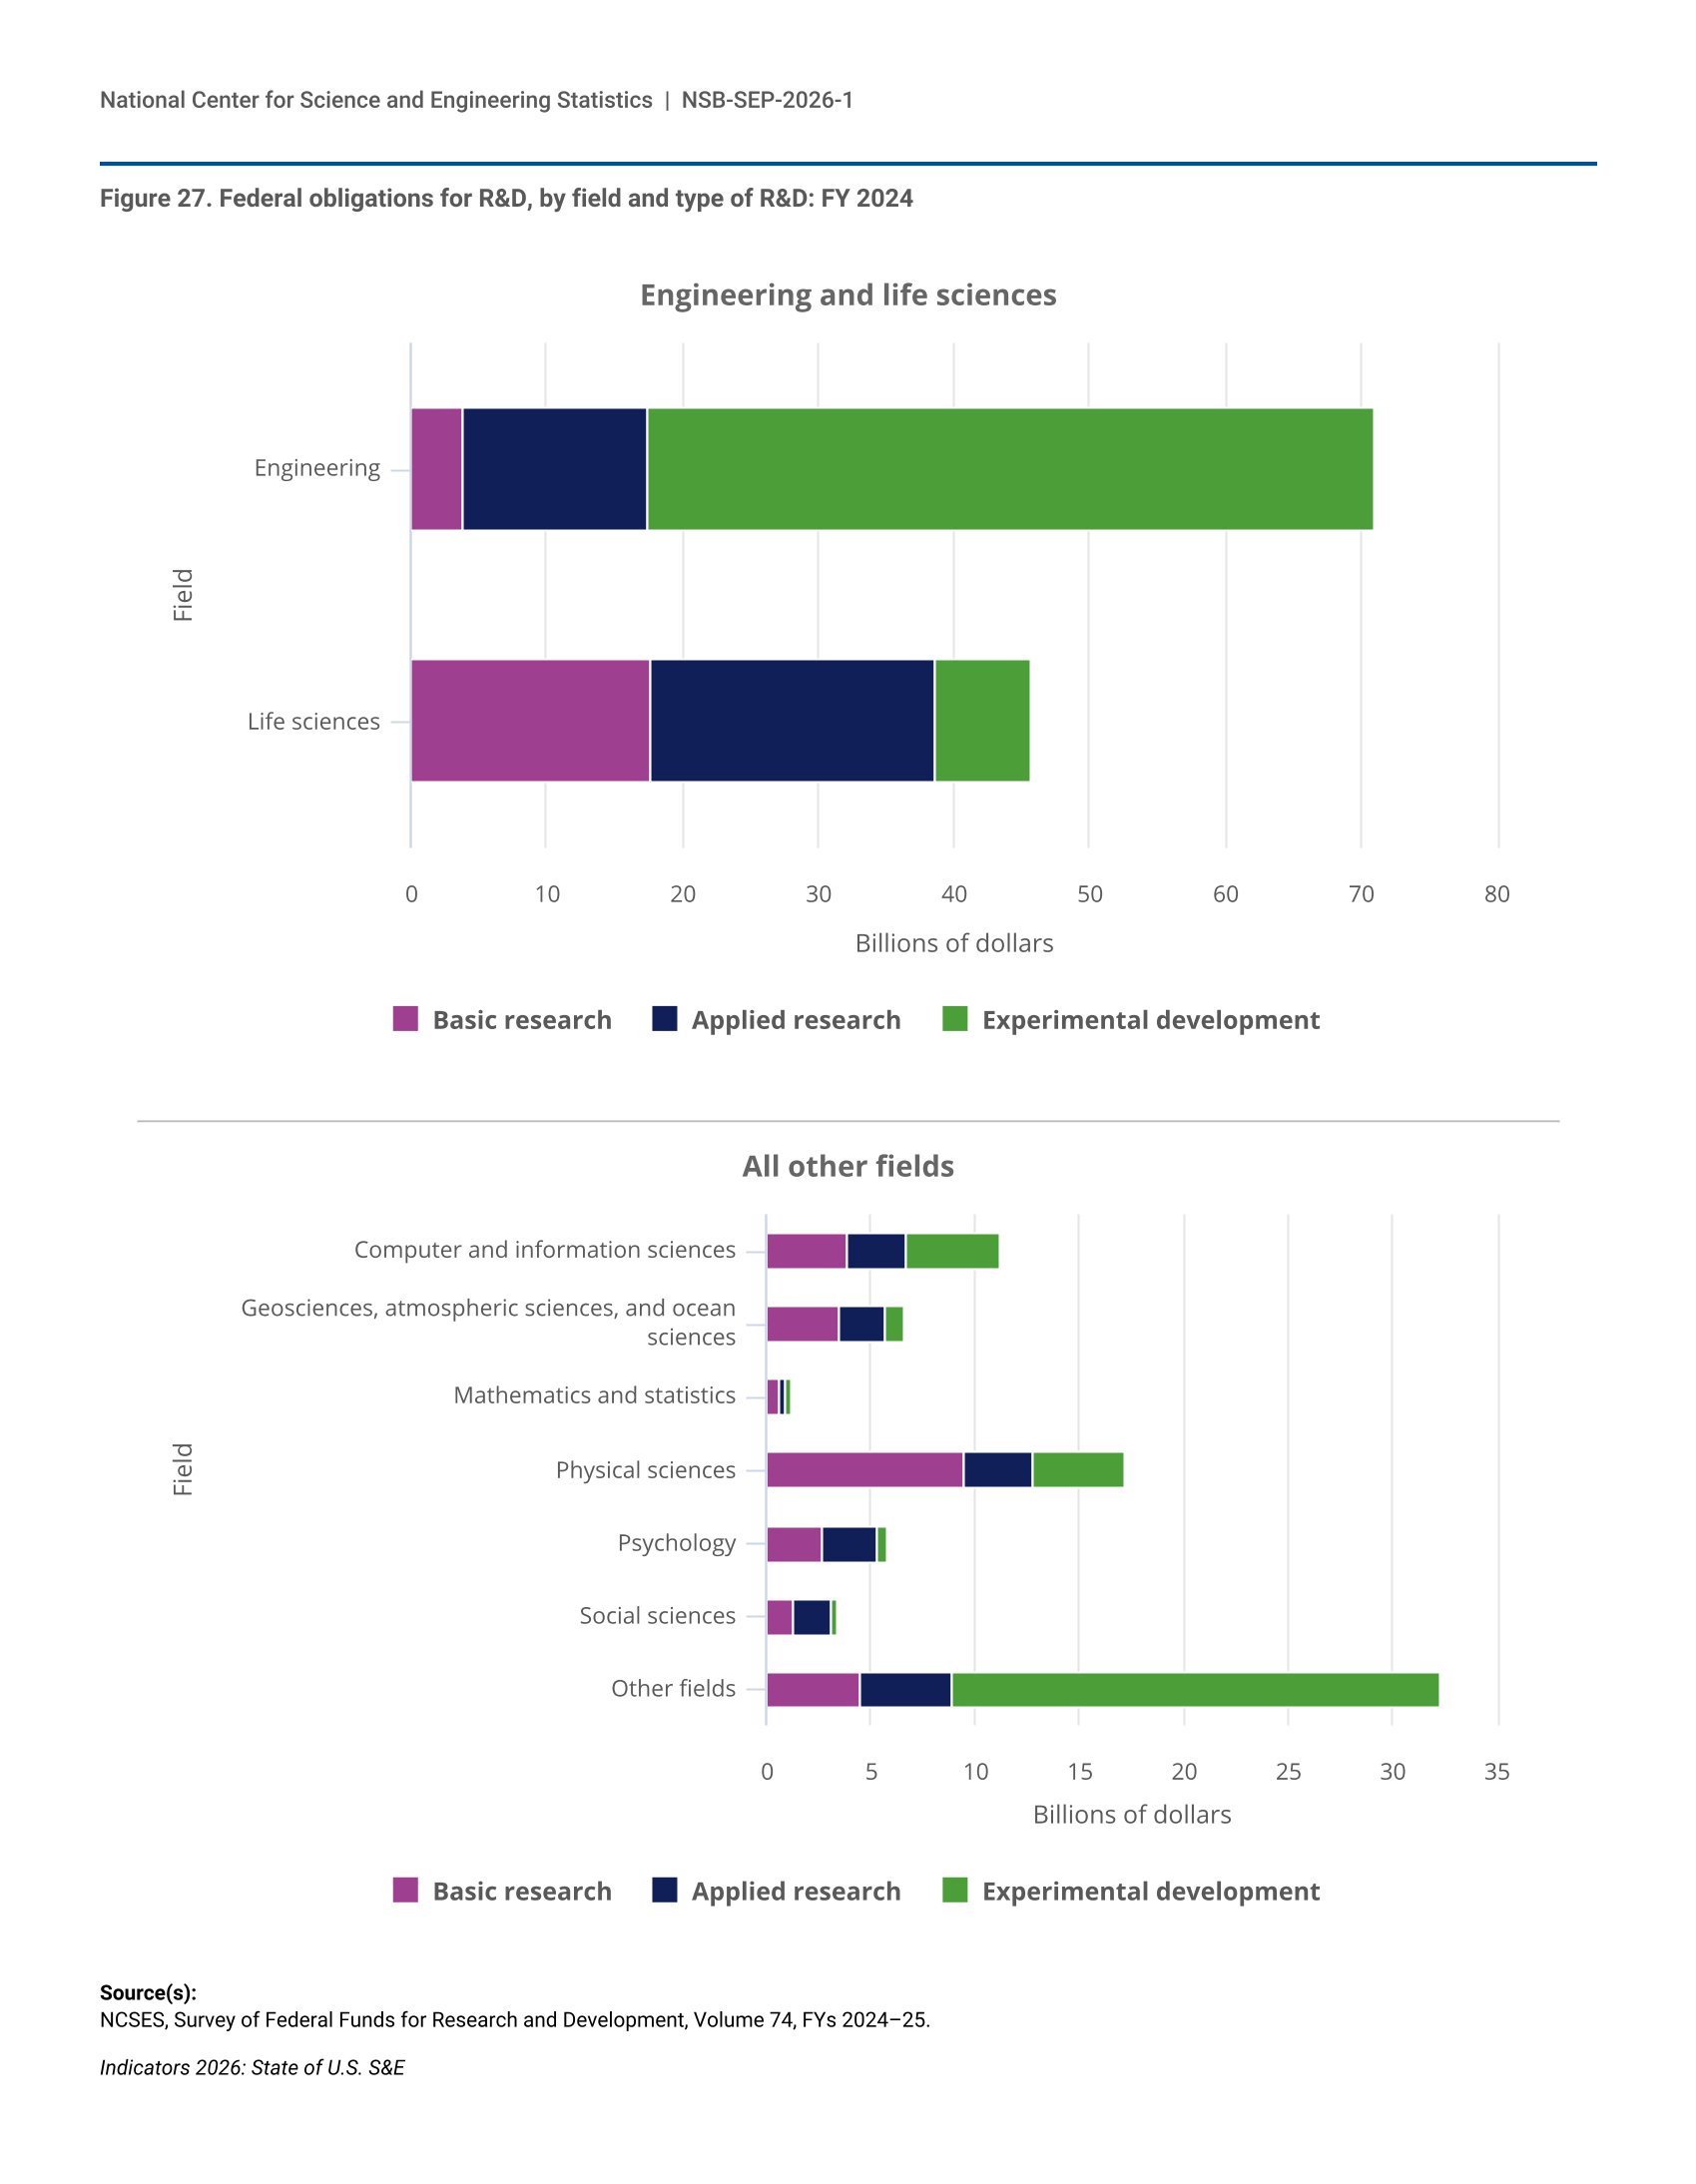
Figure 27.
Federal obligations for R&D, by field and type of R&D: FY 2024
Federal obligations for R&D, by field and type of R&D: FY 2024
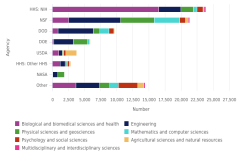
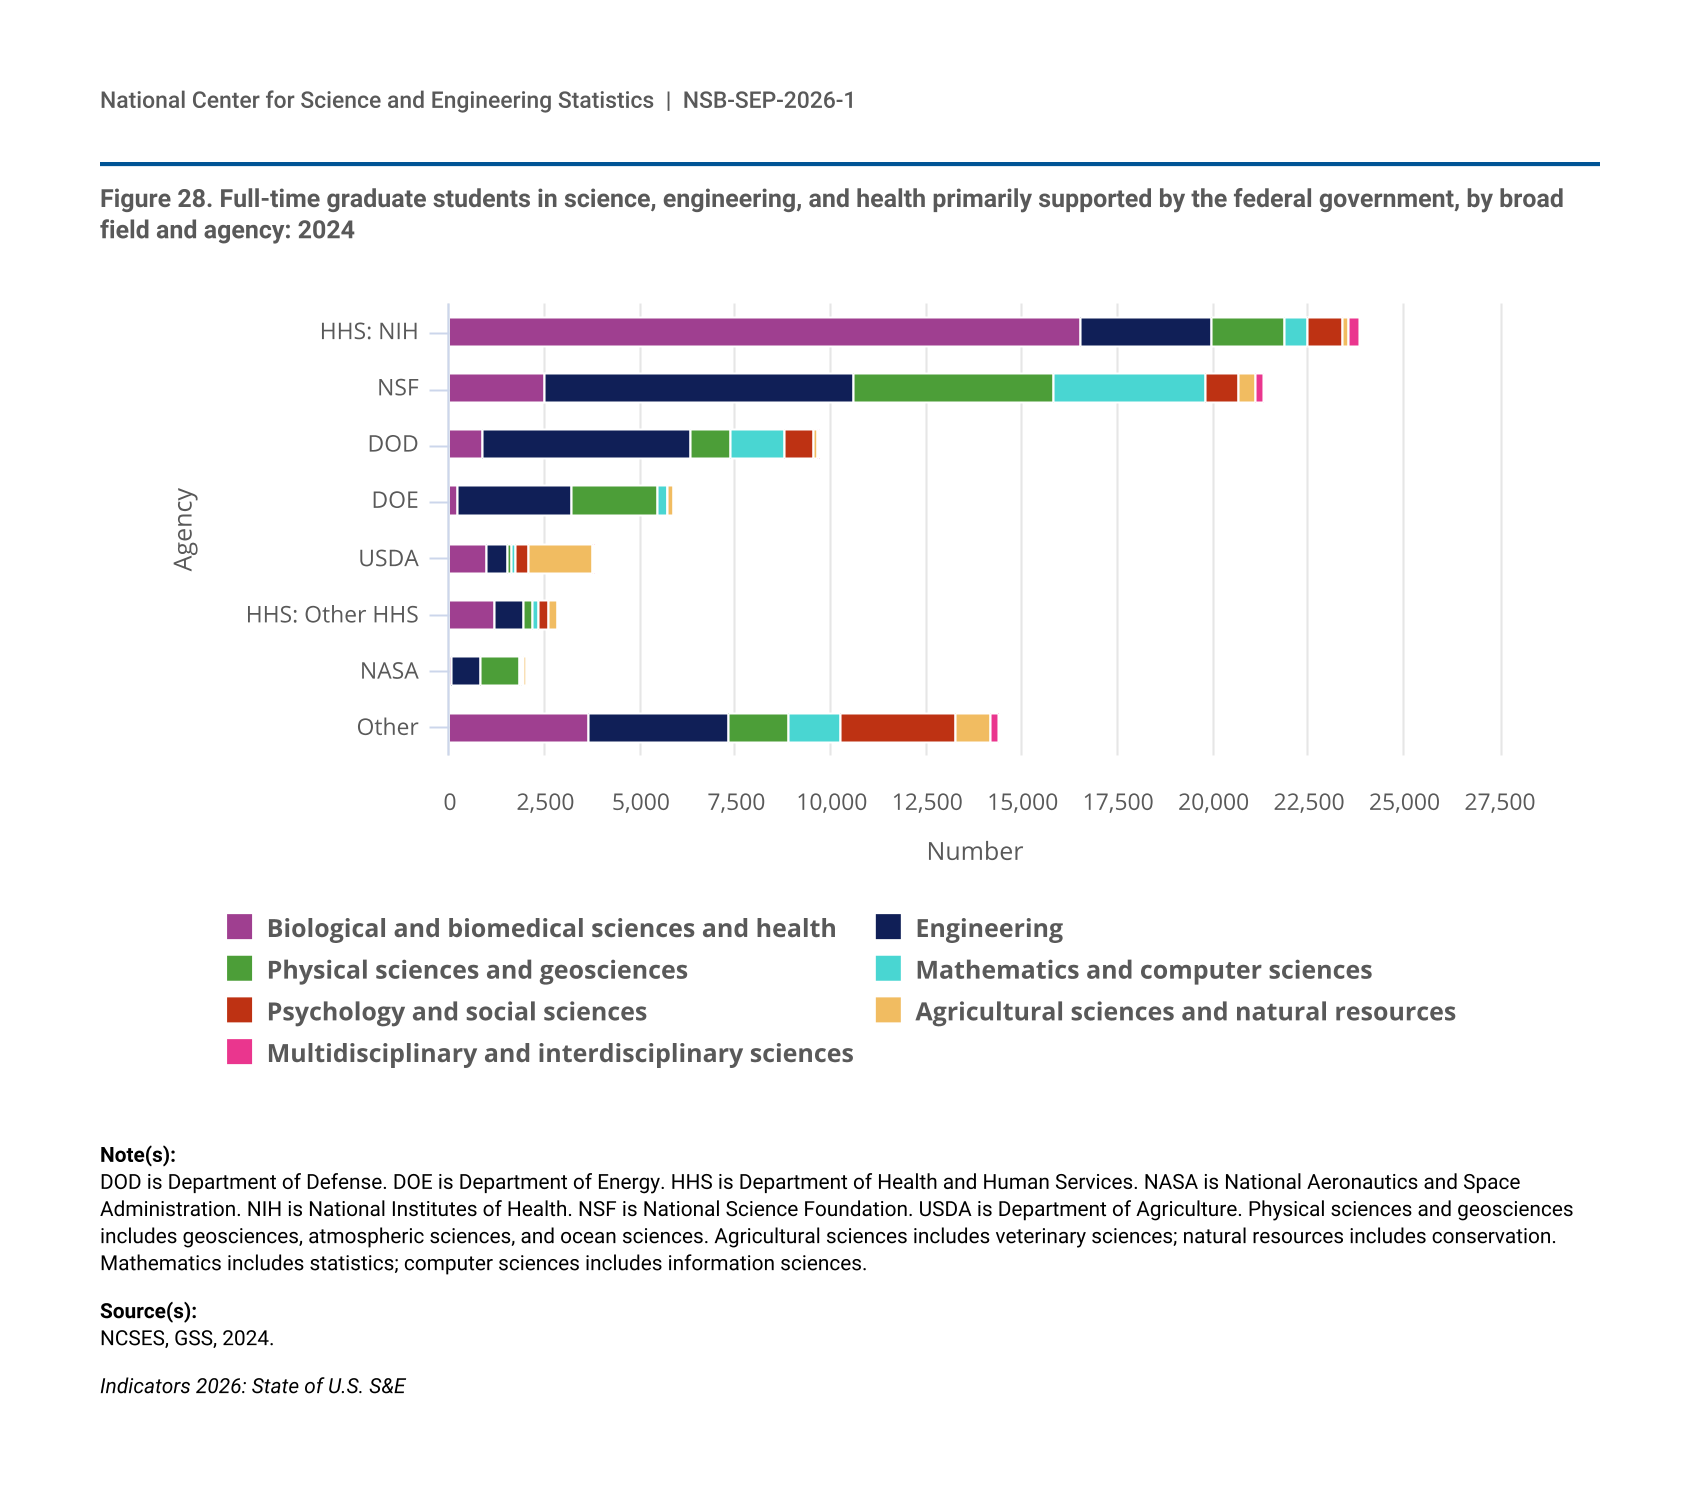
Figure 28.
Full-time graduate students in science, engineering, and health primarily supported by the federal government, by broad field and agency: 2024
Full-time graduate students in science, engineering, and health primarily supported by the federal government, by broad field and agency: 2024
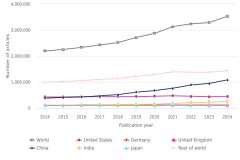
Figure 29.
S&E publications, by selected country and rest of world: 2014–24
S&E publications, by selected country and rest of world: 2014–24
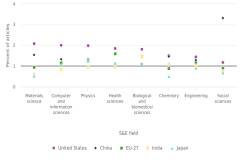
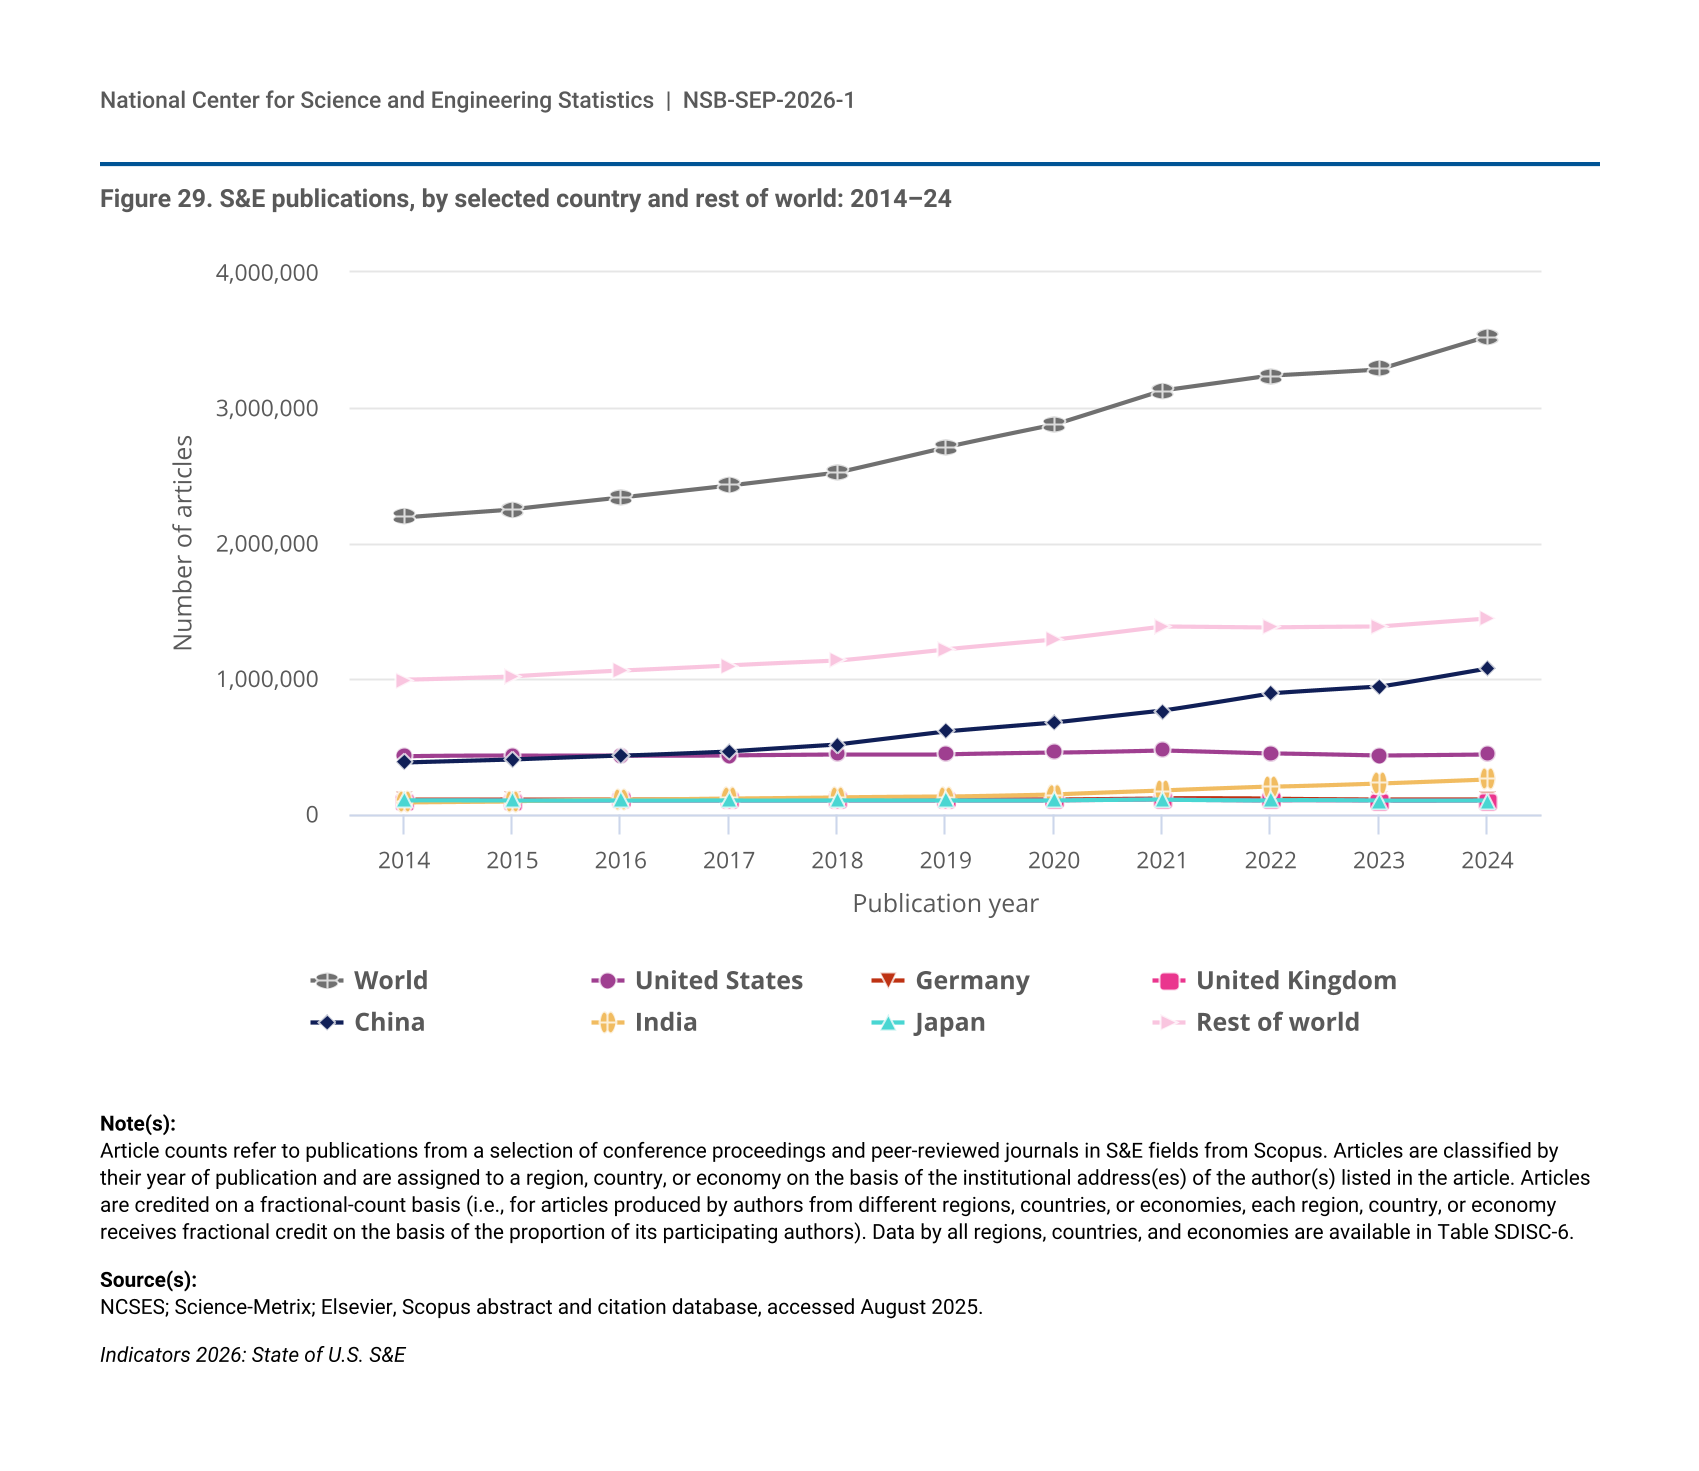
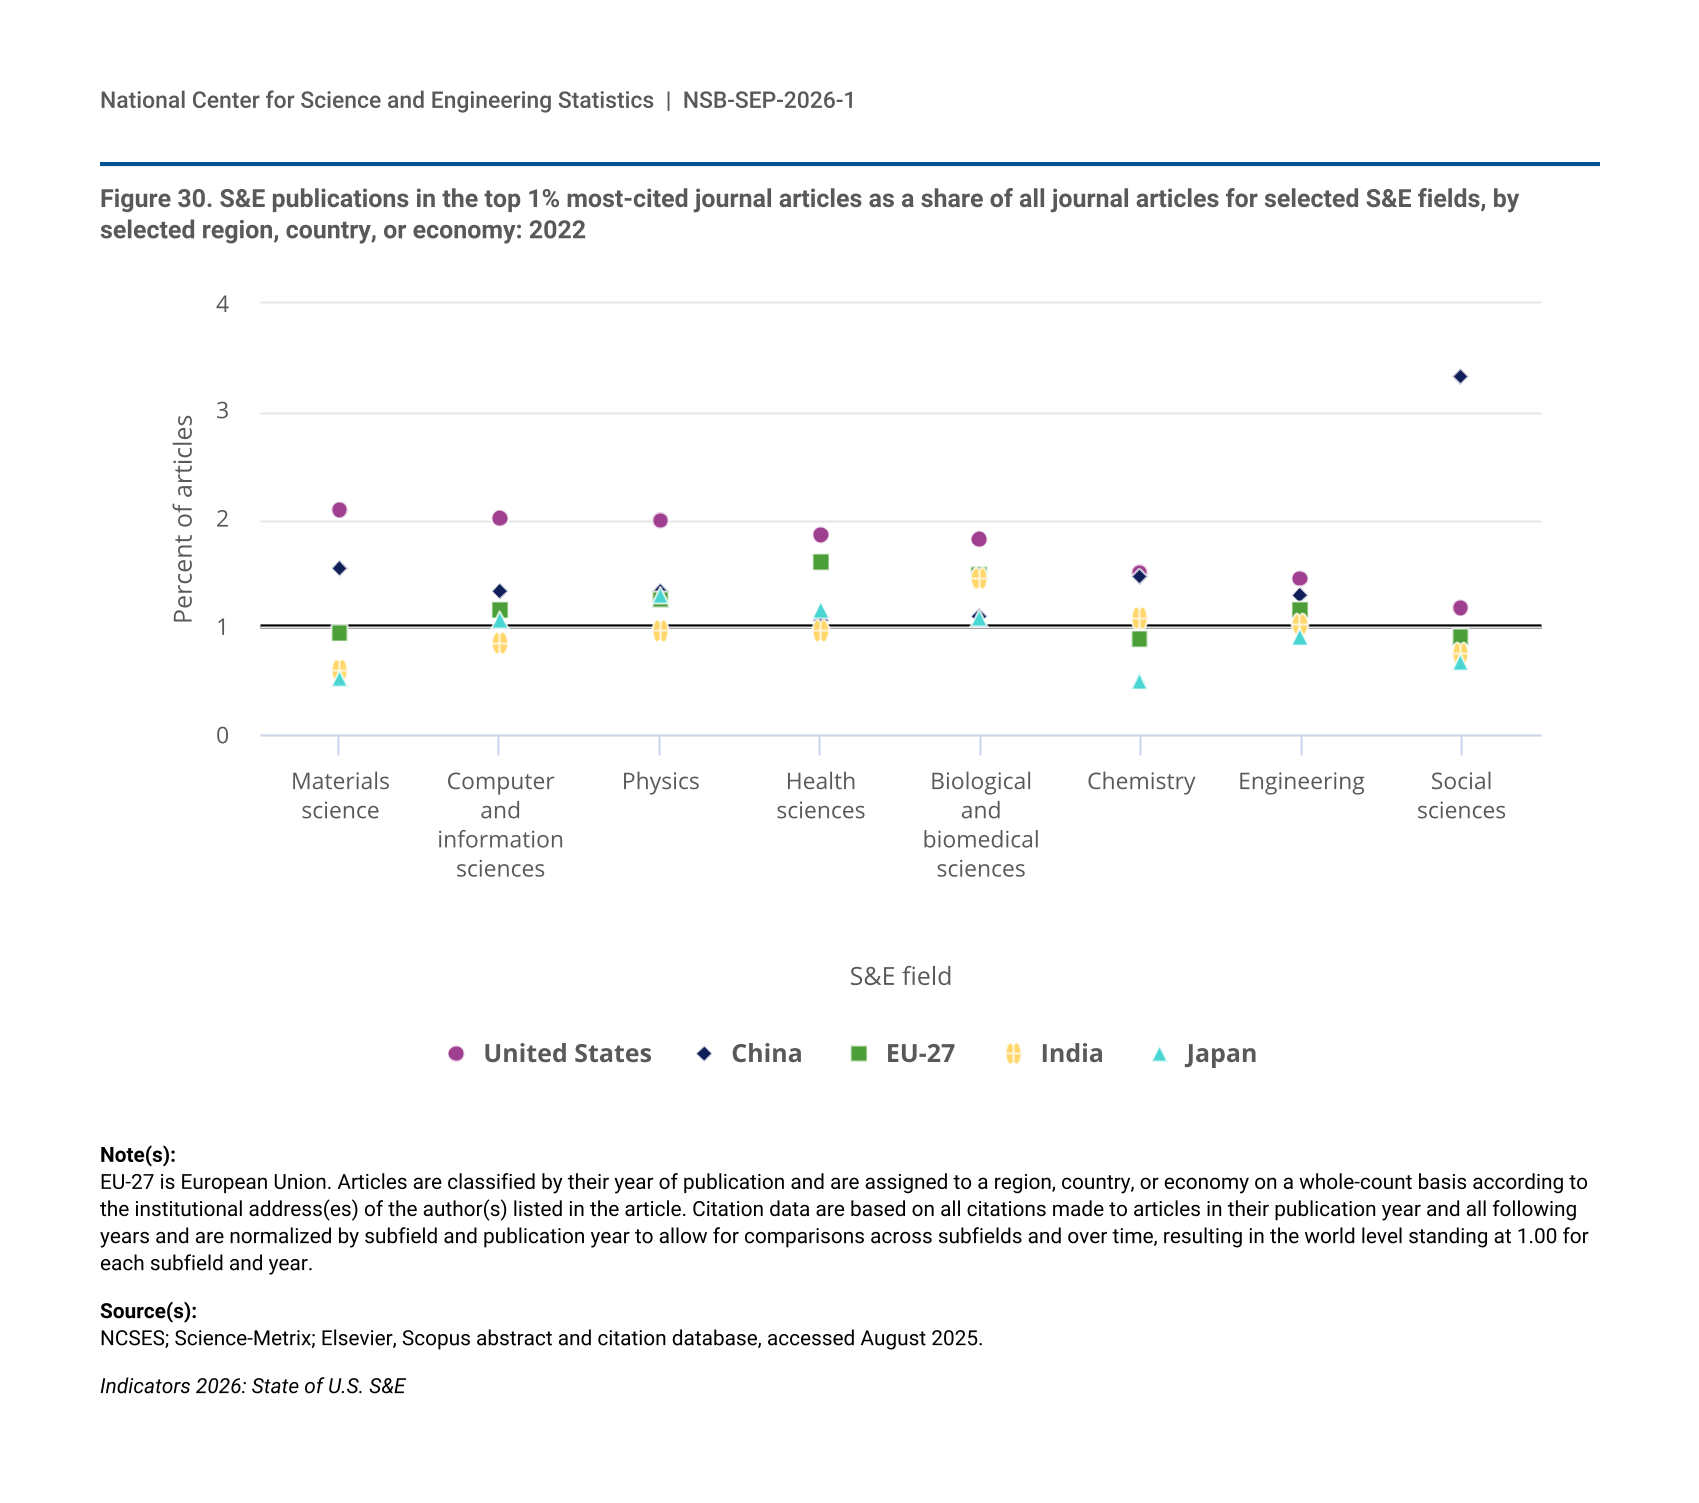
Figure 30.
S&E publications in the top 1% most-cited journal articles as a share of all journal articles for selected S&E fields, by selected region, country, or economy: 2022
S&E publications in the top 1% most-cited journal articles as a share of all journal articles for selected S&E fields, by selected region, country, or economy: 2022
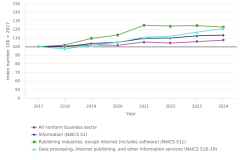
Figure 31.
Total factor productivity, U.S. nonfarm business sector and information industries: 2017–24
Total factor productivity, U.S. nonfarm business sector and information industries: 2017–24
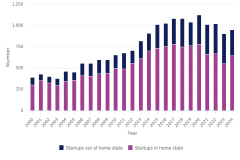
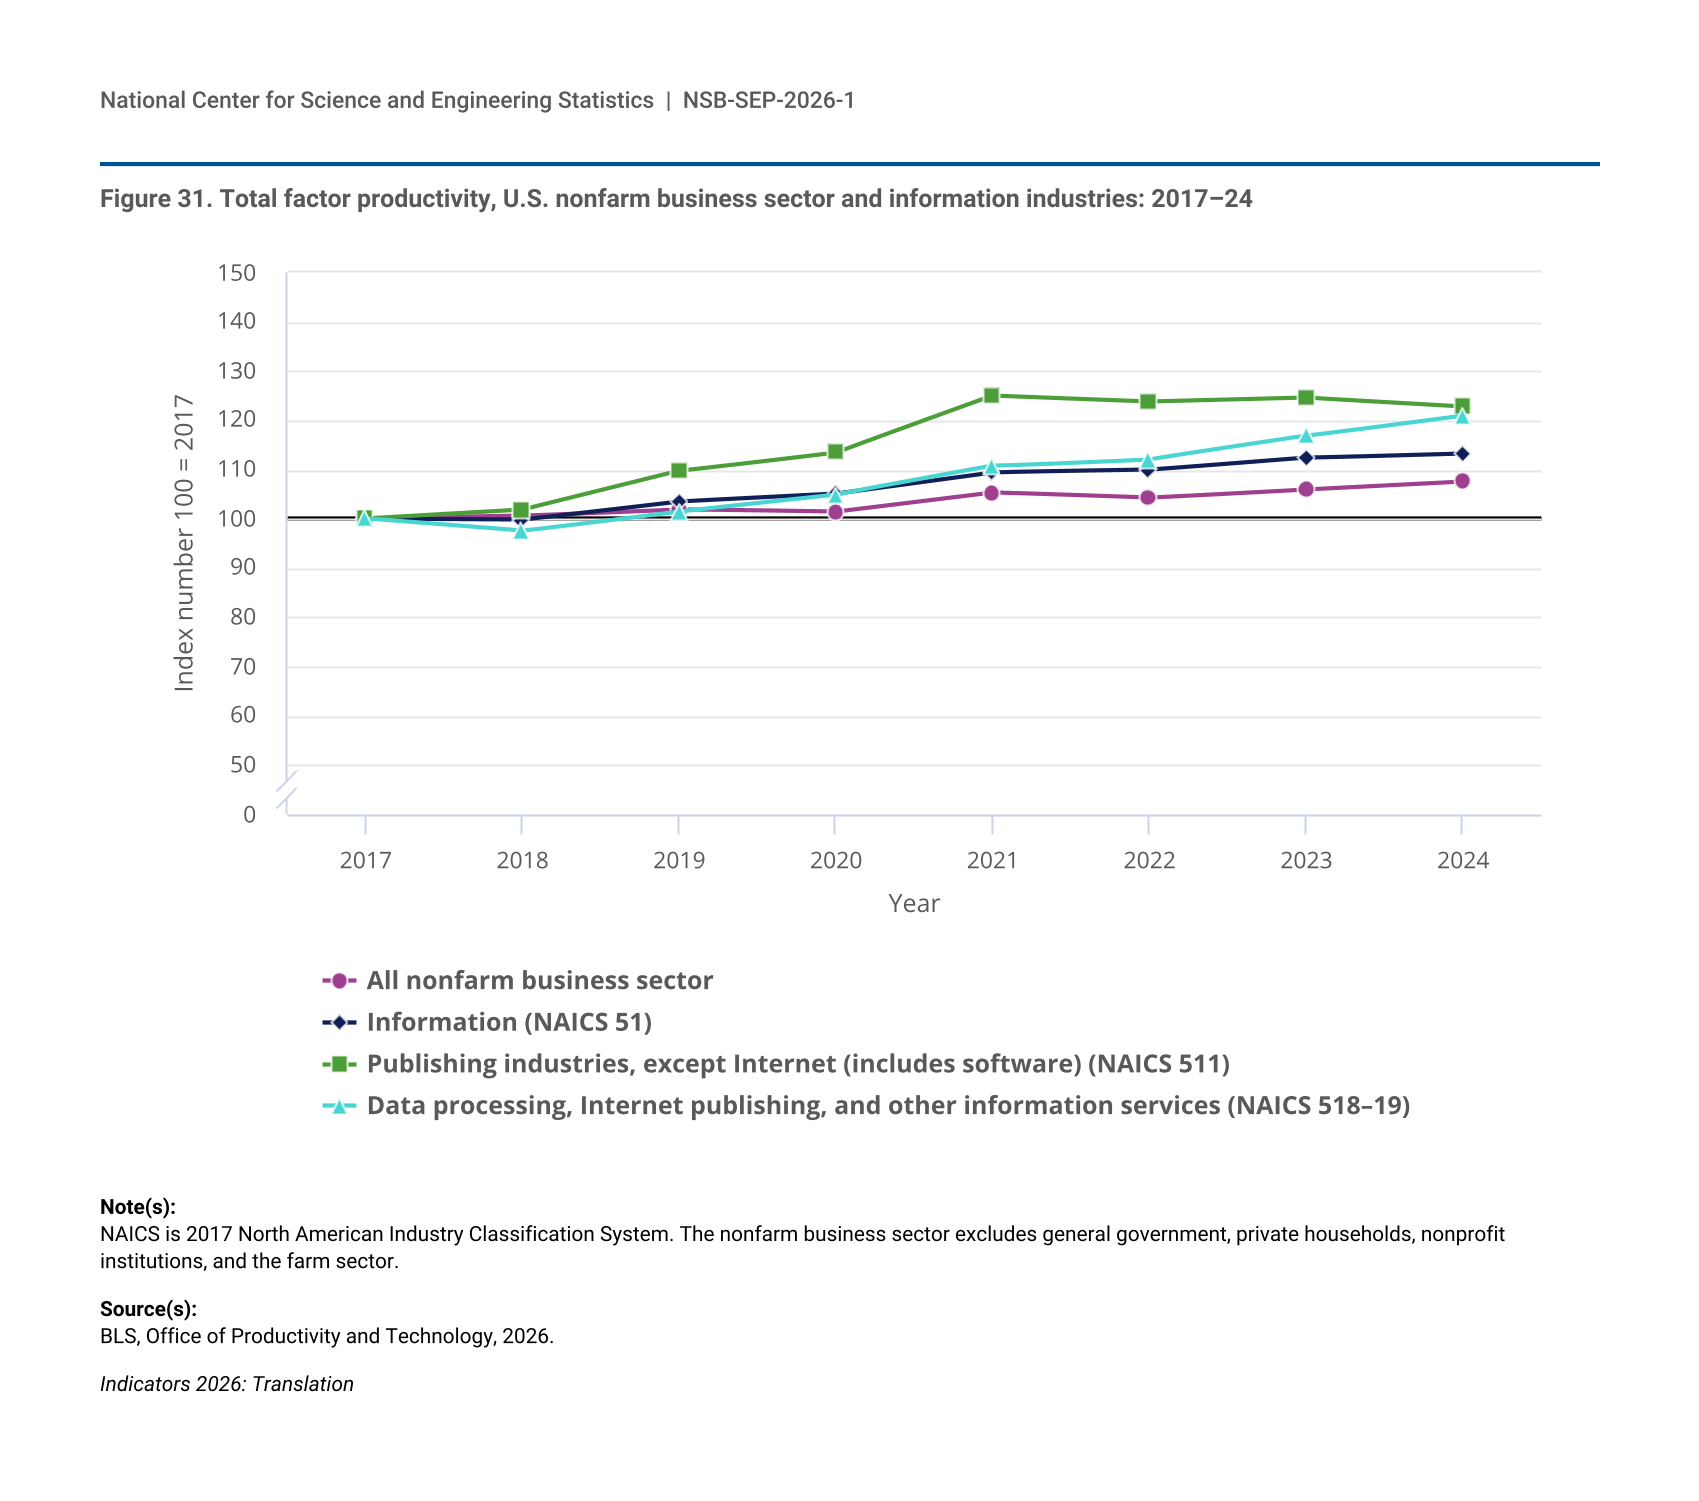
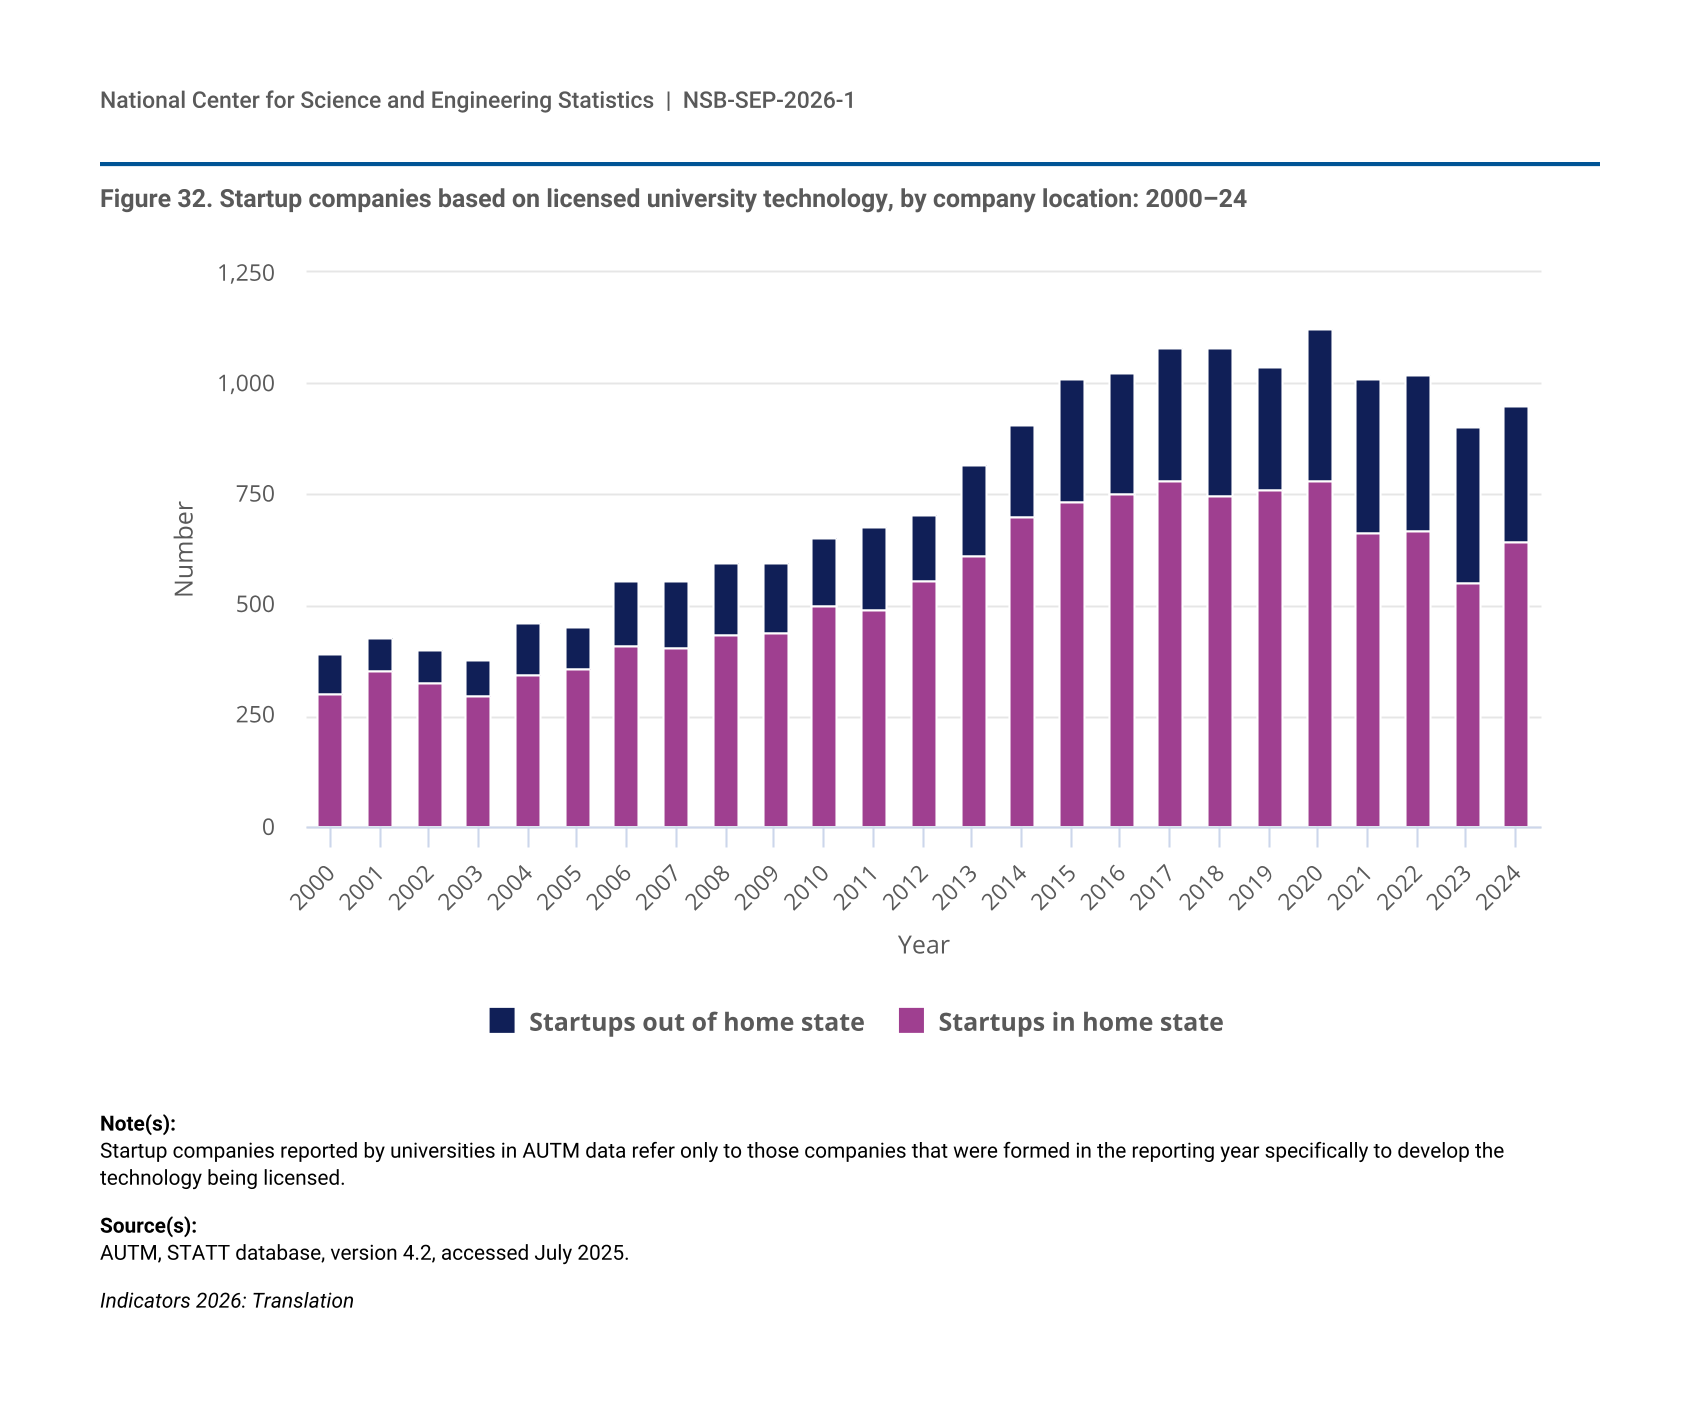
Figure 32.
Startup companies based on licensed university technology, by company location: 2000–24
Startup companies based on licensed university technology, by company location: 2000–24
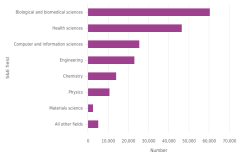
Figure 33.
Citations of U.S. academic S&E articles in USPTO utility patents, by S&E field of the articles cited: 2024
Citations of U.S. academic S&E articles in USPTO utility patents, by S&E field of the articles cited: 2024
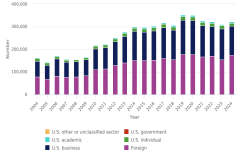
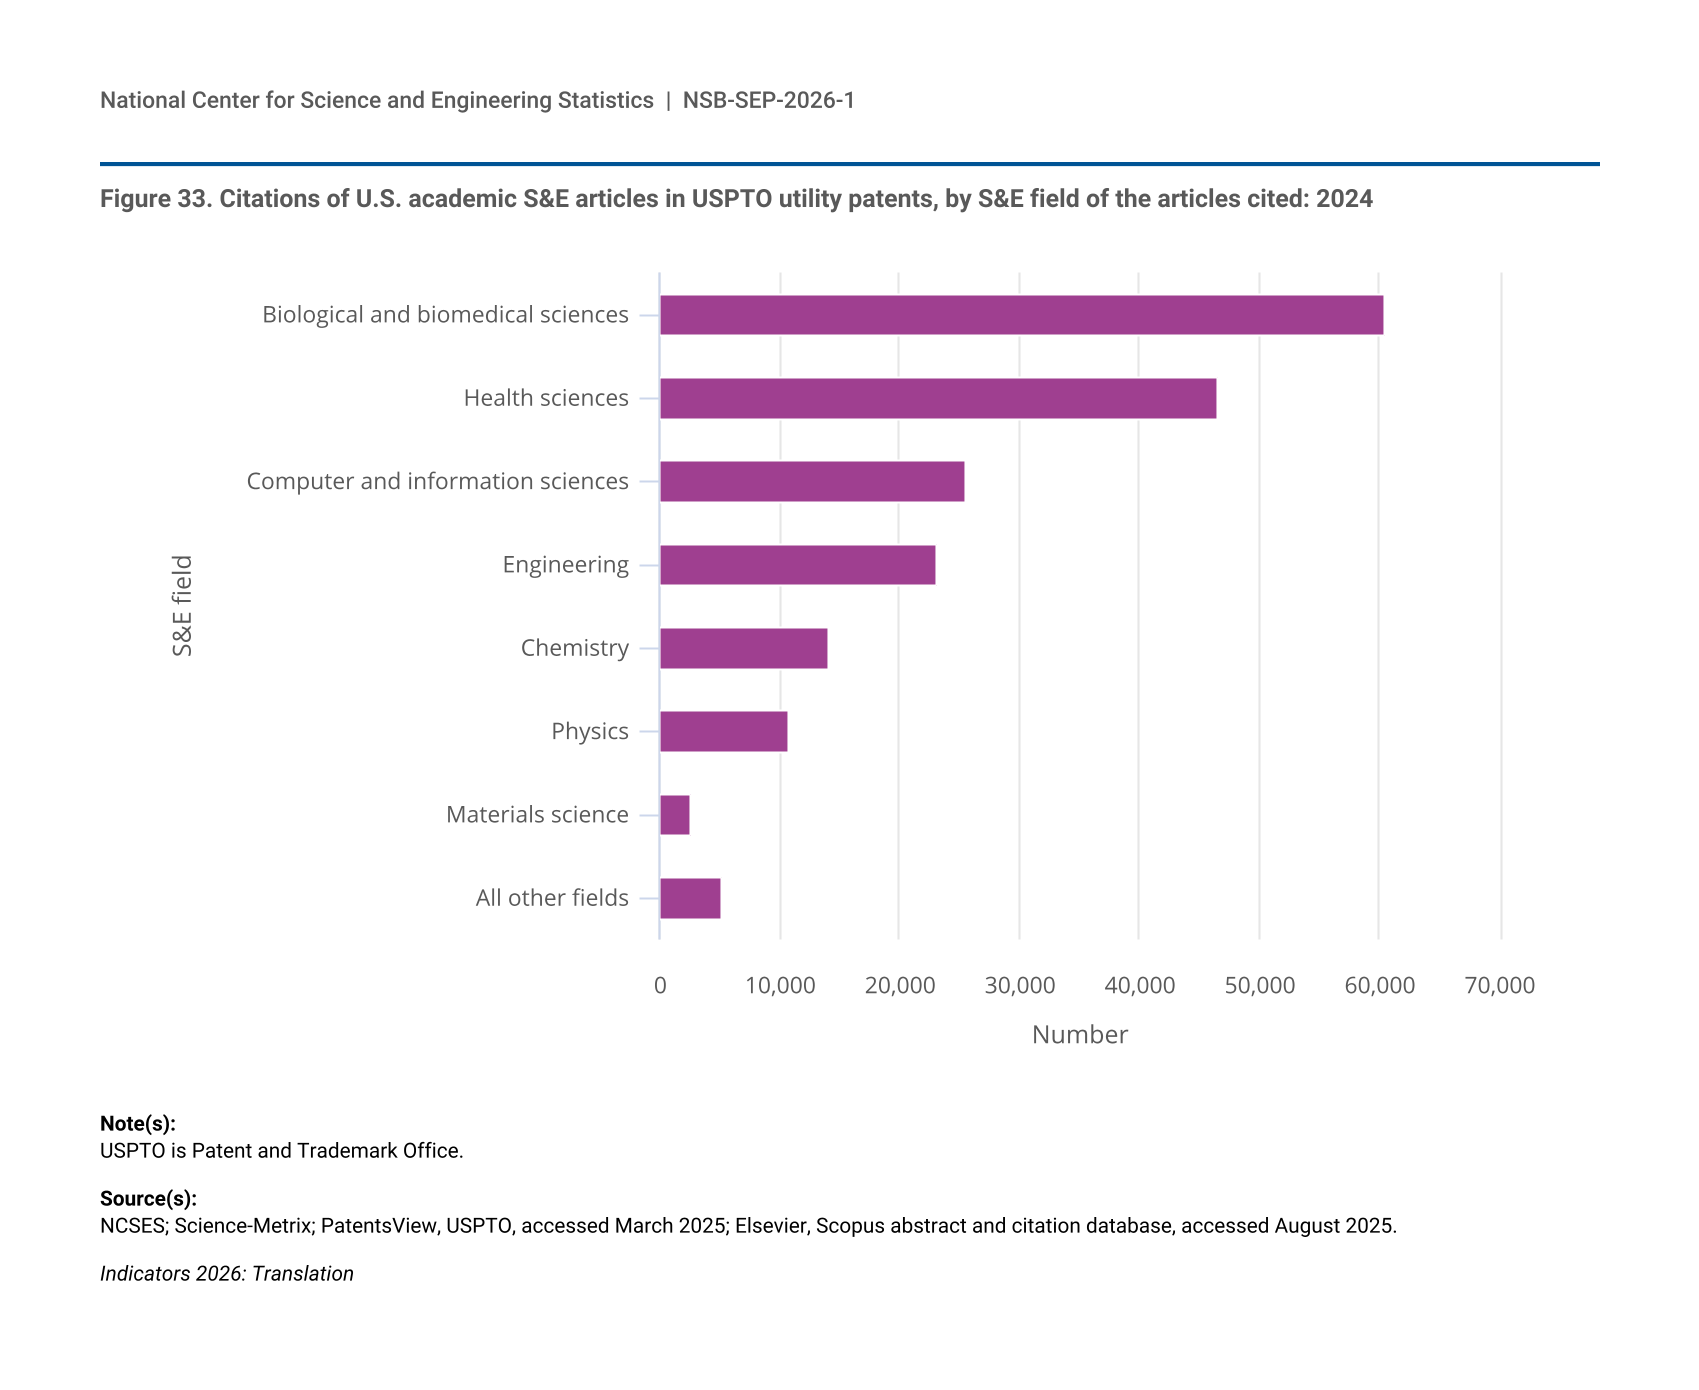
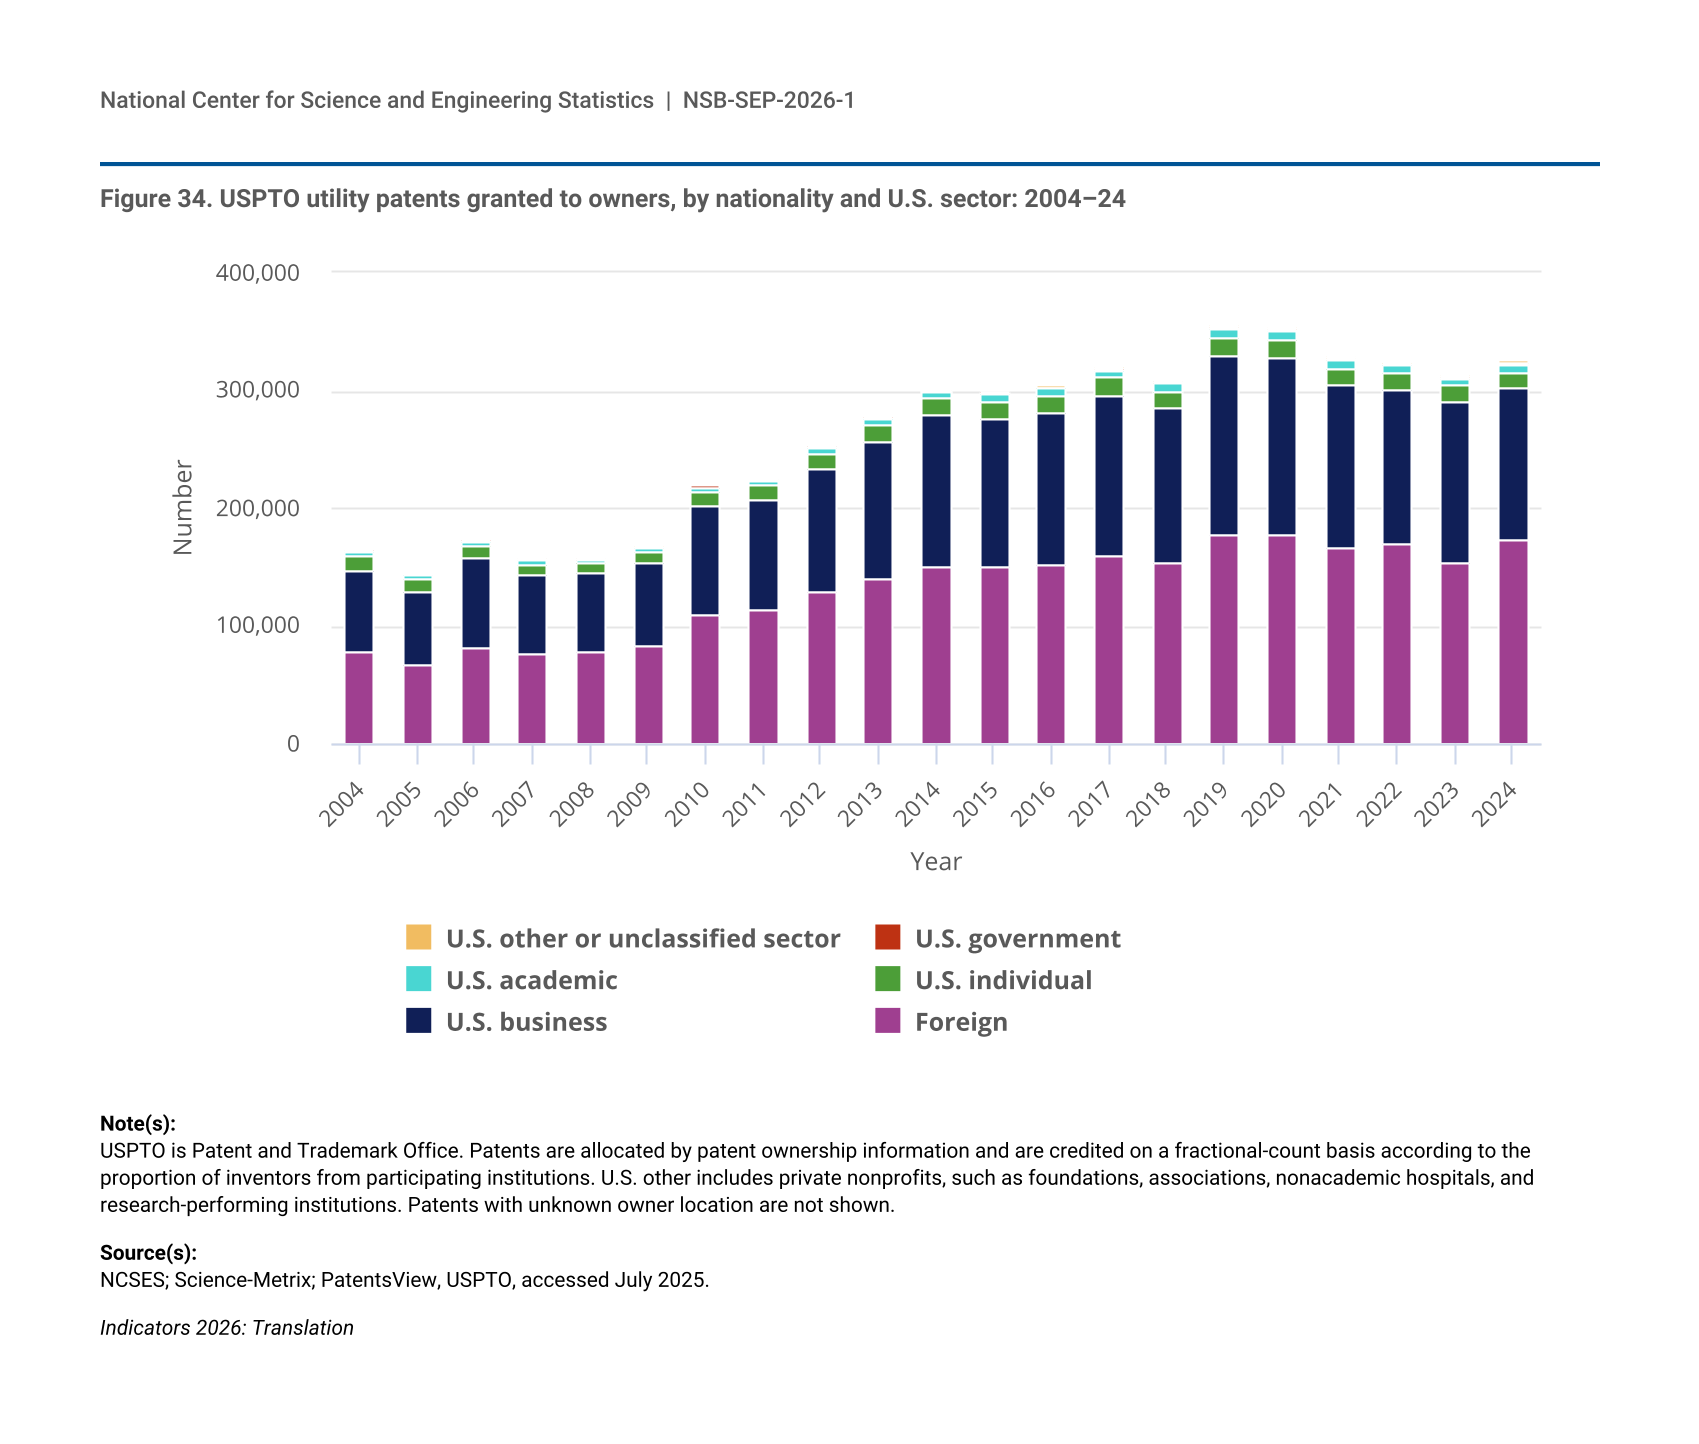
Figure 34.
USPTO utility patents granted to owners, by nationality and U.S. sector: 2004–24
USPTO utility patents granted to owners, by nationality and U.S. sector: 2004–24
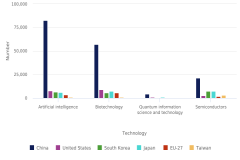
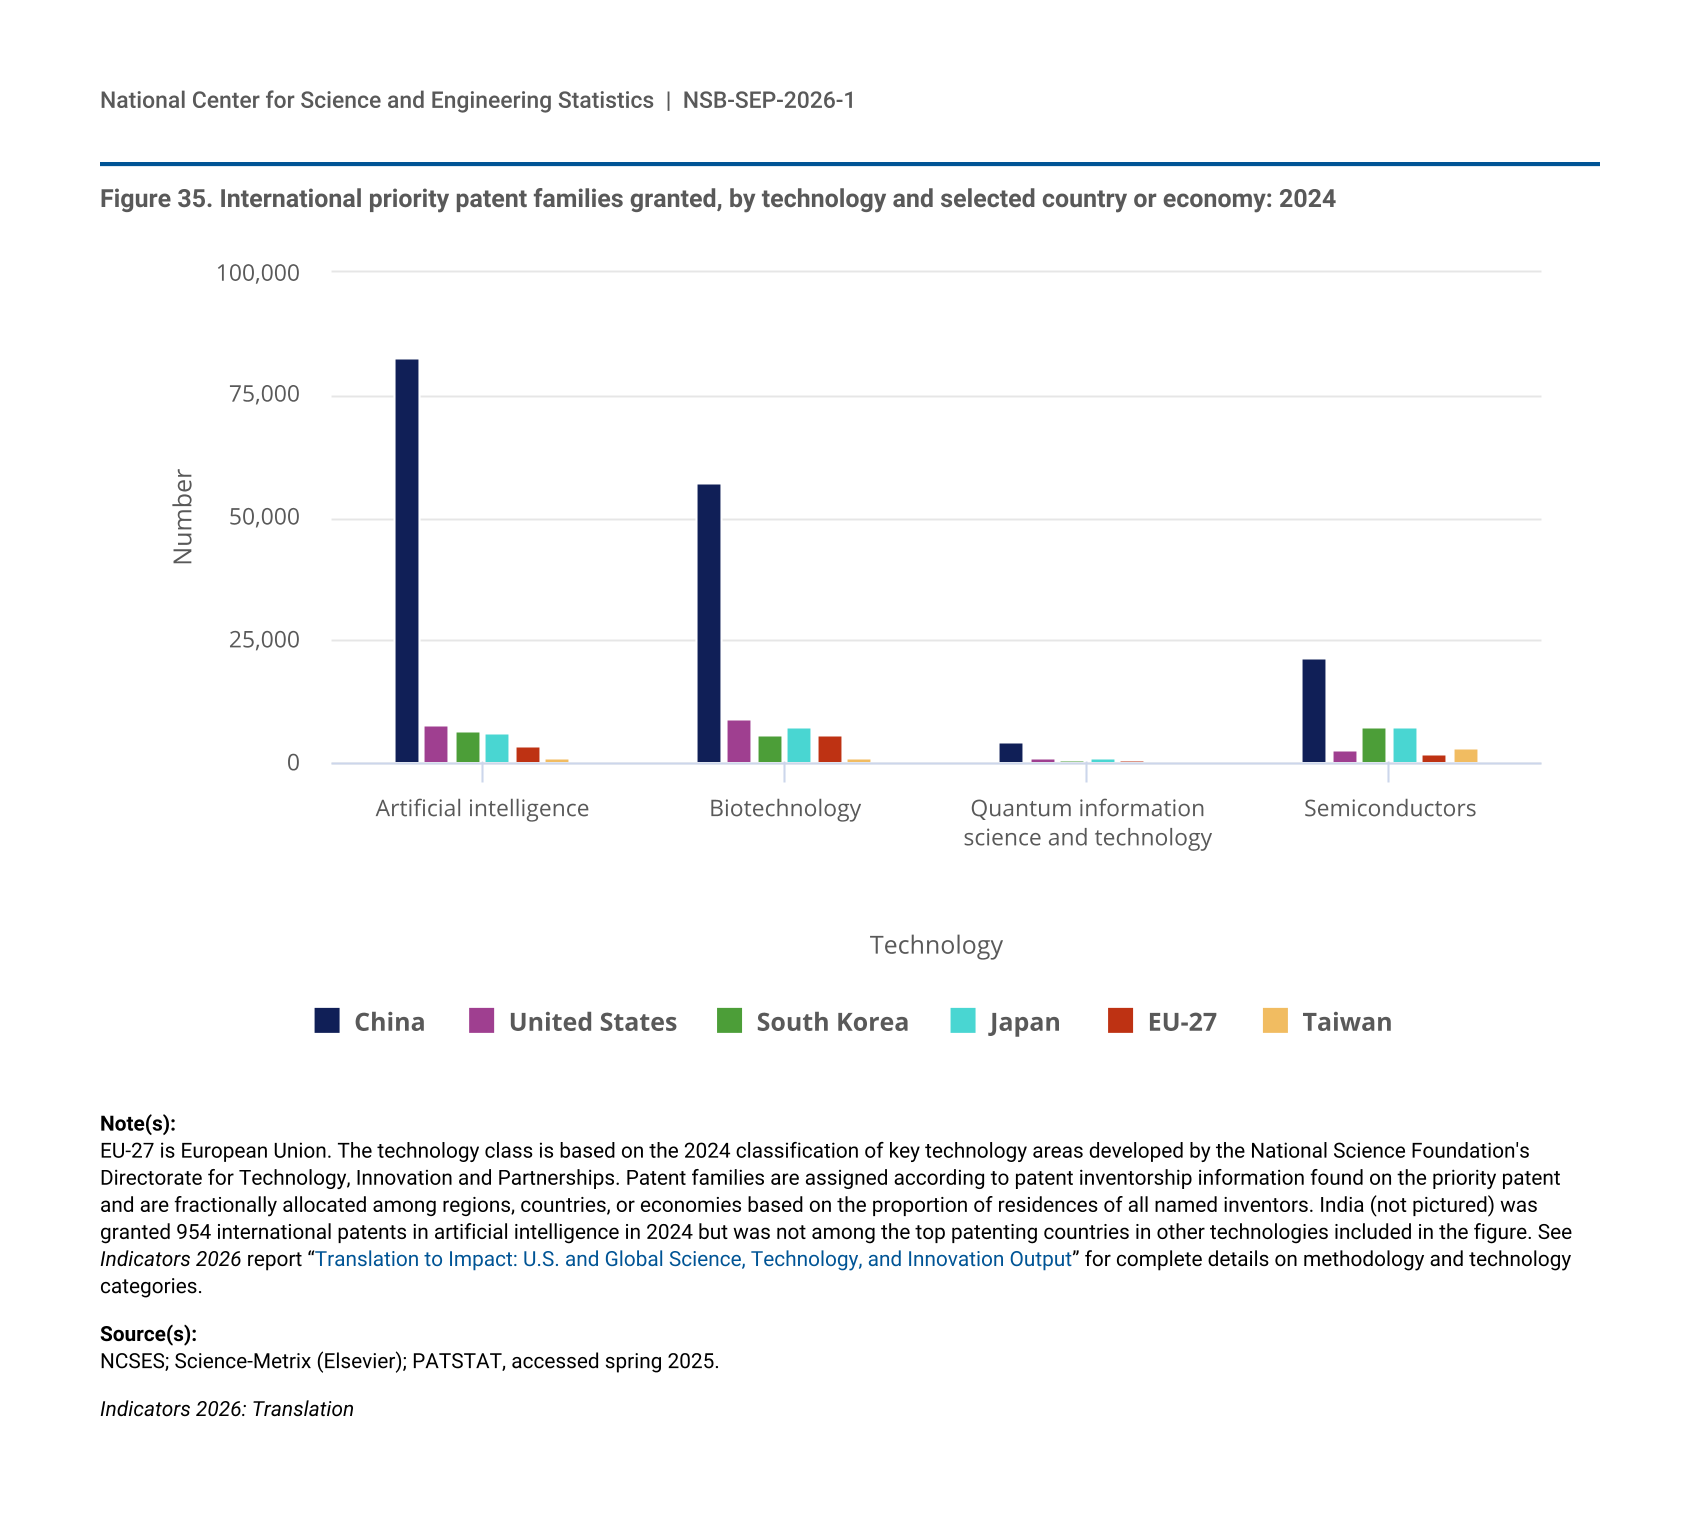
Figure 35.
International priority patent families granted, by technology and selected country or economy: 2024
International priority patent families granted, by technology and selected country or economy: 2024
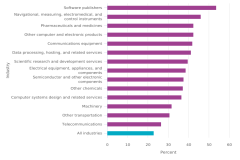
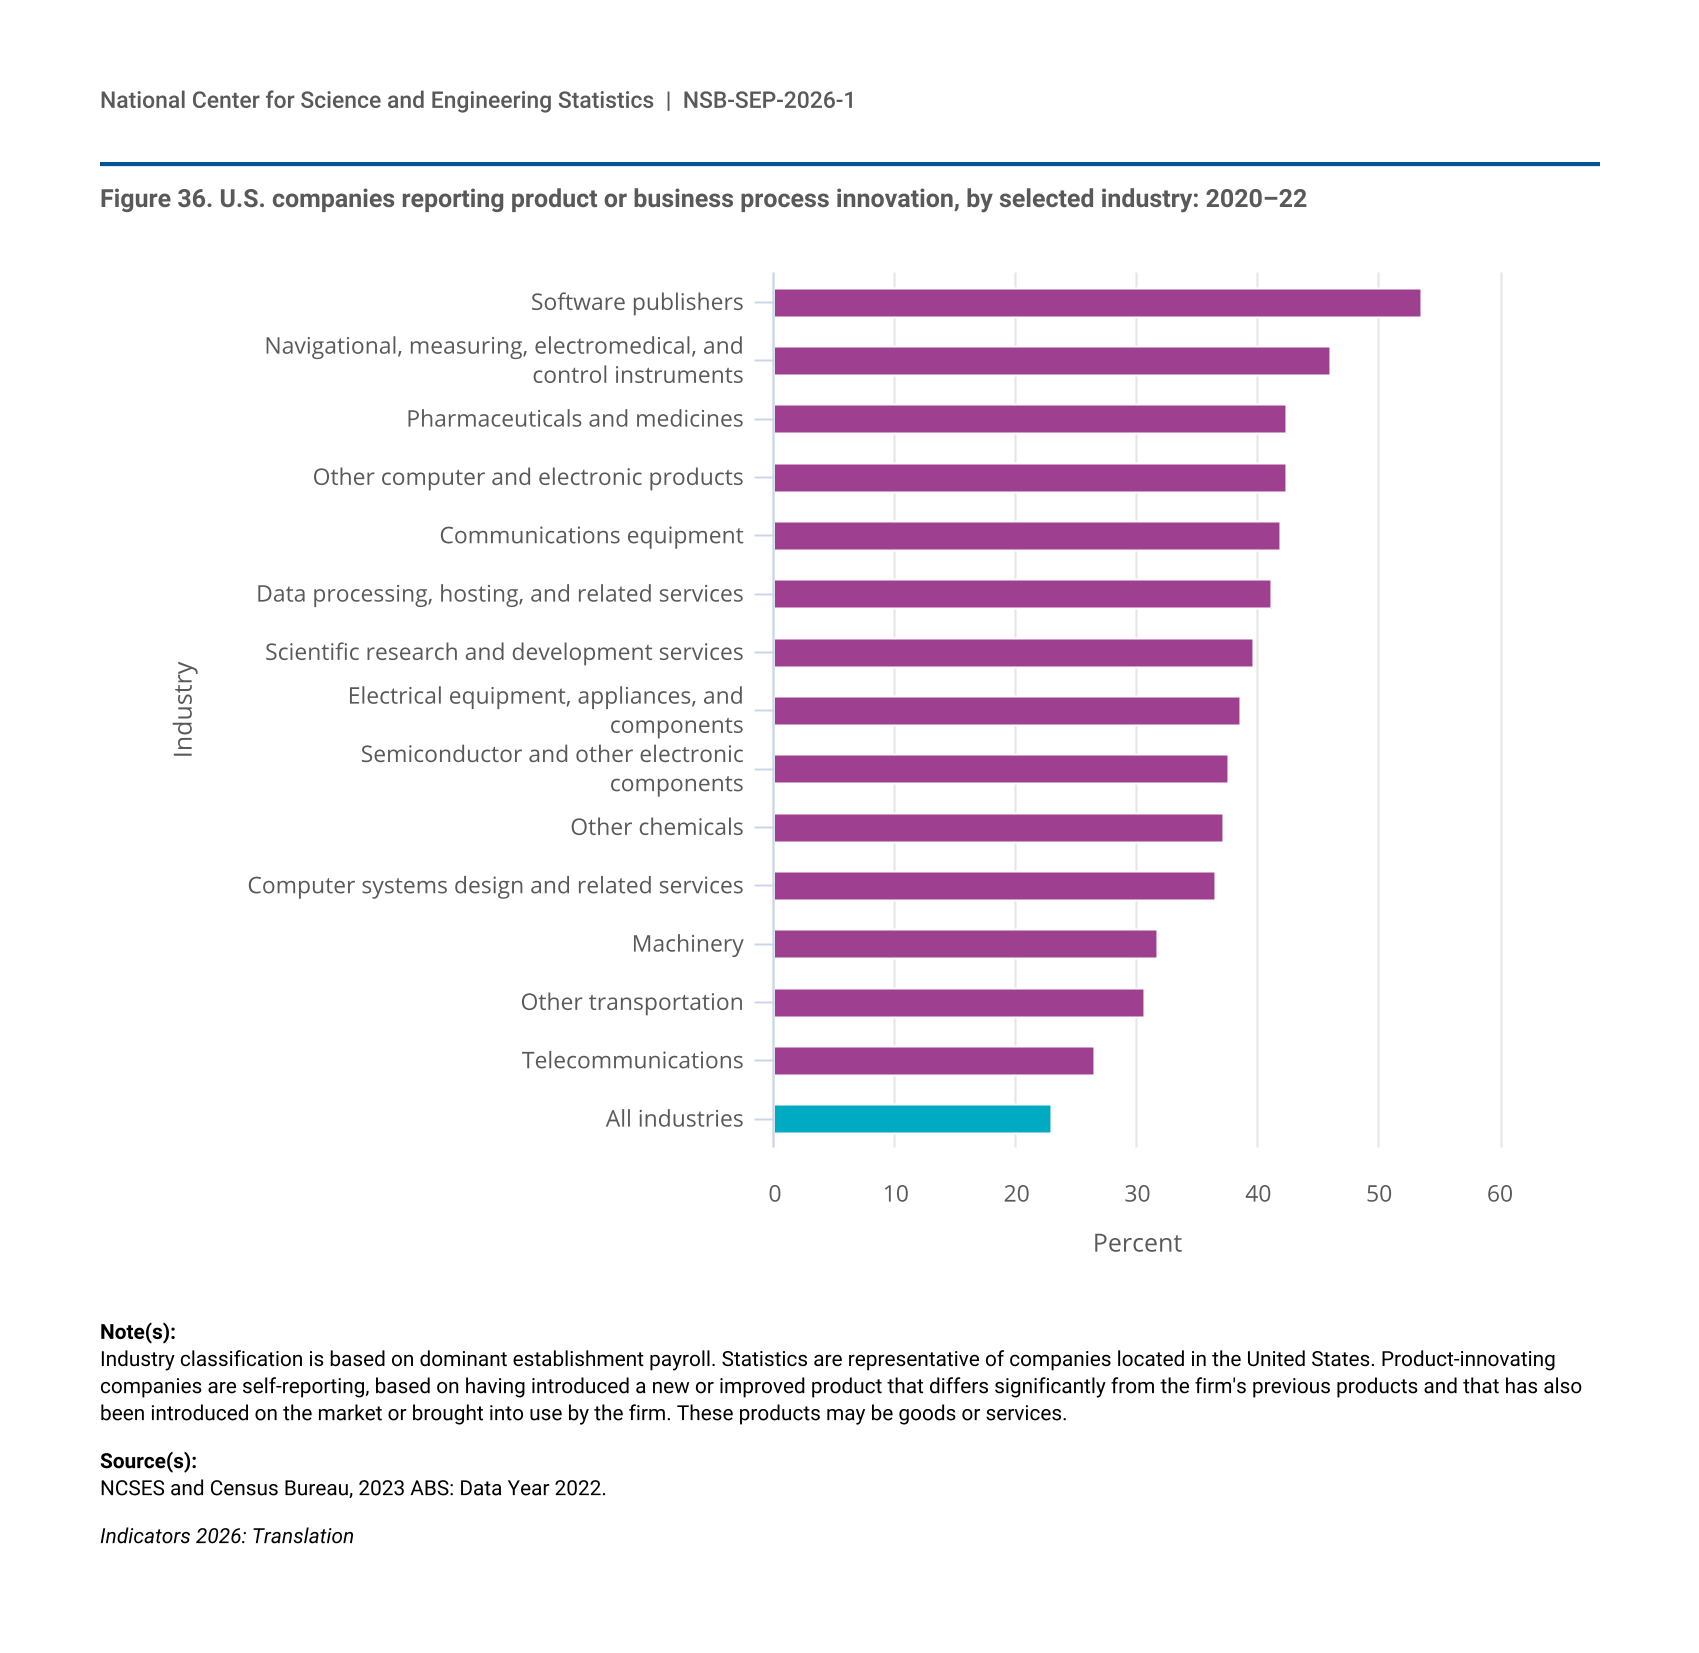
Figure 36.
U.S. companies reporting product or business process innovation, by selected industry: 2020–22
U.S. companies reporting product or business process innovation, by selected industry: 2020–22
Figure 37.
Venture capital investment received by firms headquartered in selected regions, countries, or economies: 2013–24
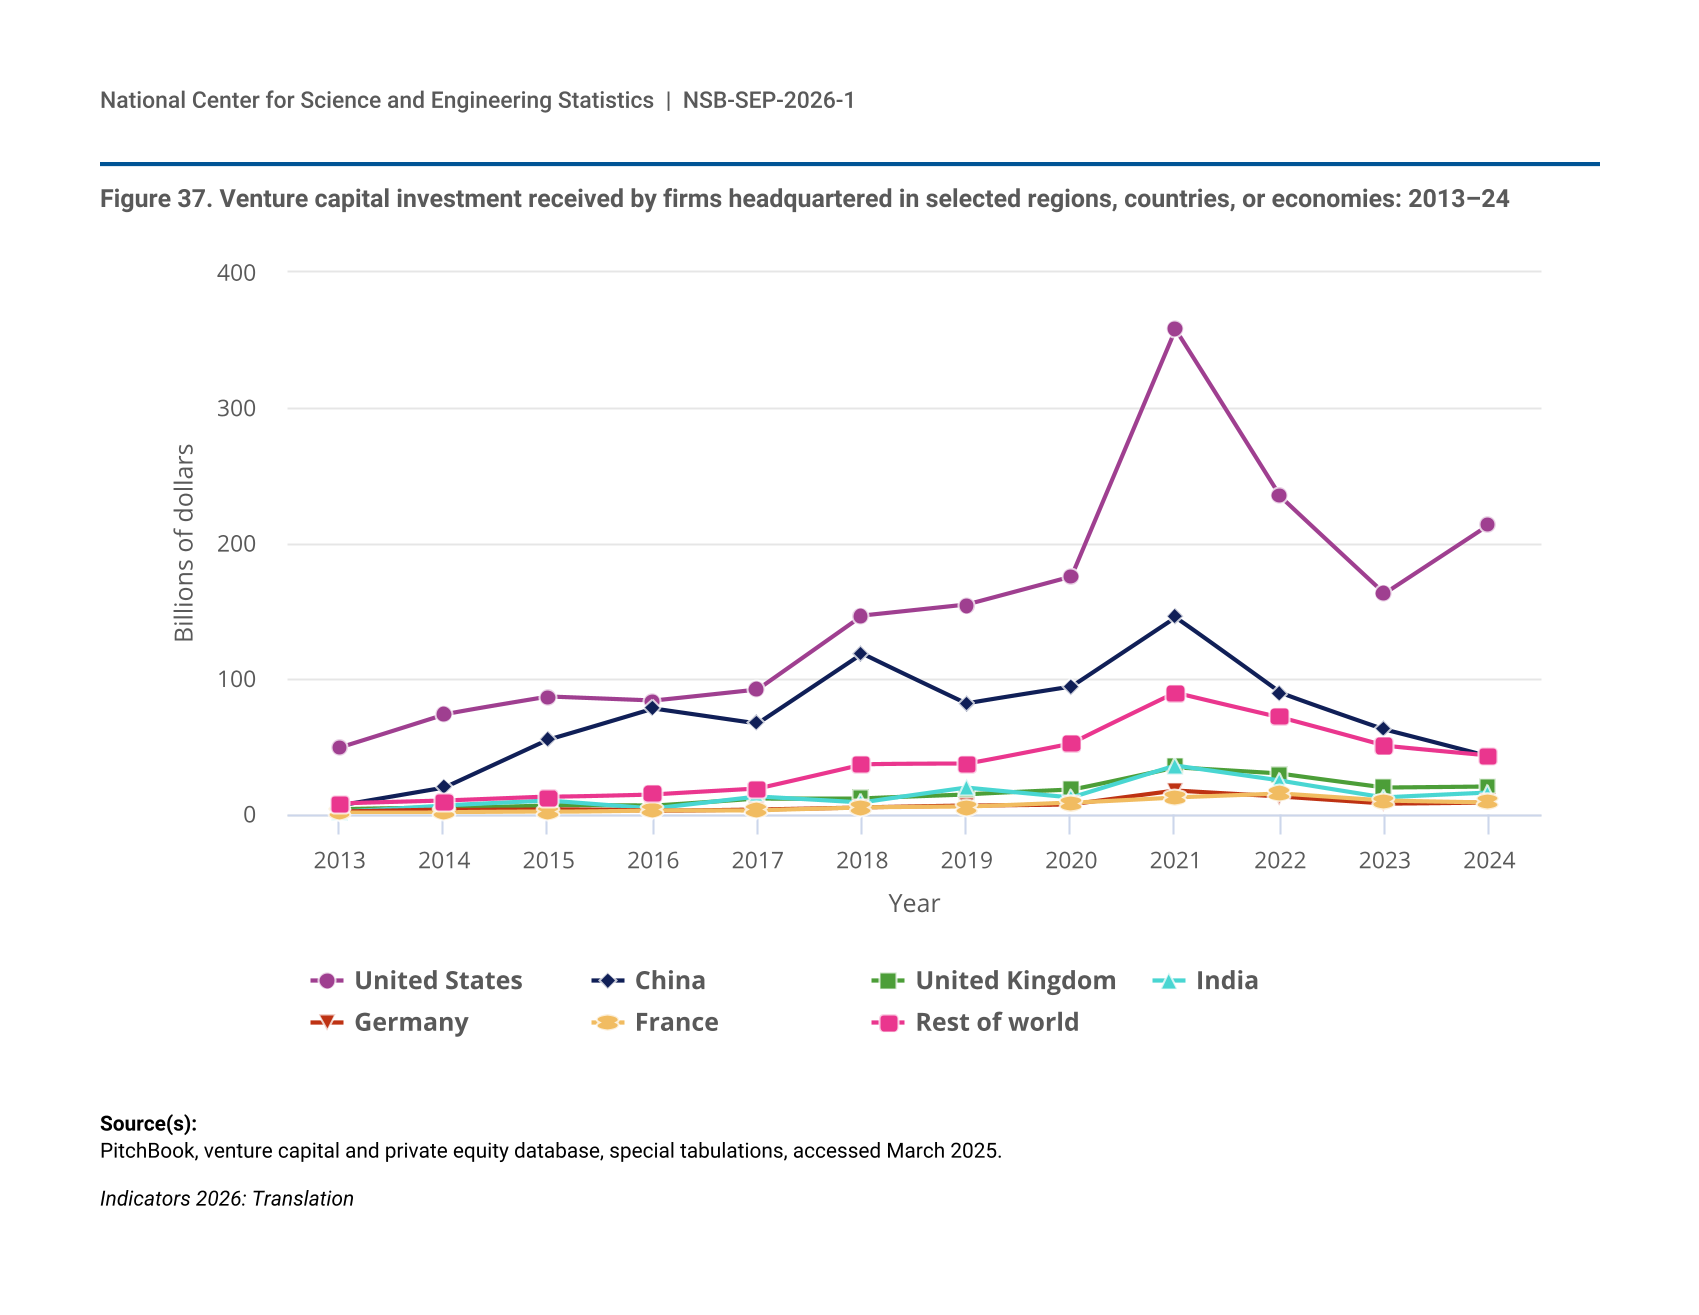
Venture capital investment received by firms headquartered in selected regions, countries, or economies: 2013–24
Figure 38.
Venture capital investment received by firms headquartered in the United States, by critical and emerging technology: 2013–24
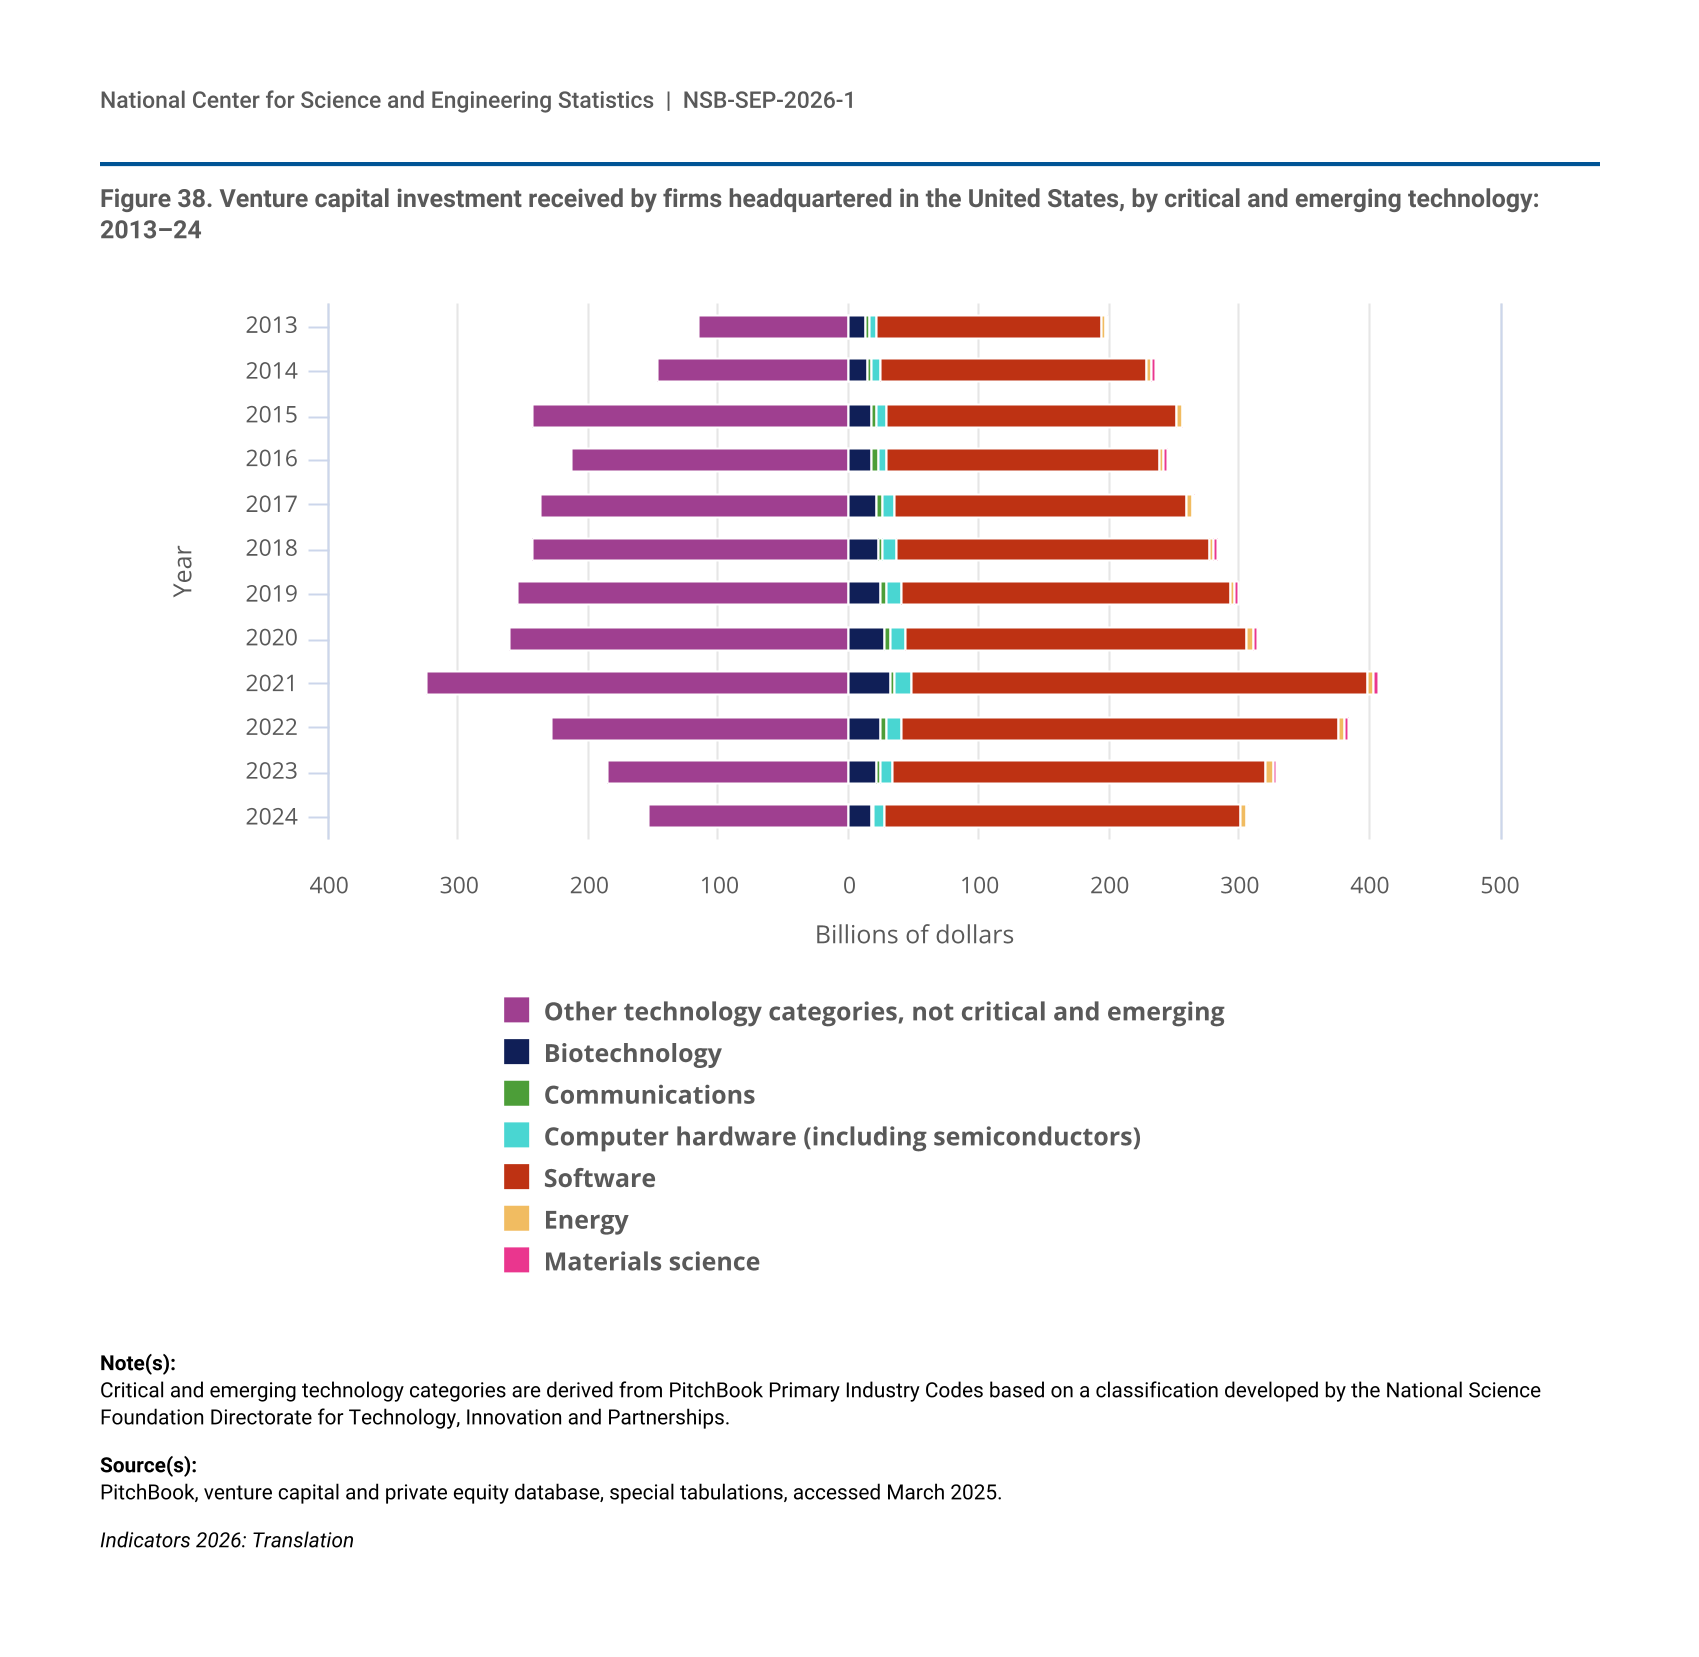
Venture capital investment received by firms headquartered in the United States, by critical and emerging technology: 2013–24
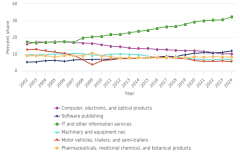
Figure 39.
Industry share of U.S. total KTI value added, by selected industries: 2002–24
Industry share of U.S. total KTI value added, by selected industries: 2002–24
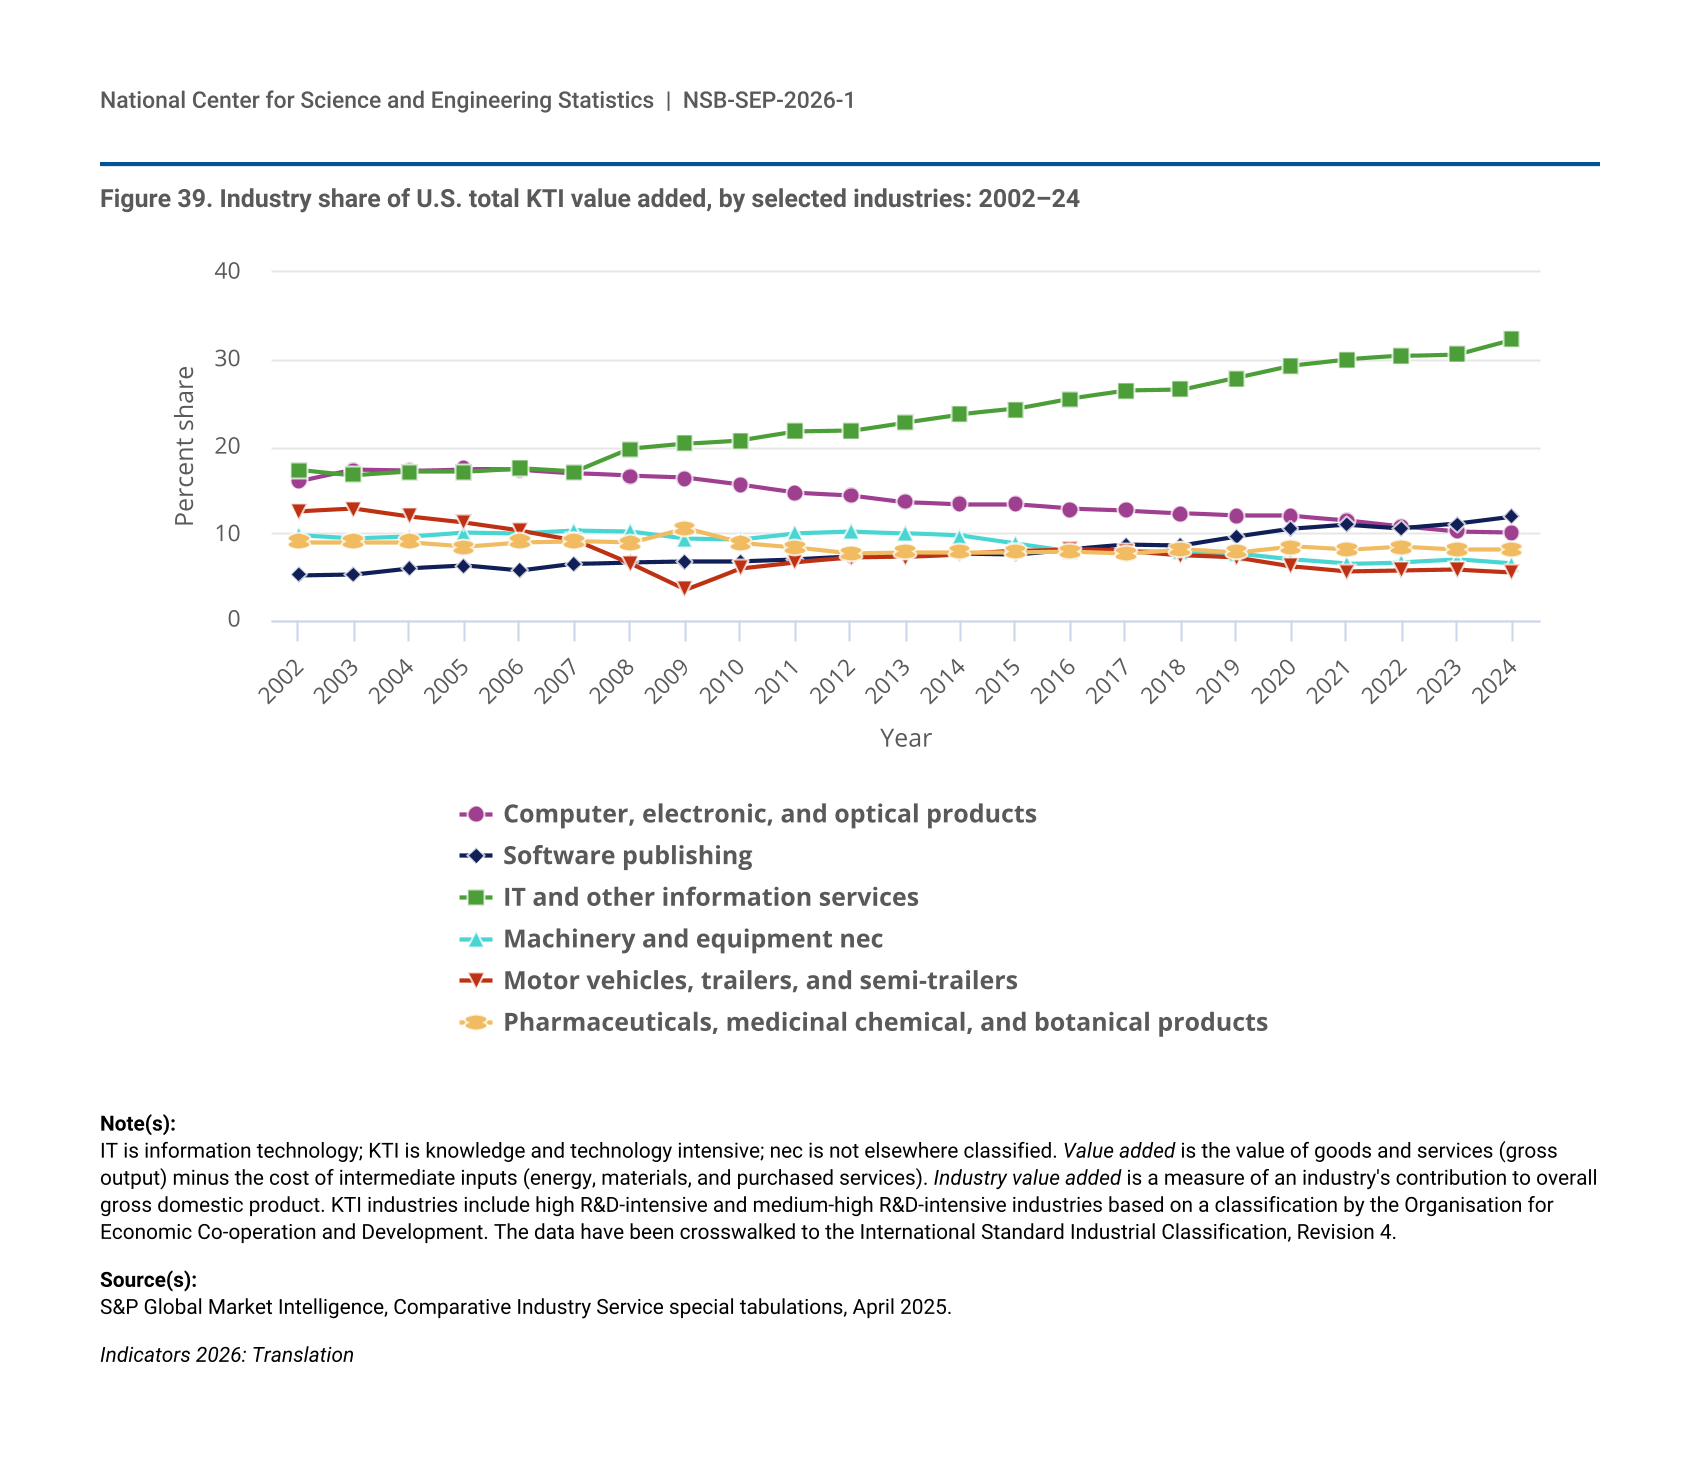
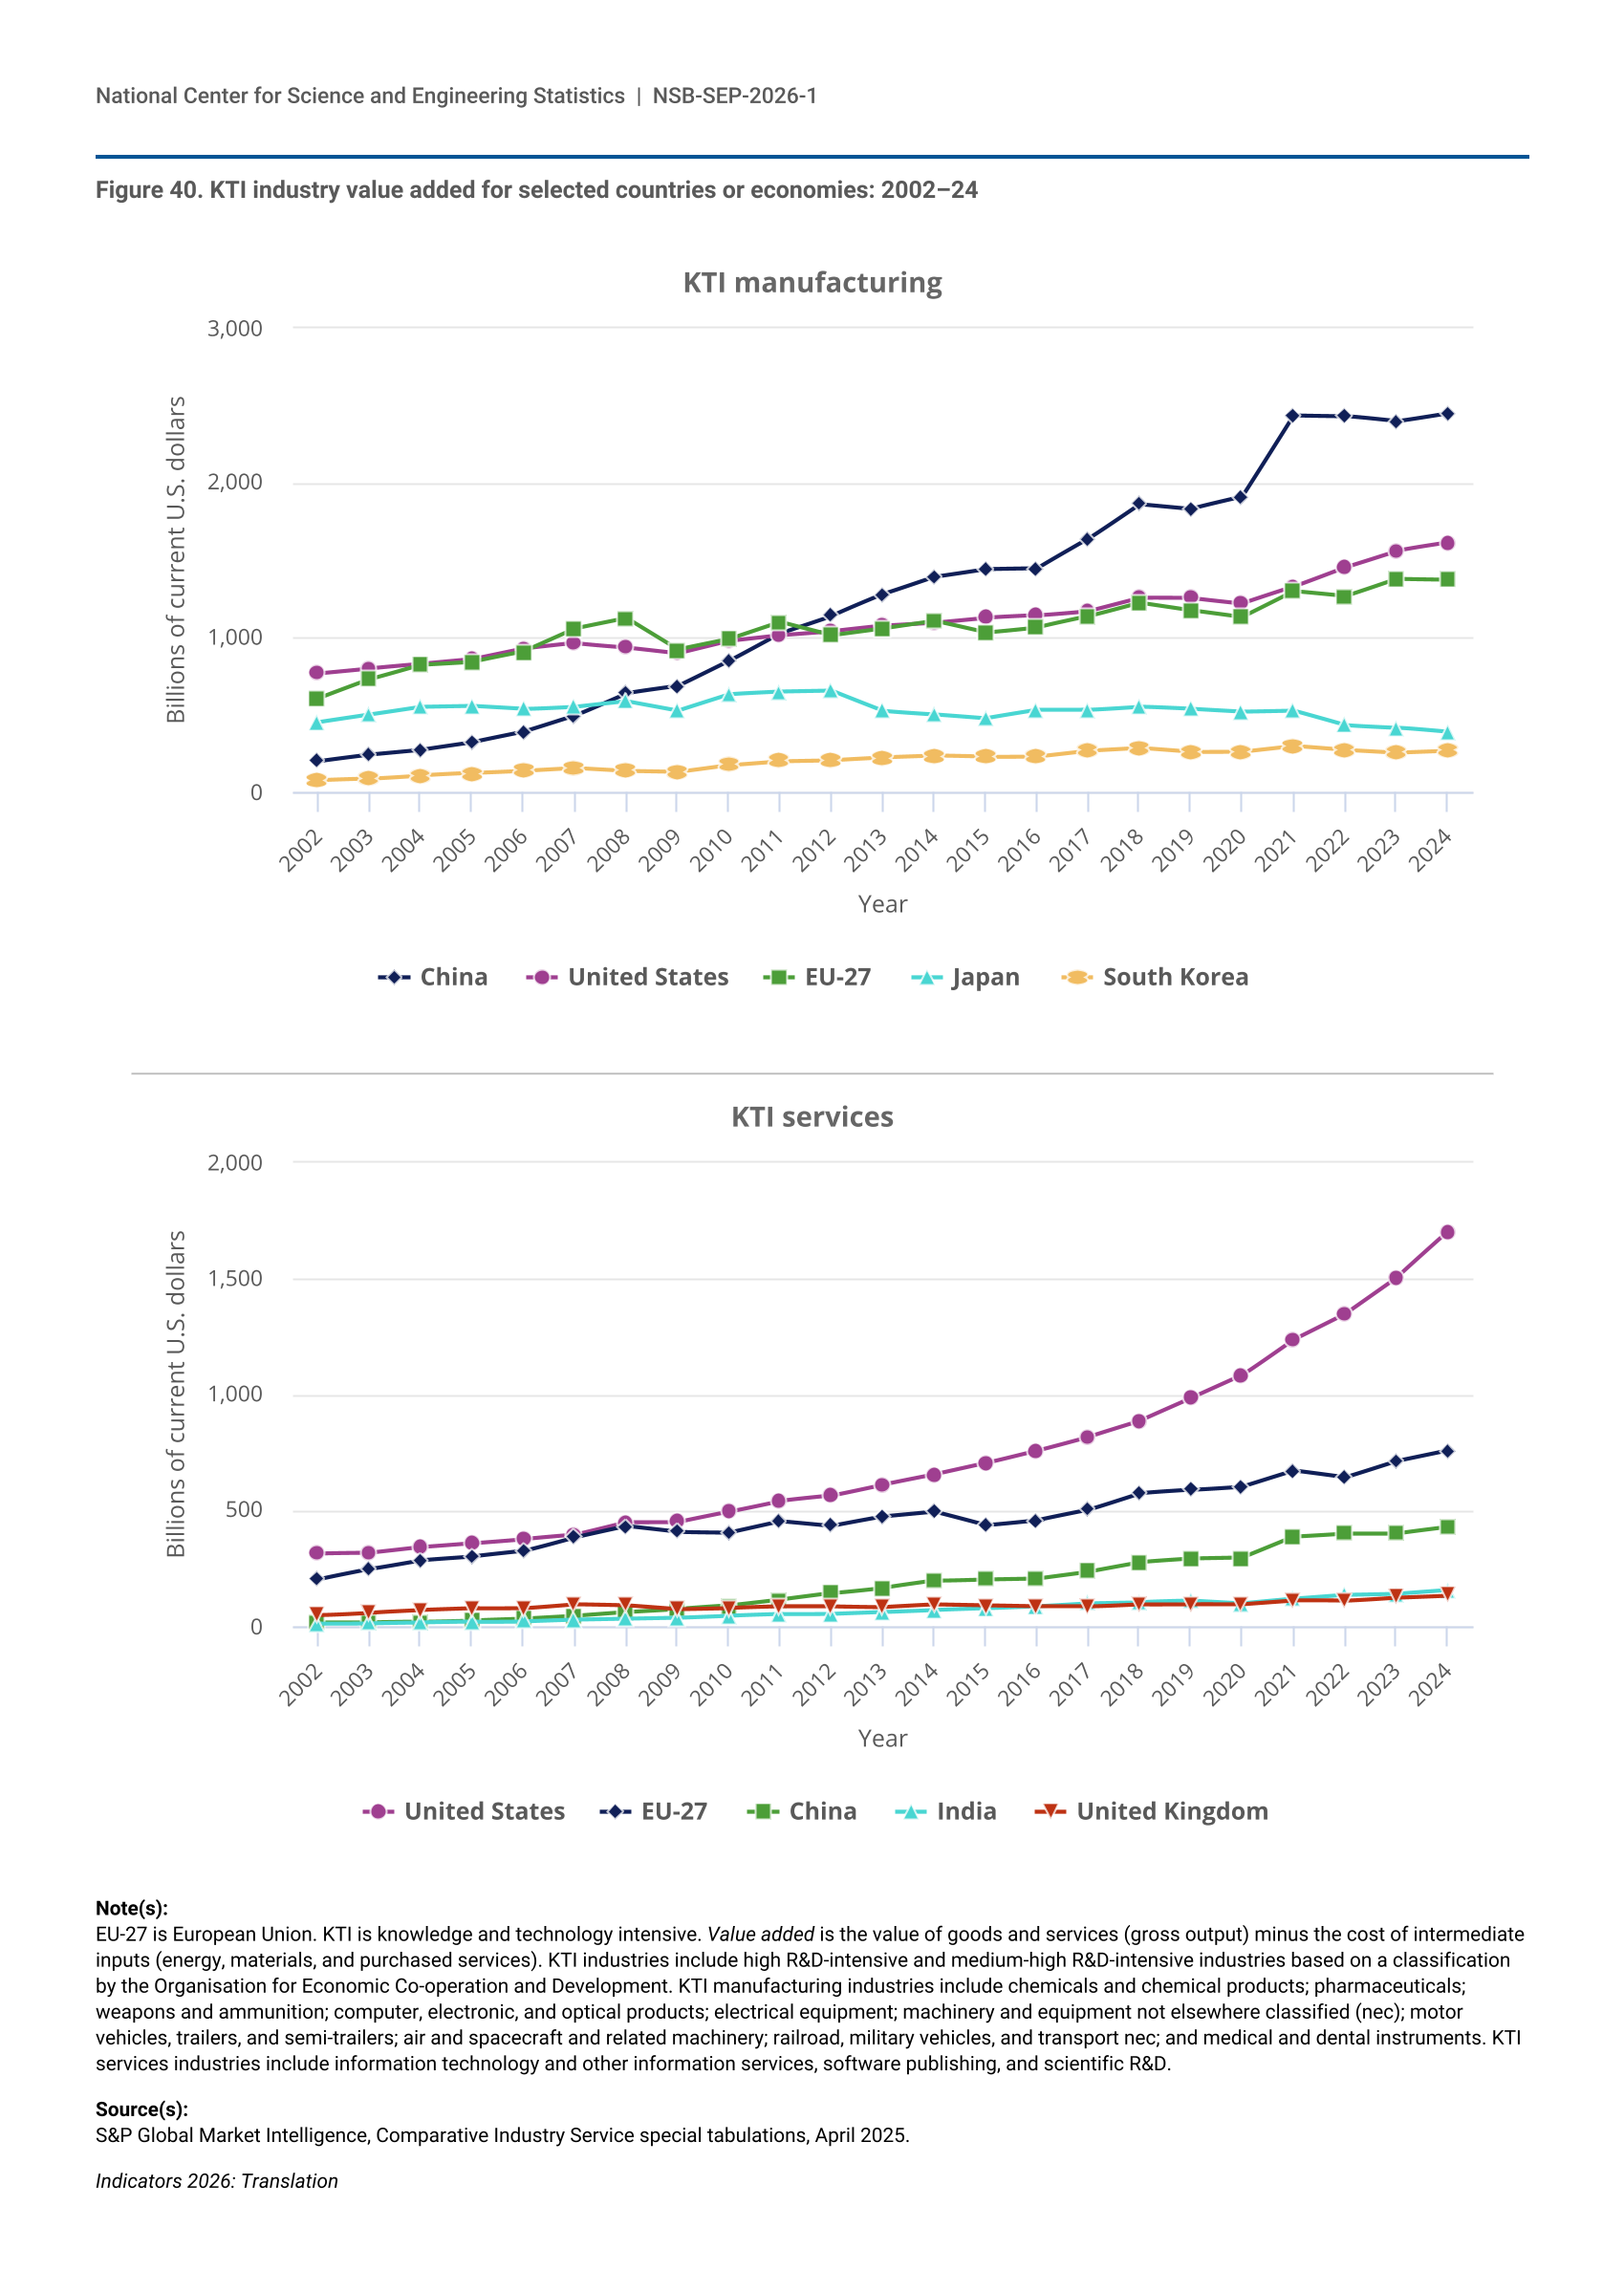
Figure 40.
KTI industry value added for selected countries or economies: 2002–24
KTI industry value added for selected countries or economies: 2002–24
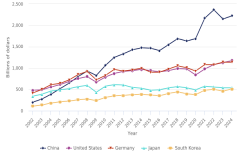
Figure 41.
Gross exports of KTI manufacturing industries for selected countries: 2002–24
Gross exports of KTI manufacturing industries for selected countries: 2002–24
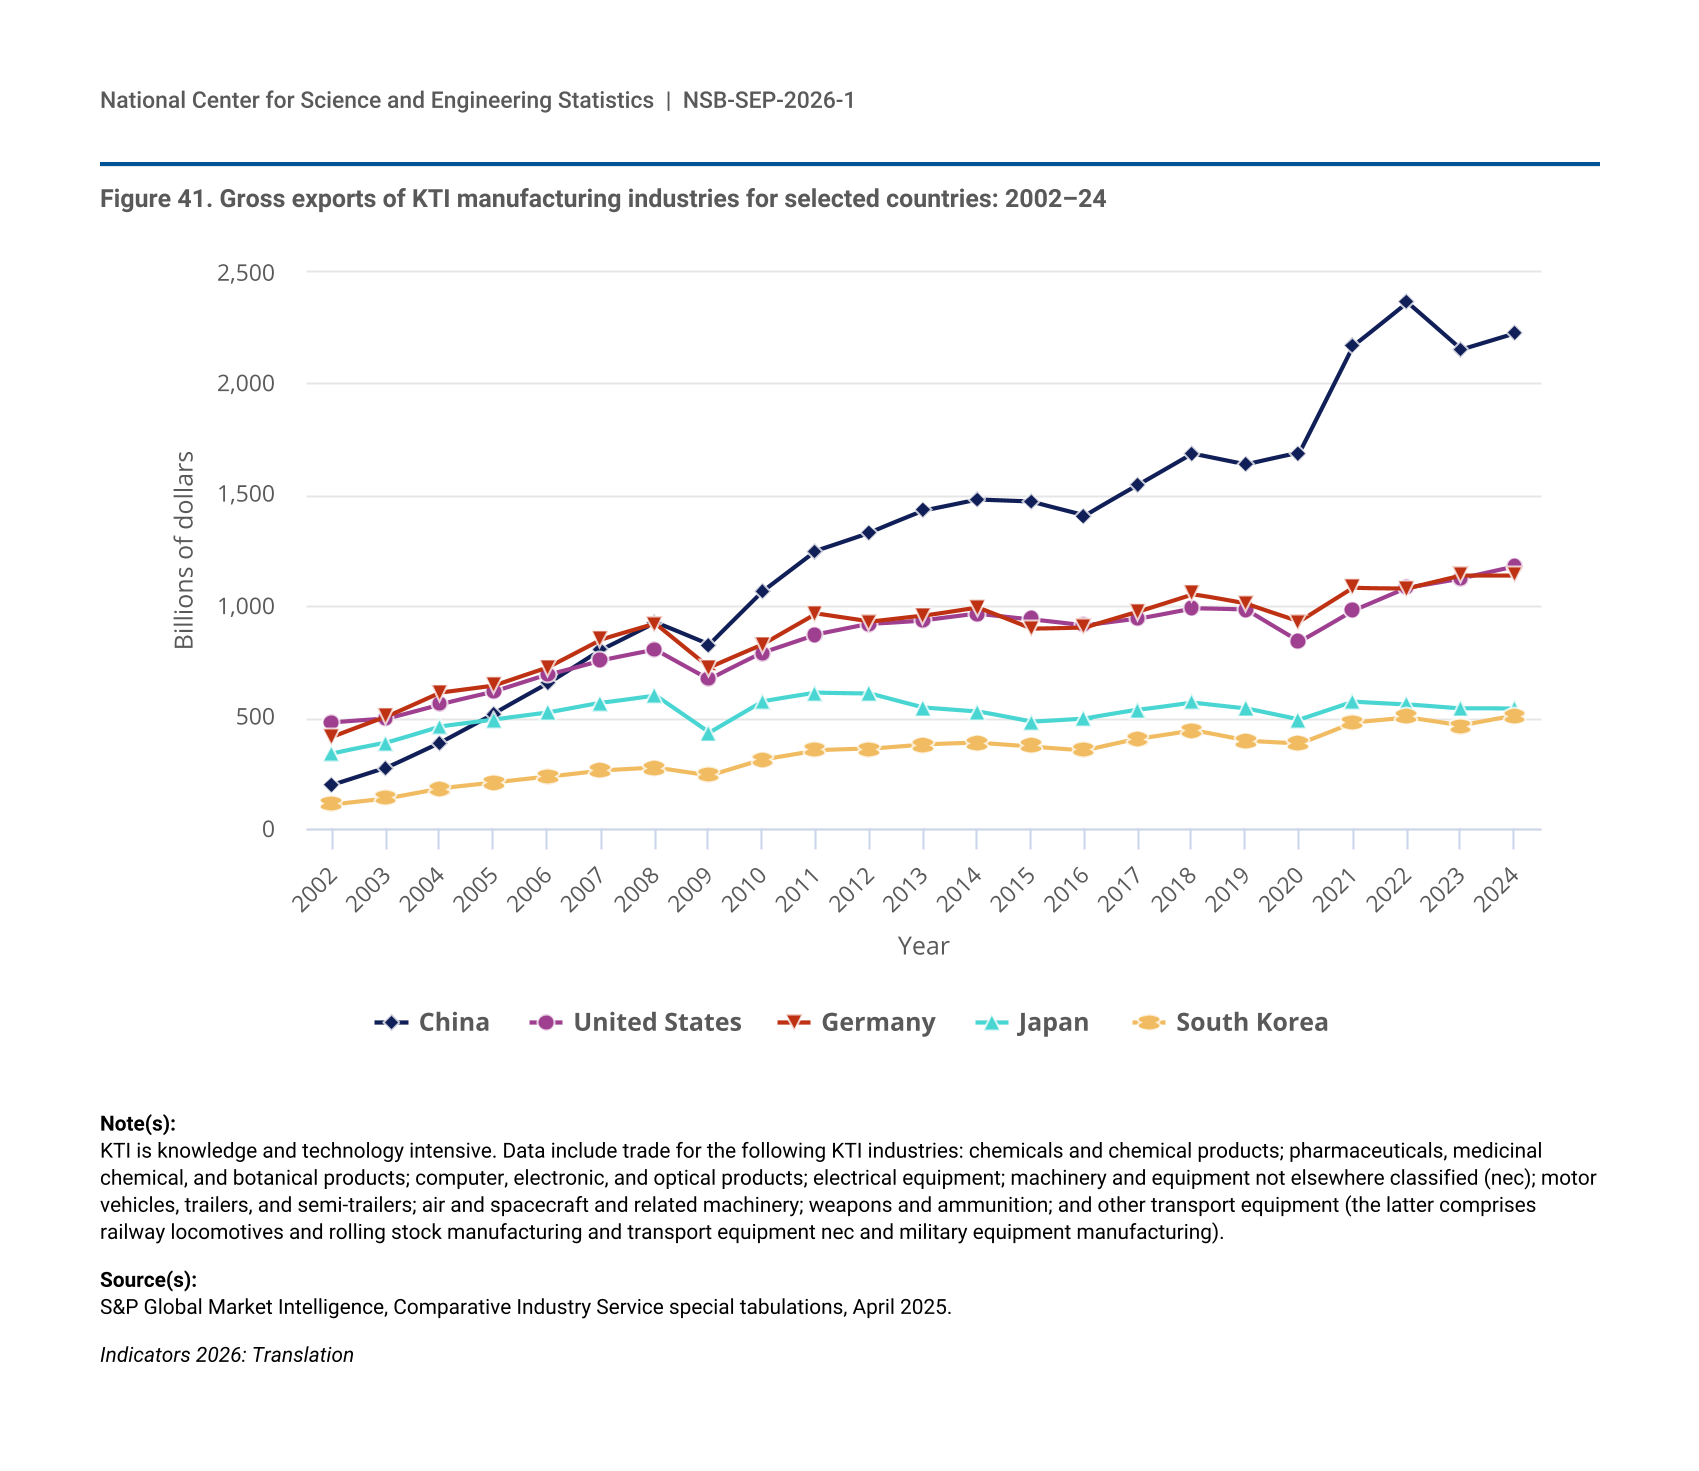
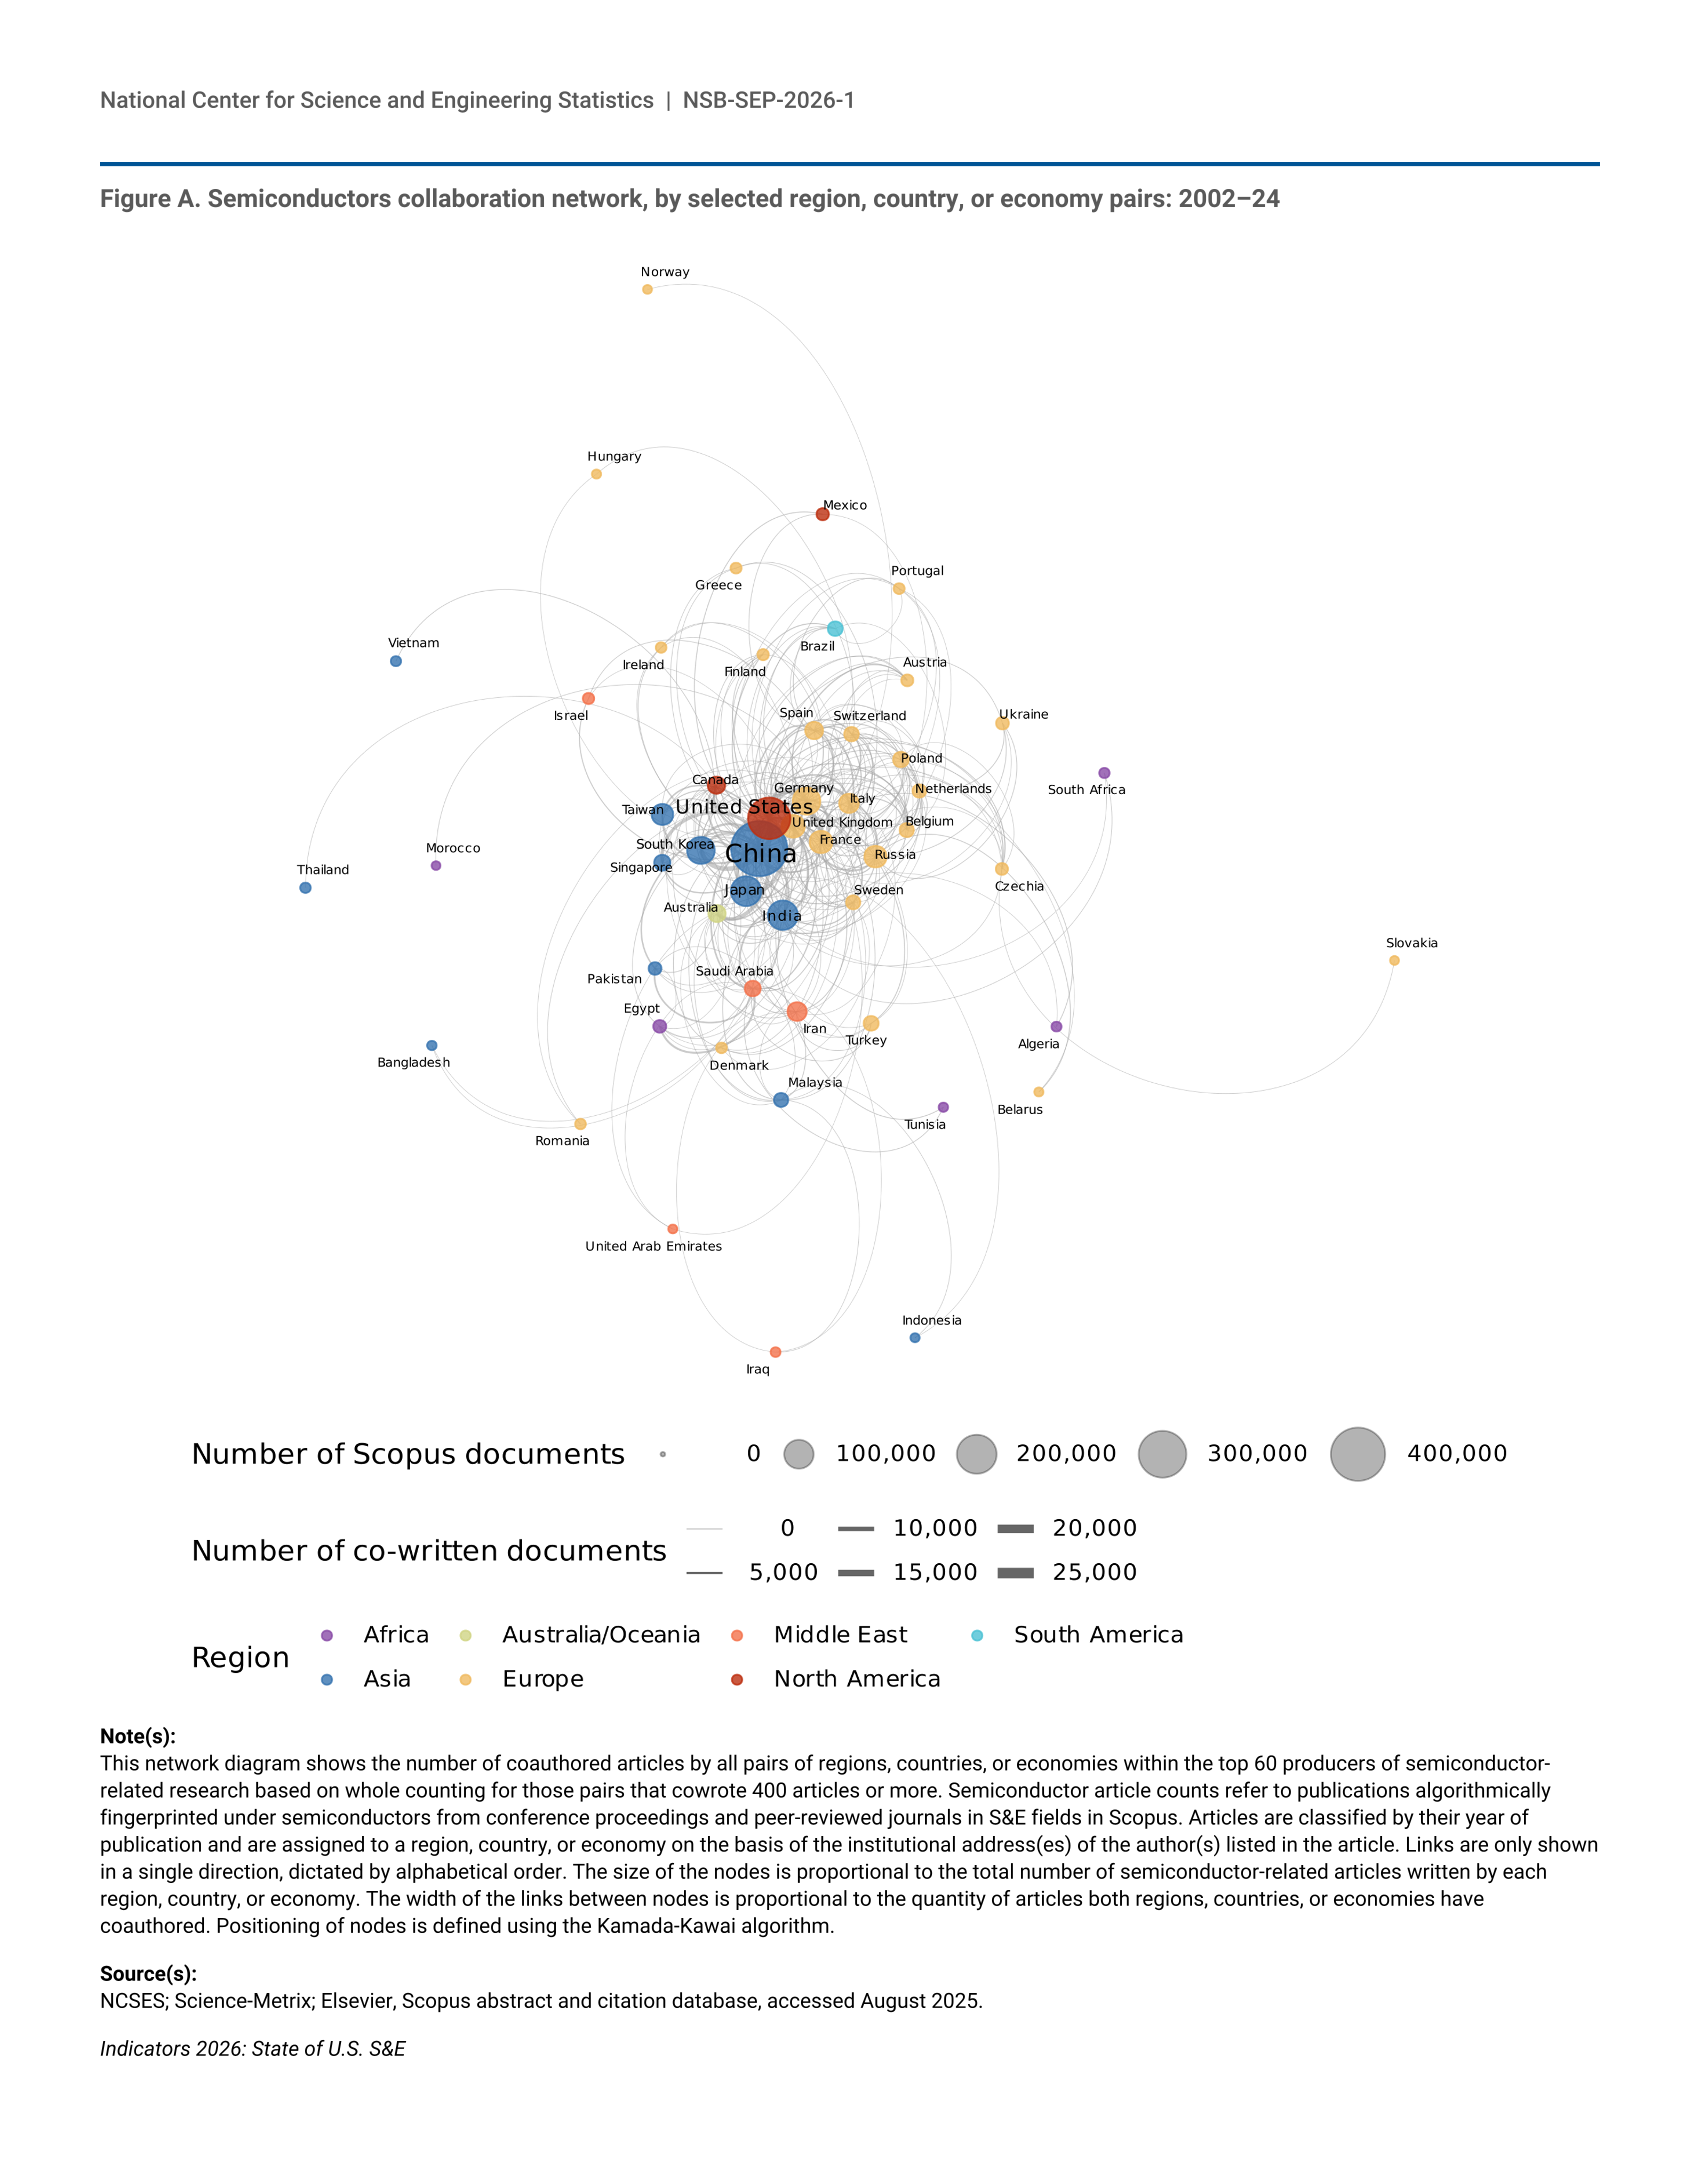
Figure A.
Semiconductors collaboration network, by selected region, country, or economy pairs: 2002–24
Semiconductors collaboration network, by selected region, country, or economy pairs: 2002–24
Data Sources
Item
Title
Provider
Product
Figure 1
U.S. R&D expenditures, by performer or funder: 1953–2024
National Center for Science and Engineering Statistics
National Patterns of R&D Resources
Figure 2
Federal obligations for research and development, top 5 agencies: FYs 2000–25
National Center for Science and Engineering Statistics
Survey of Federal Funds for Research and Development
Figure 3
Federal obligations for research and experimental development, by agency and performer: FY 2024
National Center for Science and Engineering Statistics
Survey of Federal Funds for Research and Development
Figure 4
Gross domestic expenditures on R&D and R&D intensity, by selected region, country, or economy: 2000–24
National Center for Science and Engineering Statistics
National Patterns of R&D Resources
Figure 4
Gross domestic expenditures on R&D and R&D intensity, by selected region, country, or economy: 2000–24
Organisation for Economic Co-operation and Development
Main Science and Technology Indicators
Figure 6
S&E publications in the top 1% most-cited journal articles as a share of all S&E journal articles, by selected region, country, or economy: 2006–22
Elsevier
Scopus
Figure 7
S&E doctoral degrees awarded, by selected country: 2015–23
Government of India, Ministry of Education, Department of Higher Education
All India Survey on Higher Education
Figure 7
S&E doctoral degrees awarded, by selected country: 2015–23
Ministry of Education, People's Republic of China
Higher Education Data
Figure 7
S&E doctoral degrees awarded, by selected country: 2015–23
National Bureau of Statistics of China
China Statistical Yearbook
Figure 7
S&E doctoral degrees awarded, by selected country: 2015–23
Organisation for Economic Co-operation and Development
Education at a Glance
Figure 8
Workers in STEM occupations: 2000, 2009, 2019, 2024
U.S. Census Bureau
American Community Survey
Figure 9
Average student scores on the main NAEP mathematics assessment, by grade level: 1990–2024
National Center for Education Statistics
National Assessment of Educational Progress
Figure 10
Degree outcomes for fall 2009 ninth graders who had enrolled in postsecondary education by 2017, by first major: June 2021
National Center for Education Statistics
High School Longitudinal Study of 2009
Figure 11
S&E degrees awarded, by degree level: 2014–24
National Center for Education Statistics
Integrated Postsecondary Education Data System (IPEDS), Completions Survey
Figure 11
S&E degrees awarded, by degree level: 2014–24
National Center for Science and Engineering Statistics
Survey of Earned Doctorates
Figure 12
S&E undergraduate degrees awarded, by field: 2014 and 2024
National Center for Education Statistics
Integrated Postsecondary Education Data System (IPEDS), Completions Survey
Figure 13
S&E graduate degrees awarded, by field: 2014 and 2024
National Center for Education Statistics
Integrated Postsecondary Education Data System (IPEDS), Completions Survey
Figure 13
S&E graduate degrees awarded, by field: 2014 and 2024
National Center for Science and Engineering Statistics
Survey of Earned Doctorates
Figure 14
Average scores of students in grade 8 on the TIMSS mathematics and science scales among participating advanced economies, by education system: 2023
National Center for Education Statistics
Trends in International Mathematics and Science Study
Figure 15
International S&E students on visas enrolled in U.S. higher education institutions, by level of enrollment: 2012–25
U.S. Department of Homeland Security, U.S. Immigration and Customs Enforcement
Student and Exchange Visitor Information System (SEVIS)
Figure 16
International S&E graduate students on visas enrolled in U.S. higher education institutions, by level of enrollment and selected country of origin: 2012–25
U.S. Department of Homeland Security, U.S. Immigration and Customs Enforcement
Student and Exchange Visitor Information System (SEVIS)
Figure 17
Share of S&E degrees awarded to temporary visa holders, by degree level: 2014–24
National Center for Education Statistics
Integrated Postsecondary Education Data System (IPEDS), Completions Survey
Figure 17
Share of S&E degrees awarded to temporary visa holders, by degree level: 2014–24
National Center for Science and Engineering Statistics
Survey of Earned Doctorates
Figure 18
S&E doctoral degrees awarded, by field and selected country: 2023
Government of India, Ministry of Education, Department of Higher Education
All India Survey on Higher Education
Figure 18
S&E doctoral degrees awarded, by field and selected country: 2023
Ministry of Education, People's Republic of China
Higher Education Data
Figure 18
S&E doctoral degrees awarded, by field and selected country: 2023
Organisation for Economic Co-operation and Development
Education at a Glance
Figure 19
U.S. workforce, by occupational group and education level: 2024
U.S. Census Bureau
American Community Survey
Figure 20
STEM occupational group share of total employment, by R&D-intensive industry classification: 2024
U.S. Census Bureau
American Community Survey
Figure 21
Foreign-born share of workers with a bachelor's degree or higher, by highest degree level and occupational group: 2023
National Center for Science and Engineering Statistics
National Survey of College Graduates
Figure 22
R&D expenditures and R&D intensities, by selected region, country, or economy: 2024 or most recent year
National Center for Science and Engineering Statistics
National Patterns of R&D Resources
Figure 22
R&D expenditures and R&D intensities, by selected region, country, or economy: 2024 or most recent year
Organisation for Economic Co-operation and Development
Main Science and Technology Indicators
Figure 23
Share of global R&D expenditures, by selected region, country, or economy: 2000, 2010, and 2024
National Center for Science and Engineering Statistics
National Patterns of R&D Resources
Figure 23
Share of global R&D expenditures, by selected region, country, or economy: 2000, 2010, and 2024
Organisation for Economic Co-operation and Development
Main Science and Technology Indicators
Figure 24
Business R&D expenditures, by selected industry and selected region, country, or economy: 2022
Organisation for Economic Co-operation and Development
Analytical Business Enterprise Resarch and Development (ANBERD) Database
Figure 25
U.S. R&D expenditures, by type of R&D and performer or funder: 2024
National Center for Science and Engineering Statistics
National Patterns of R&D Resources
Figure 26
U.S. business R&D expenditures, by selected manufacturing or services industry: 2023
National Center for Science and Engineering Statistics
Business Enterprise Research and Development Survey
Figure 27
Federal obligations for R&D, by field and type of R&D: FY 2024
National Center for Science and Engineering Statistics
Survey of Federal Funds for Research and Development
Figure 28
Full-time graduate students in science, engineering, and health primarily supported by the federal government, by broad field and agency: 2024
National Center for Science and Engineering Statistics
Survey of Graduate Students and Postdoctorates in Science and Engineering
Figure 30
S&E publications in the top 1% most-cited journal articles as a share of all journal articles for selected S&E fields, by selected region, country, or economy: 2022
Elsevier
Scopus
Figure 31
Total factor productivity, U.S. nonfarm business sector and information industries: 2017–24
Bureau of Labor Statistics
Productivity Statistics
Figure 32
Startup companies based on licensed university technology, by company location: 2000–24
AUTM
AUTM Licensing Activity Survey
Figure 33
Citations of U.S. academic S&E articles in USPTO utility patents, by S&E field of the articles cited: 2024
Elsevier
Scopus
Figure 33
Citations of U.S. academic S&E articles in USPTO utility patents, by S&E field of the articles cited: 2024
United States Patent and Trademark Office
PatentsView
Figure 34
USPTO utility patents granted to owners, by nationality and U.S. sector: 2004–24
United States Patent and Trademark Office
PatentsView
Figure 35
International priority patent families granted, by technology and selected country or economy: 2024
European Patent Office
PATSTAT
Figure 36
U.S. companies reporting product or business process innovation, by selected industry: 2020–22
National Center for Science and Engineering Statistics
Annual Business Survey
Figure 37
Venture capital investment received by firms headquartered in selected regions, countries, or economies: 2013–24
PitchBook
Venture Capital and Private Equity Database
Figure 38
Venture capital investment received by firms headquartered in the United States, by critical and emerging technology: 2013–24
PitchBook
Venture Capital and Private Equity Database
Figure 39
Industry share of U.S. total KTI value added, by selected industries: 2002–24
S&P Global
Comparative Industry Service
Figure 40
KTI industry value added for selected countries or economies: 2002–24
S&P Global
Comparative Industry Service
Figure 41
Gross exports of KTI manufacturing industries for selected countries: 2002–24
S&P Global
Comparative Industry Service
Figure A
Semiconductors collaboration network, by selected region, country, or economy pairs: 2002–24
Elsevier
Scopus
Table 1
U.S. R&D expenditures, by type of R&D: Selected years, 2000–24
National Center for Science and Engineering Statistics
National Patterns of R&D Resources
Table 3
Average and percentile student scores on the grade 8 NAEP science assessment: 2009–24
National Center for Education Statistics
National Assessment of Educational Progress
Table 4
Median earnings of full-time, year-round workers, by educational attainment and occupational group: 2024
U.S. Census Bureau
American Community Survey
Table 5
Select characteristics of veterans and nonveterans: 2024
U.S. Census Bureau
American Community Survey
Table 6
U.S. federal agencies cited in the funding acknowledgment section of S&E articles, by citation frequency: 2002–23
Elsevier
Scopus
Table 7
Top patenting organizations at the USPTO: 2024
United States Patent and Trademark Office
PatentsView
Table S1
S&E degrees as a percentage of total degrees awarded: 2014 and 2024
National Center for Education Statistics
Integrated Postsecondary Education Data System (IPEDS), Completions Survey
Table S1
S&E degrees as a percentage of total degrees awarded: 2014 and 2024
National Center for Science and Engineering Statistics
Survey of Earned Doctorates
Table S2
S&E graduate degrees awarded, by field: 2014 and 2024
National Center for Education Statistics
Integrated Postsecondary Education Data System (IPEDS), Completions Survey
Table S2
S&E graduate degrees awarded, by field: 2014 and 2024
National Center for Science and Engineering Statistics
Survey of Earned Doctorates
Table S3
S&E and S&E-related degrees awarded, by sex, field, and degree level: 2024
National Center for Education Statistics
Integrated Postsecondary Education Data System (IPEDS), Completions Survey
Table S4
S&E doctoral degrees awarded, by sex and field: 2024
National Center for Science and Engineering Statistics
Survey of Earned Doctorates
Table S5
Race and ethnicity of U.S. resident population, ages 20–34, and U.S. citizen and permanent resident S&E award recipients, by degree level: 2024
National Center for Education Statistics
Integrated Postsecondary Education Data System (IPEDS), Completions Survey
Table S5
Race and ethnicity of U.S. resident population, ages 20–34, and U.S. citizen and permanent resident S&E award recipients, by degree level: 2024
National Center for Science and Engineering Statistics
Survey of Earned Doctorates
Table S5
Race and ethnicity of U.S. resident population, ages 20–34, and U.S. citizen and permanent resident S&E award recipients, by degree level: 2024
U.S. Census Bureau
Population Estimates Program
Table S6
Degrees awarded, by degree level, citizenship status, and field: 2024
National Center for Education Statistics
Integrated Postsecondary Education Data System (IPEDS), Completions Survey
Table S6
Degrees awarded, by degree level, citizenship status, and field: 2024
National Center for Science and Engineering Statistics
Survey of Earned Doctorates
Table S7
Size of the workforce, by occupational group: 2014–24
U.S. Census Bureau
American Community Survey
Table S8
Projected employment size, by occupational group: 2024 and 2034
Bureau of Labor Statistics
Employment Projections
Table S9
Unemployment rate, by occupational group: 2014–24
U.S. Census Bureau
American Community Survey
Table S10
Workers, by state, occupational group, and educational attainment: 2024
U.S. Census Bureau
American Community Survey
Table S12
Industries with R&D intensity higher than the average across industries: 2023
National Center for Science and Engineering Statistics
Business Enterprise Research and Development Survey
Table S12
Industries with R&D intensity higher than the average across industries: 2023
U.S. Census Bureau
American Community Survey
Table S13
Workers, by occupational group and industry type: 2024
U.S. Census Bureau
American Community Survey
Table S14
Workers, by occupational group, sex, and race and ethnicity: 2024
U.S. Census Bureau
American Community Survey
Table S15
Workers, by occupational group, place of birth, and selected region, country, or economy of origin: 2024
U.S. Census Bureau
American Community Survey
Table S16
Citizenship status of STEM workers with a bachelor's degree or higher, by occupational group and educational attainment: 2023
National Center for Science and Engineering Statistics
National Survey of College Graduates