 An official website of the United States government
 Executive Summary
The U.S. Science and Engineering Enterprise in a Changing World
The past quarter century has fundamentally reshaped the U.S. science and engineering (S&E) enterprise through the business sector’s dominant role in funding and performing research and development (R&D), the concentration of innovation activity in information technologies and critical and emerging technology (CET) areas, and the rise of China as a competitor. China performs strongly in several key science and technology (S&T) areas: in 2024, it is estimated to have surpassed the United States for the first time as the largest performer of R&D according to the latest data from the Organisation for Economic Co-operation and Development (OECD) when adjusted for international comparability, it awards the most S&E doctorates globally, produces the largest volume of research publications, and leads the global high-technology manufacturing trade. The United States is among the world’s most R&D-intensive economies. The U.S. S&E enterprise is characterized by private-sector R&D funding and performance, especially of experimental development, with an emphasis on software, biotechnology, and artificial intelligence (AI). The United States maintains comparative advantages in highly cited research publications and patents, venture capital (VC)-backed innovation, and knowledge- and technology-intensive (KTI) services, where U.S. firms dominate global trade.
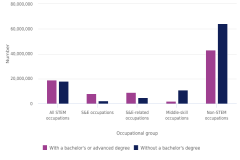
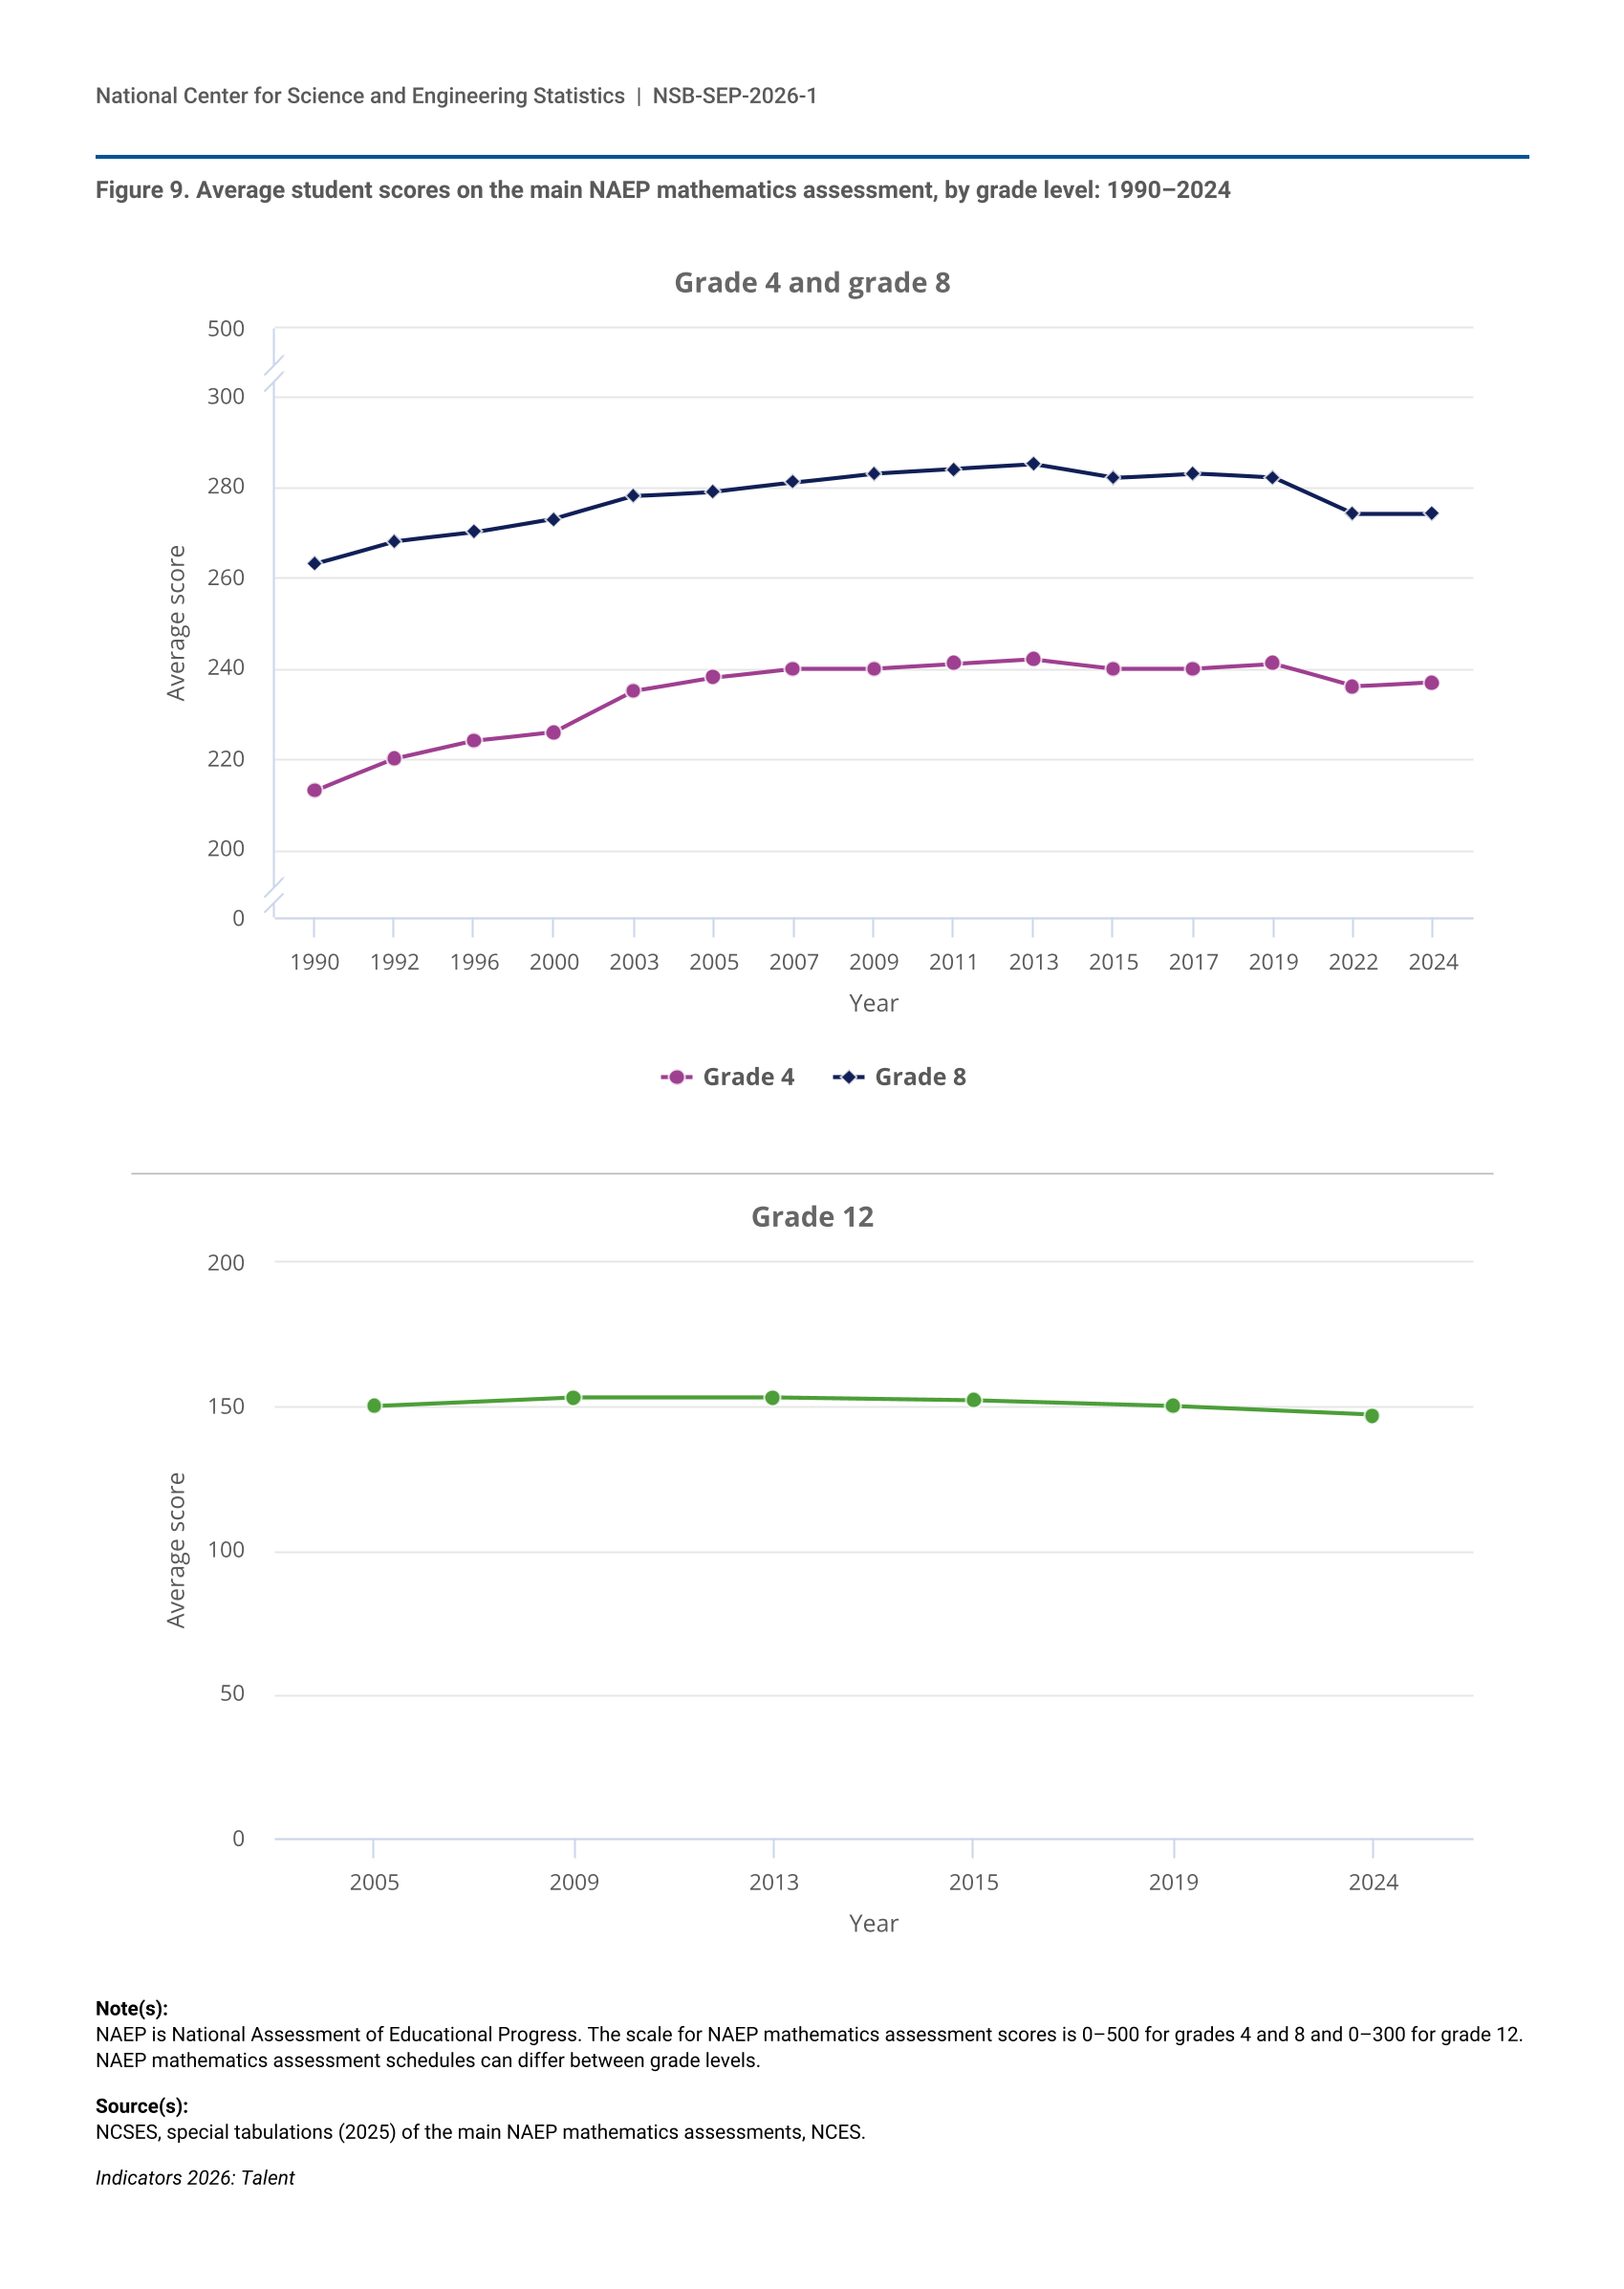
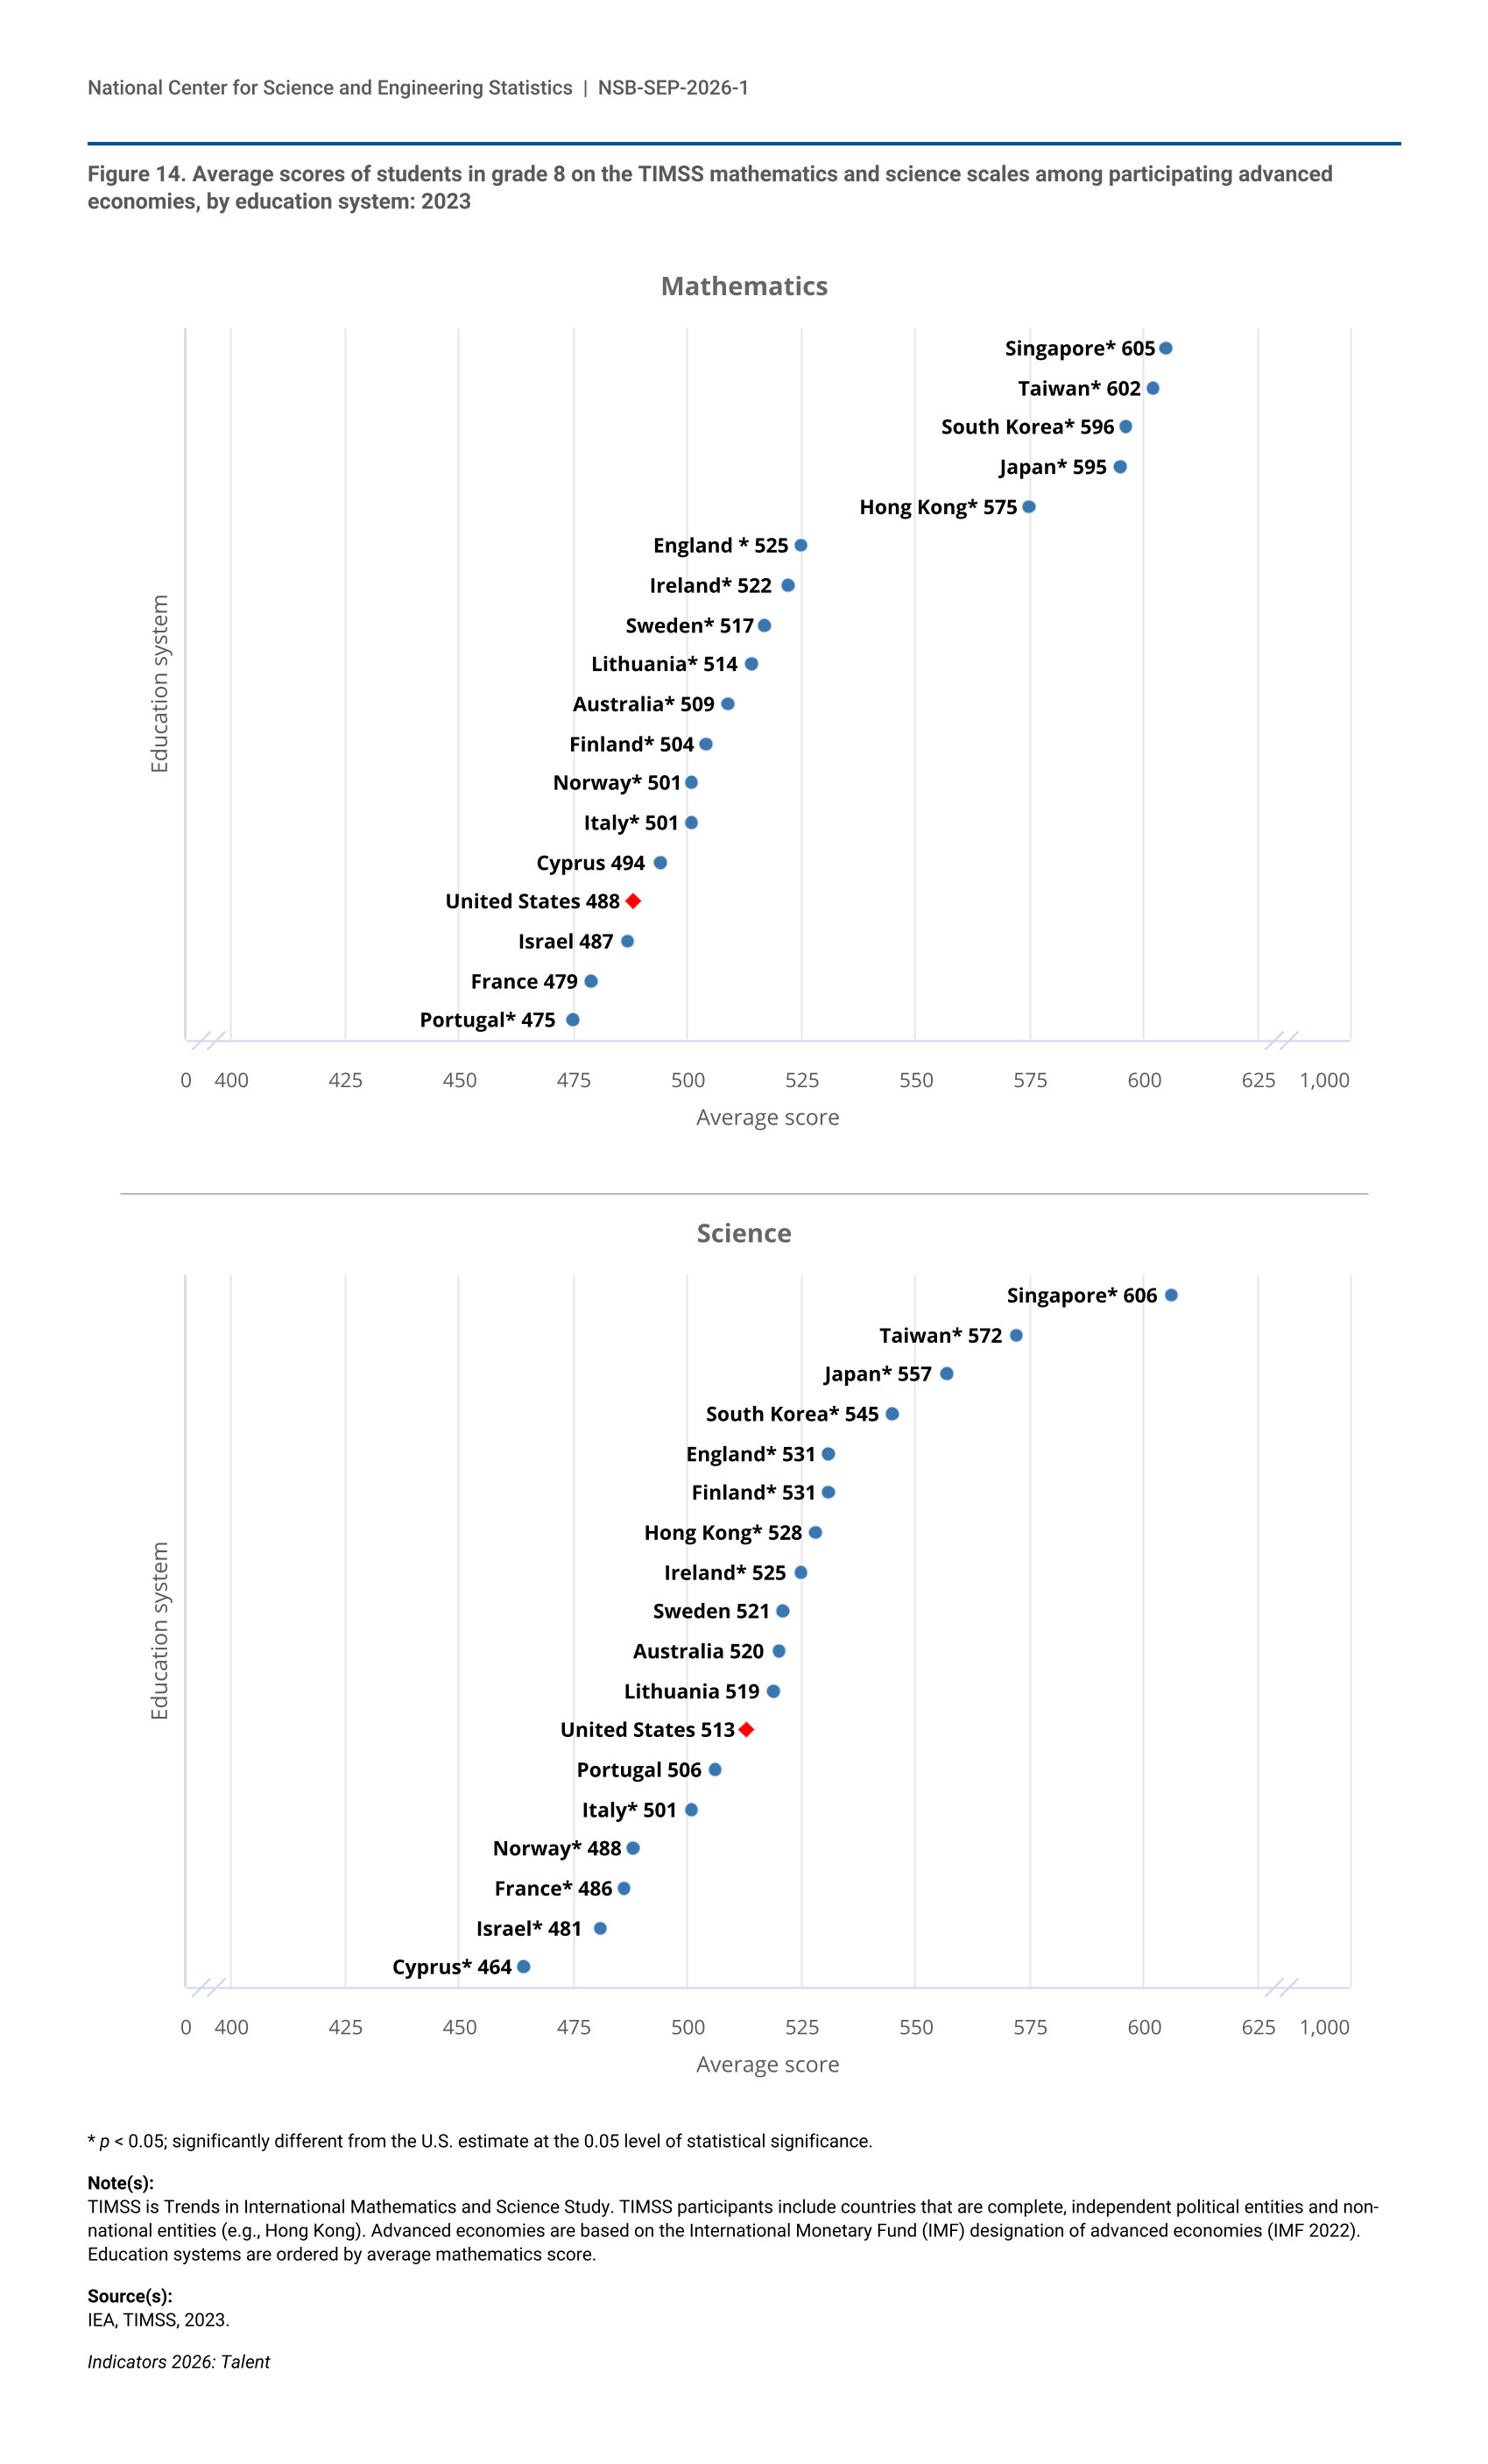
The U.S. science, technology, engineering, and mathematics (STEM) workforce grew at a faster rate than the non-STEM workforce from 2014 to 2024. STEM workers experienced lower unemployment rates and higher median annual earnings than their counterparts in non-STEM occupations. U.S. institutions have awarded increased numbers of S&E degrees at all levels between 2014 and 2024, and they awarded the second-highest number of S&E doctorates globally in 2022, the last year with internationally comparable data. In 2024, temporary visa holders accounted for more than half of doctoral degrees awarded by U.S. institutions of higher education in S&E fields such as computer and information sciences, engineering, and mathematics and statistics. In addition, longitudinal data confirm that most temporary visa S&E doctorate recipients remain in the United States after graduation, contributing to the U.S. STEM workforce and S&E enterprise. Average scores for U.S. elementary and secondary students on national mathematics and science assessments have declined from pre-COVID-19 pandemic levels, and in 2023, U.S. eighth graders performed at about or below the average among their peers on international science, mathematics, and computer and information literacy assessments.
STEM Talent: Education, Training, and Workforce
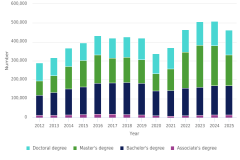
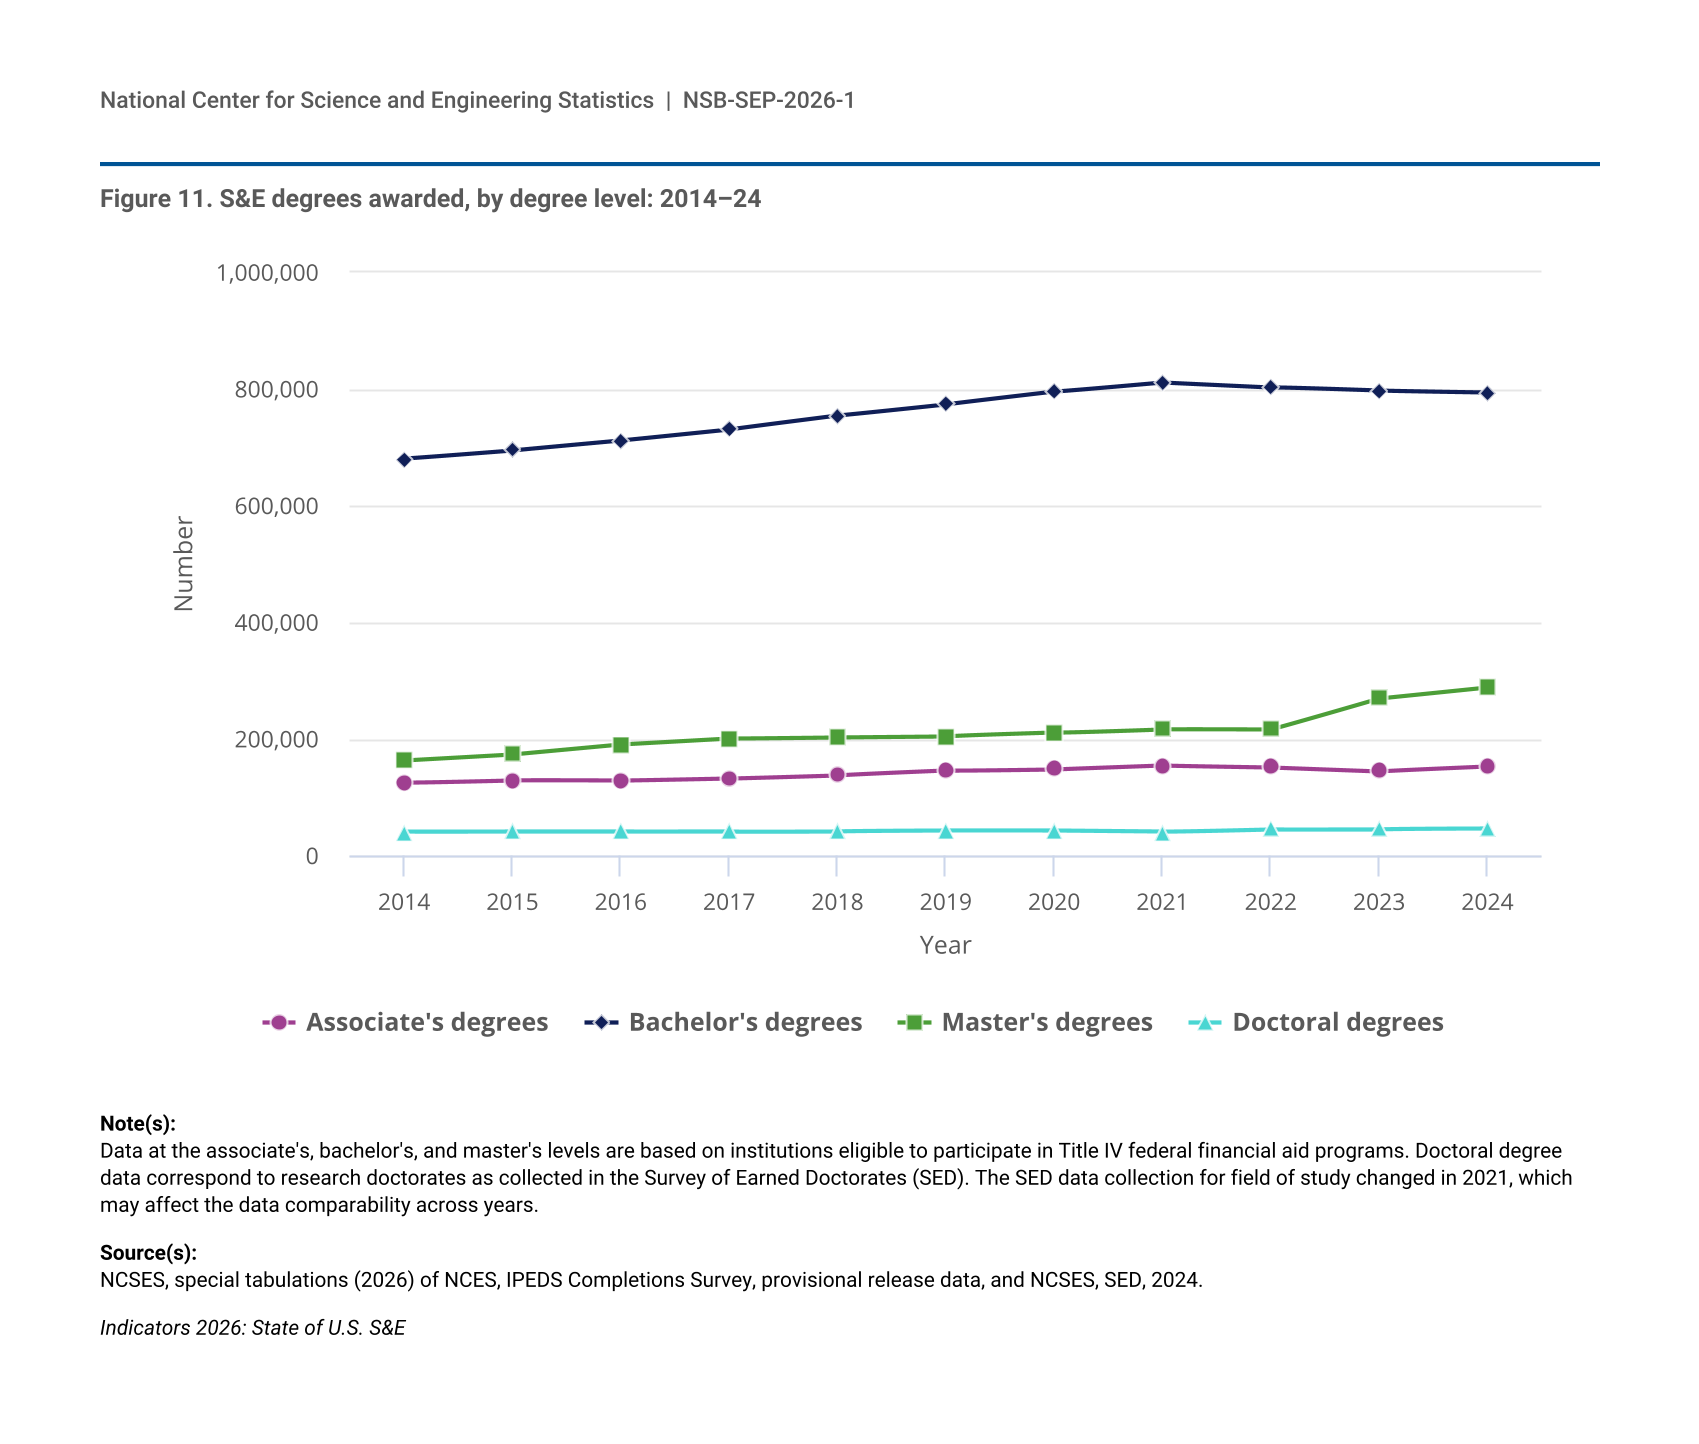
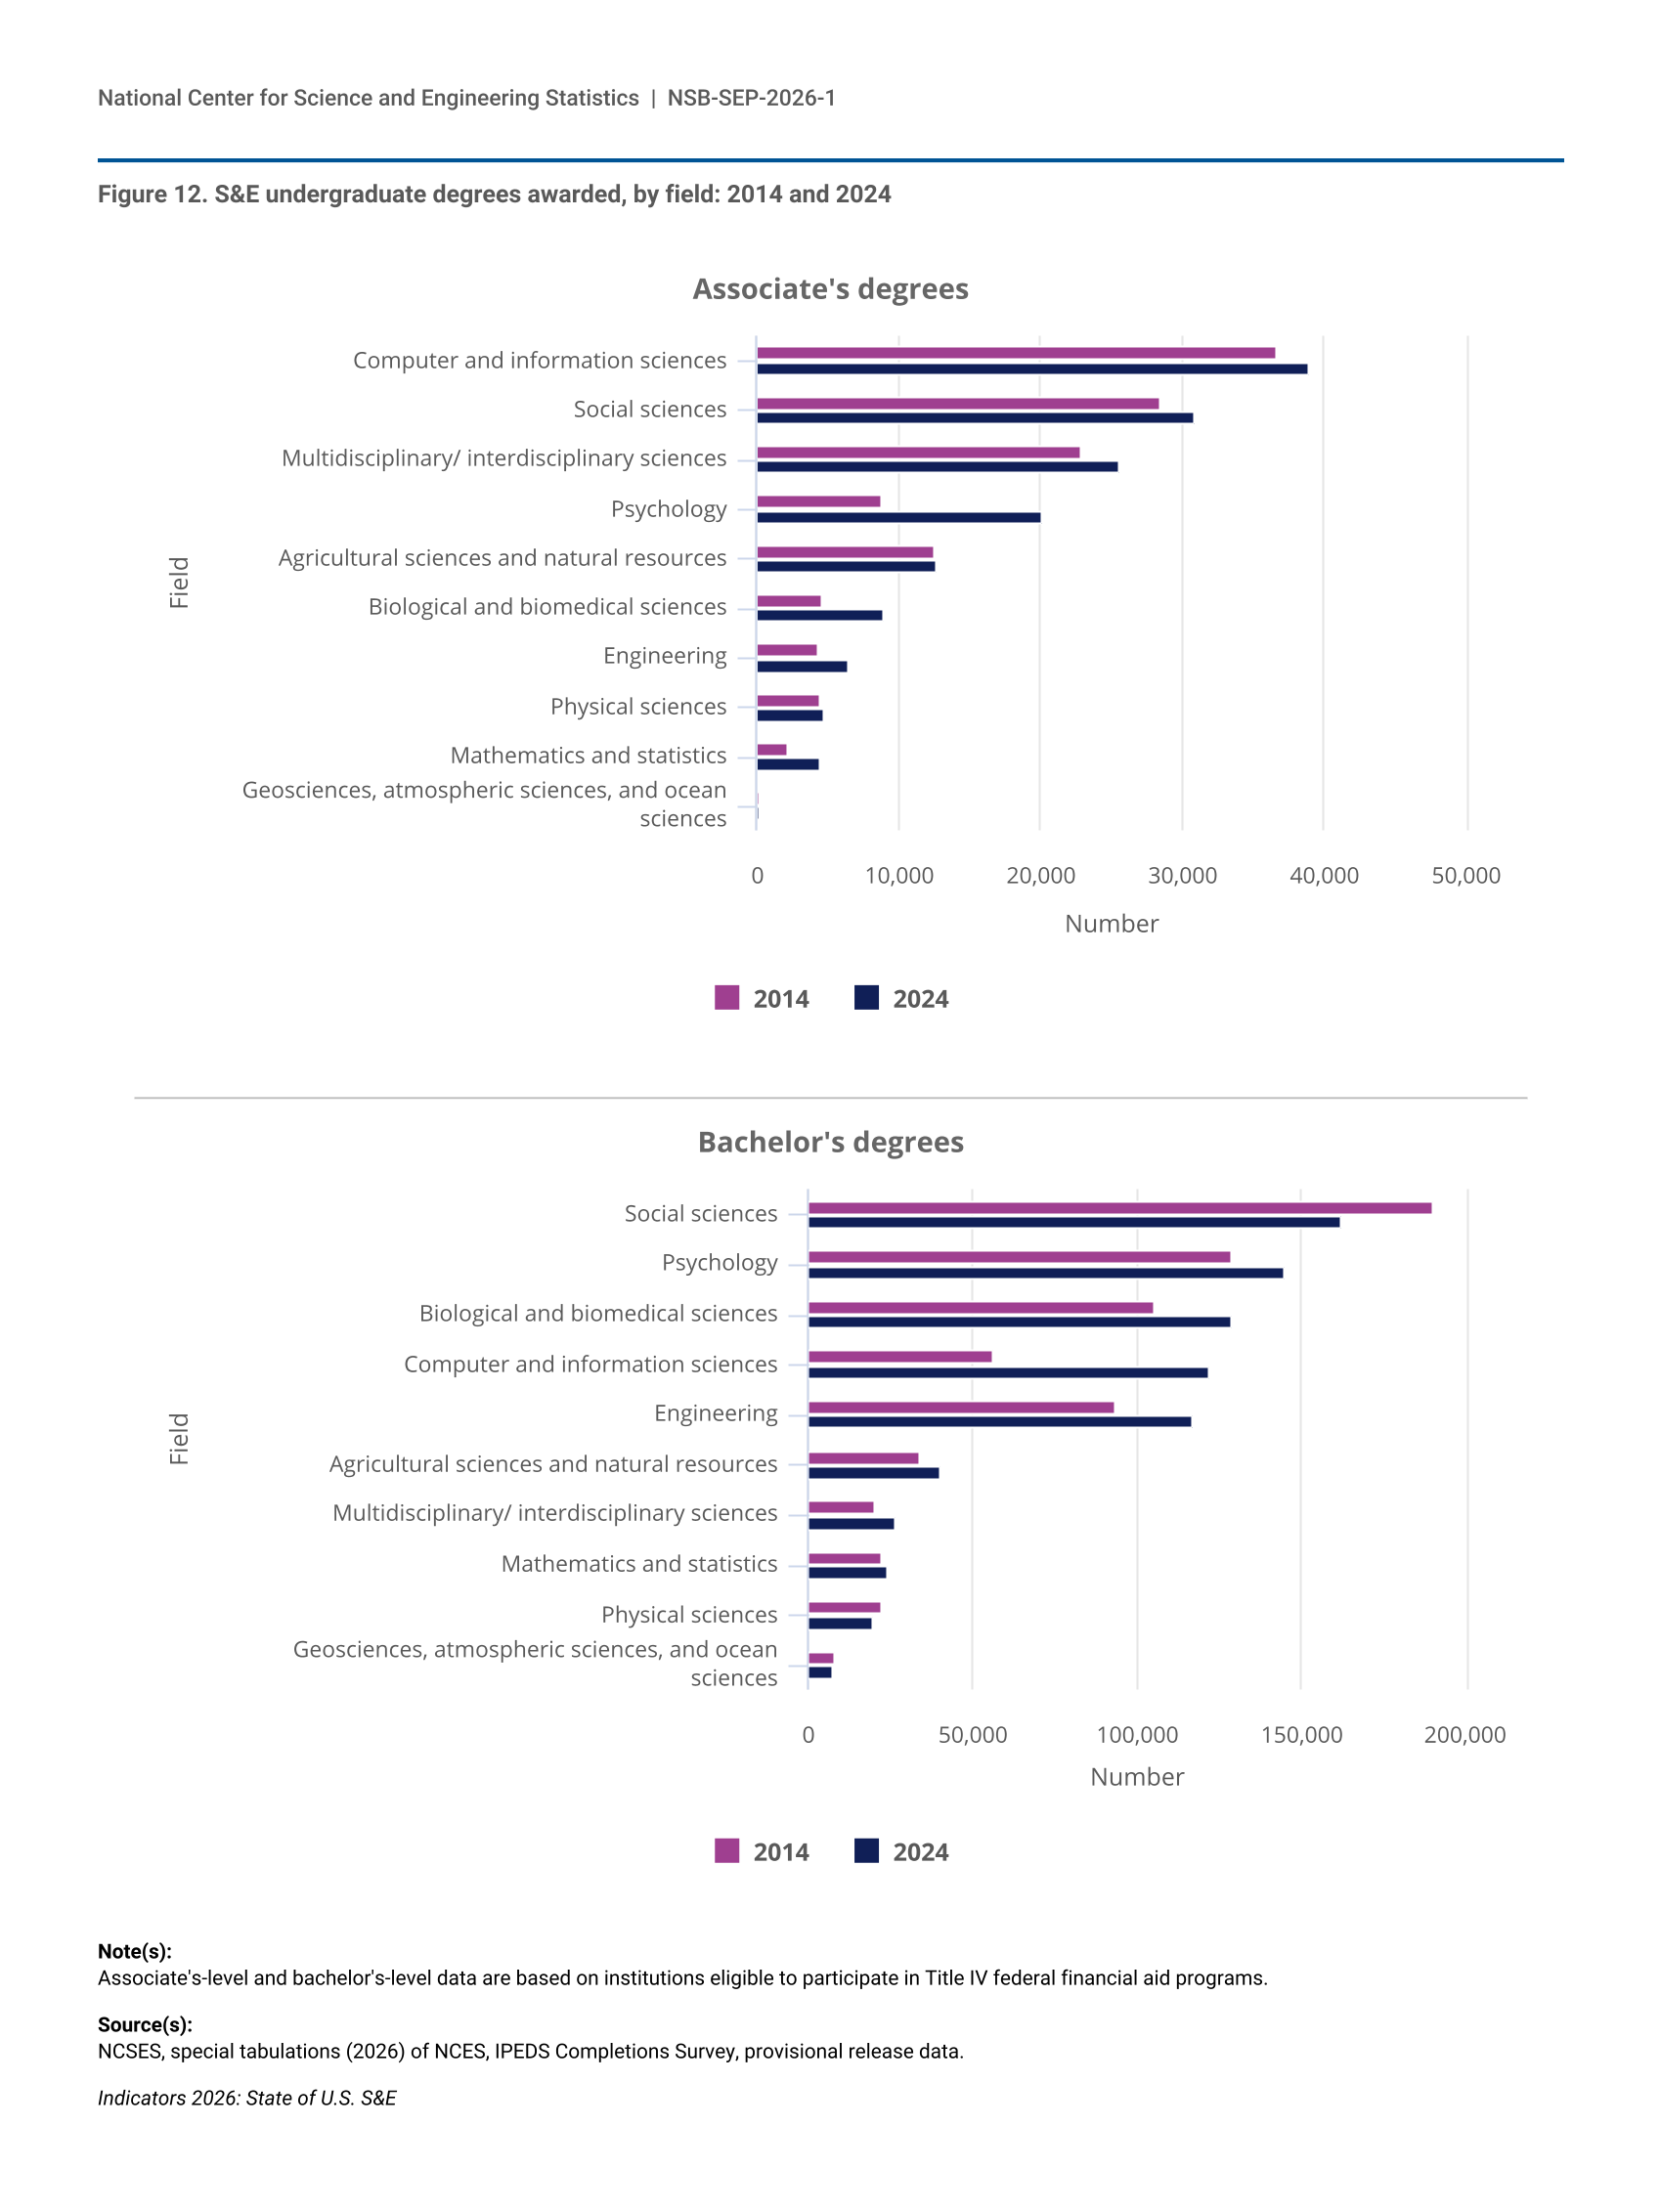
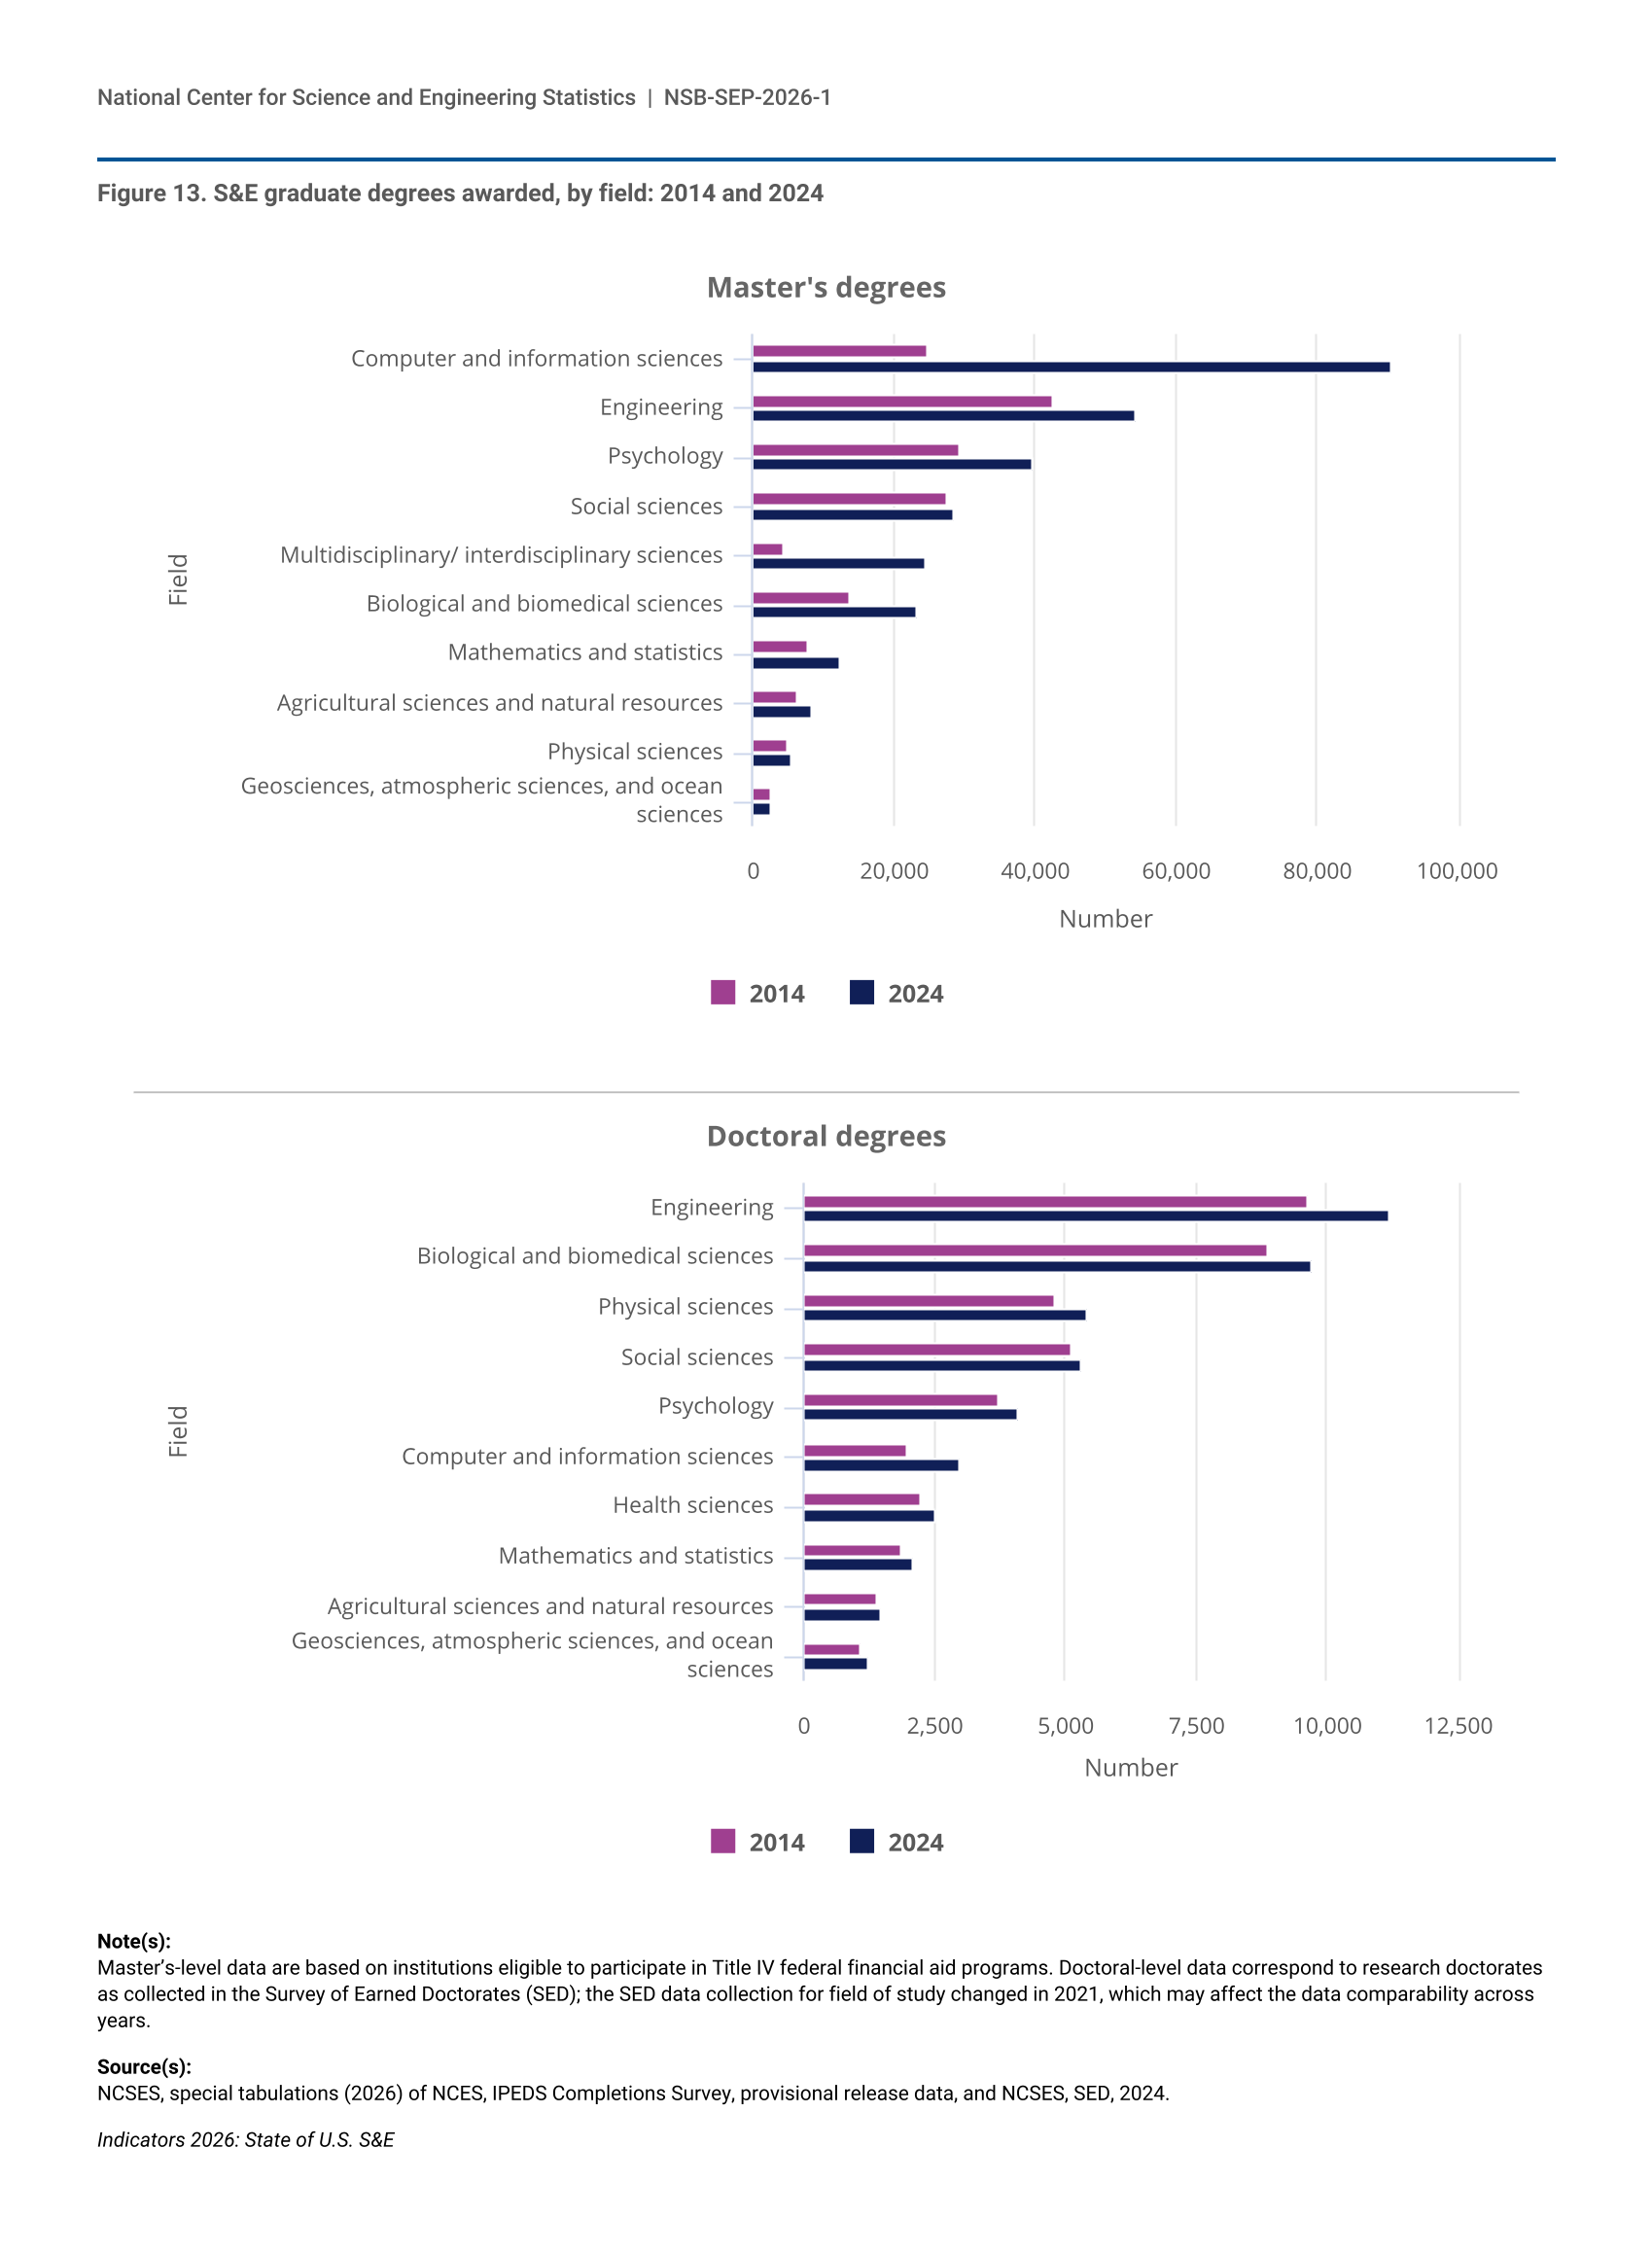
Between 2014 and 2024, U.S. institutions of higher education continued to expand S&E degree output, with particularly rapid growth in computer and information science degrees. The U.S. STEM workforce accounts for roughly a quarter (26%) of the total domestic workforce and enjoys employment and wage premiums. U.S. elementary and secondary student performance in national mathematics and science assessments has declined since 2019.
STEM Education
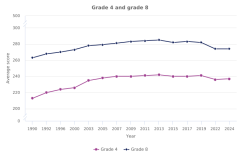
- U.S. elementary and secondary student performance on mathematics and science assessments has declined from pre-COVID-19 pandemic levels, with 4th and 8th grade average mathematics scores declining since 2019.
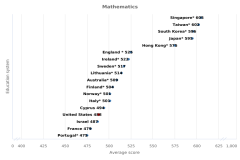
- In 2023, U.S. eighth graders performed at about or below the average among their peers on international science, mathematics, and computer and information literacy assessments.
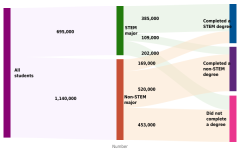
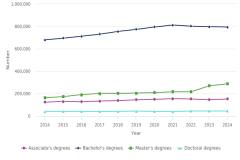
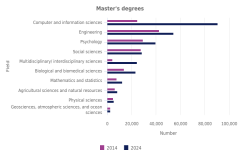
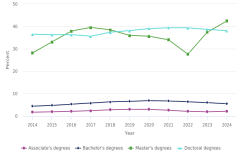
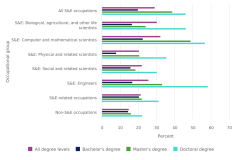
- Between 2014 and 2024, the number of computer and information sciences degrees awarded by U.S. higher education institutions more than doubled at the bachelor’s level and more than tripled at the master’s level. They grew by 50% at the doctoral level over the same period.
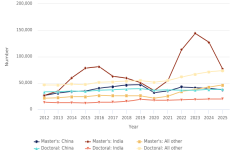
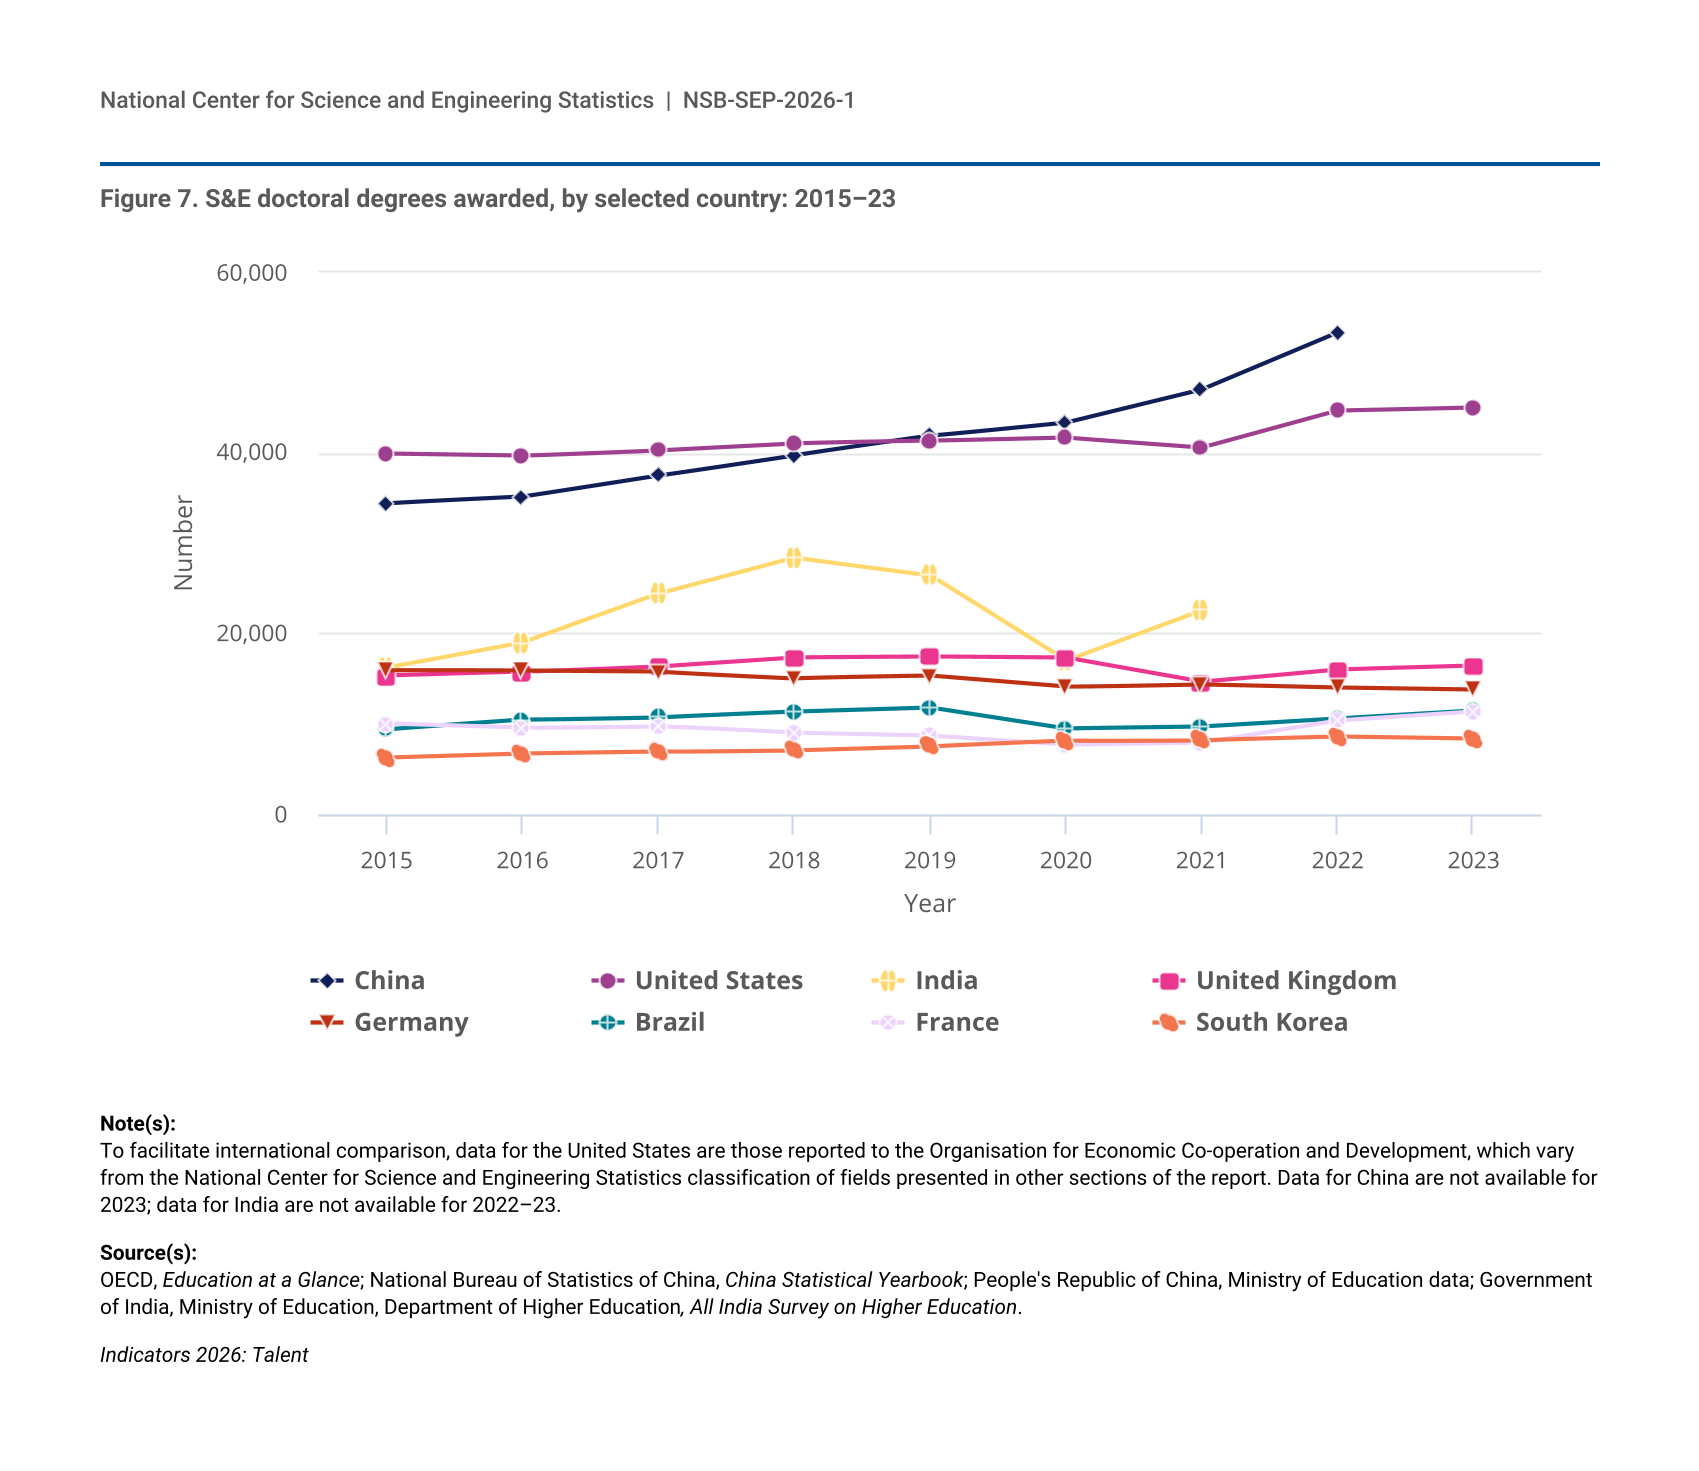
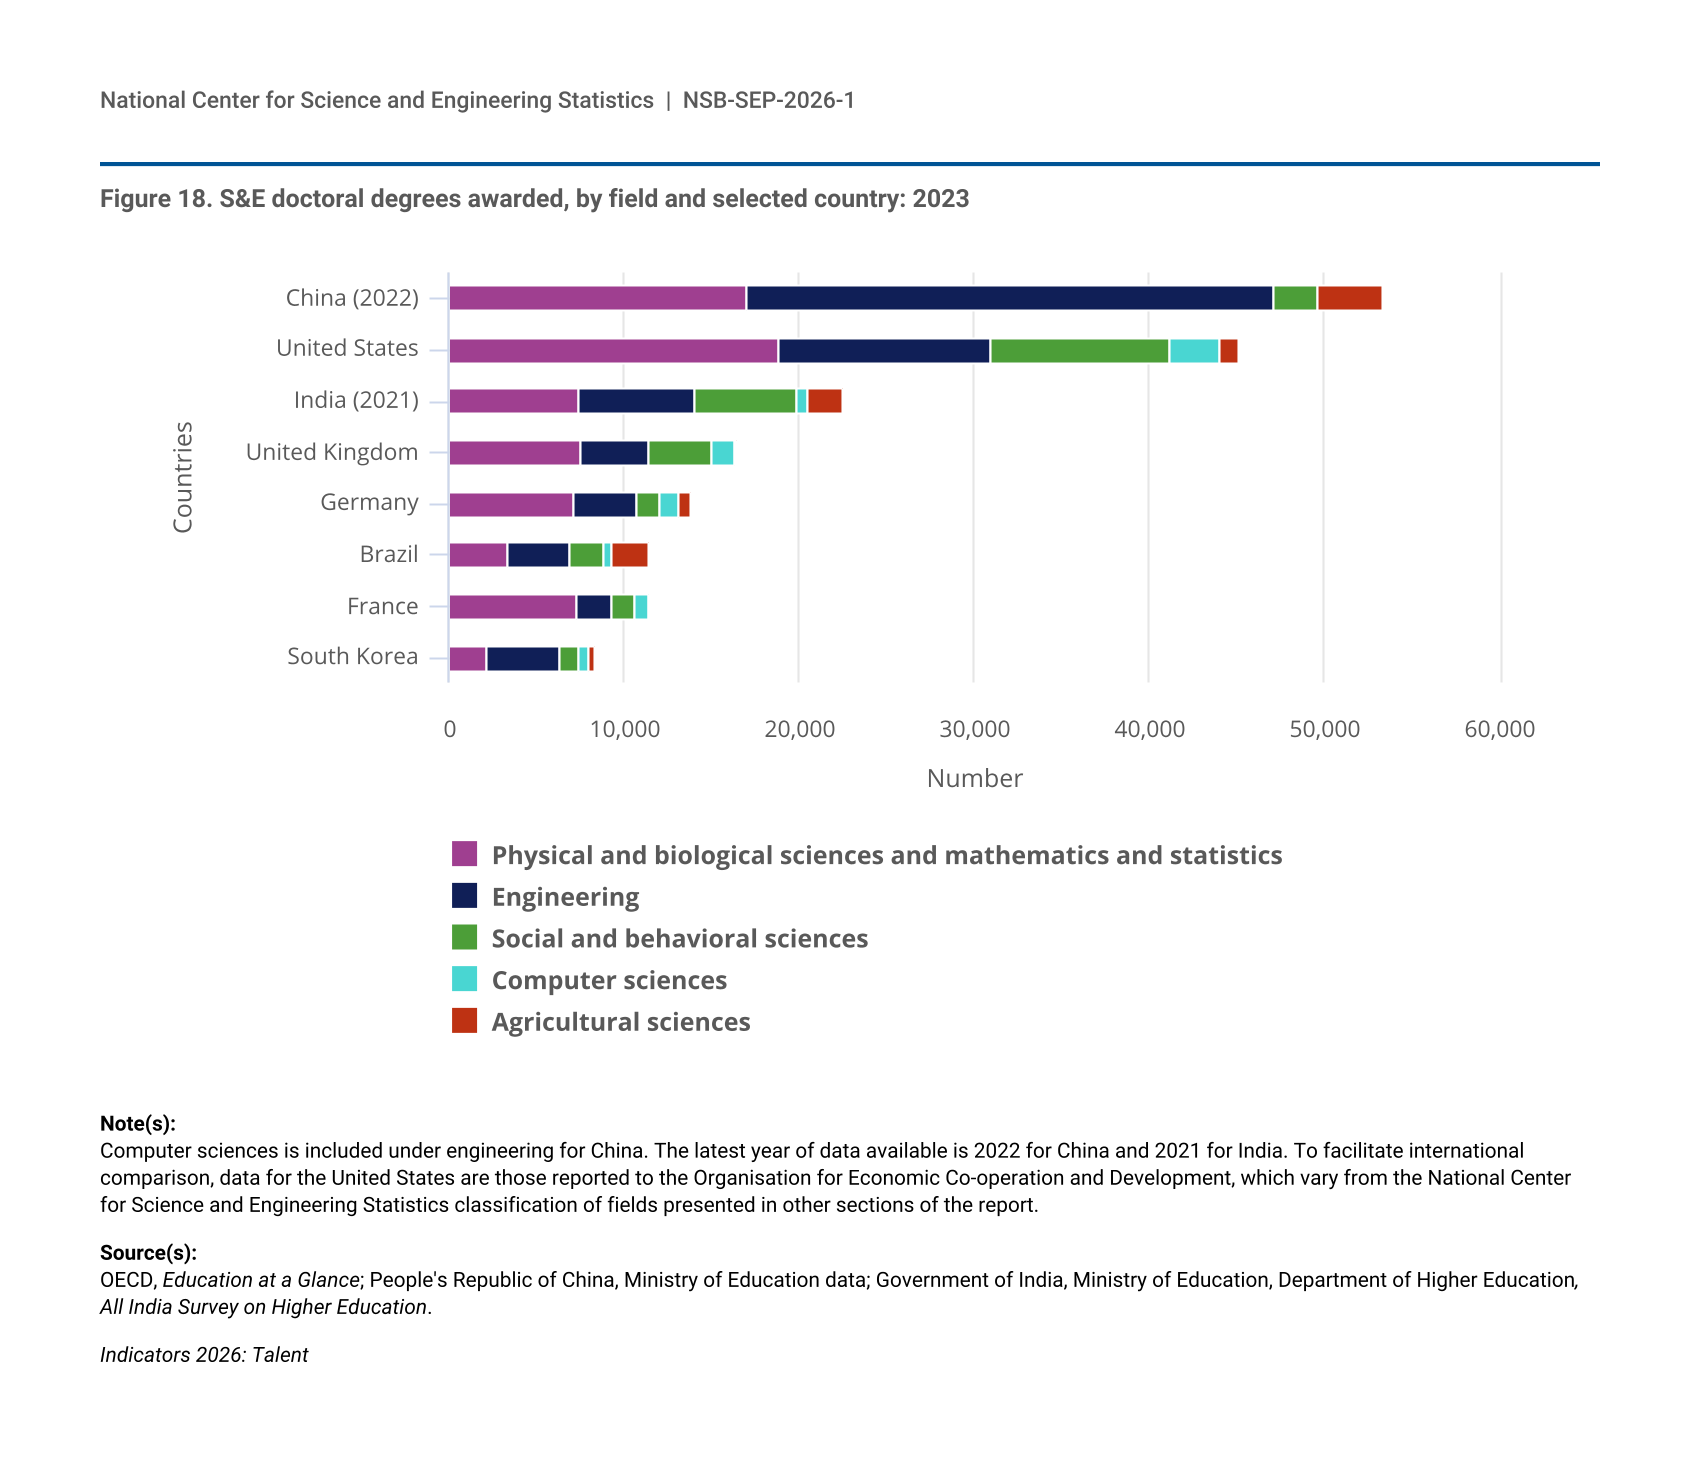
- U.S. institutions of higher education awarded the second-highest number of S&E doctorates globally (45,000 in 2023), behind institutions in China (53,000 in 2022) but far above institutions in all other countries.
- The United States enrolled more international postsecondary students (across all fields of study) in 2023 than any other country. However, the number of these students in the United States decreased 3% from 2017 to 2023, while enrollment grew in Canada by 85%, in the United Kingdom by 72%, and in Germany by 63%.
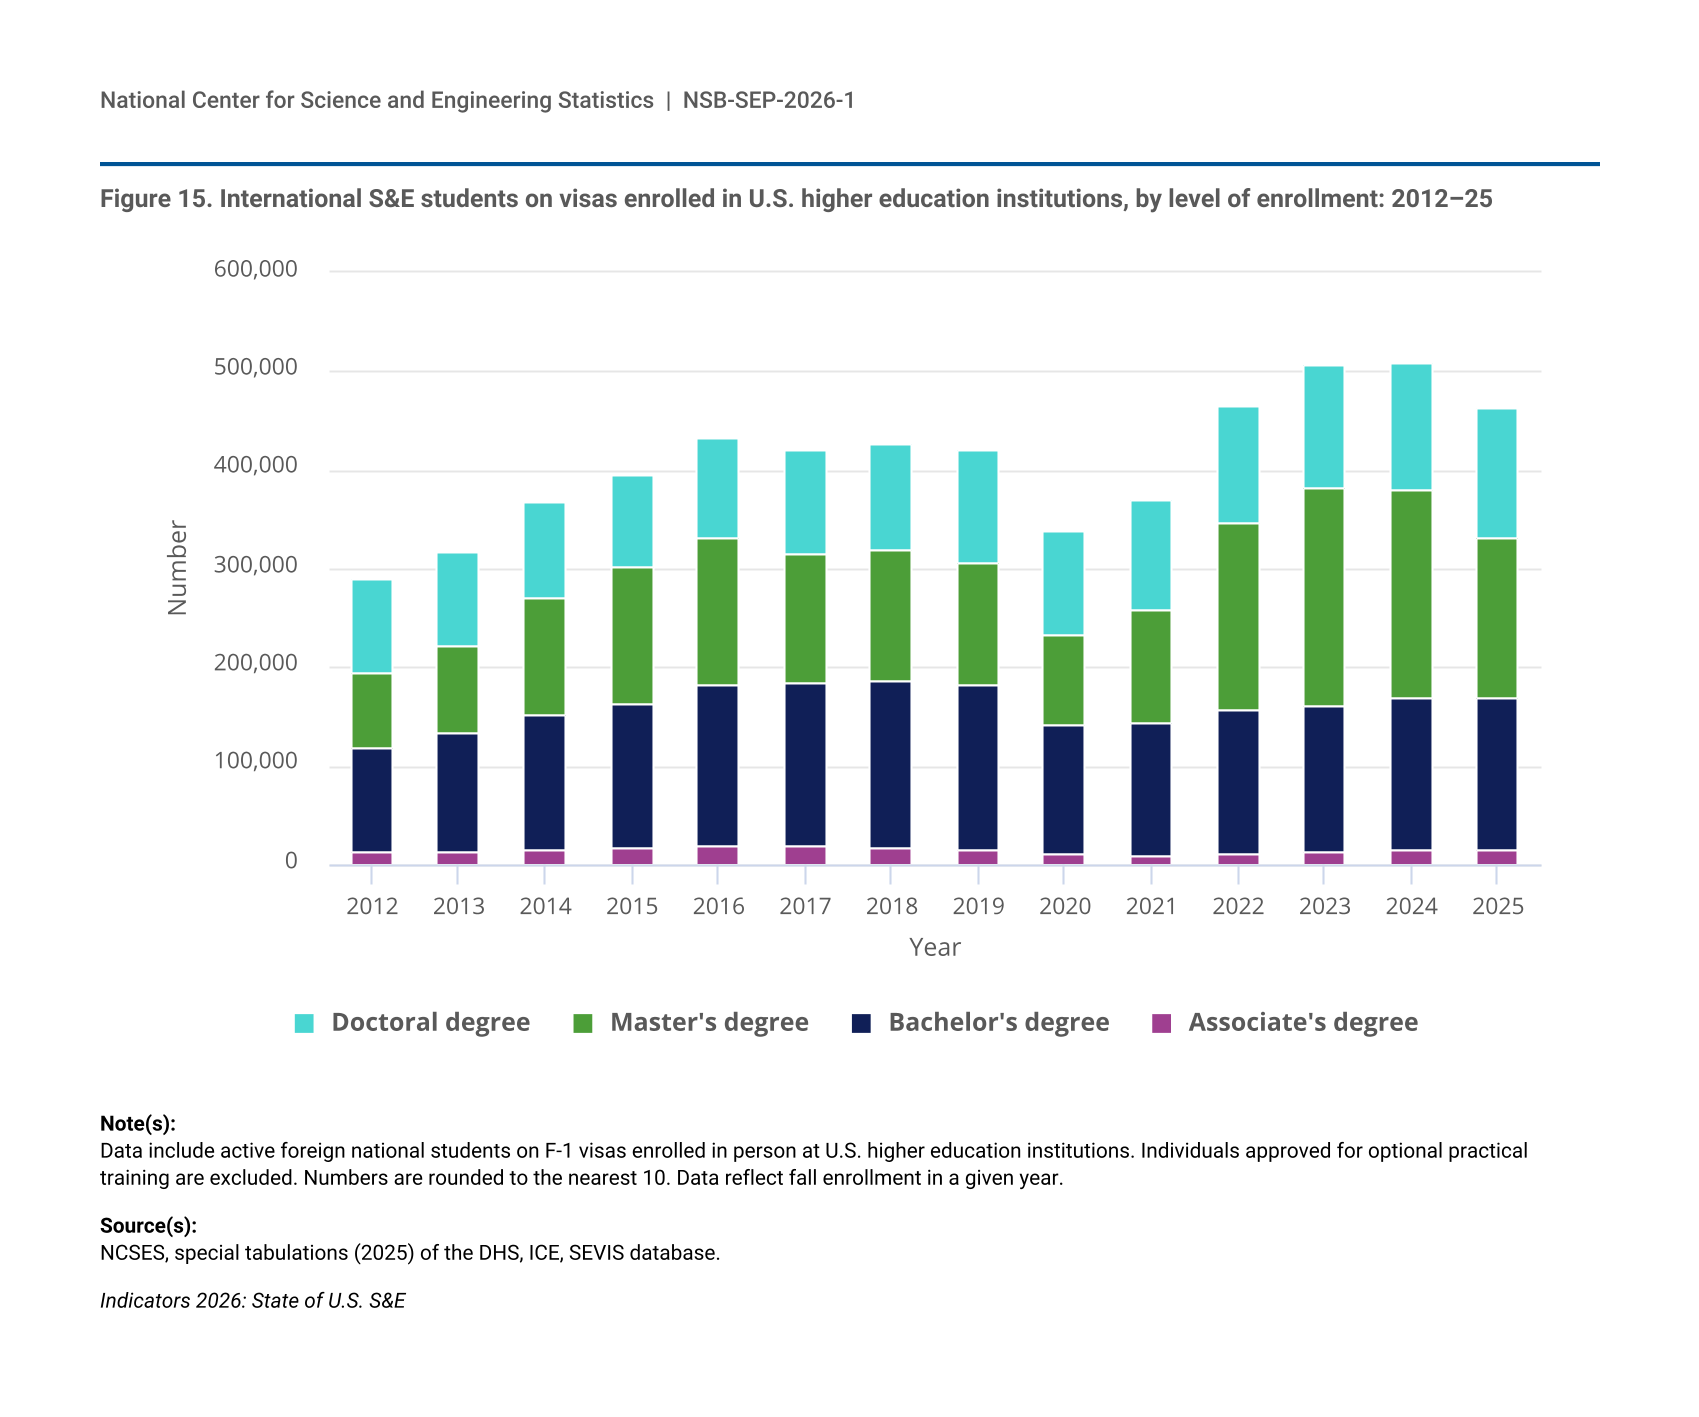
- Total international S&E postsecondary degree student enrollment at U.S. institutions declined by 9% from 2024 to 2025, driven by a 24% decline in S&E master’s degree students.
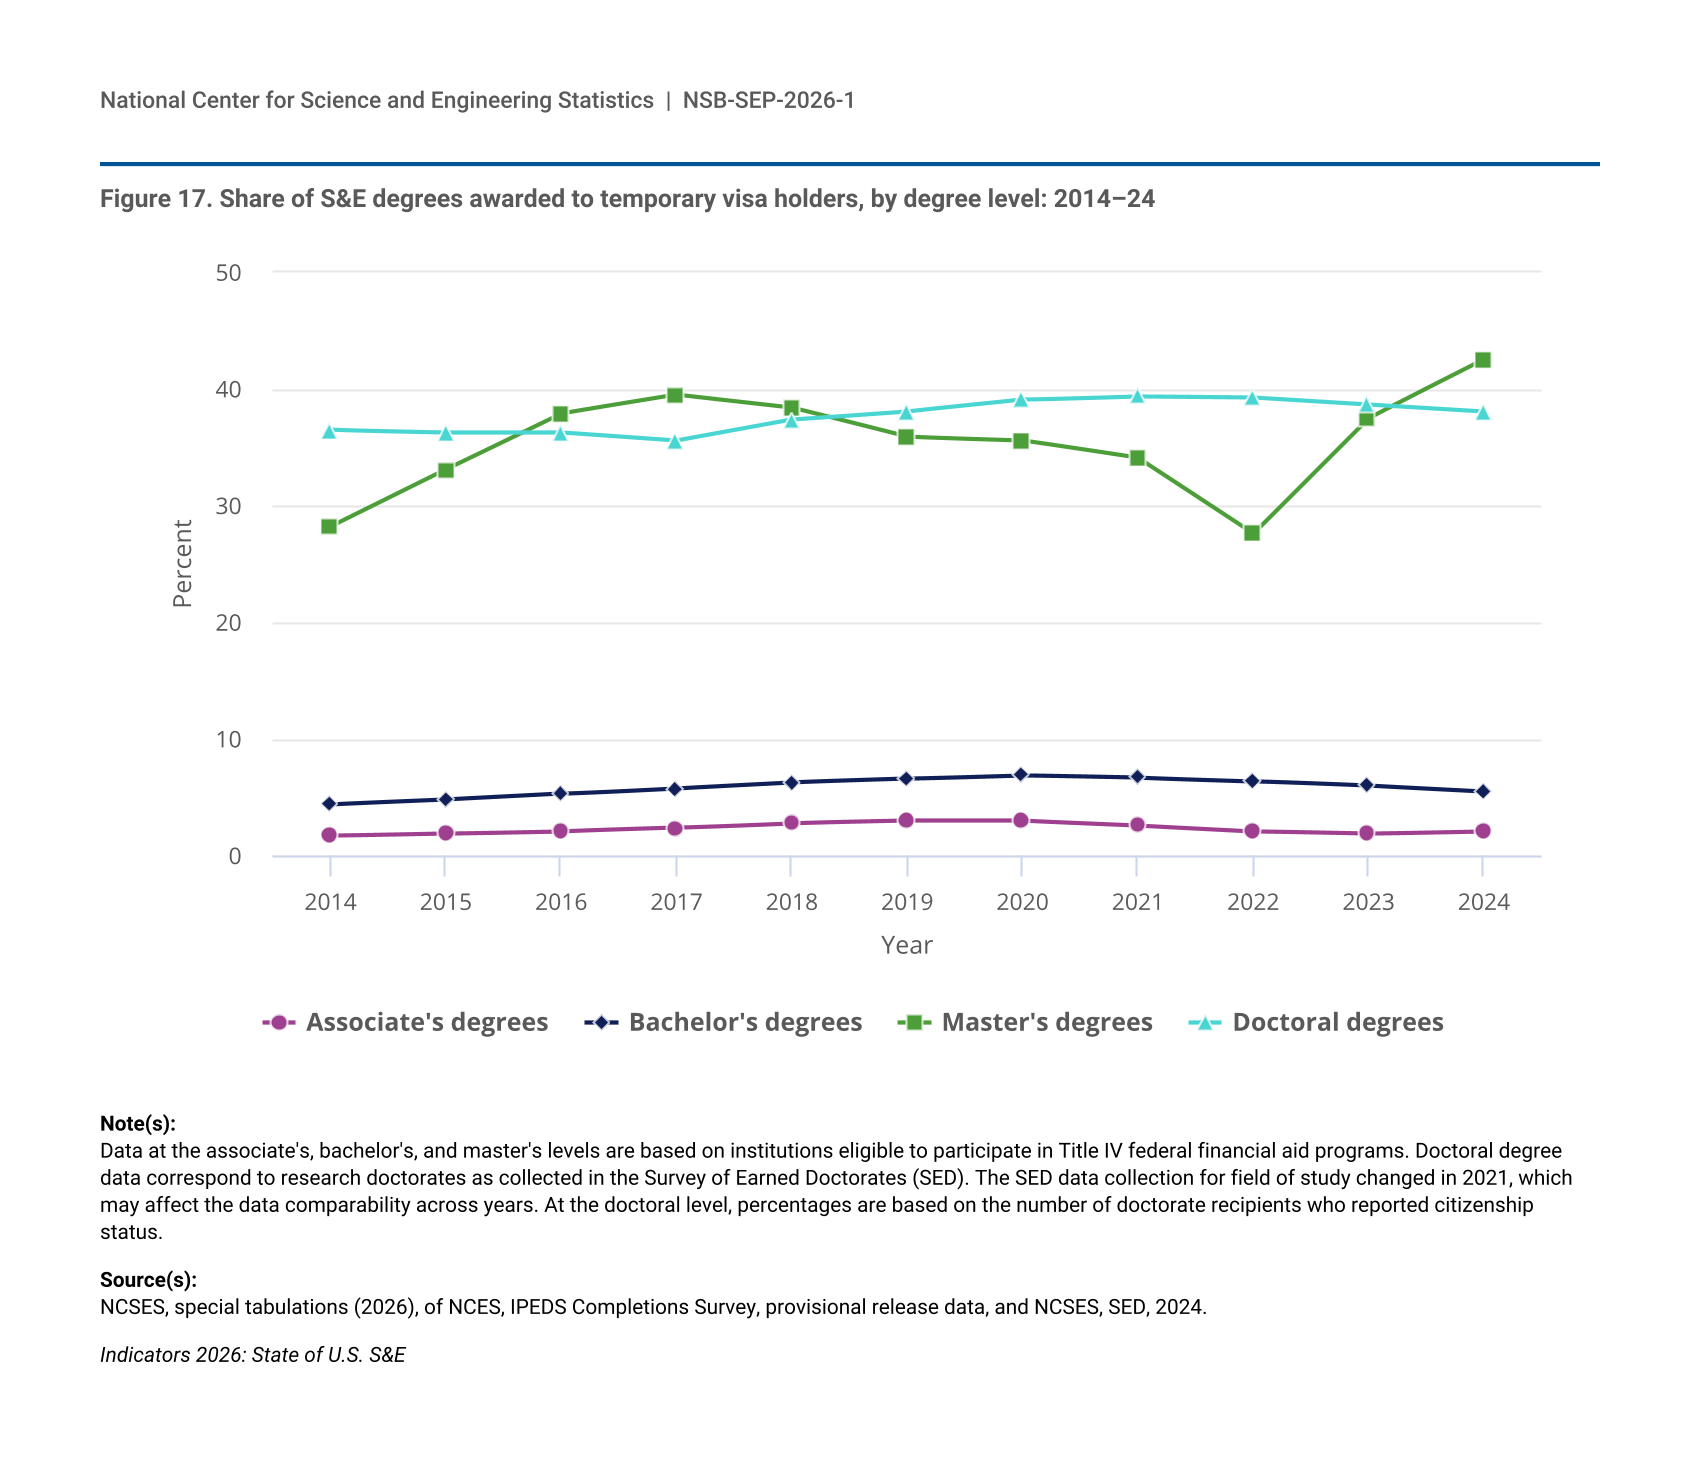
- Temporary visa holders earned 42% of S&E master’s degrees and 38% of S&E doctoral degrees awarded by U.S. higher education institutions in 2024.
- In 2024, temporary visa holders accounted for 61% of the doctoral degrees awarded by U.S. higher education institutions in computer and information sciences, 54% in engineering, and 52% in mathematics and statistics.
- Longitudinal data collected in 2023 confirm that roughly three-quarters of temporary visa holders awarded S&E doctorates remained in the United States 5 years after graduation and about two-thirds remained after 10 years.
STEM Workforce
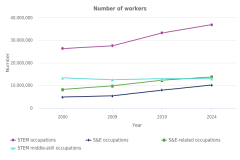
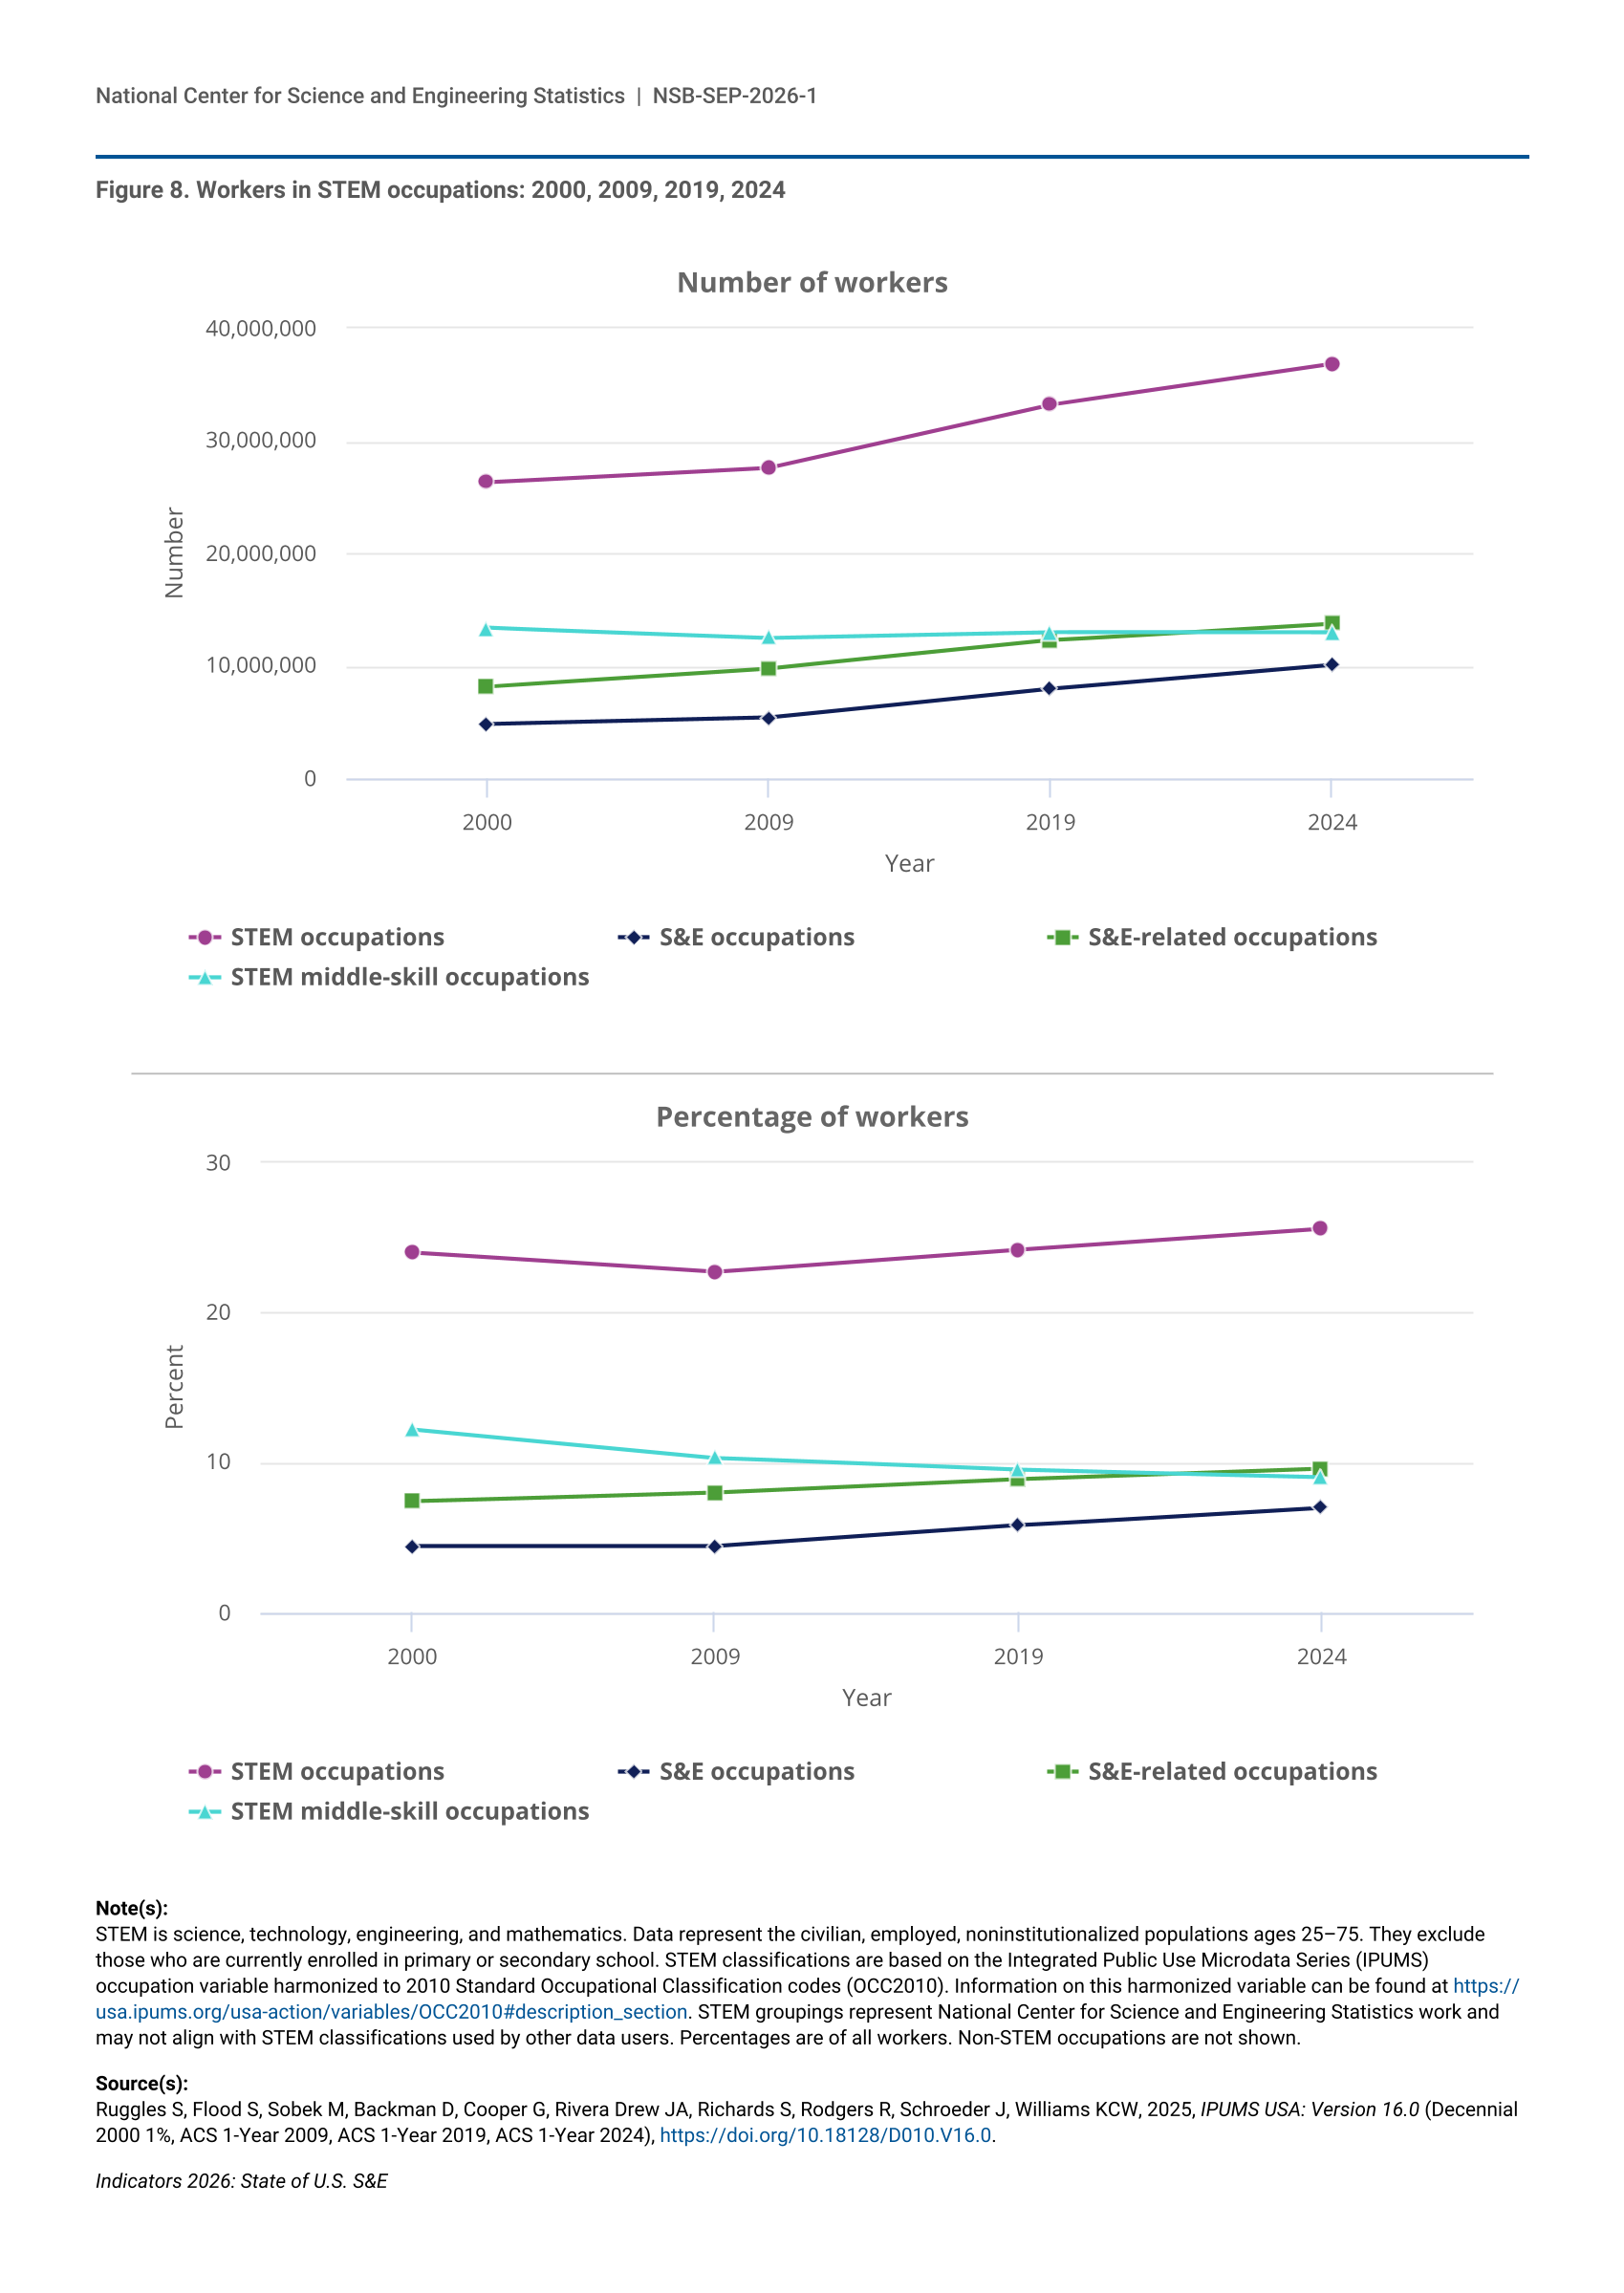
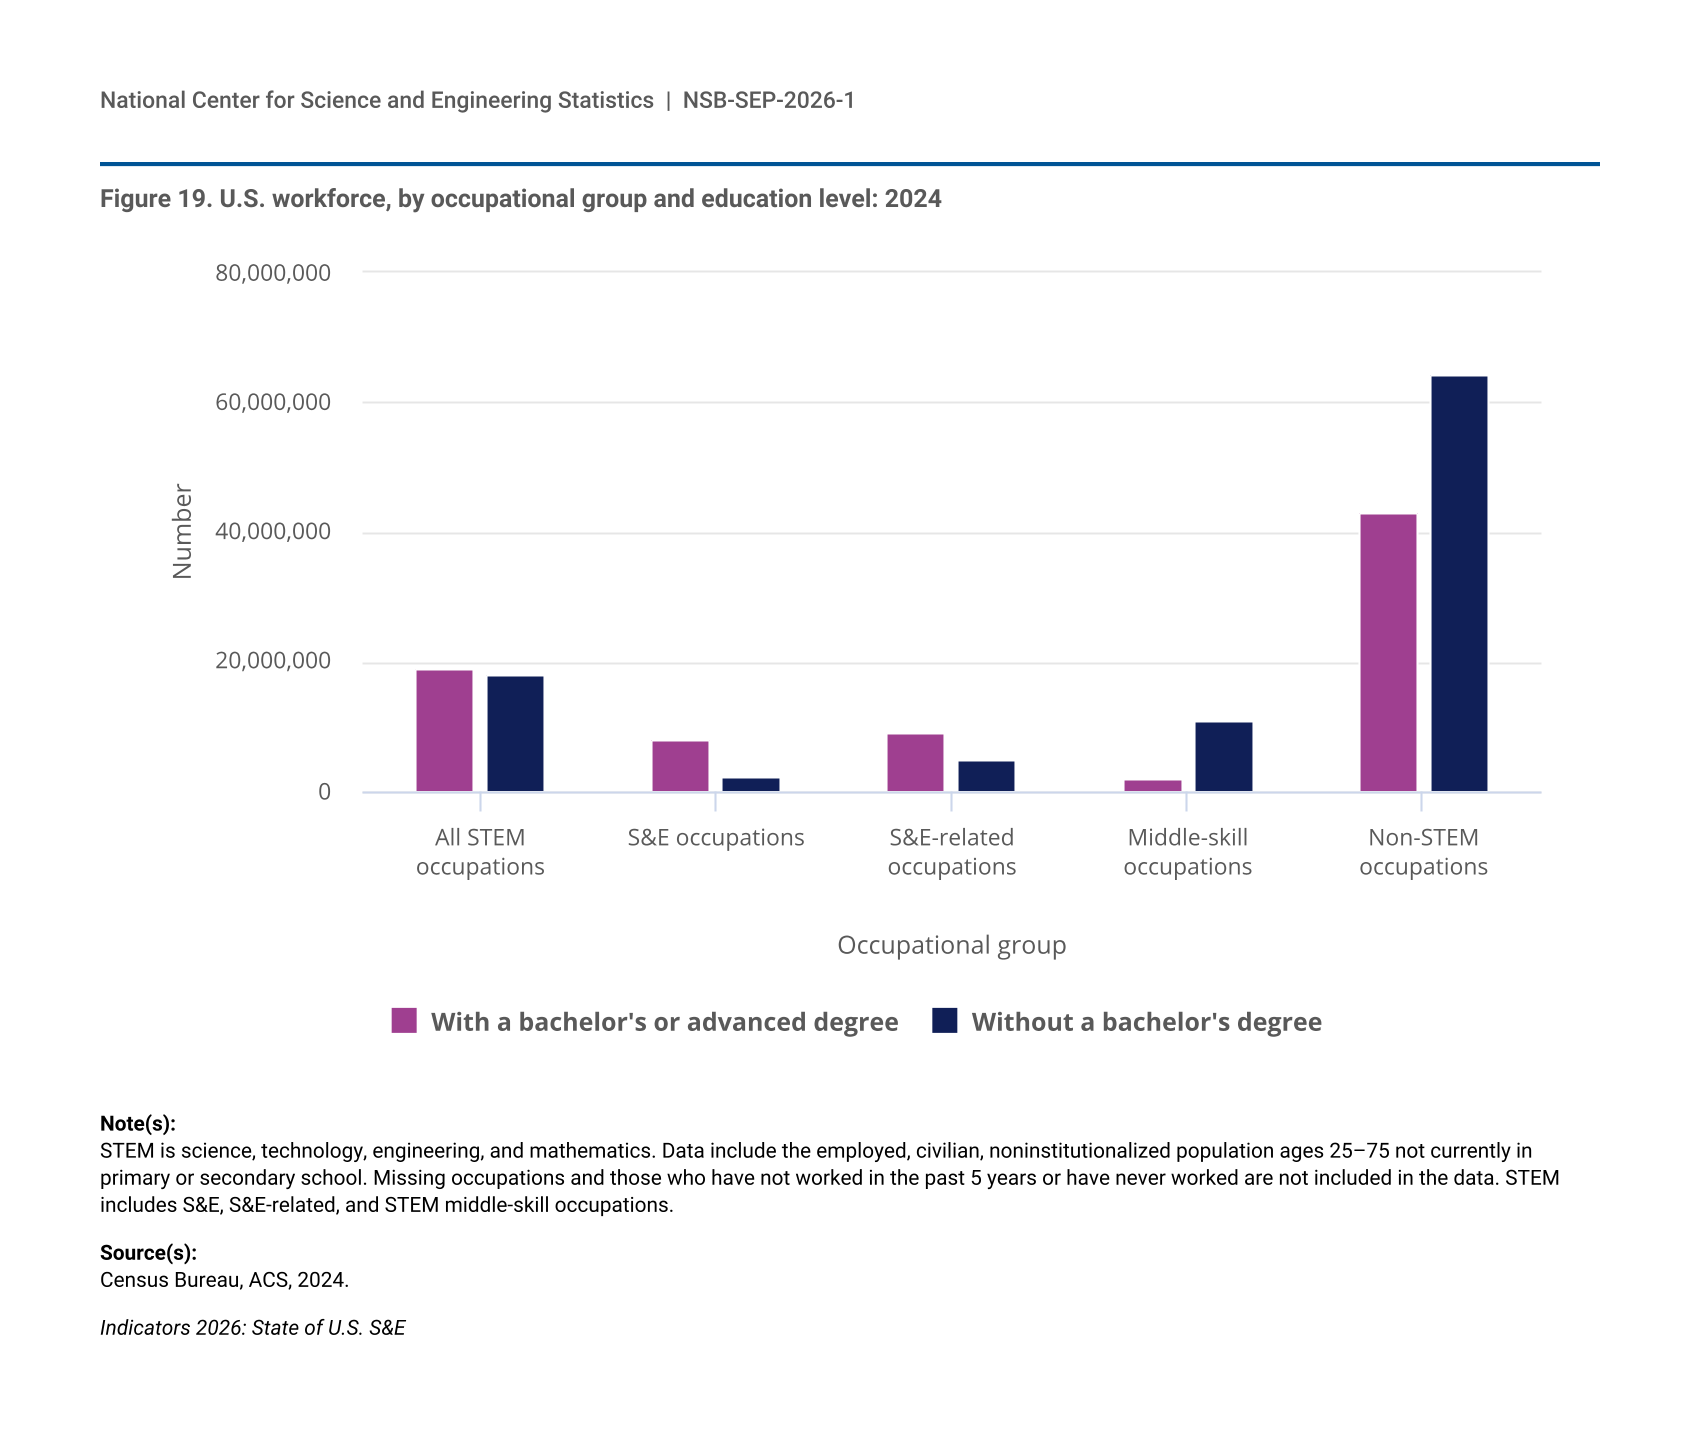
- The U.S. STEM workforce included 37 million workers in 2024, 26% of the total U.S. workforce.
- The STEM workforce grew at a faster rate than the non-STEM workforce from 2014 to 2024. In 2024, STEM workers experienced lower unemployment rates and higher median annual earnings ($80,000) than their non-STEM counterparts ($60,000).
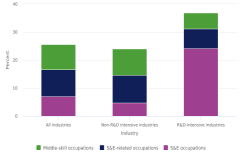
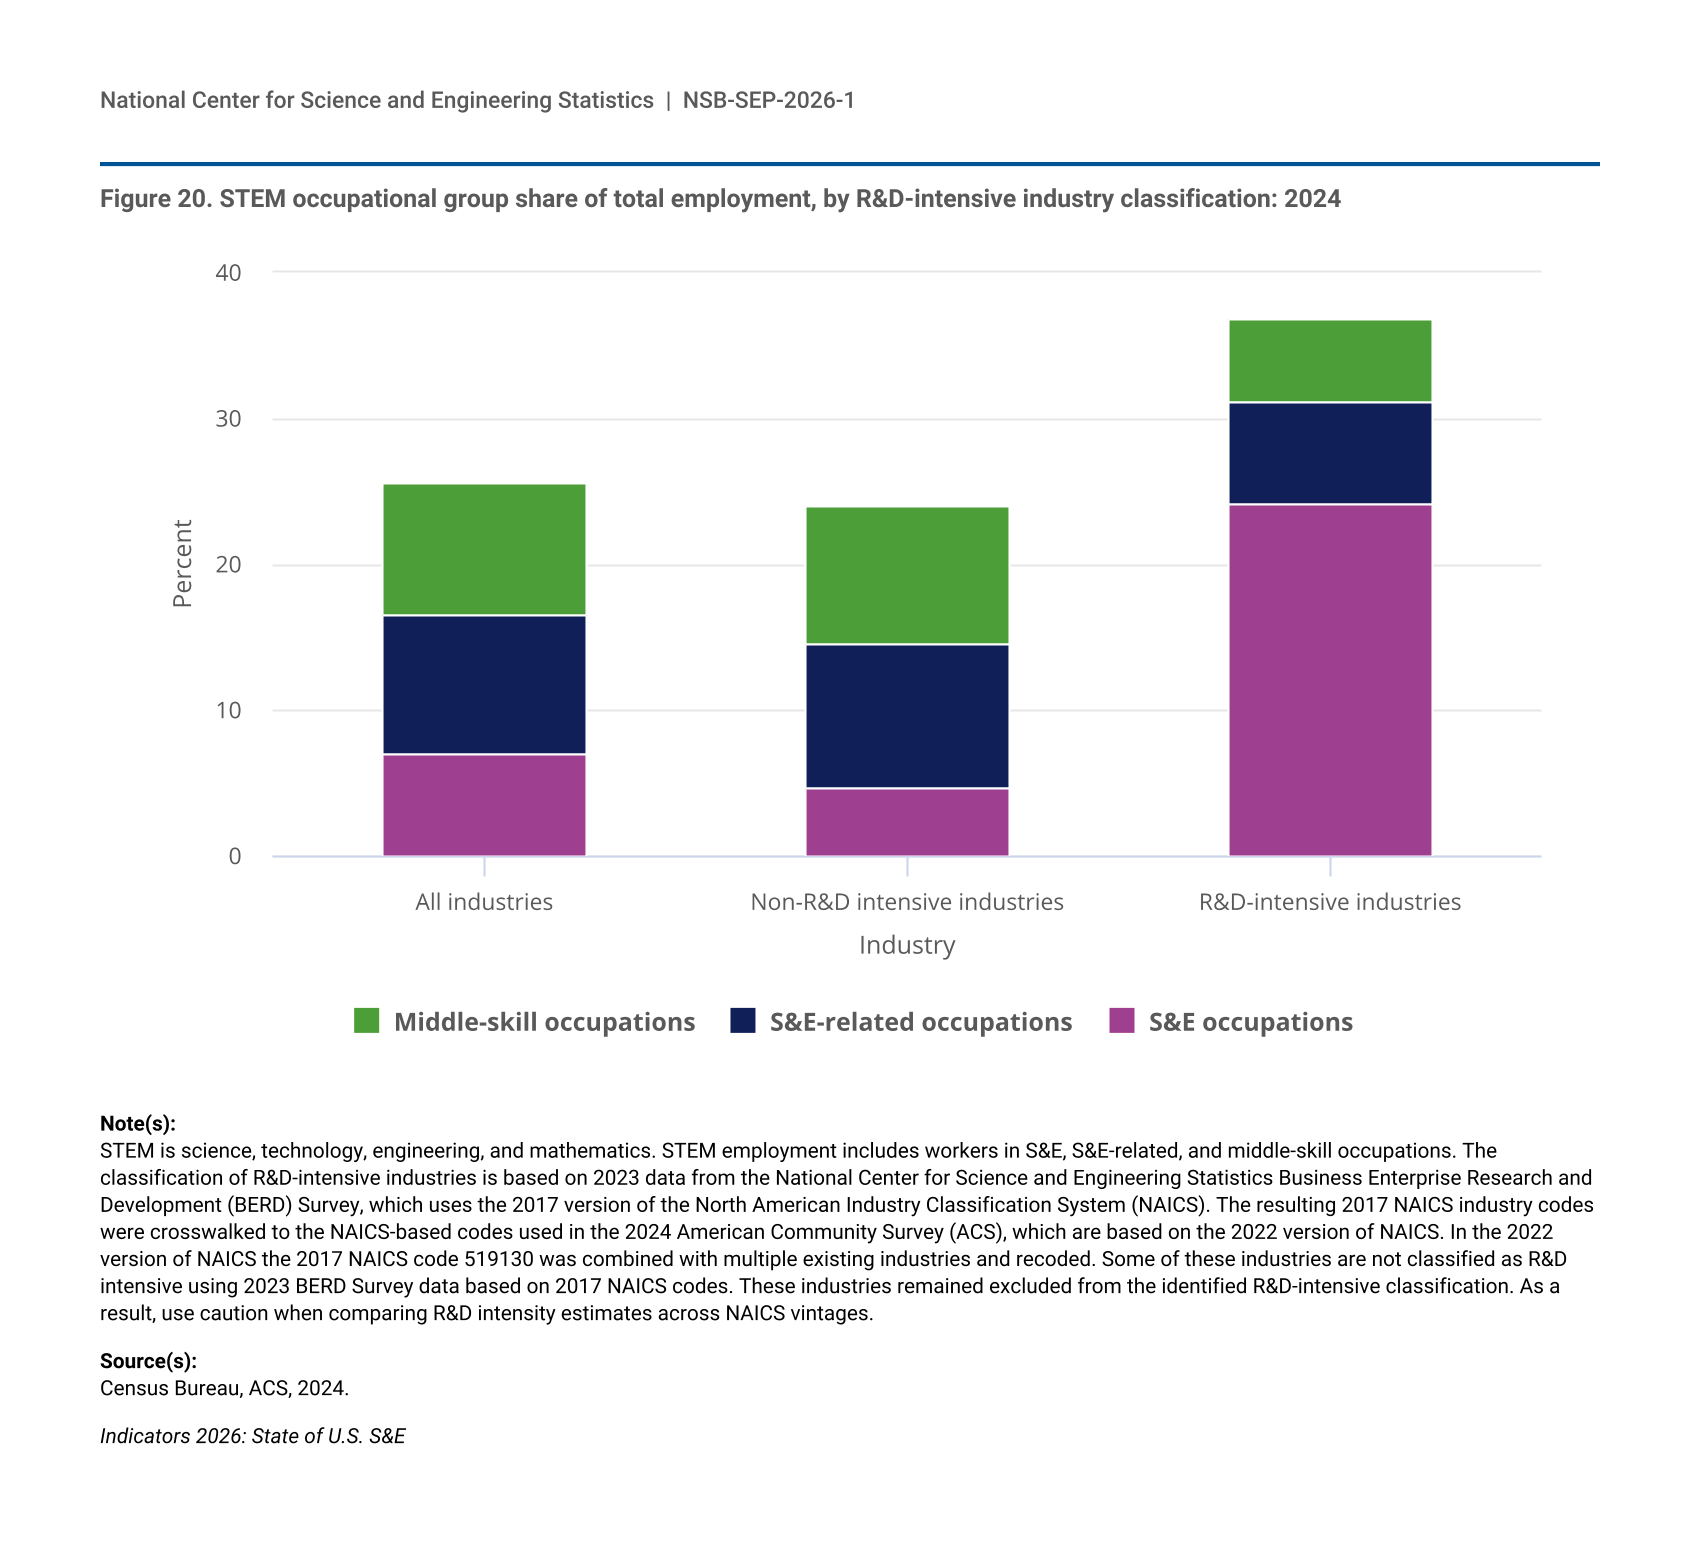
- STEM workers accounted for 37% of employment in R&D-intensive industries in 2024, compared with 26% in all industries.
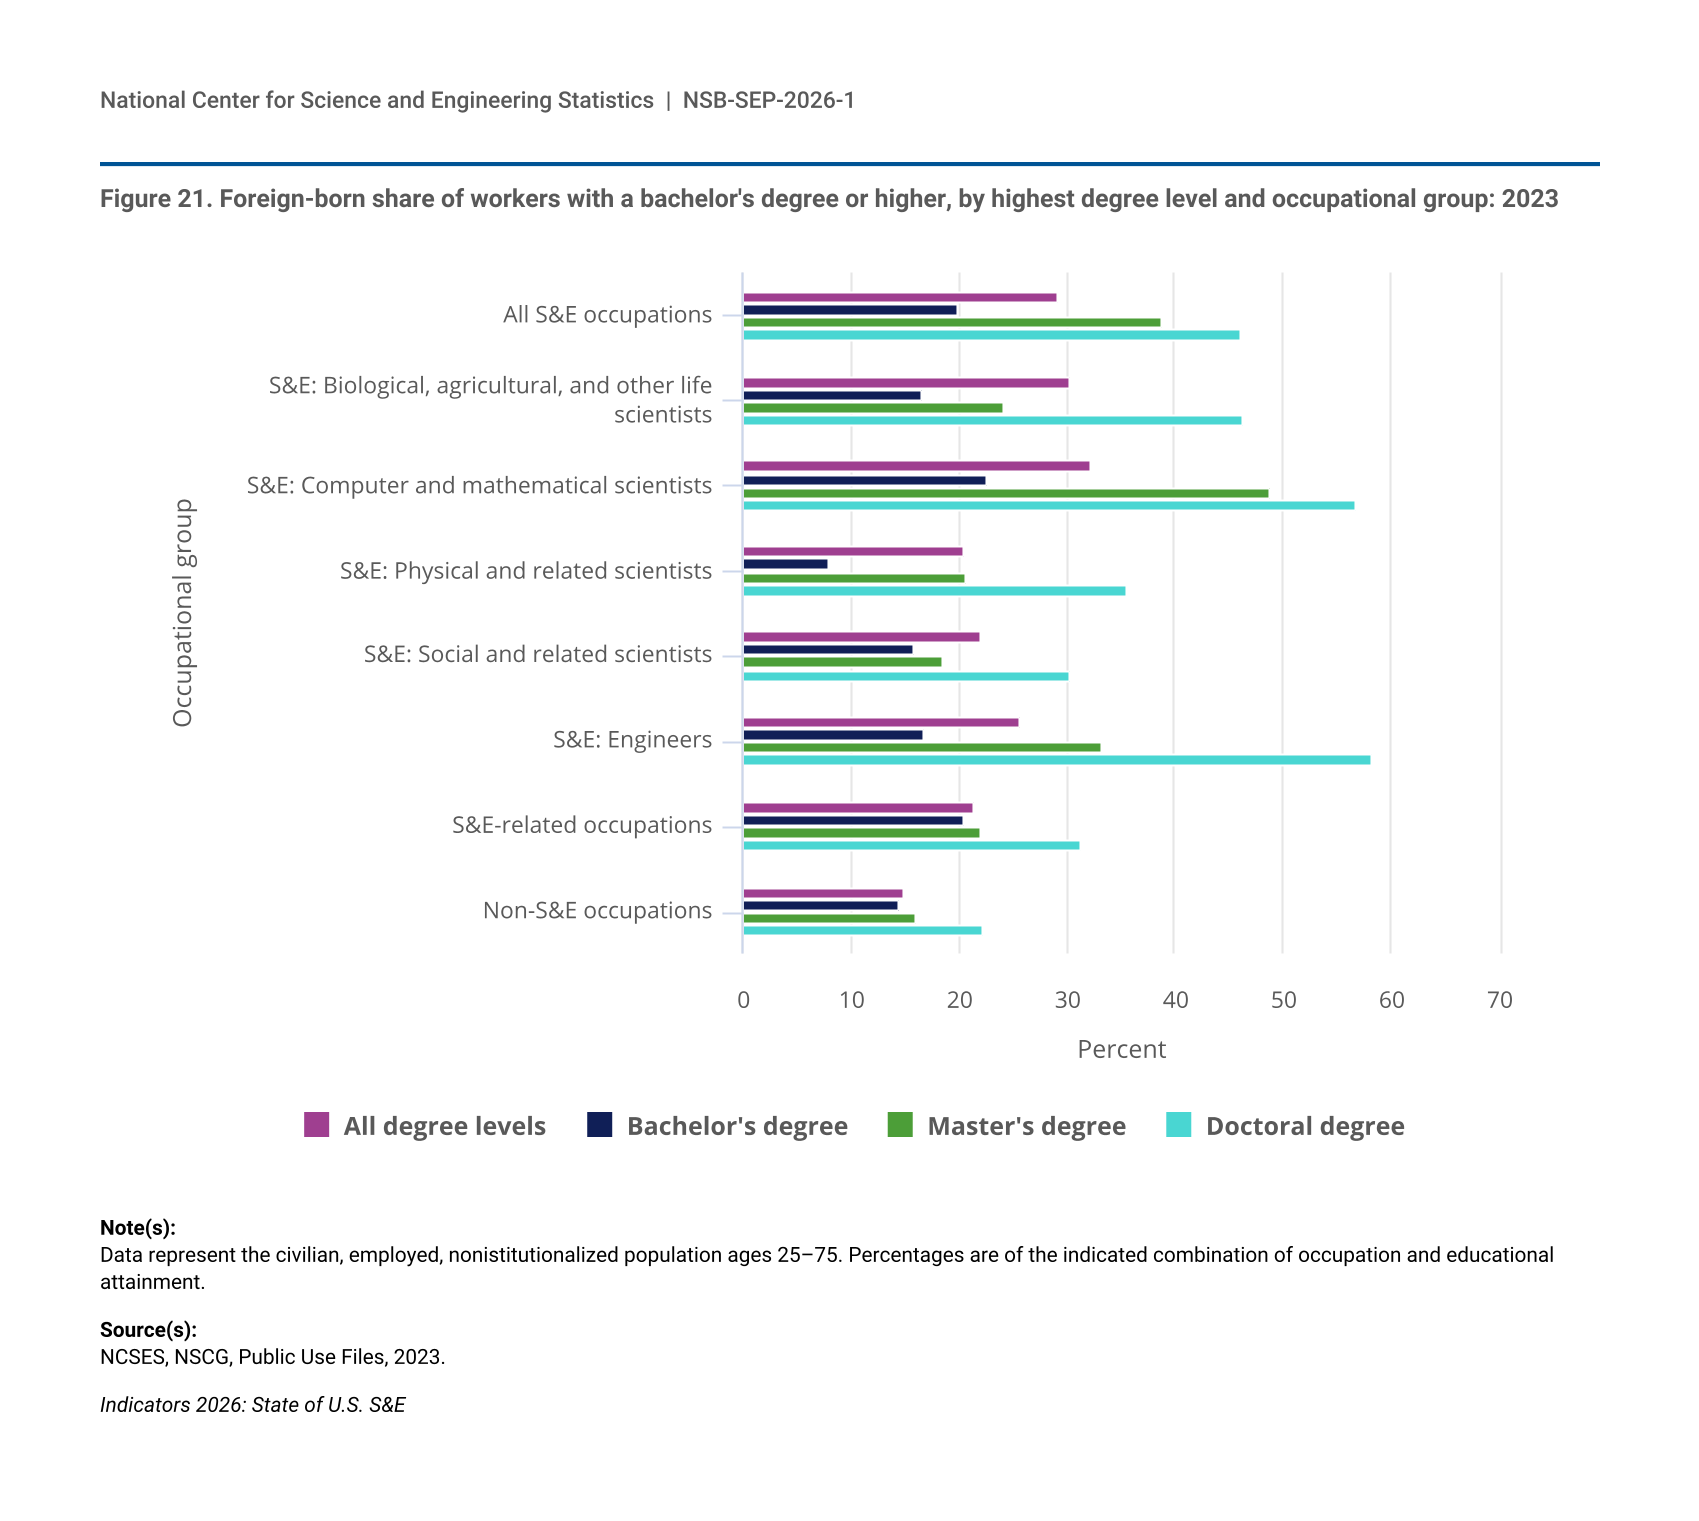
- In 2023, 46% of U.S. S&E workers with doctoral degrees were born abroad.
- Combined, over three-quarters of foreign-born S&E workers in the United States in 2023 were naturalized citizens (55%) or permanent residents (21%); temporary visa holders accounted for 24%.
Discovery: R&D Activity and Research Publications
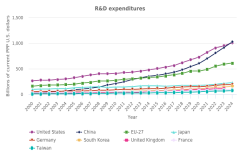
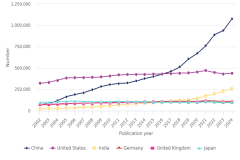
The United States and China dominate global R&D, with U.S. R&D concentrated in business-led innovation. China is estimated to have surpassed the United States as the largest performer of R&D globally. China has the highest research publication volume globally, but U.S. researchers continue to generate a high share of highly cited articles (HCAs) across scientific fields.
R&D Activity
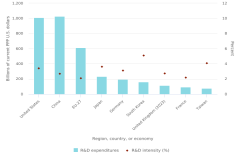
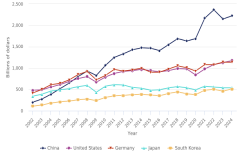
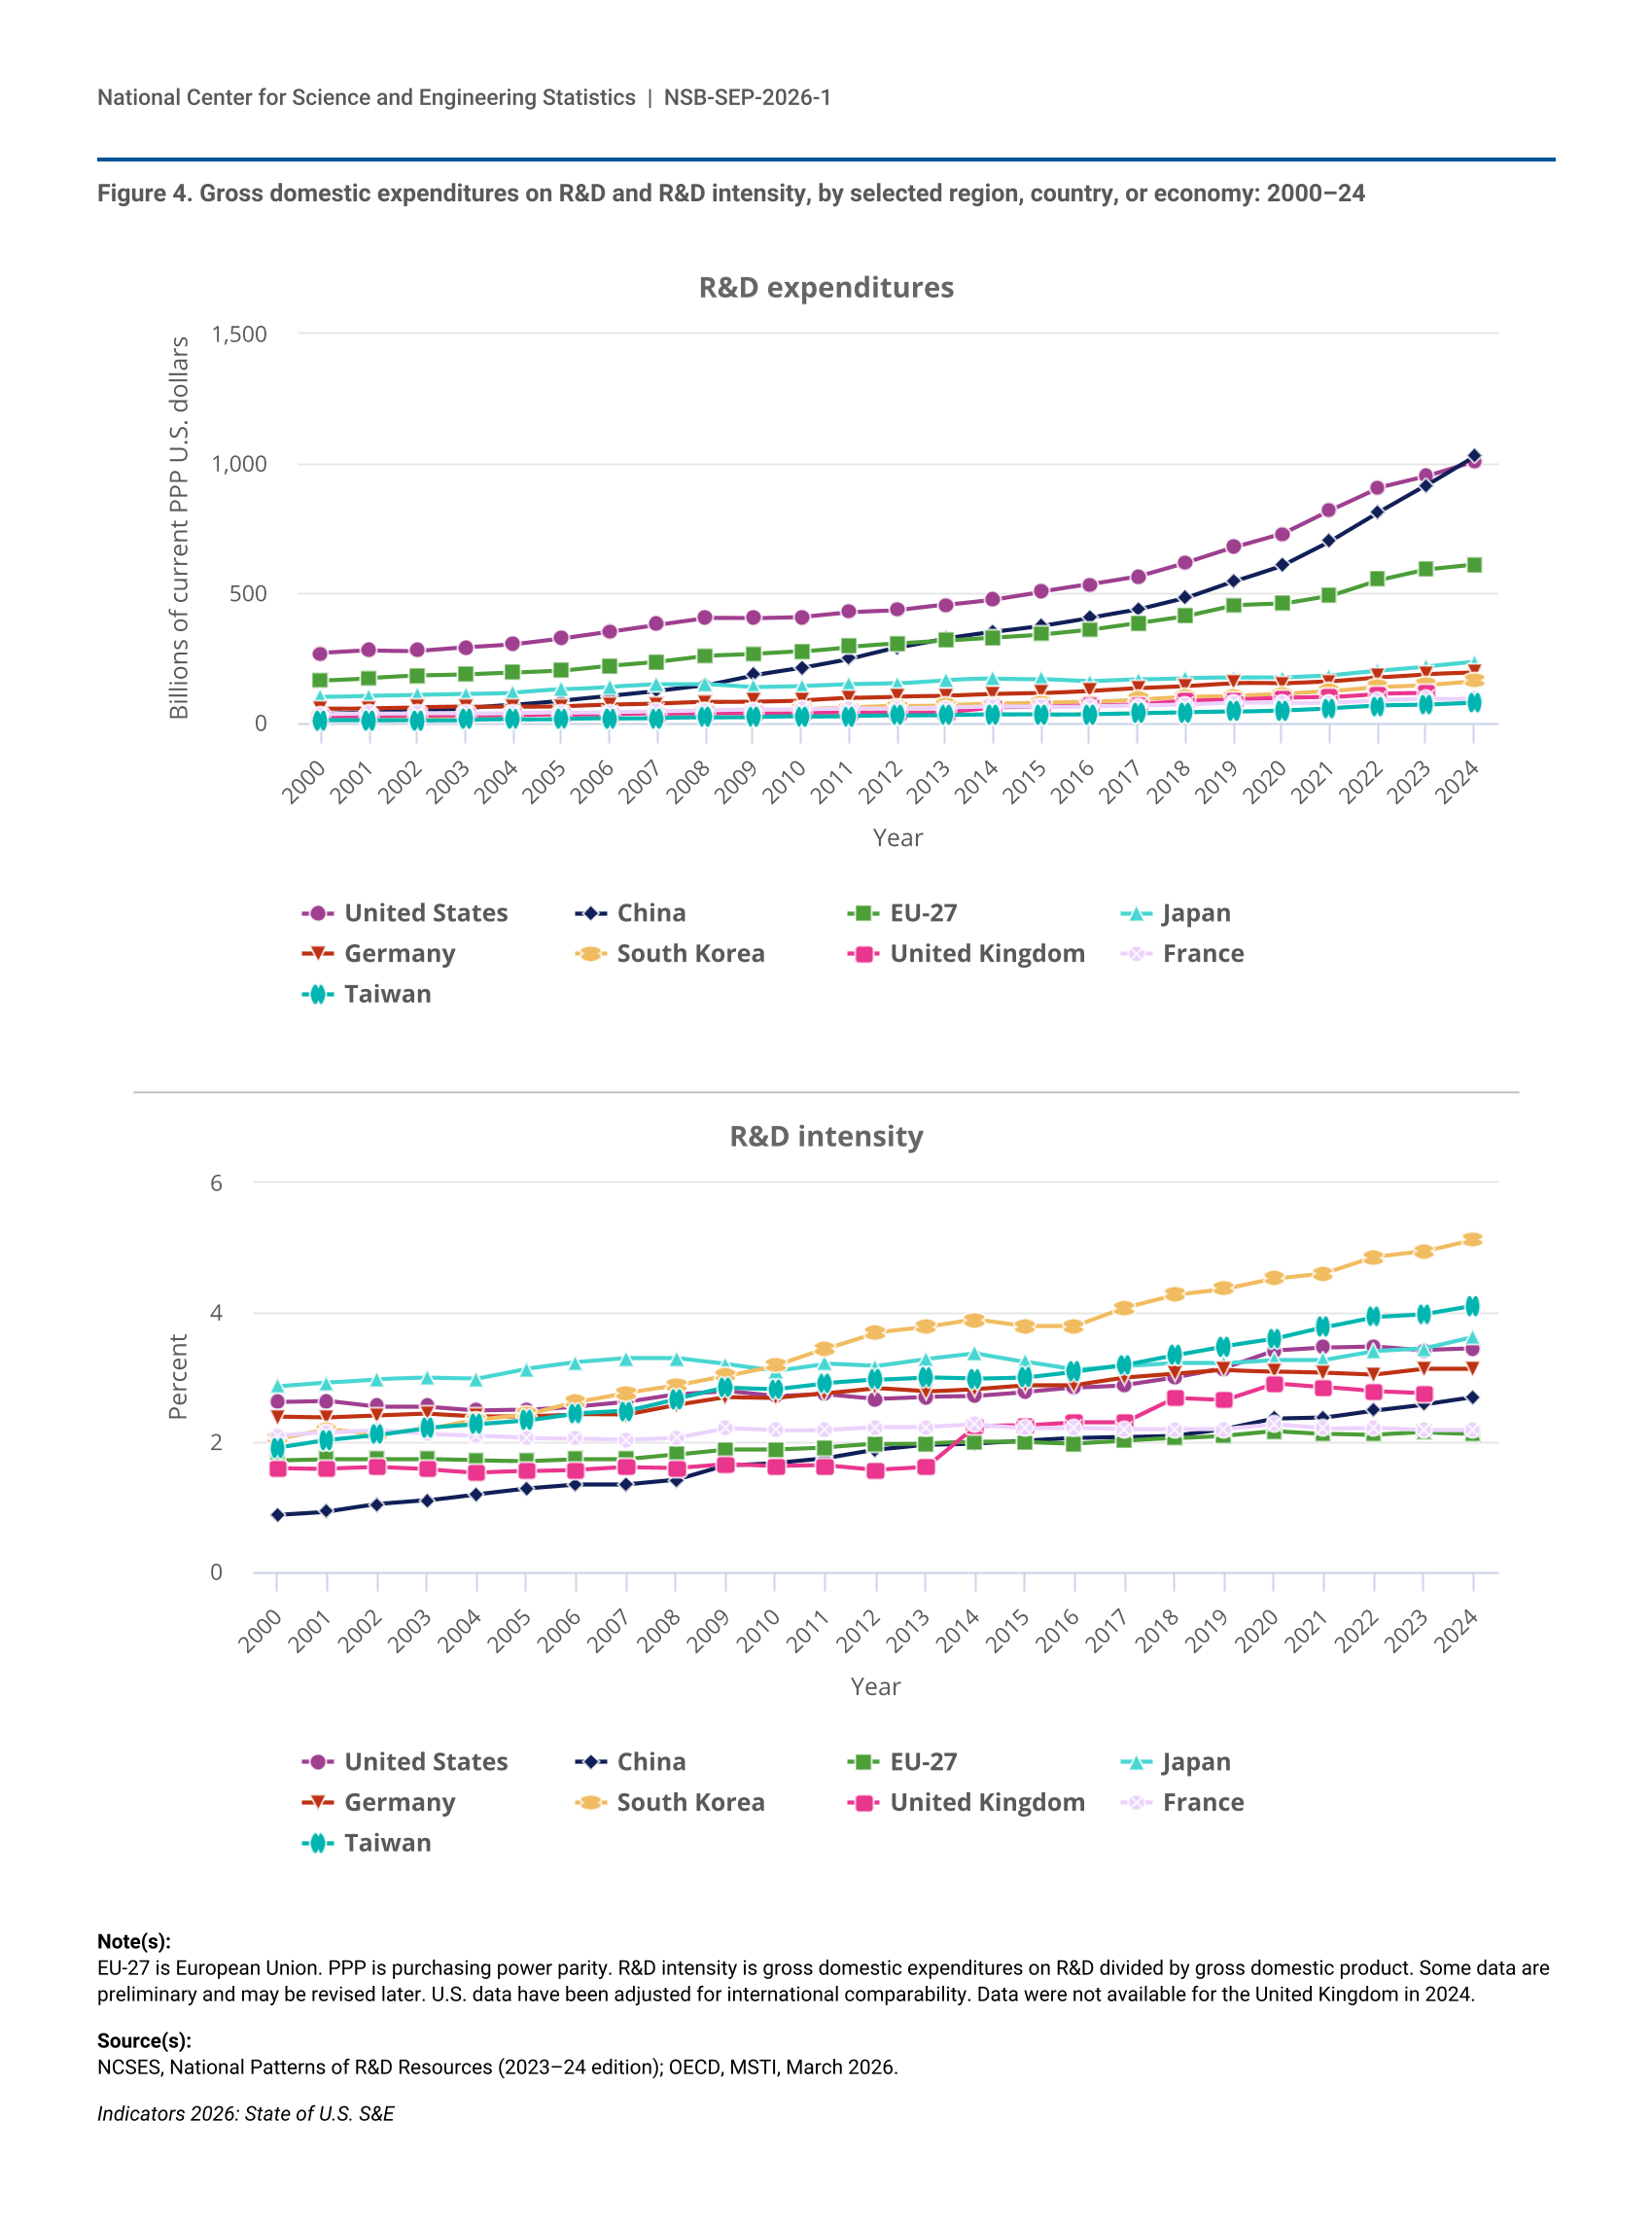
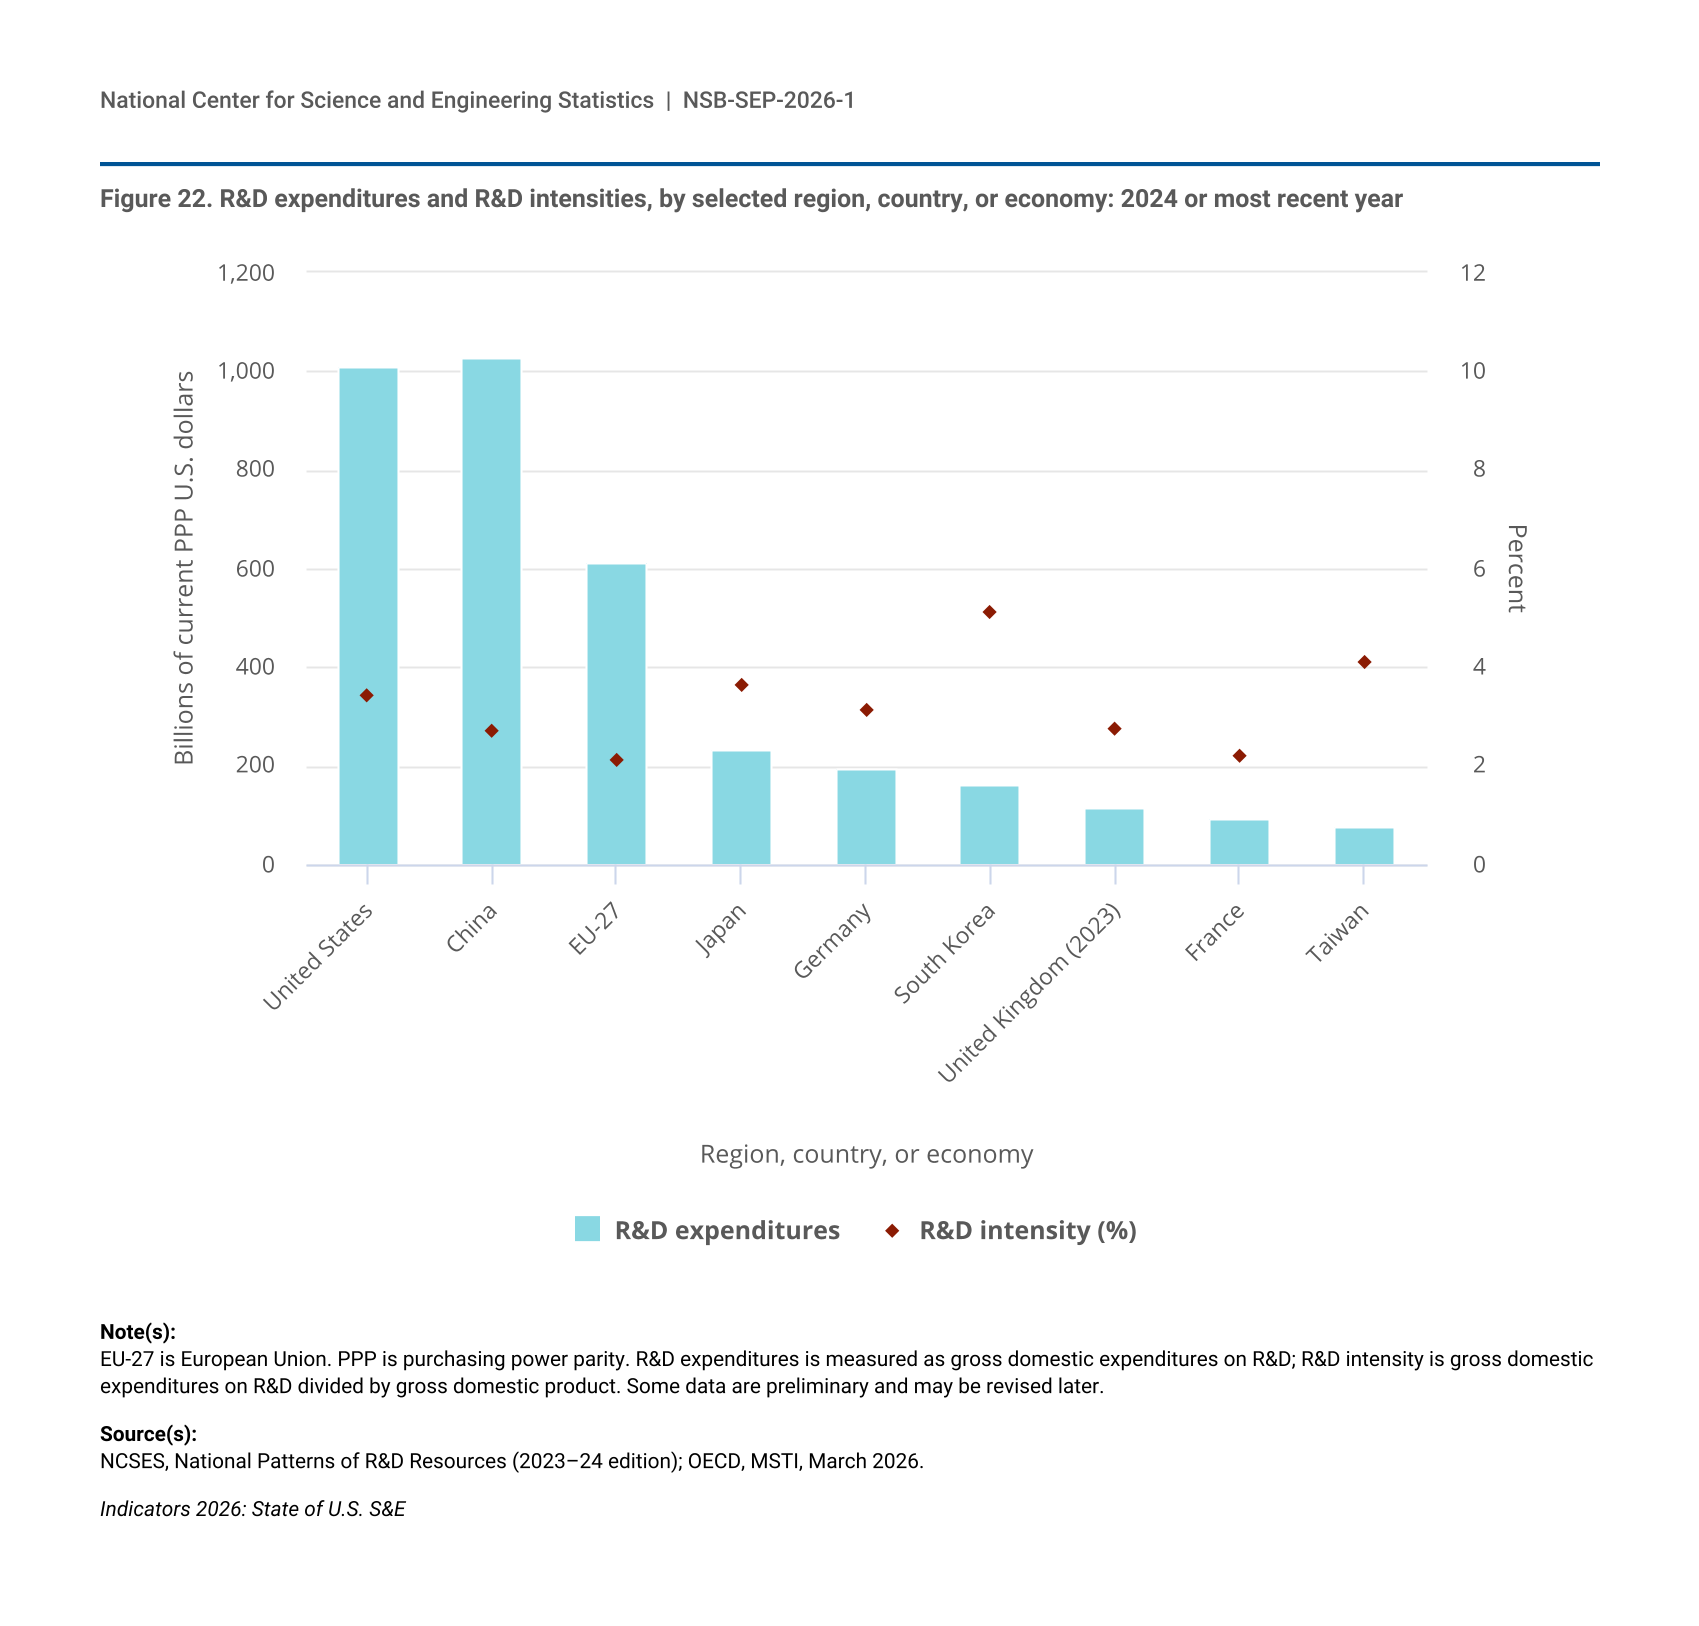
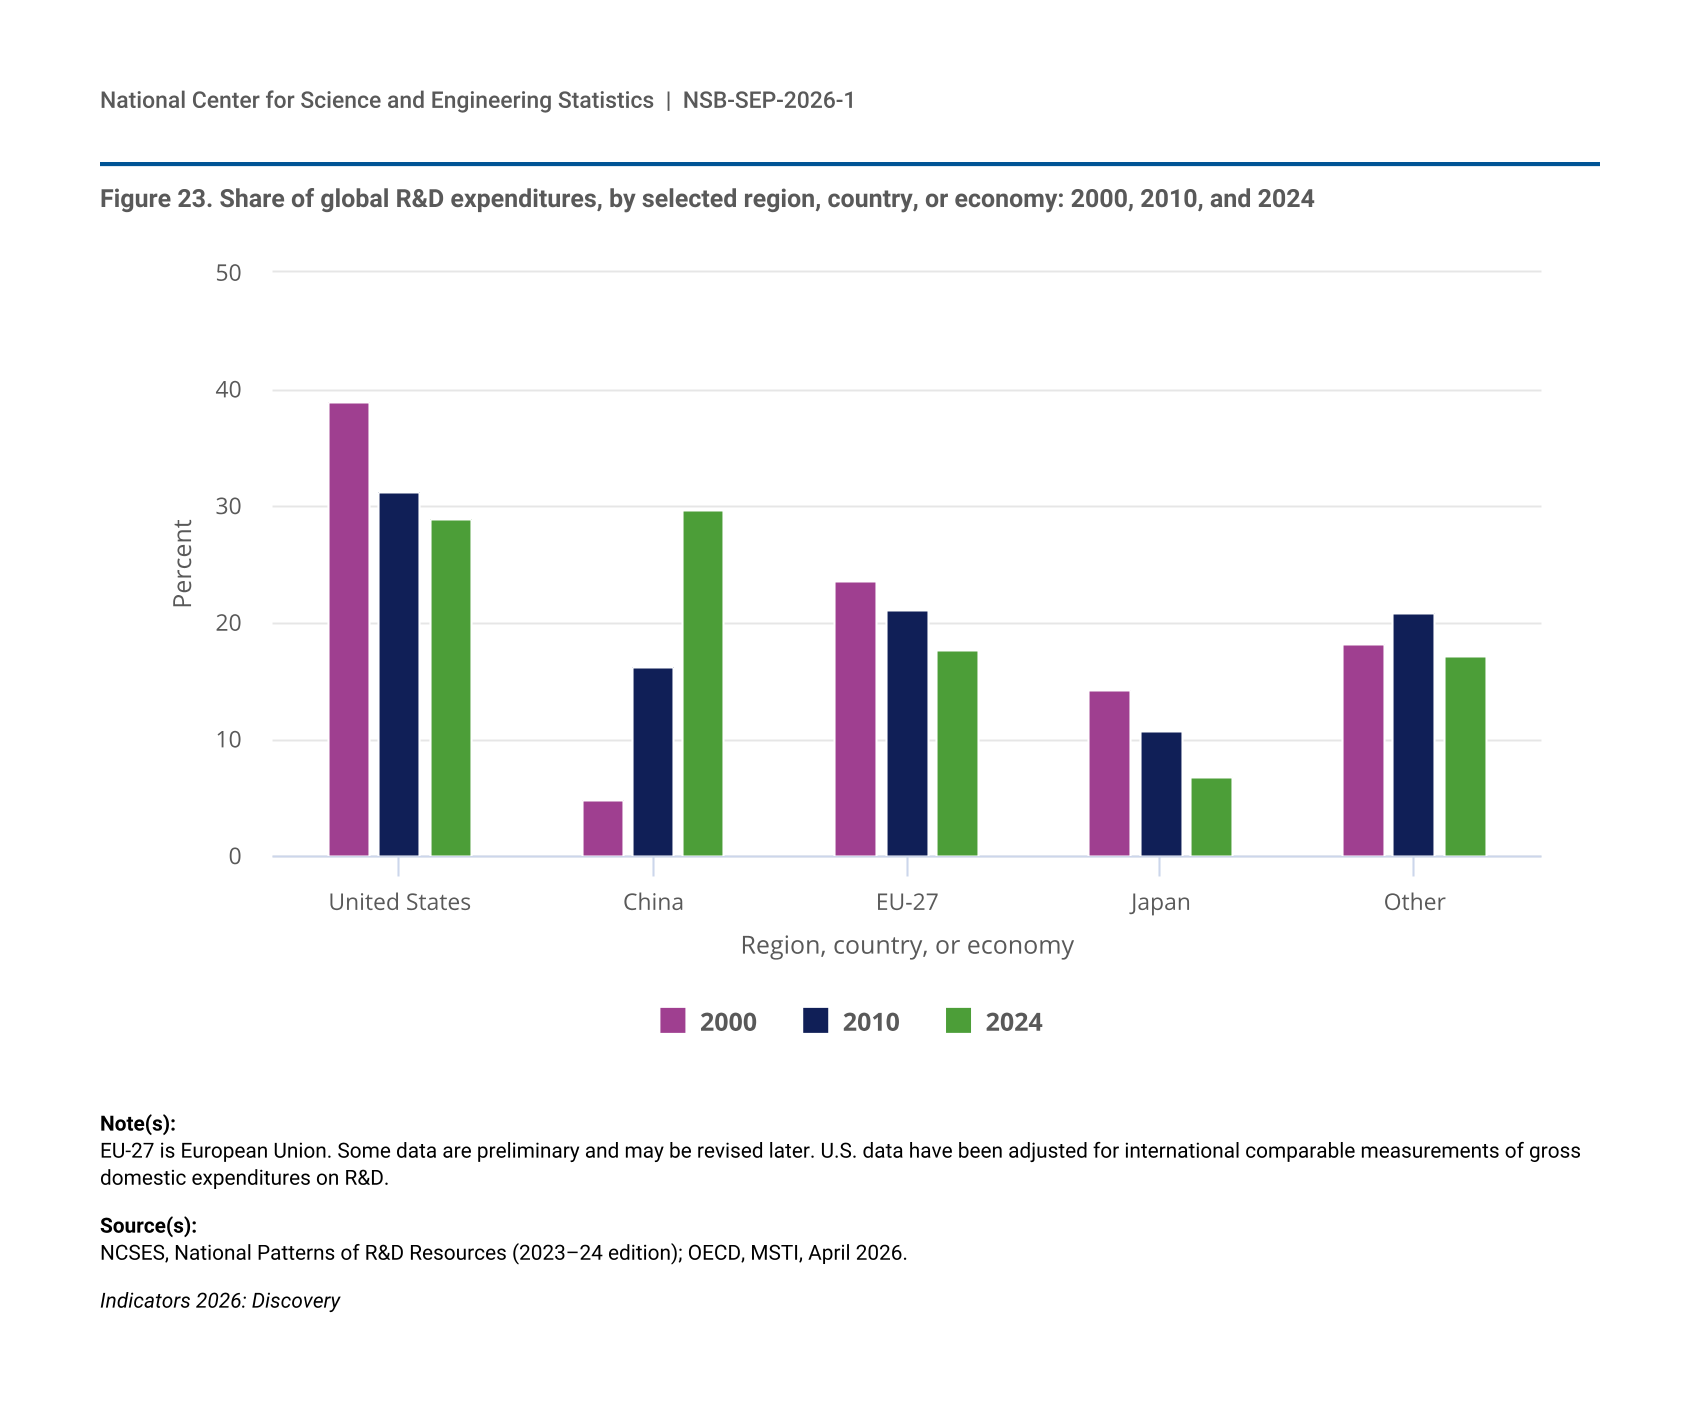
- In 2024, China is estimated to have surpassed the United States as the largest performer of R&D globally, with $1.028 trillion in gross domestic expenditures on R&D in 2024 when adjusted for international comparability, followed by the United States with $1.009 trillion. Together, China (30%) and the United States (29%) accounted for over half of global R&D performance.
- The United States is among the world’s most R&D-intensive economies, with R&D expenditures equaling 3.4% of its gross domestic product (GDP) in 2024. China’s R&D intensity (2.7%) is higher than the average across the European Union (EU-27, 2.1%).
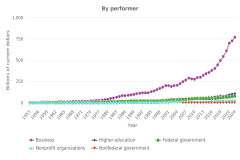
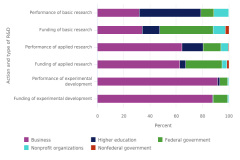
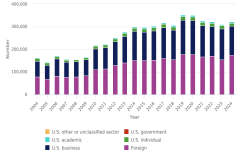
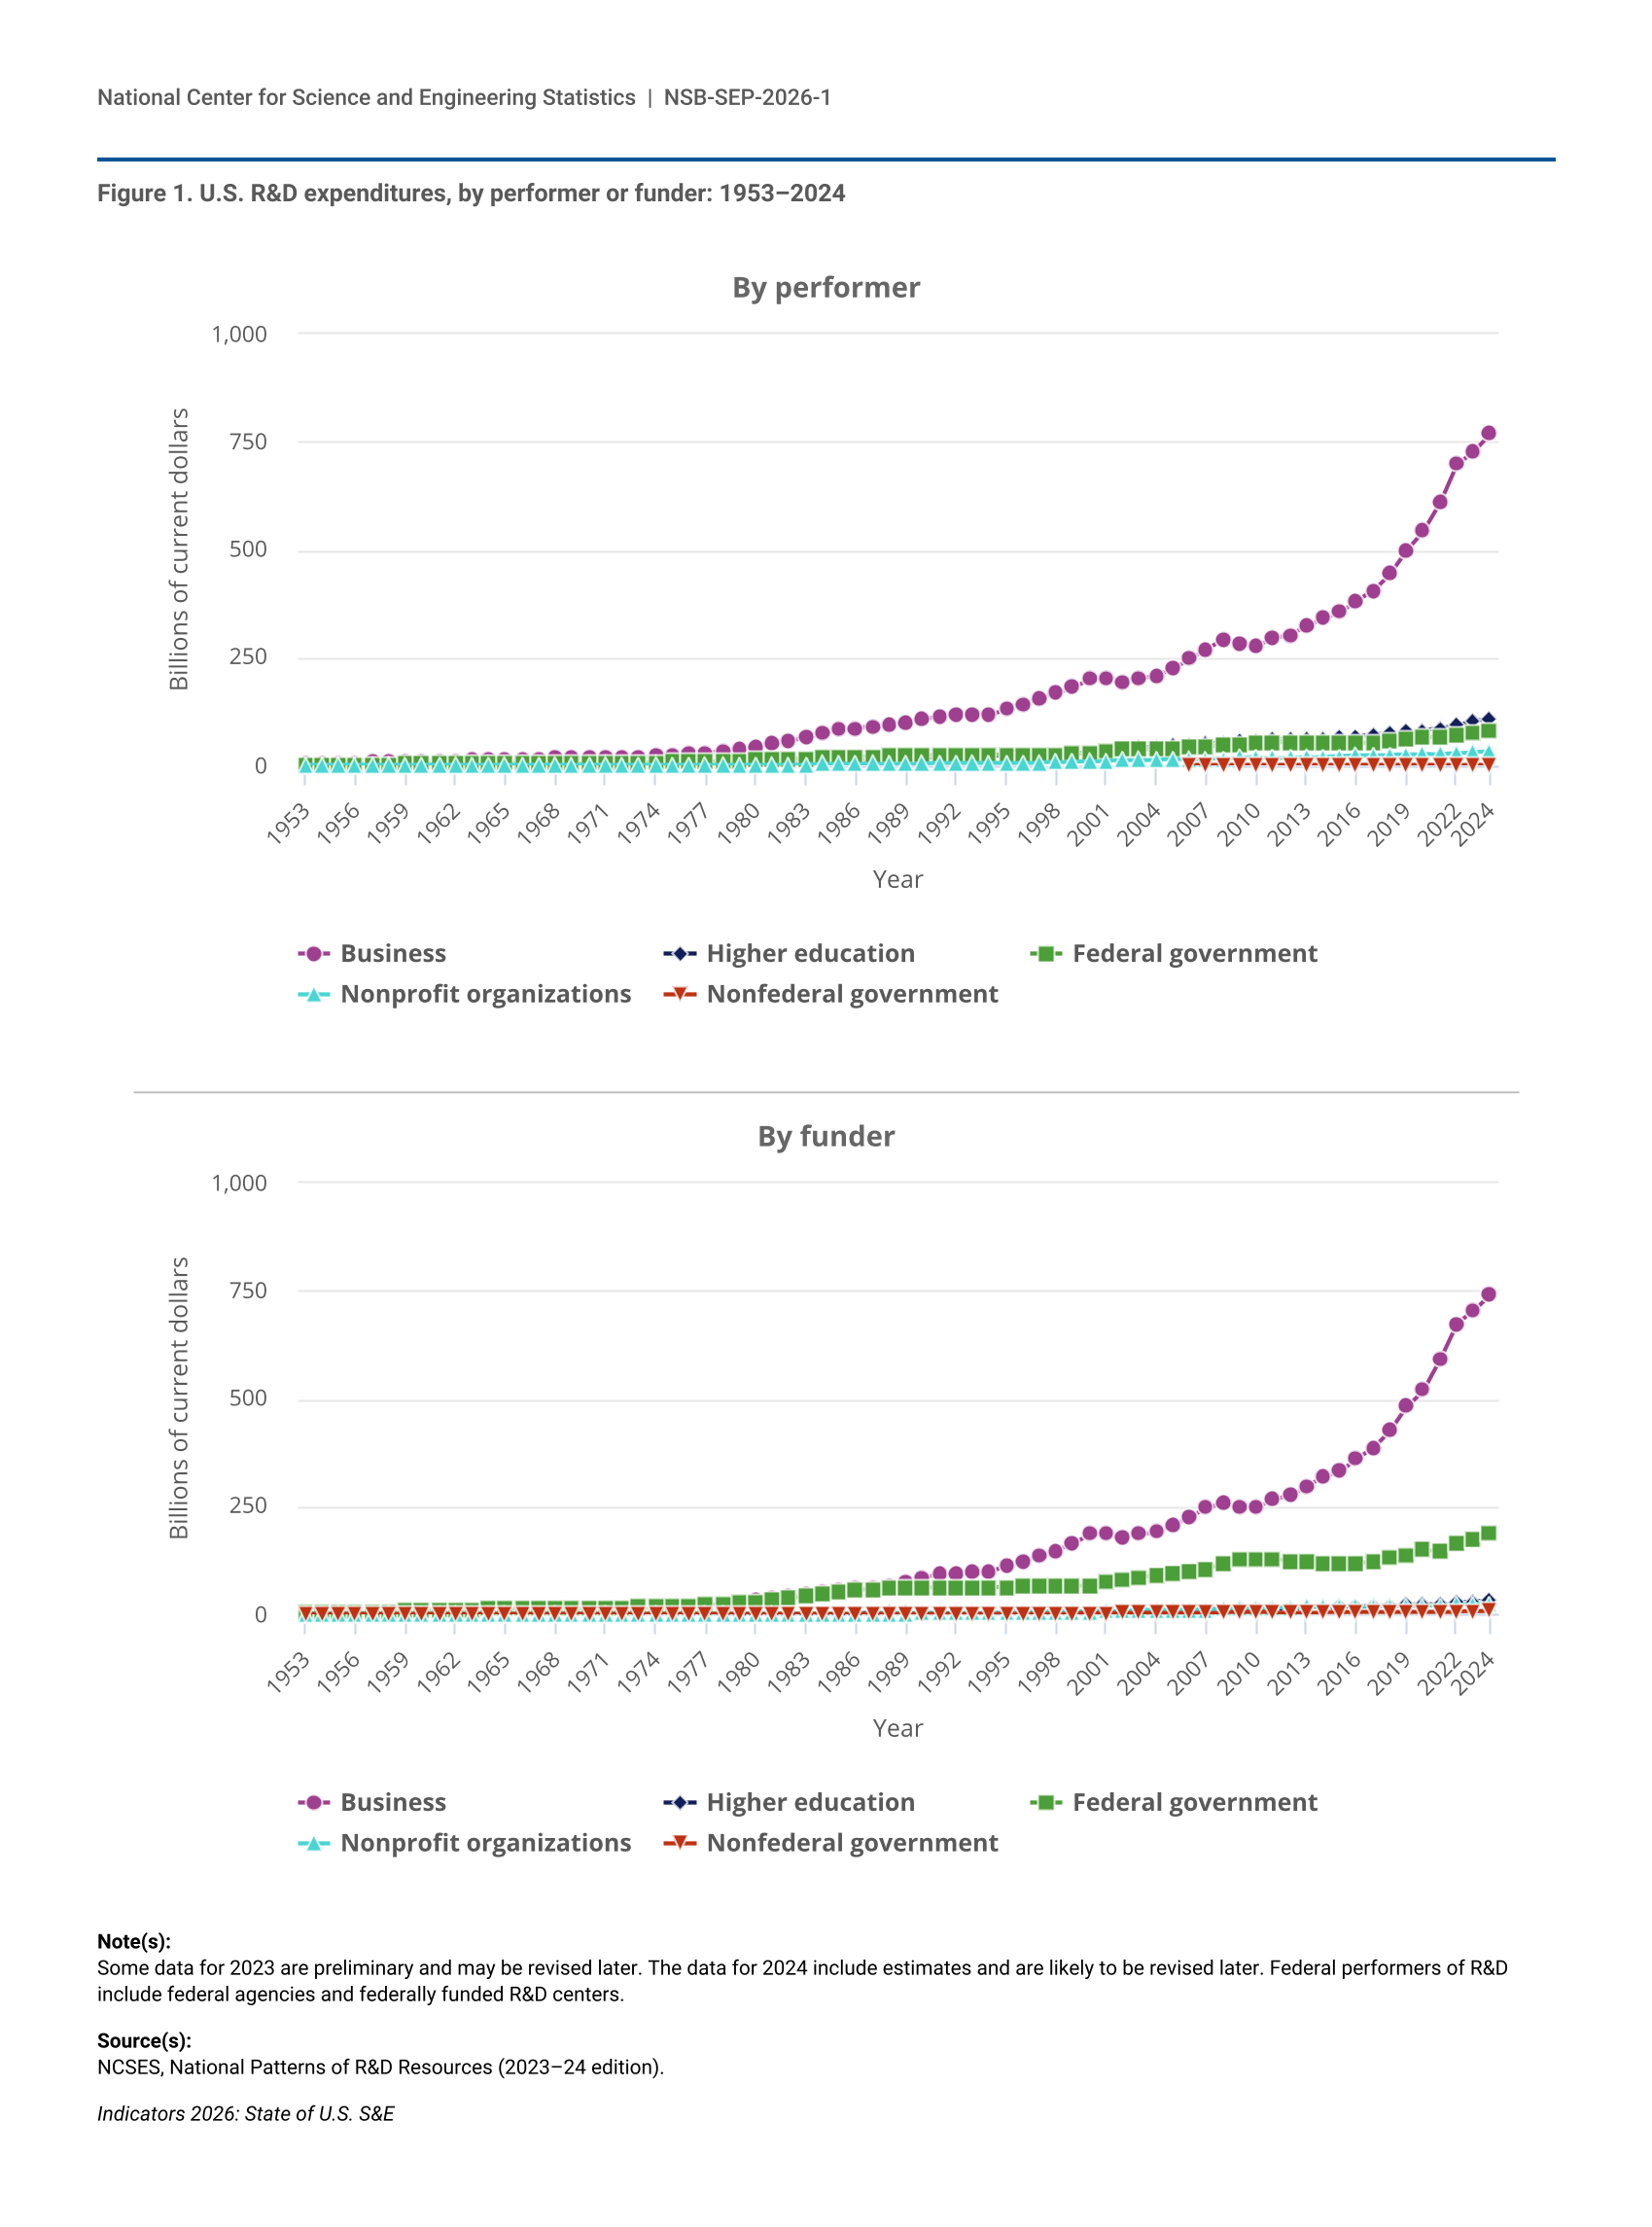
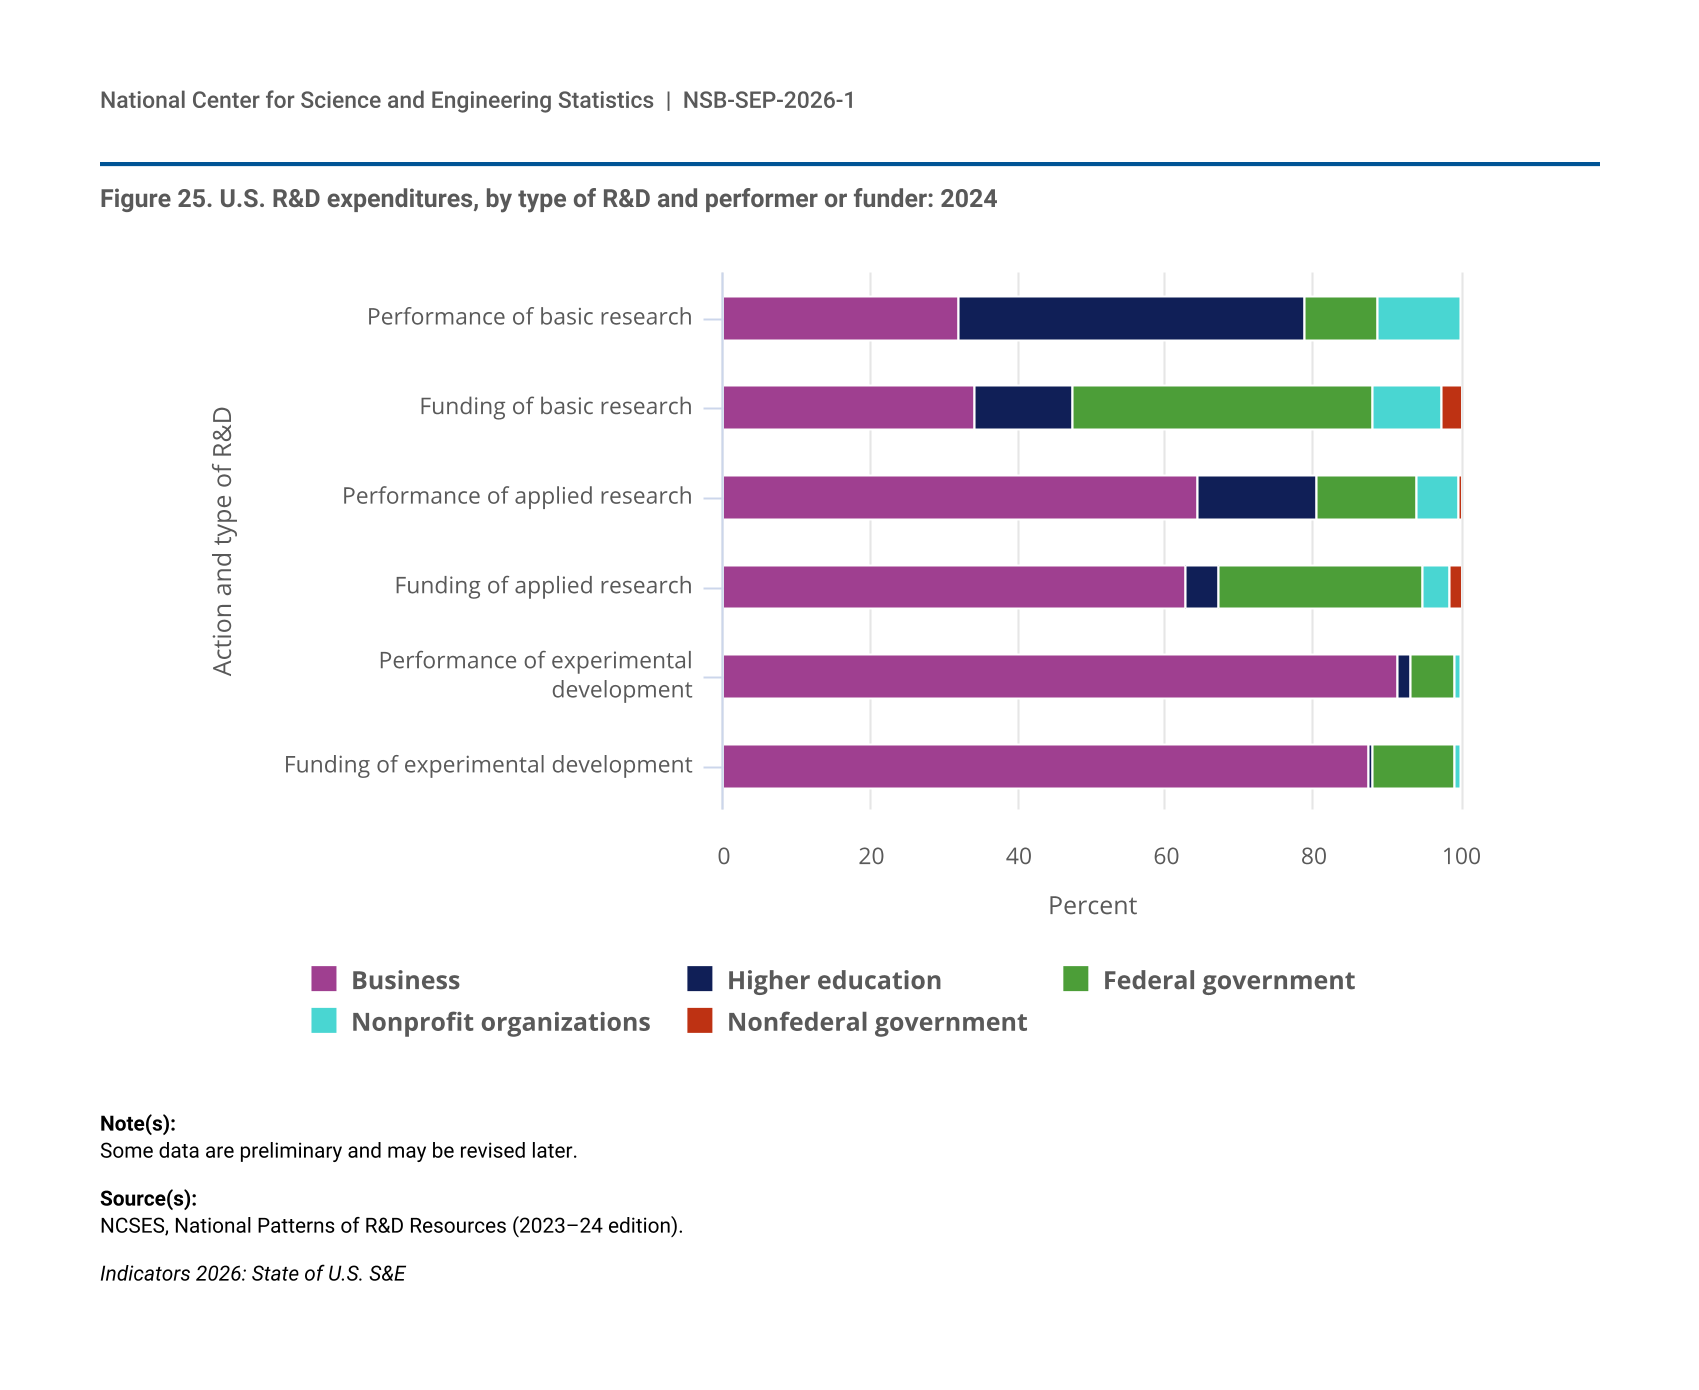
- The business sector is the largest performer and funder of R&D in the United States, performing 77% and funding 75% of the nation’s total R&D in 2024.
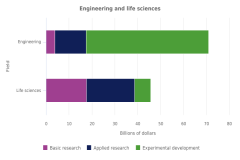
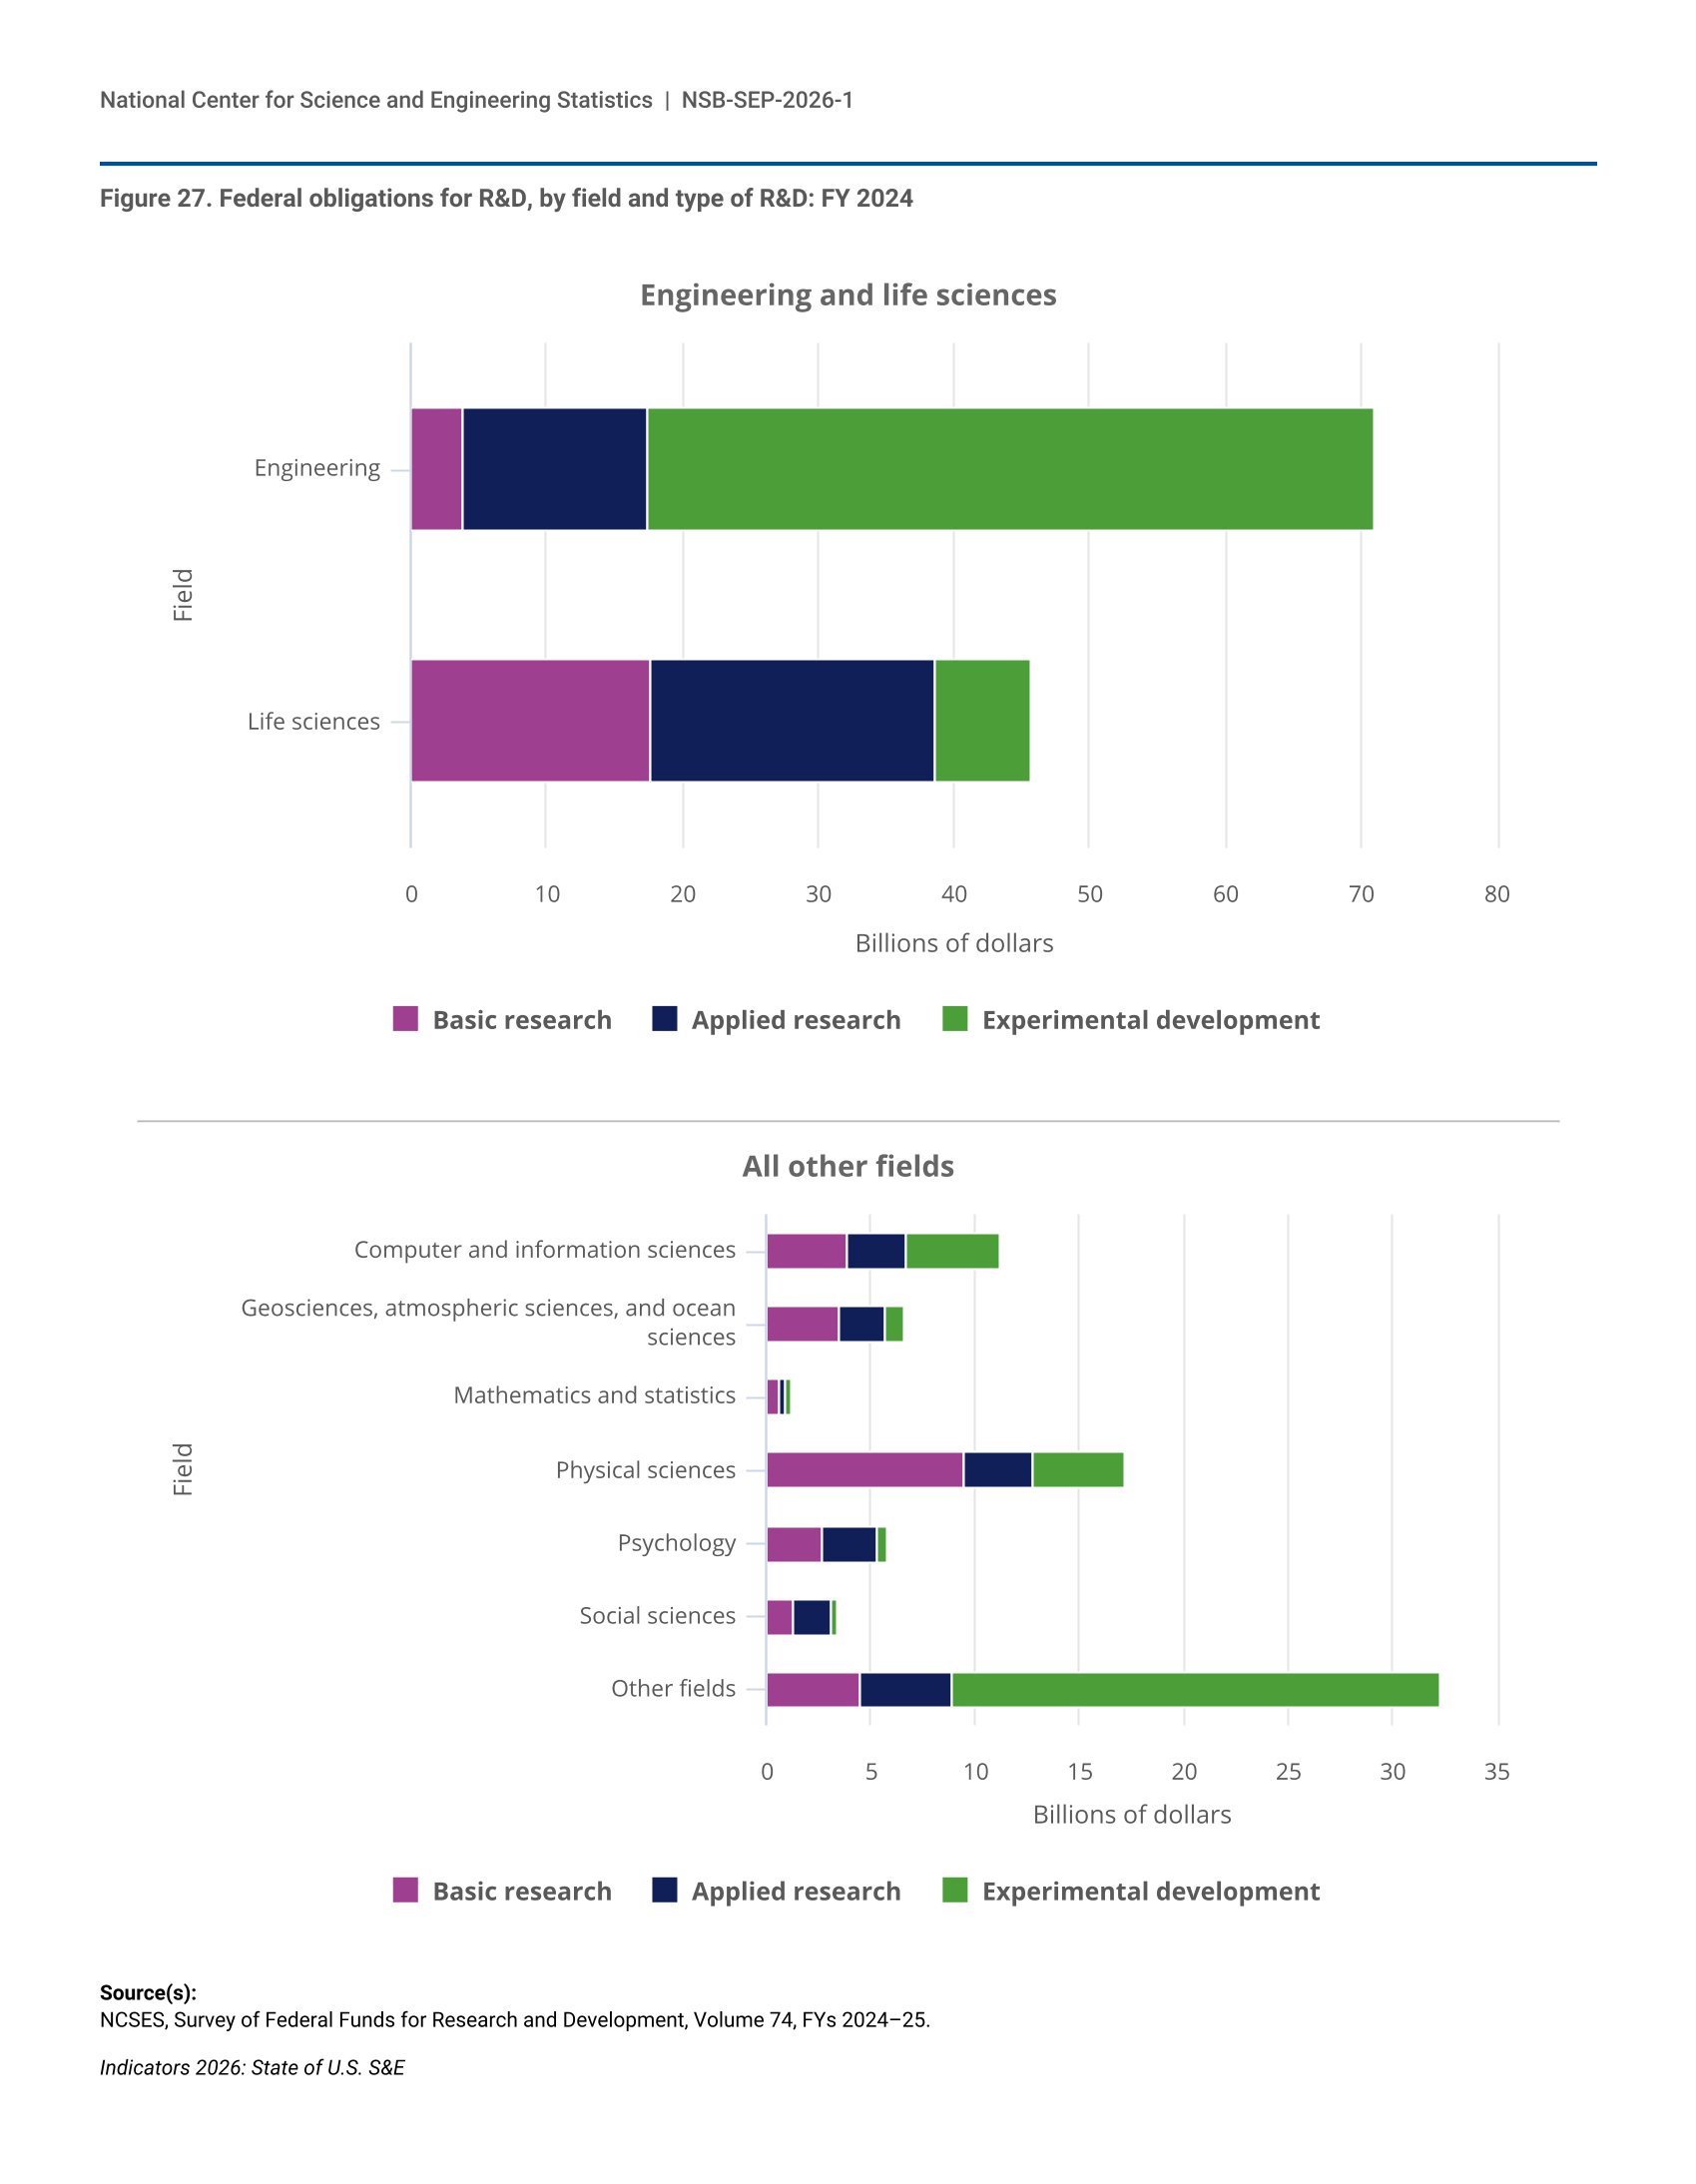
- Experimental development accounted for about two-thirds (67%) of U.S. R&D performance in 2024.
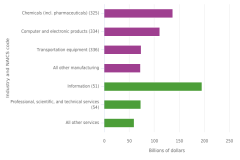
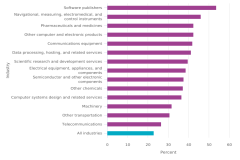
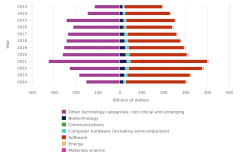
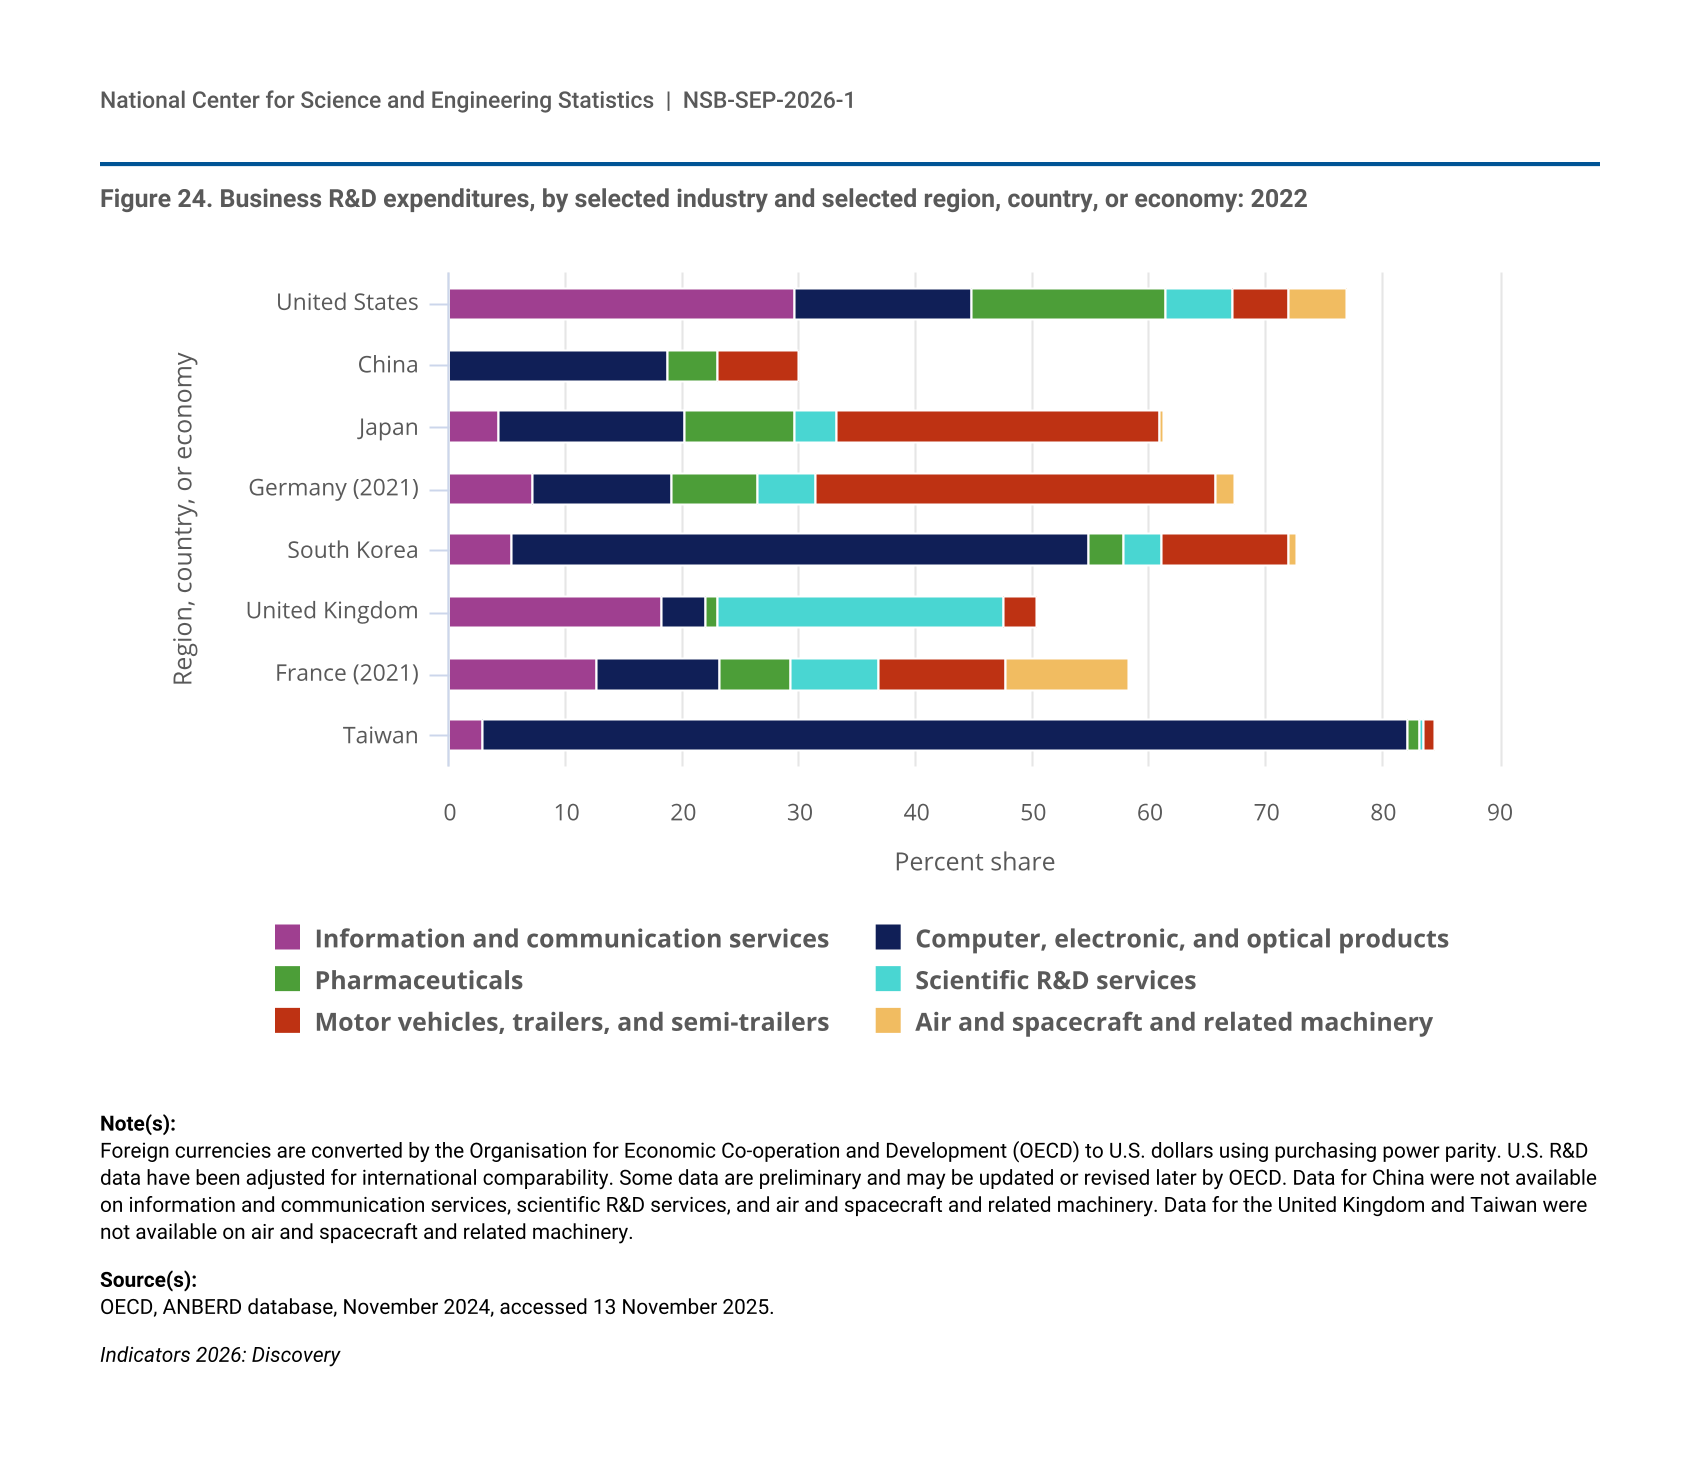
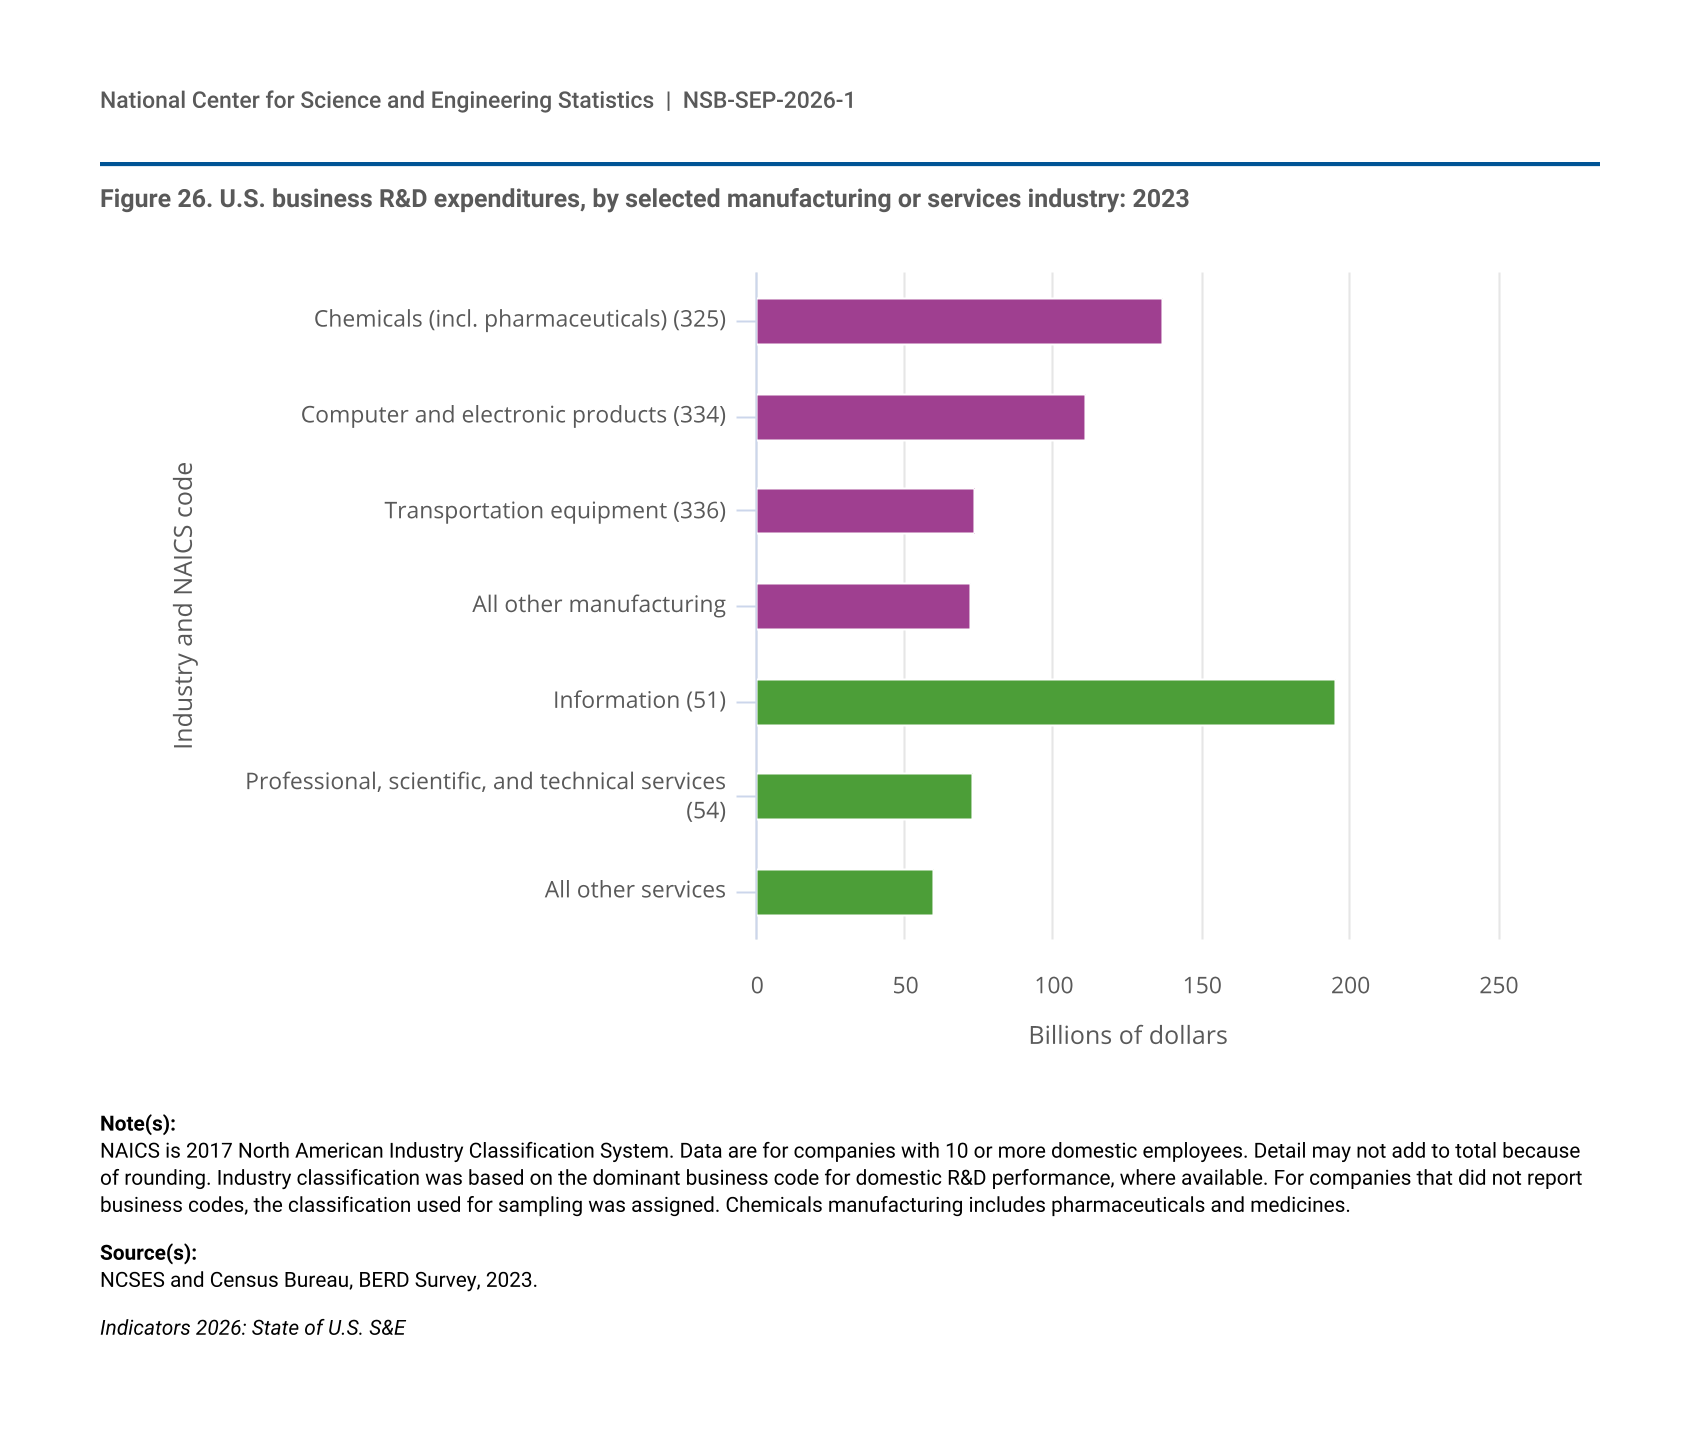
- In 2023, U.S. businesses across all industries invested heavily in R&D in areas that support CETs, including software products and embedded software ($302 billion), biotechnology ($136 billion), AI ($65 billion), and nanotechnology ($39 billion).
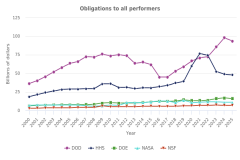
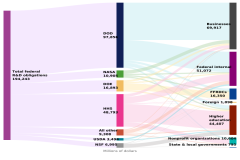
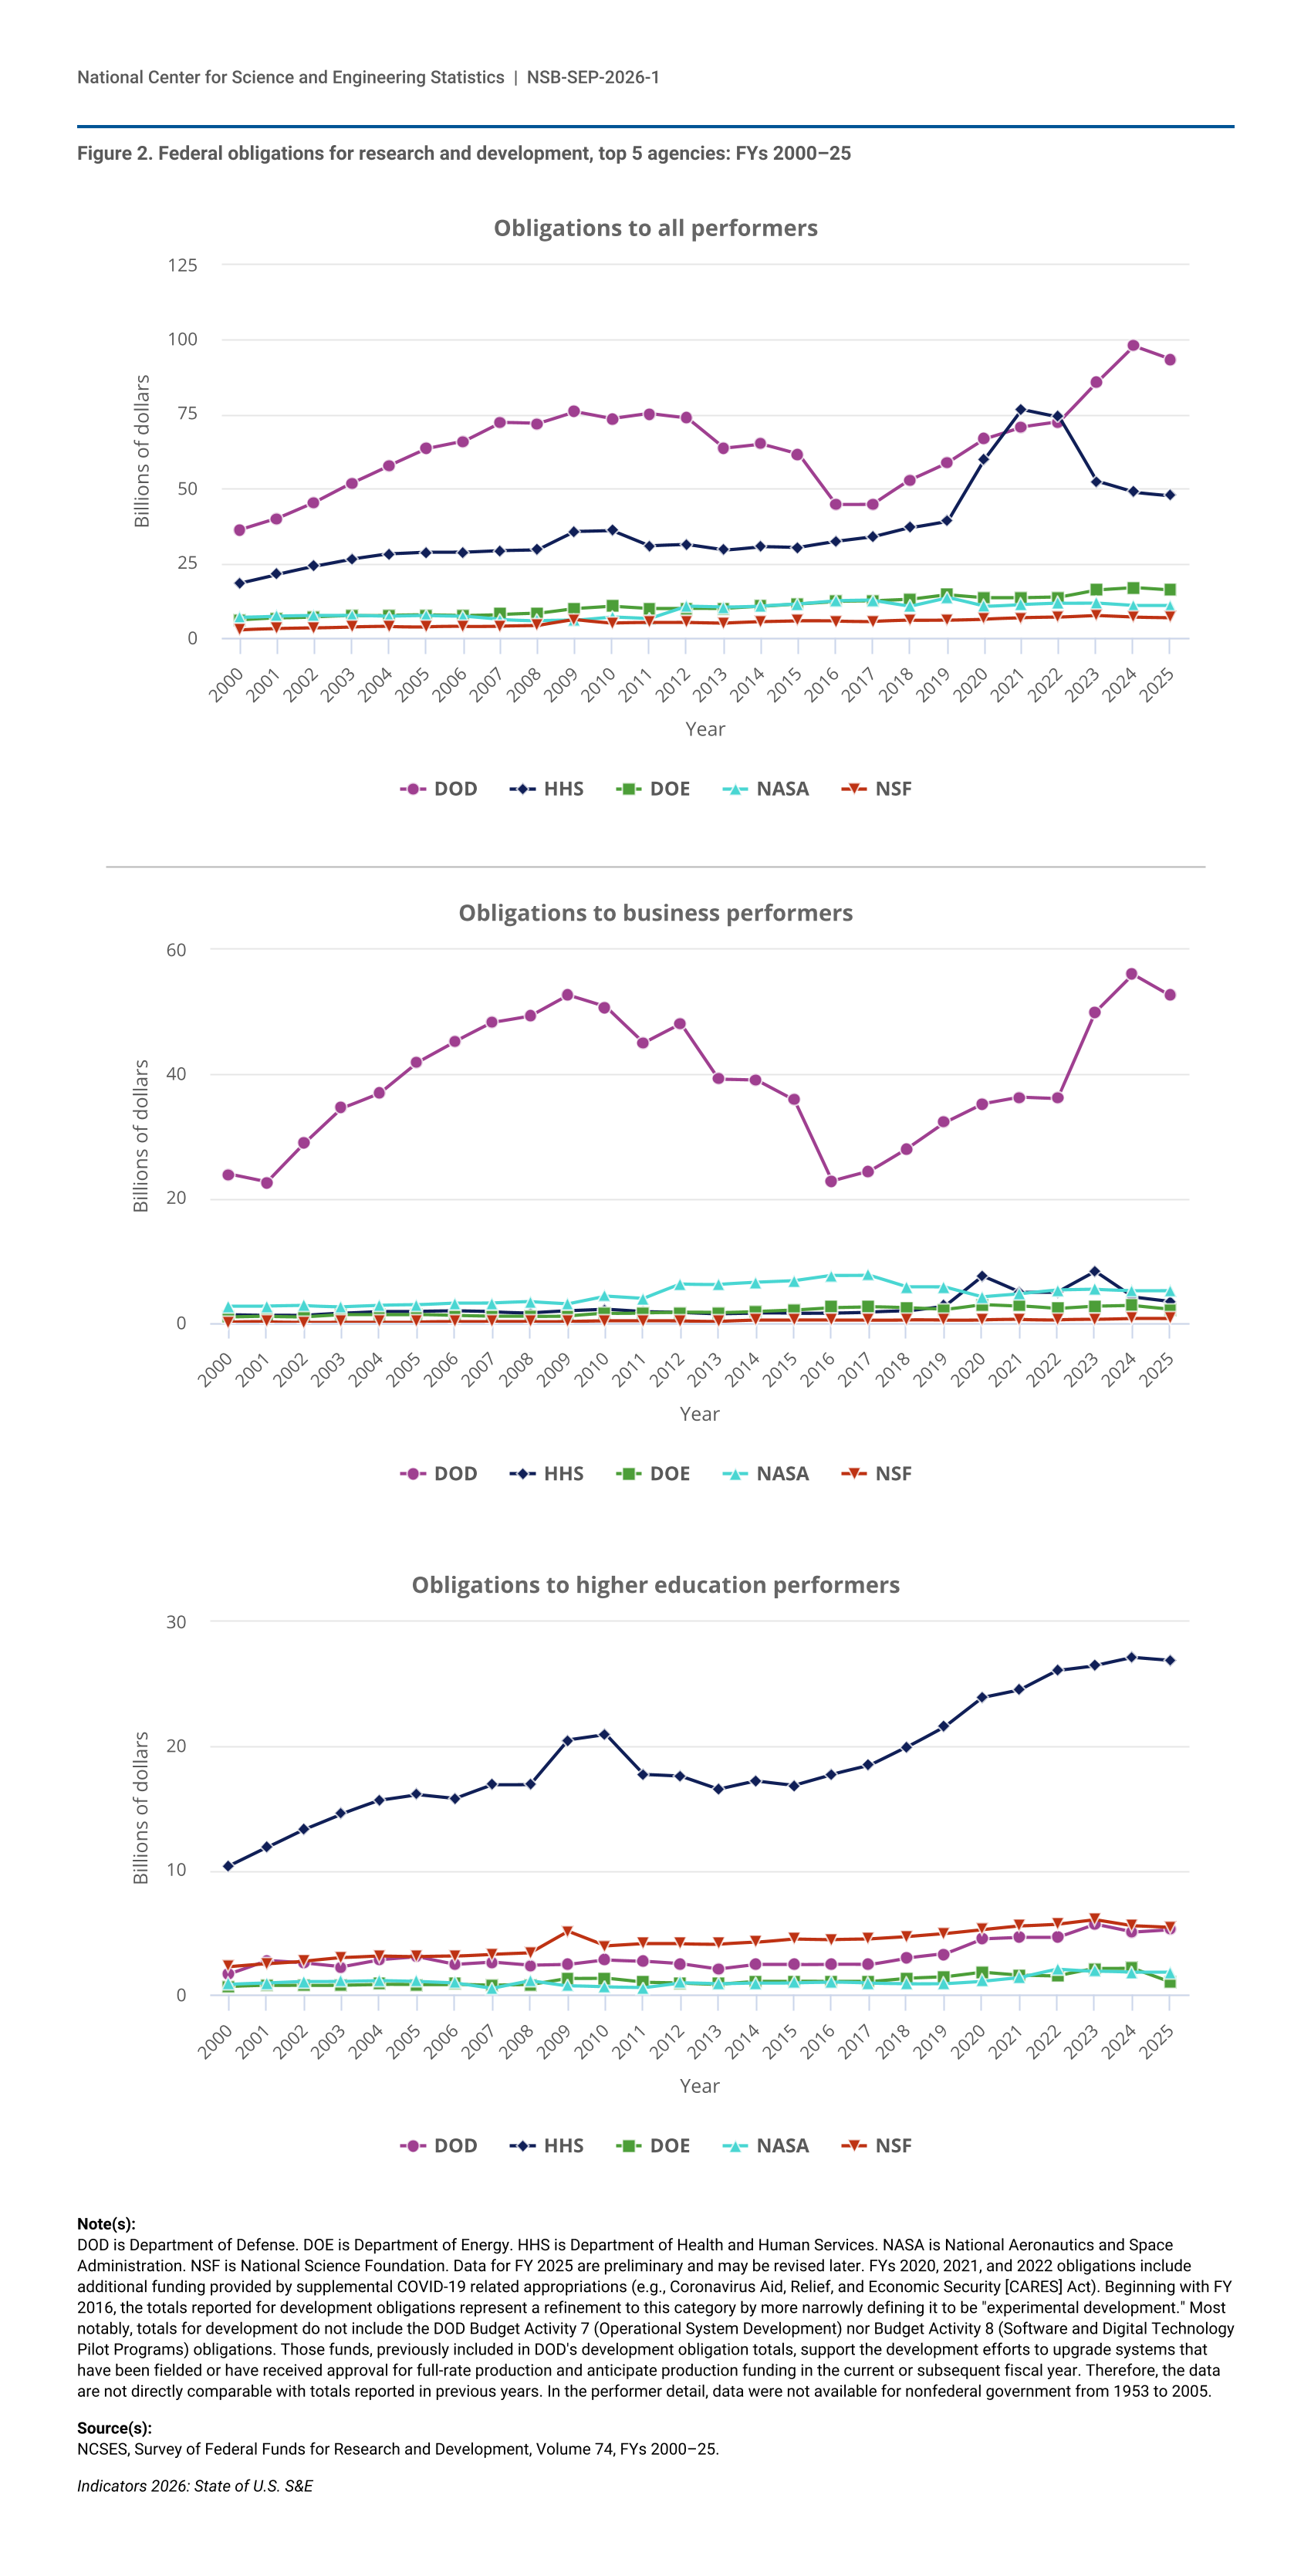
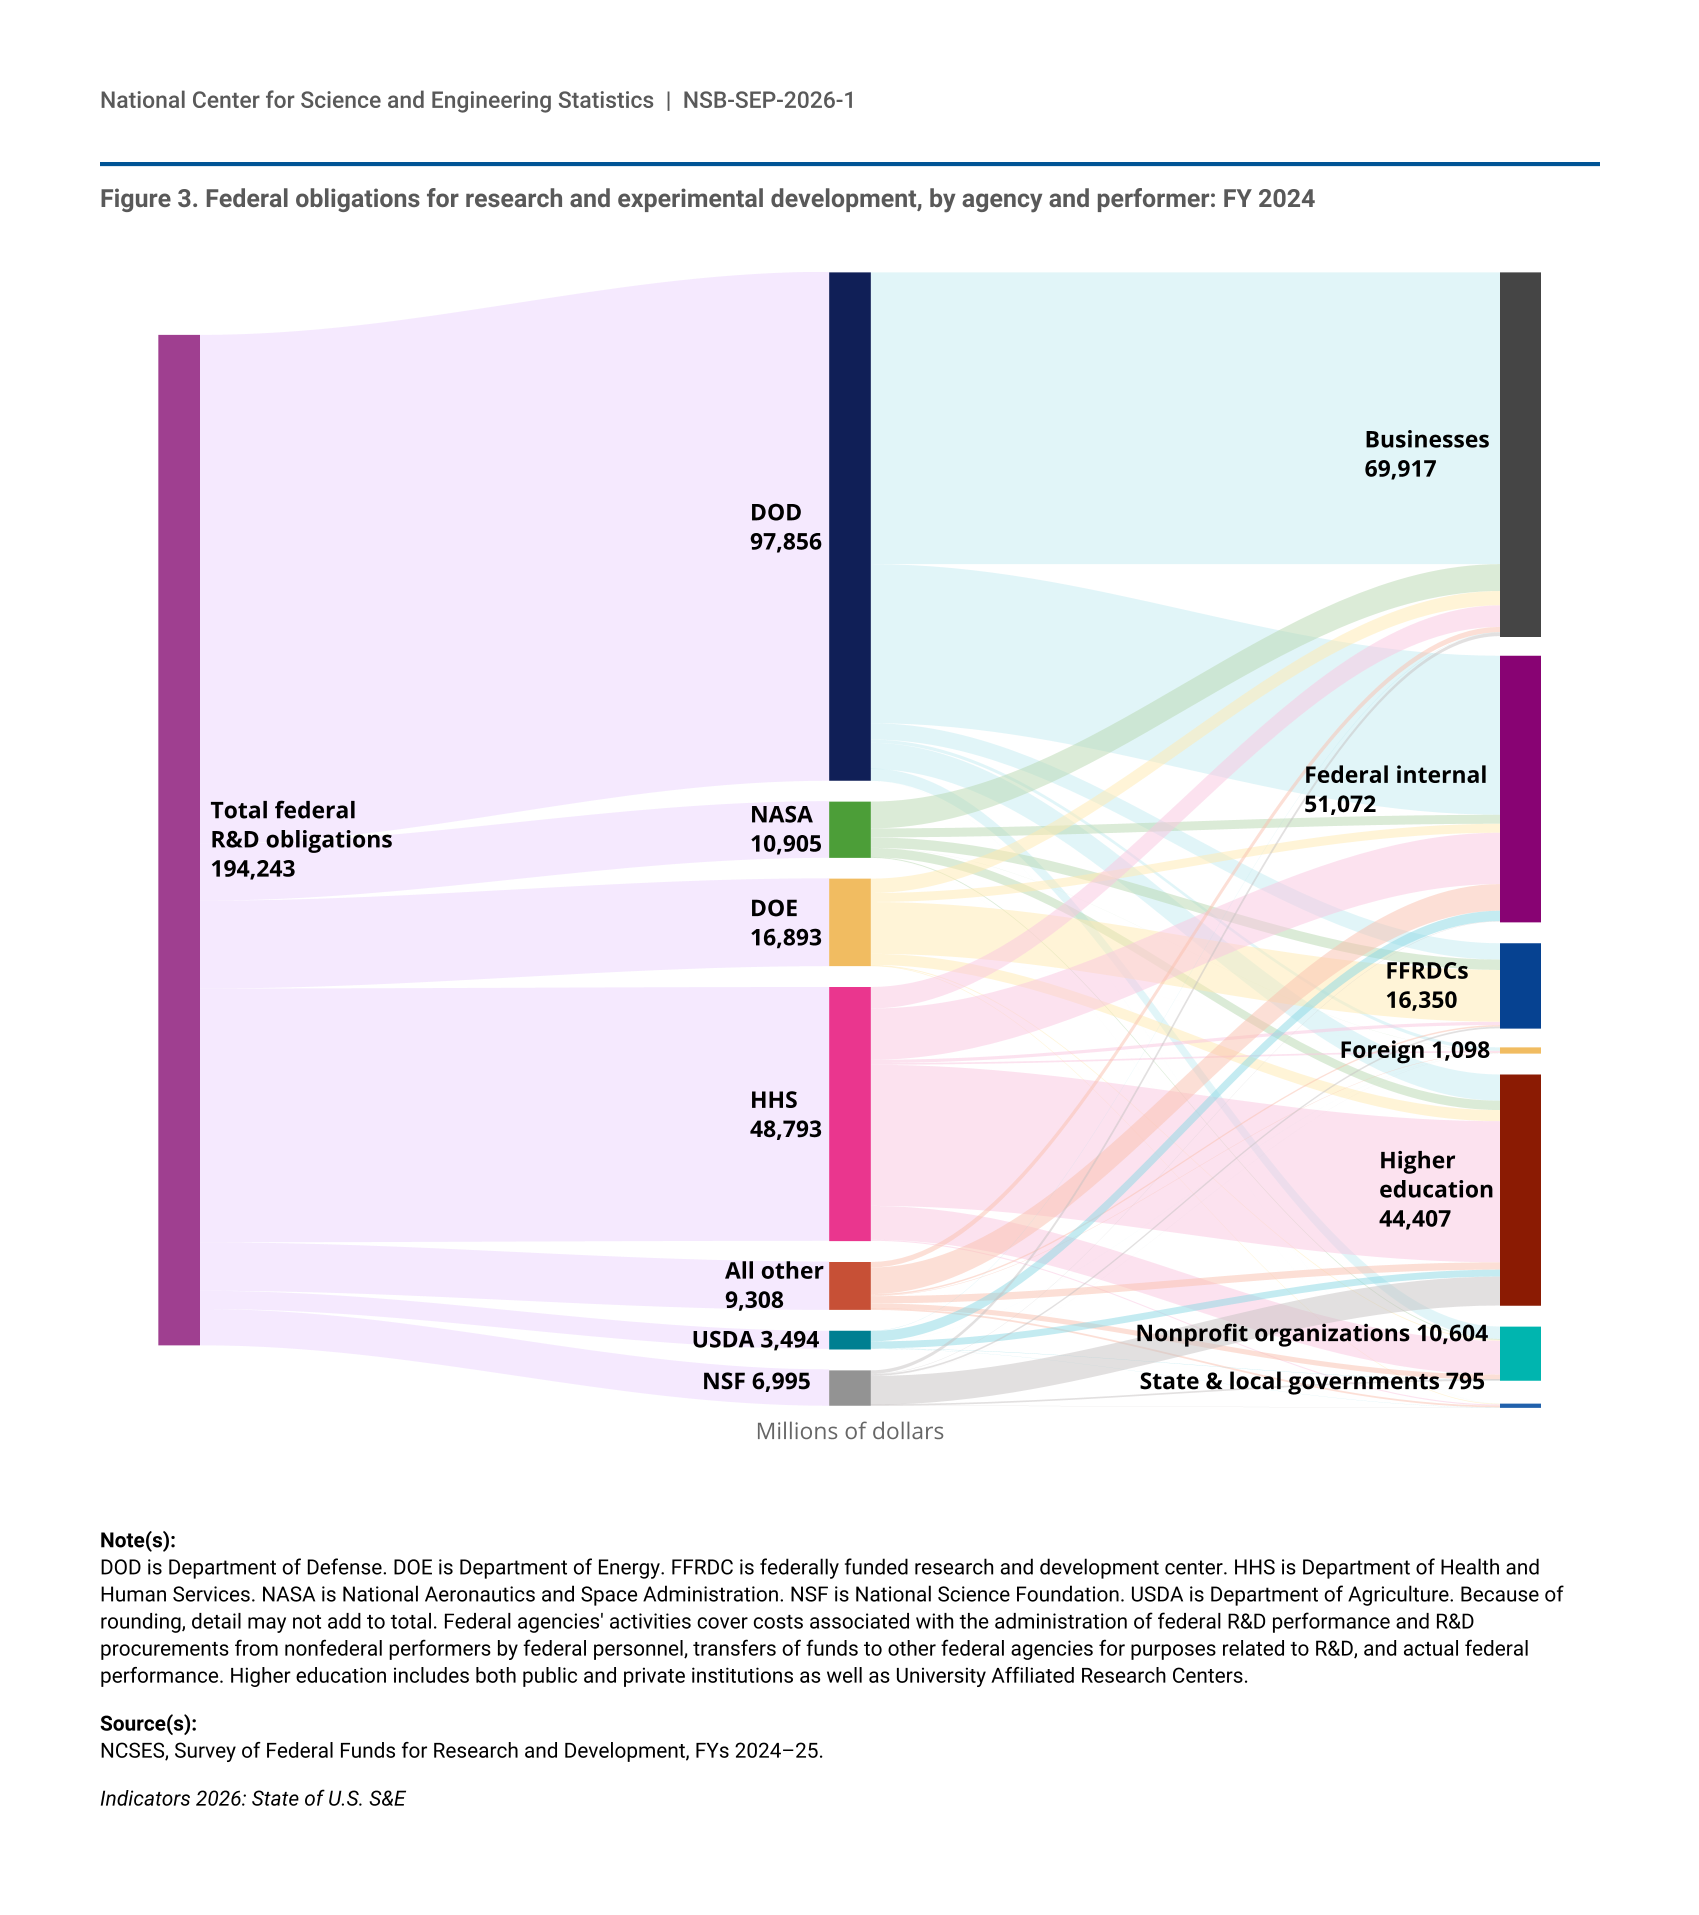
- The federal government obligated $194 billion for R&D in FY 2024. Across all fields of R&D, 24% of federal obligations were dedicated to basic research, 27% to applied research, and 49% to experimental development.
- The federal government was the largest funder of domestic basic research in 2024 (40% of total basic research), followed by the business sector (34% of total).
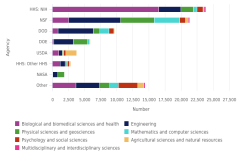
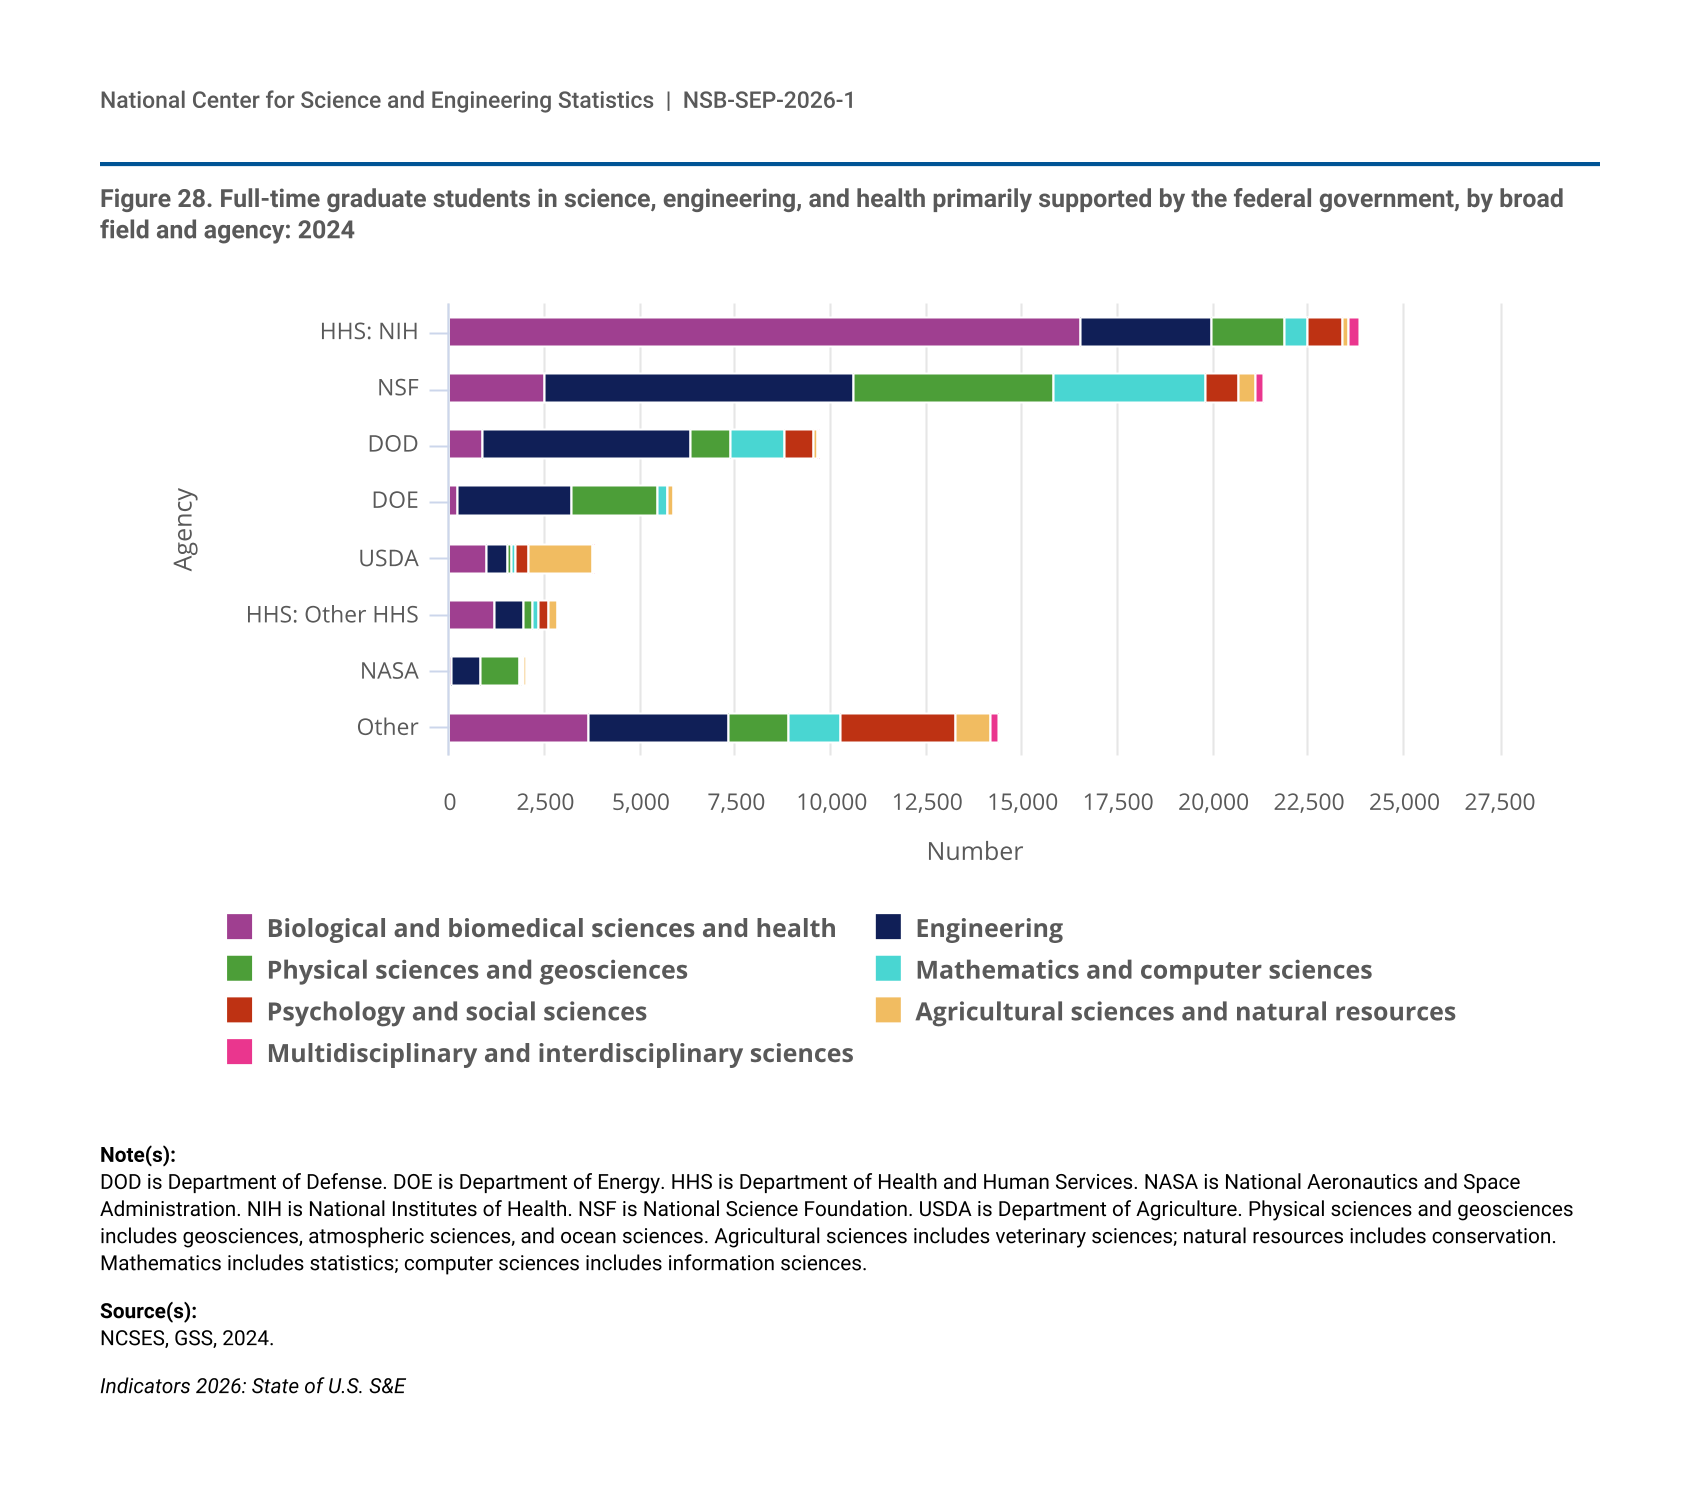
- Federal agencies supported 14% of the nation’s nearly 600,000 full-time graduate students in science, engineering, and health fields in 2024. The National Institutes of Health and the National Science Foundation (NSF) together accounted for 54% of the federally supported graduate students in science, engineering, and health.
Publications
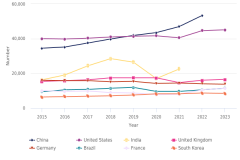
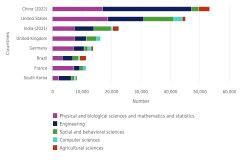
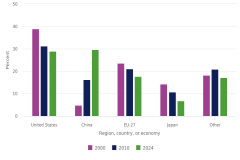
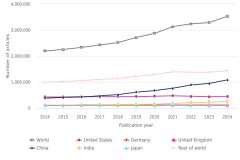
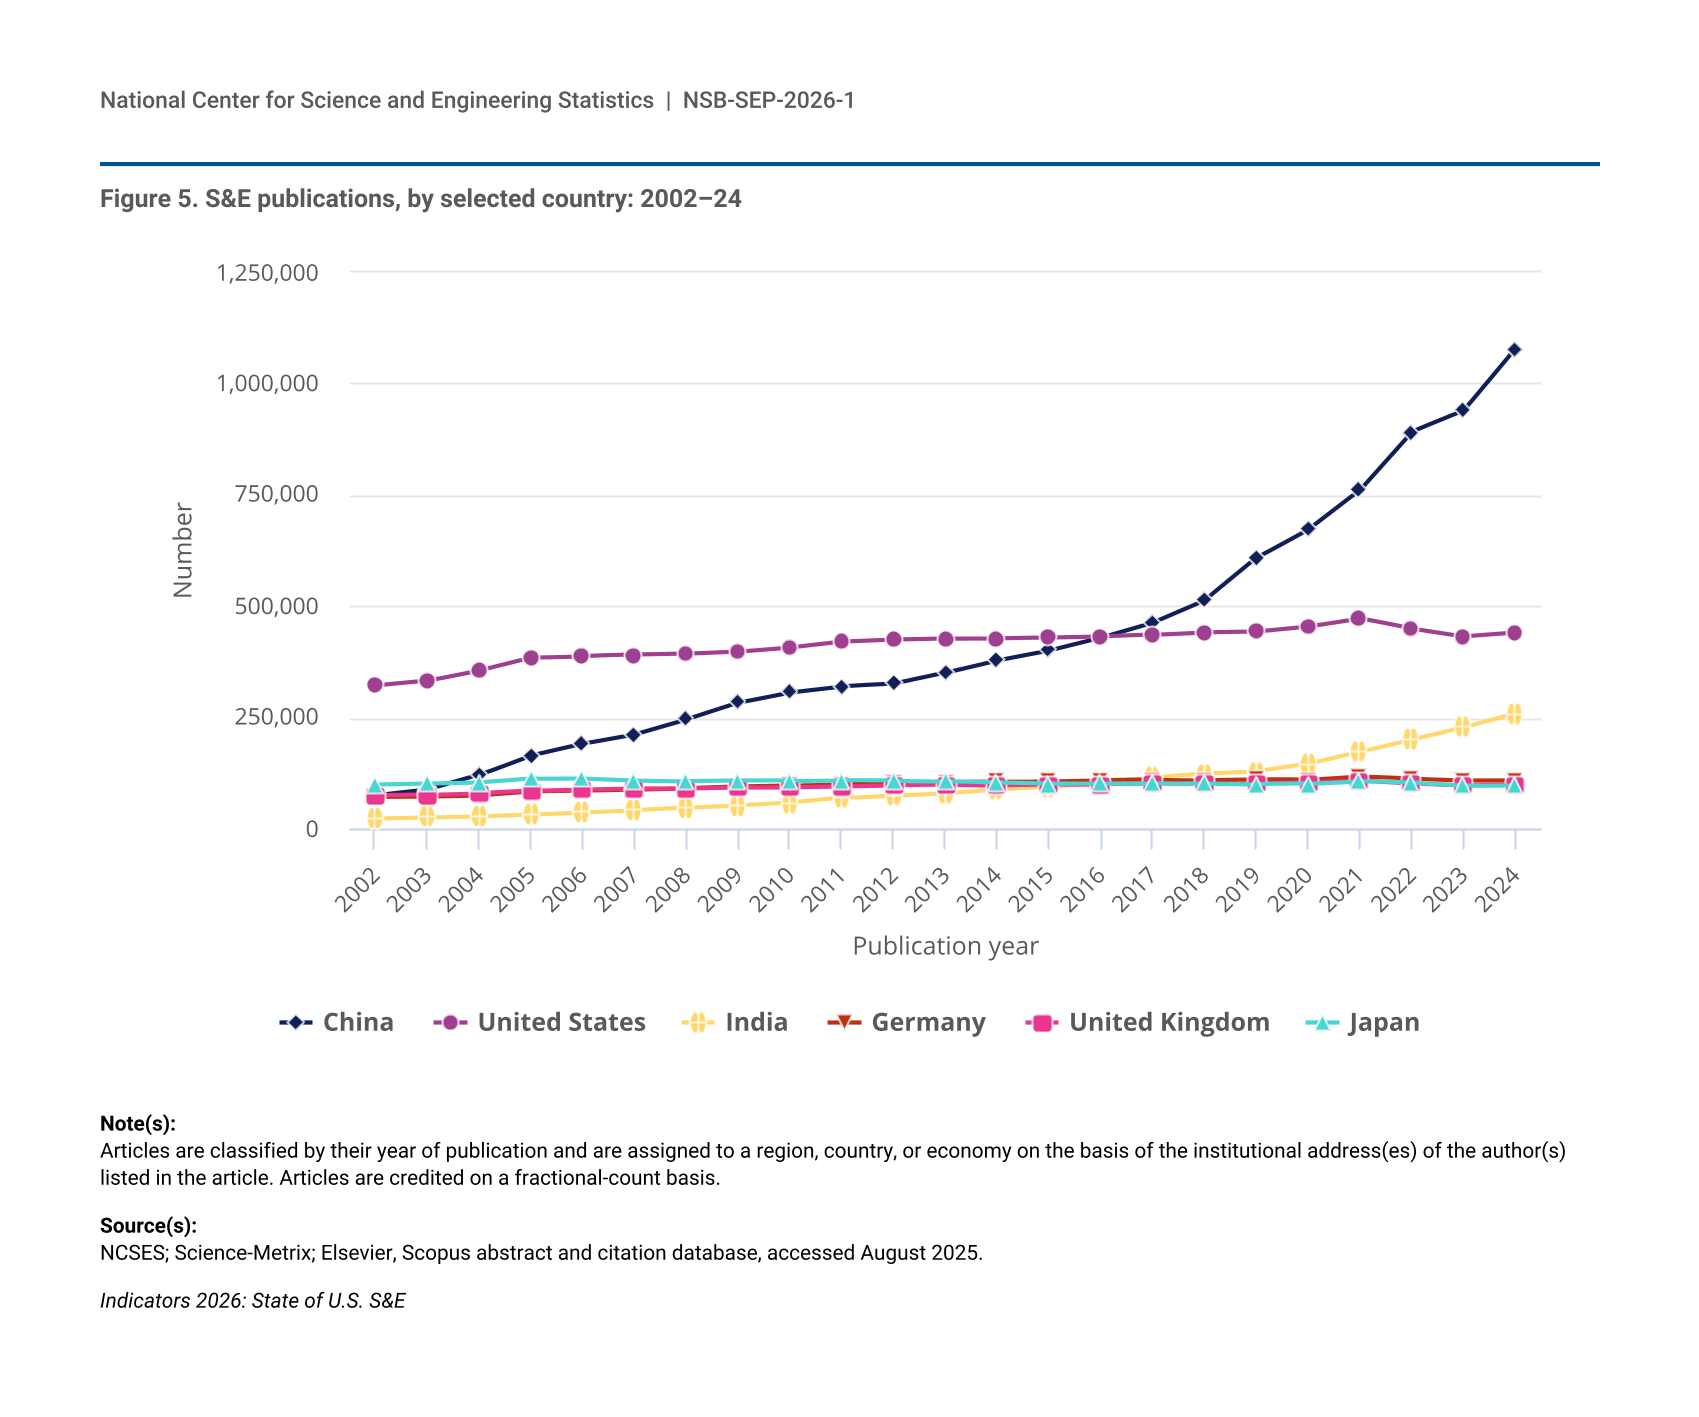
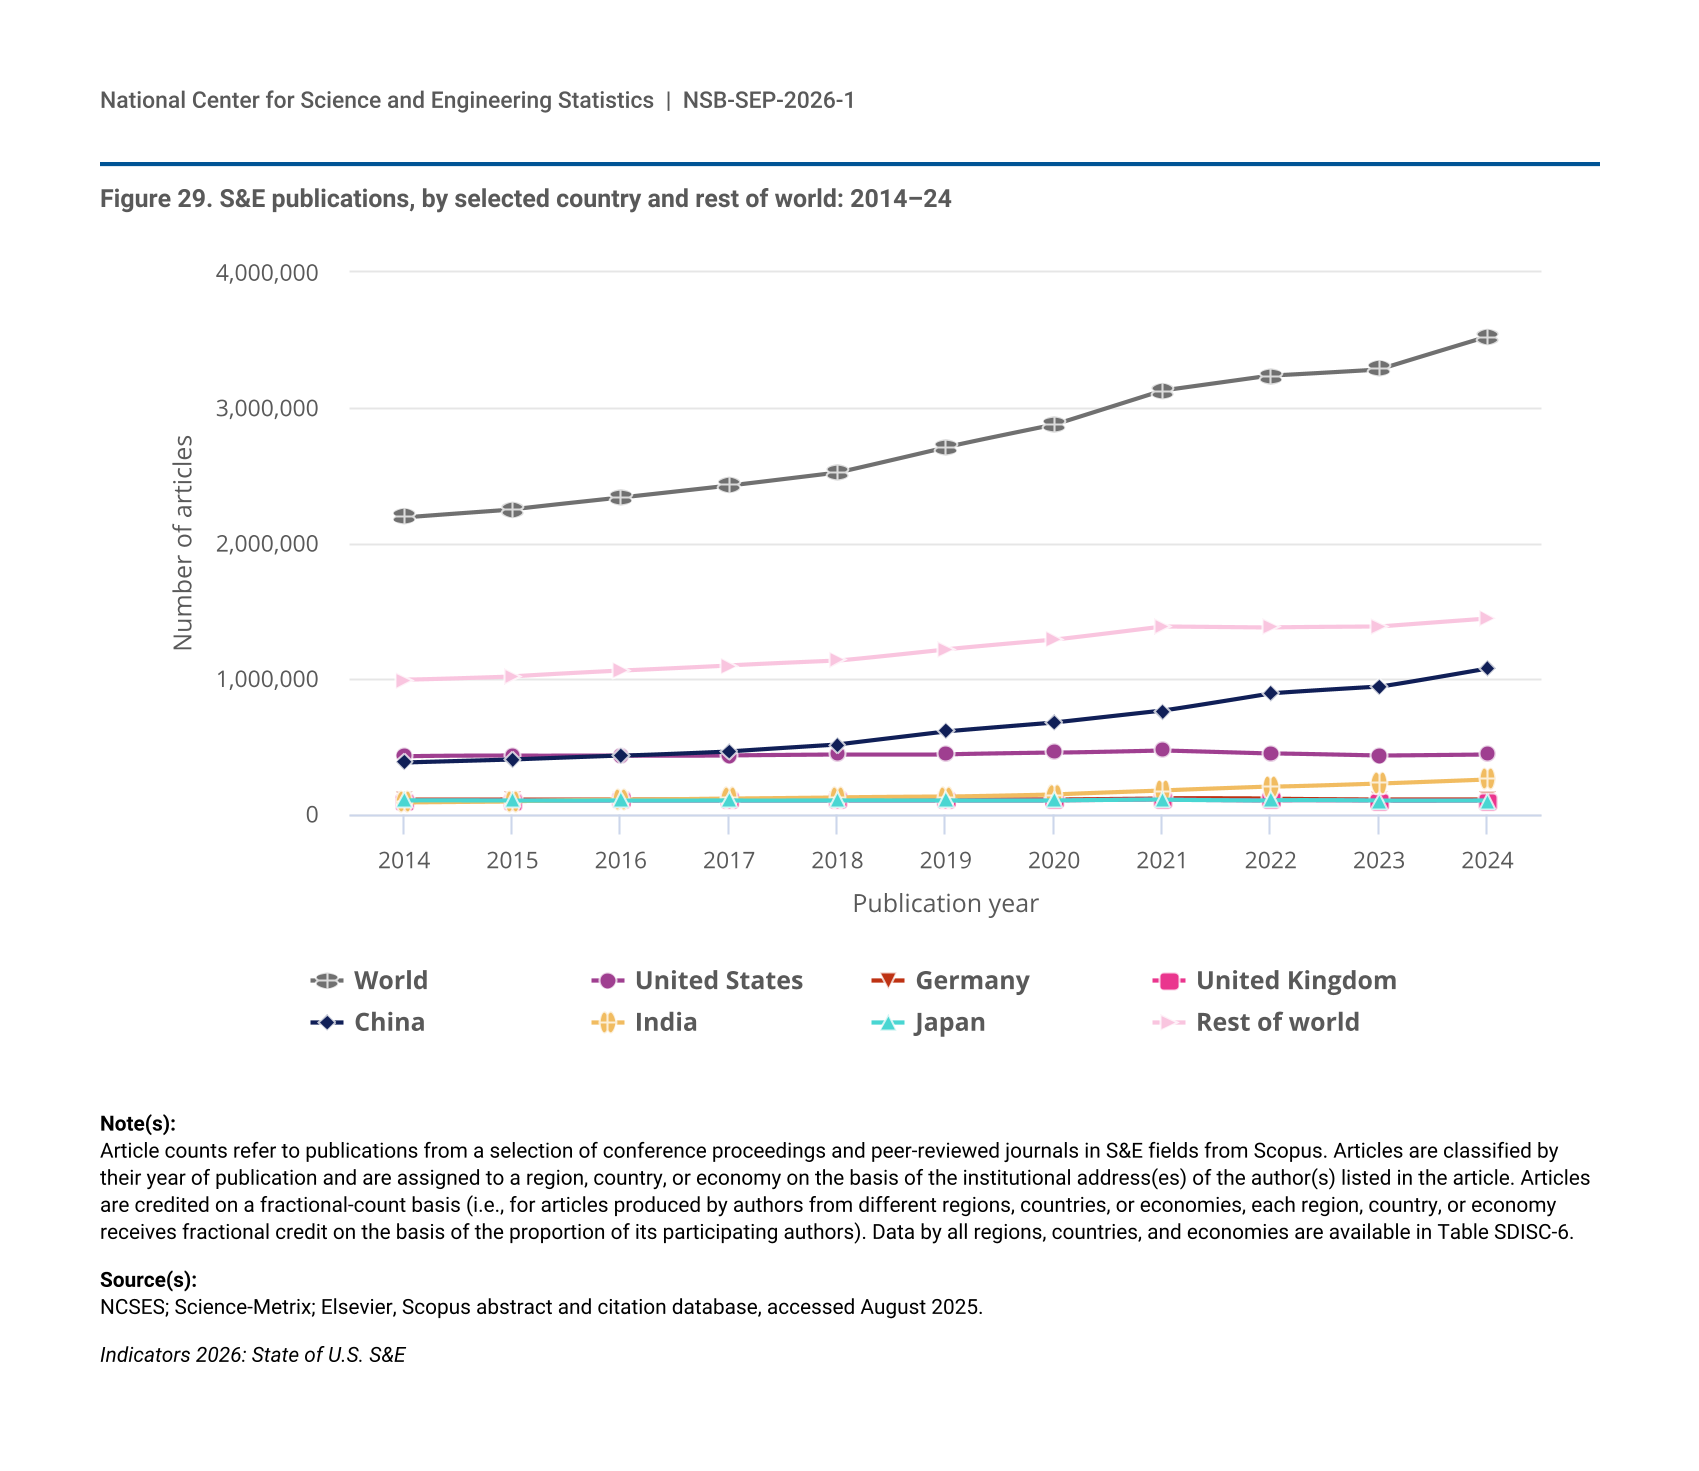
- Worldwide S&E research publication output totaled 3.5 million articles in 2024, with three countries together accounting for half of the global total: China (31%), the United States (12%), and India (7%).
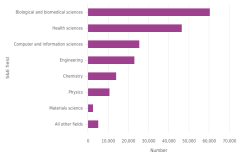
- In 2024, authors in the United States had their highest share of publications in health sciences (36%) among all S&E research publications by U.S. authors. Authors from China had their highest share of their publications in engineering (27%) and authors from India had their highest share in computer and information sciences (30%).
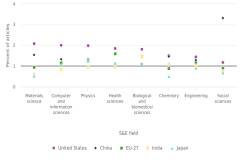
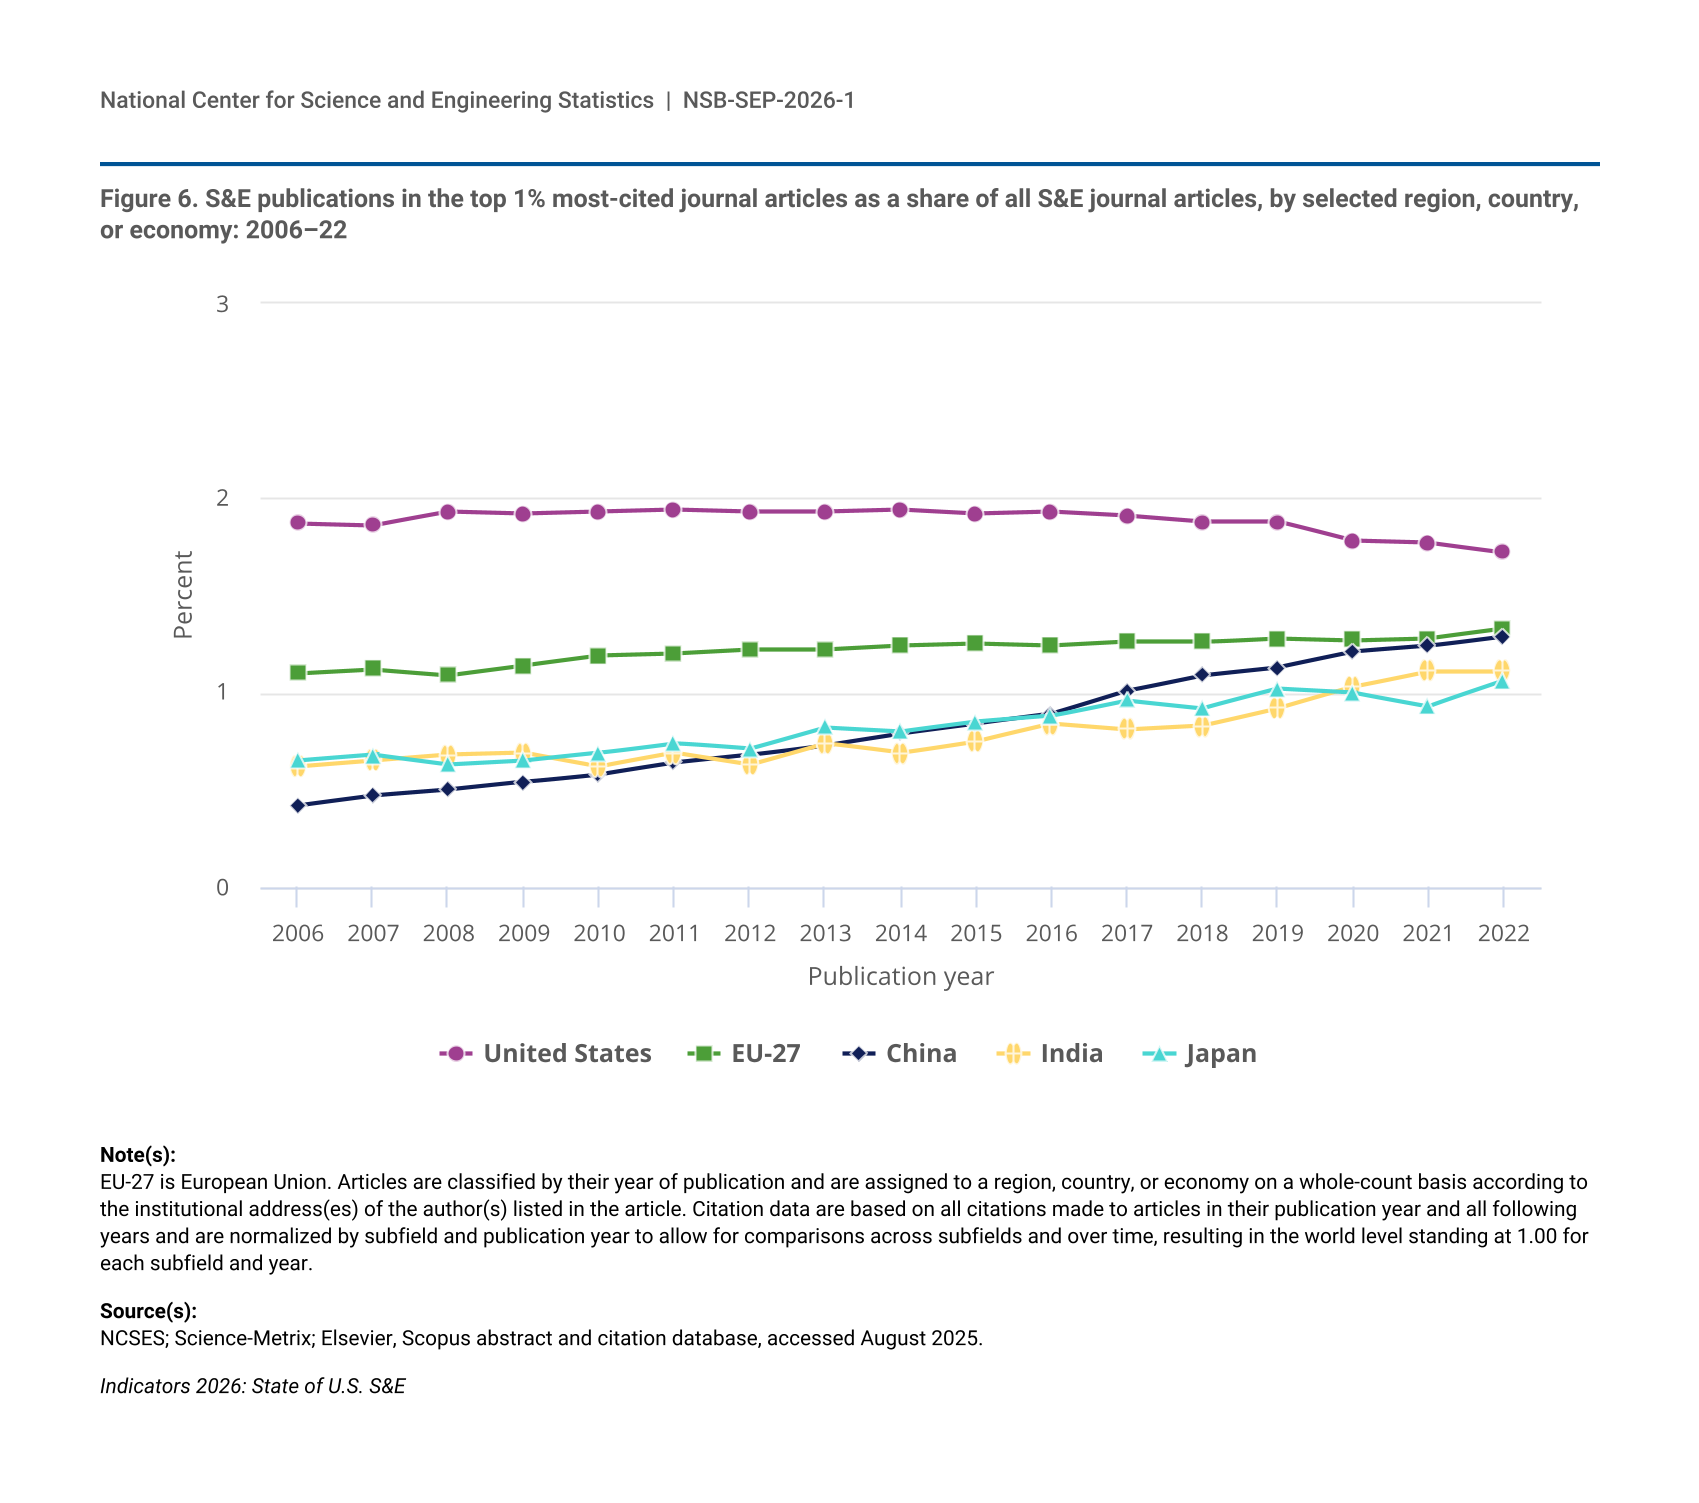
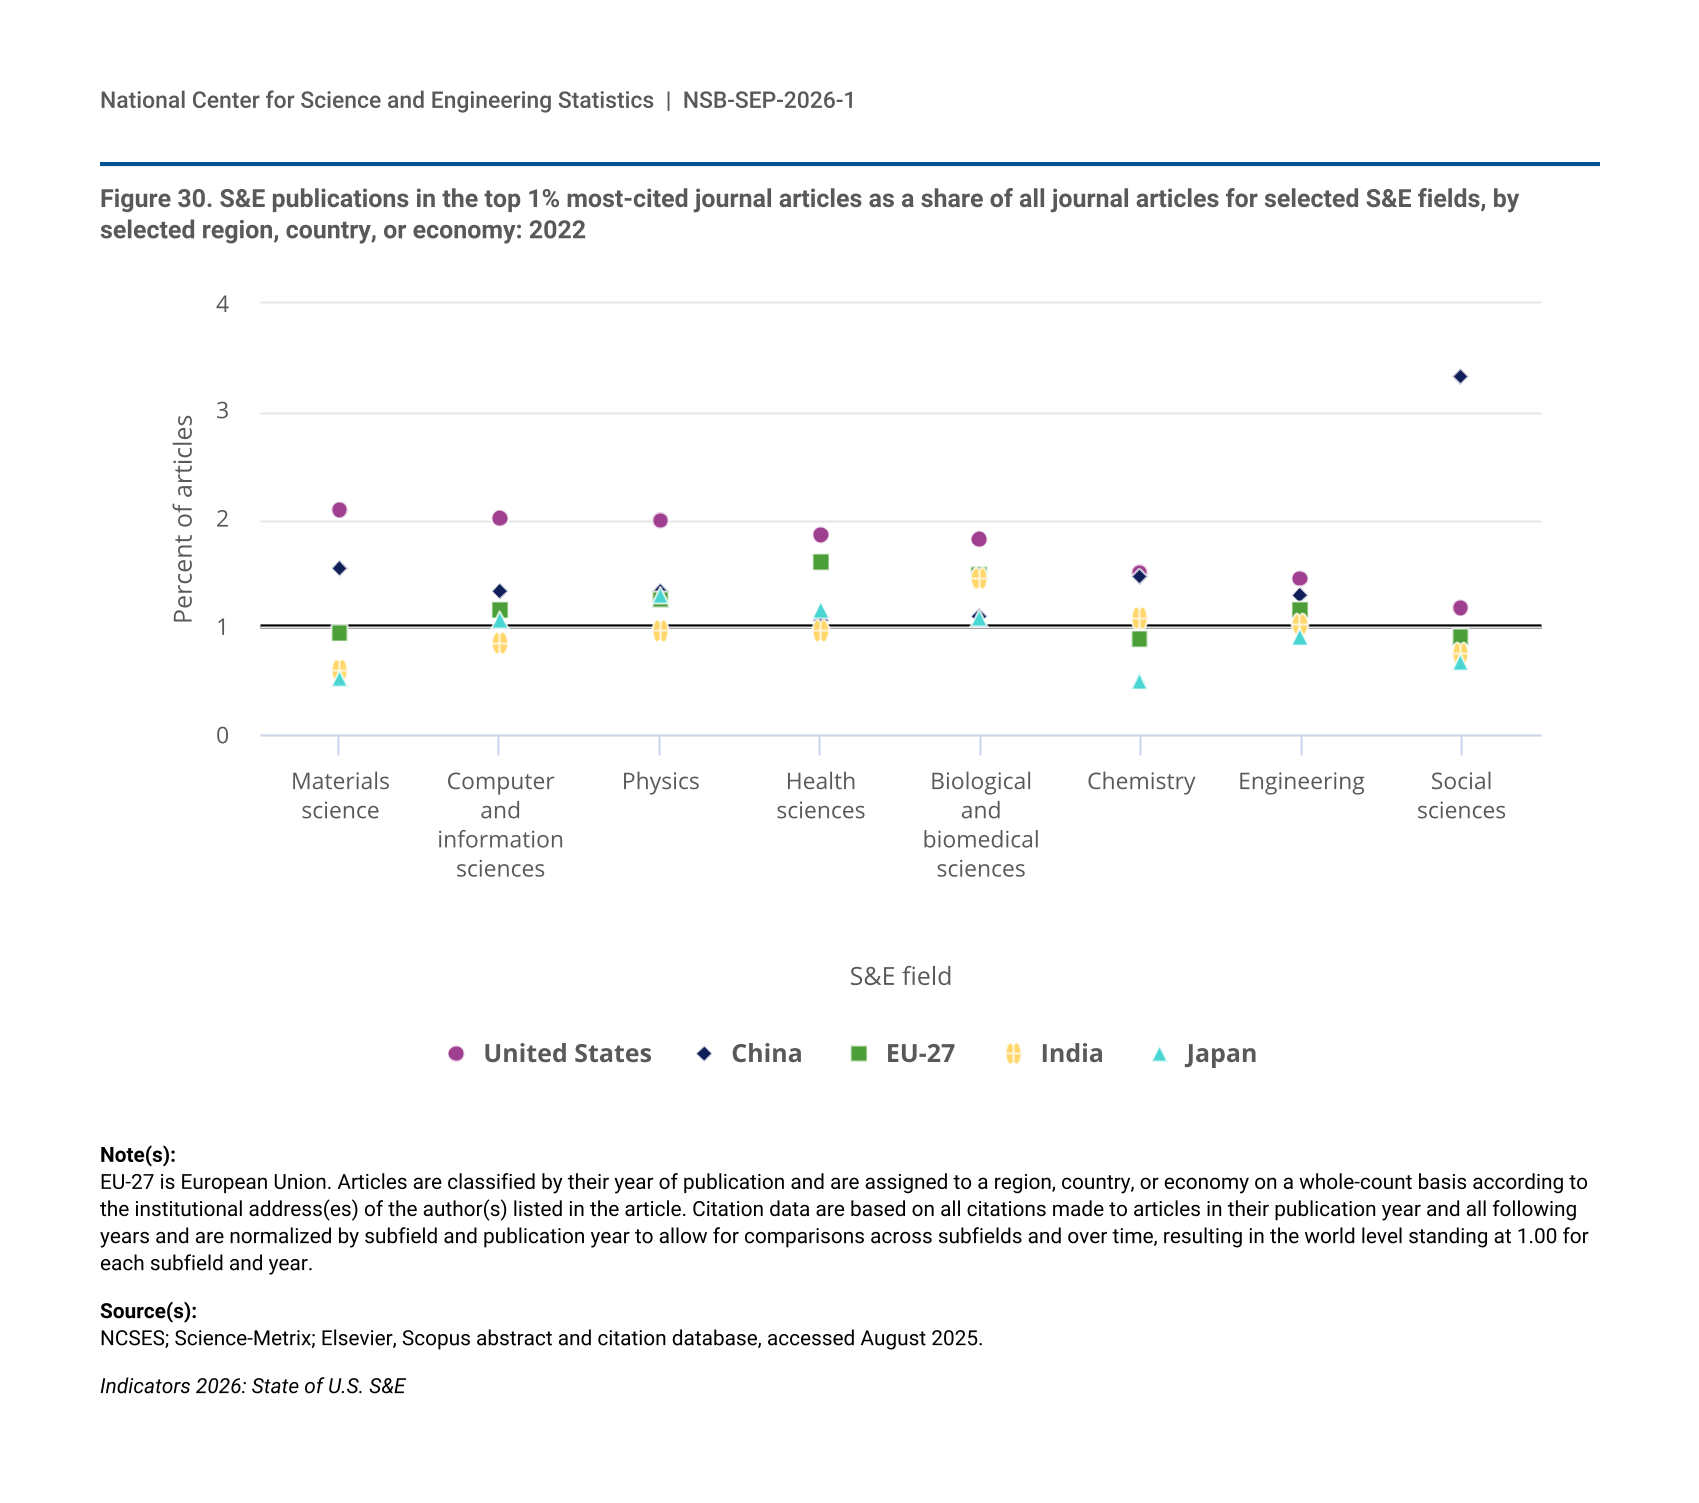
- In 2022, U.S. authors generated a disproportionate share of HCAs. The U.S. HCA shares in several fields—materials science, computer and information sciences, physics, health sciences, and biological and biomedical sciences—were higher than those of China, the EU-27, Japan, and India.
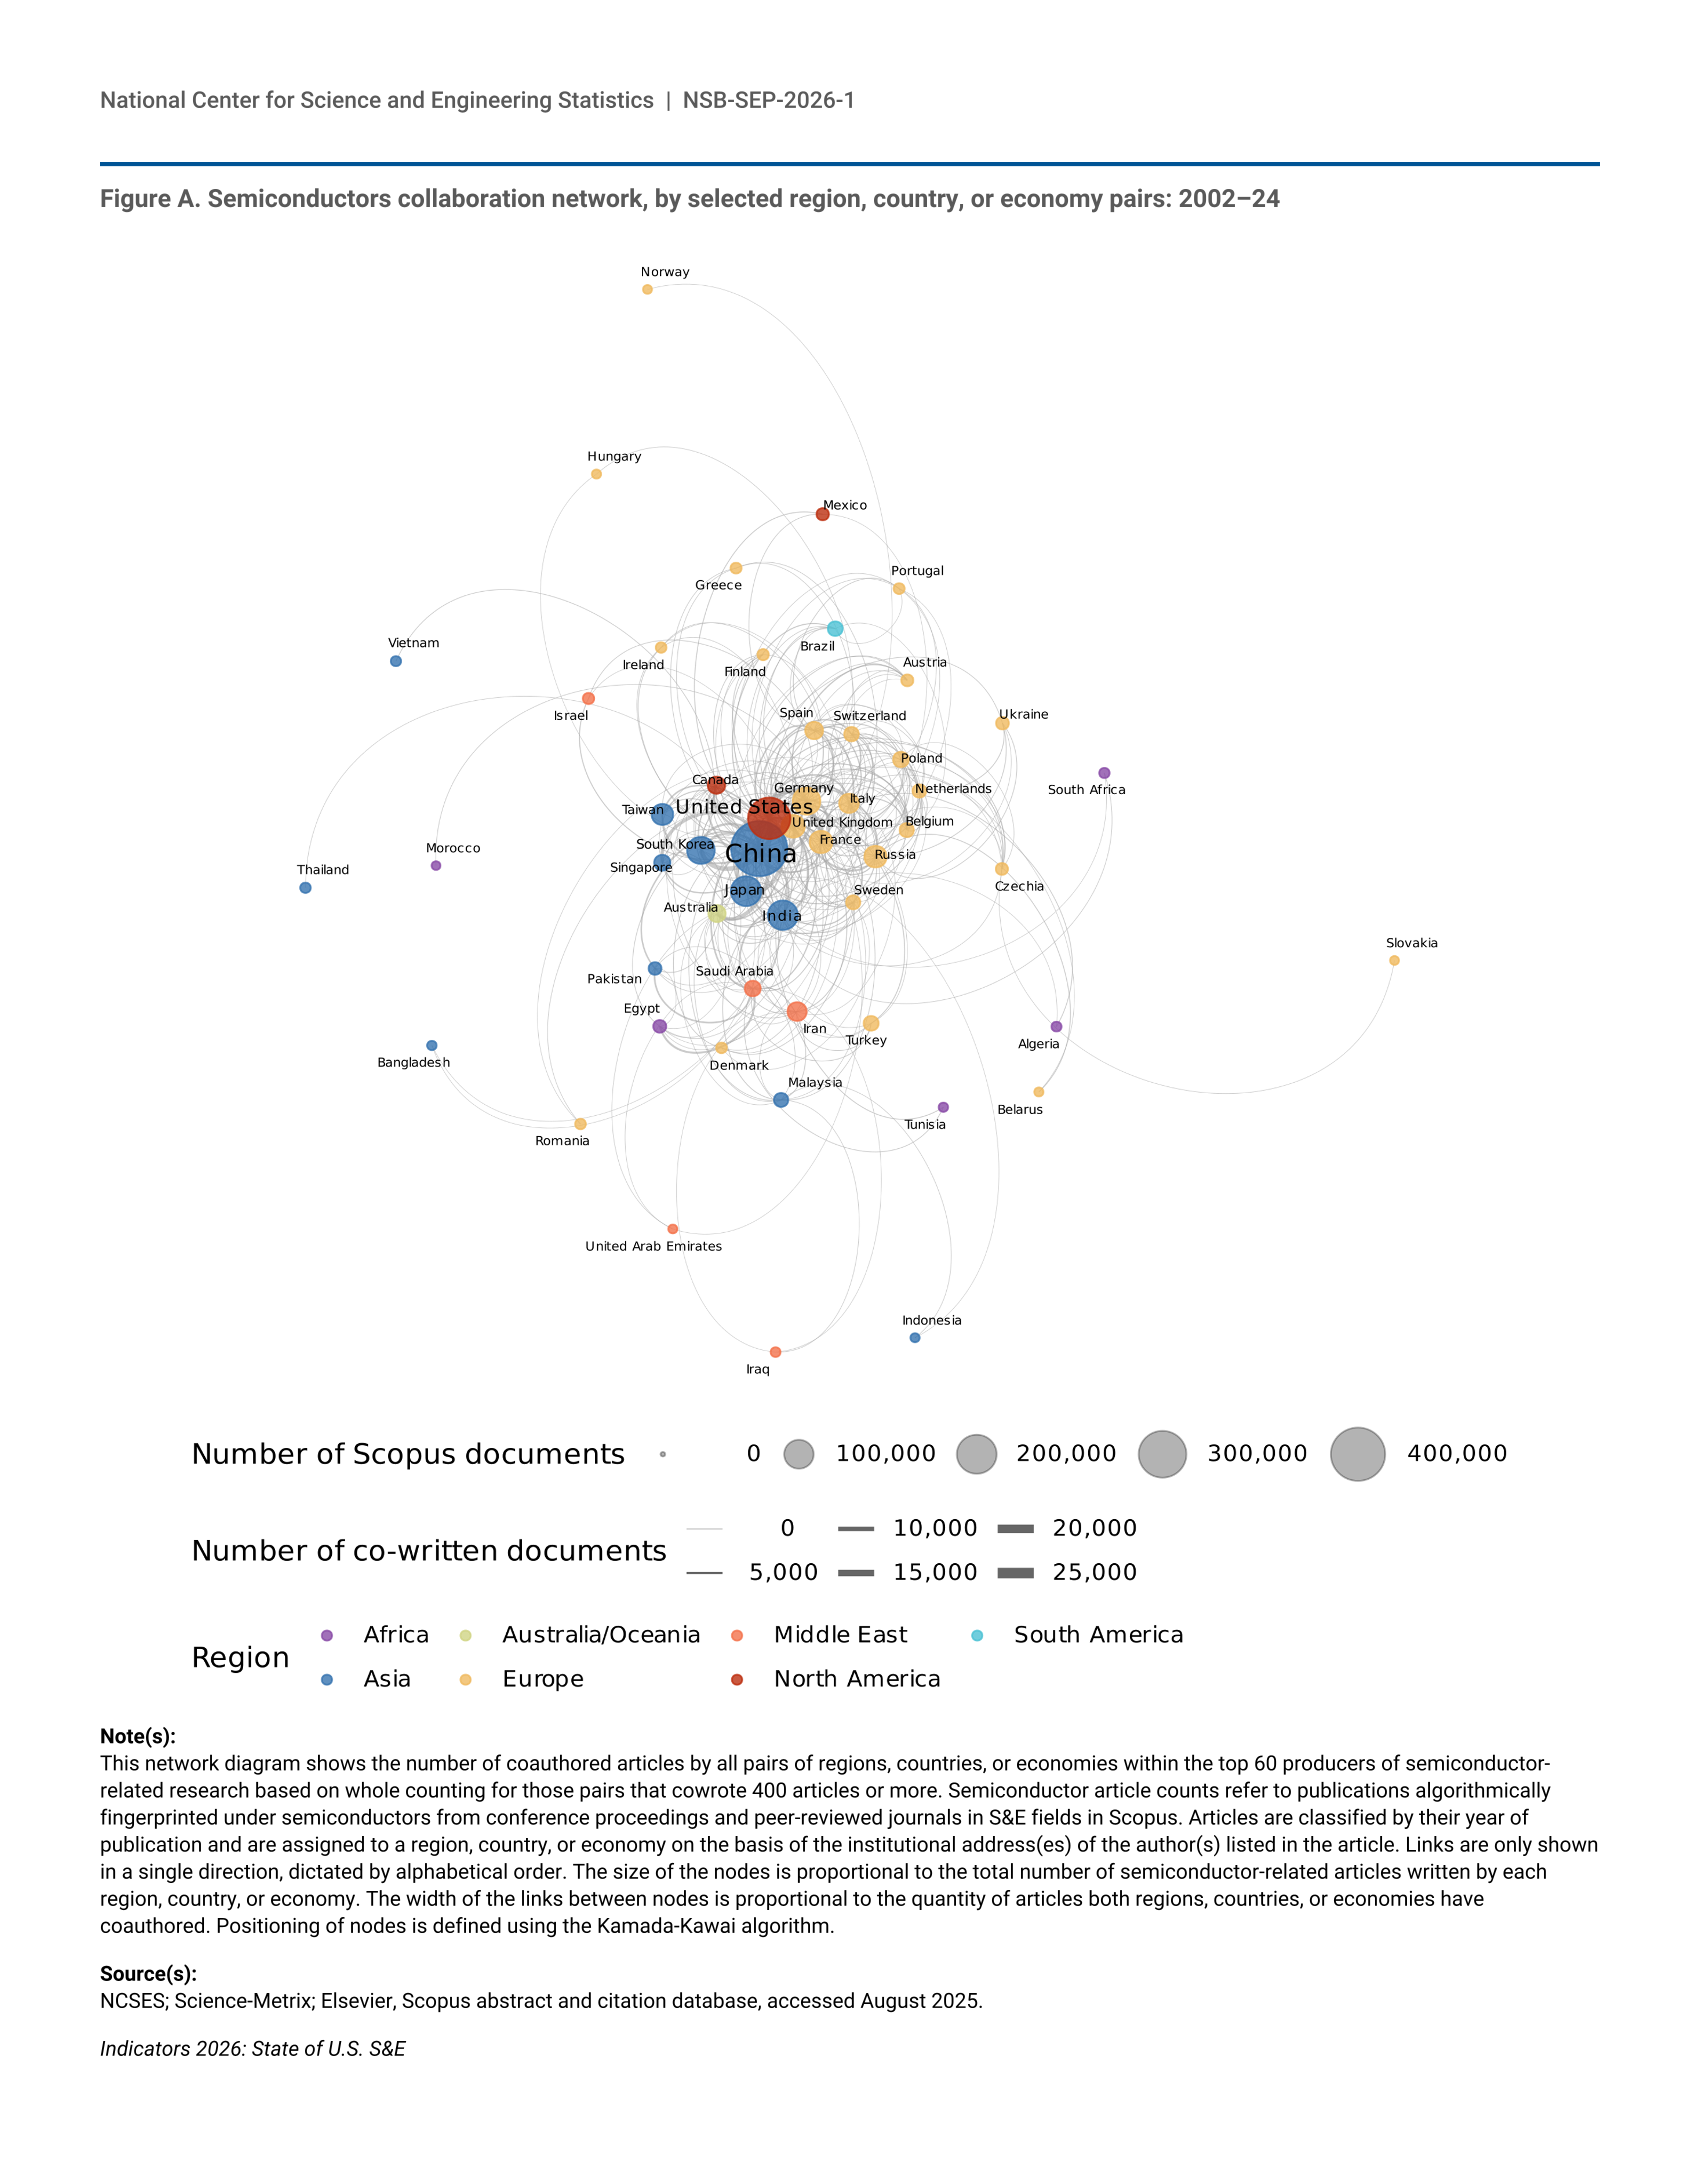
- The share of all global S&E articles produced with international collaboration grew from 19% to 22% between 2012 and 2024. In 2024, U.S. authors contributed to 31% of all international coauthored articles, more than authors in any other country. U.S. authors coauthored S&E articles with authors in China more than with authors in any other country.
Translation to Impact: U.S. and Global Science, Technology, and Innovation Output
The United States maintains a strong global position translating R&D activities into economic value. While China leads global KTI manufacturing, the United States retained the largest share of value-added production in four KTI manufacturing industries in 2024: aerospace machinery, medical instruments, pharmaceuticals, and weapons. The United States maintains a dominant share of global production of KTI services. Globally, patents from U.S. inventors in CET areas are among the most highly cited.
Industry and Trade
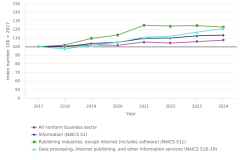
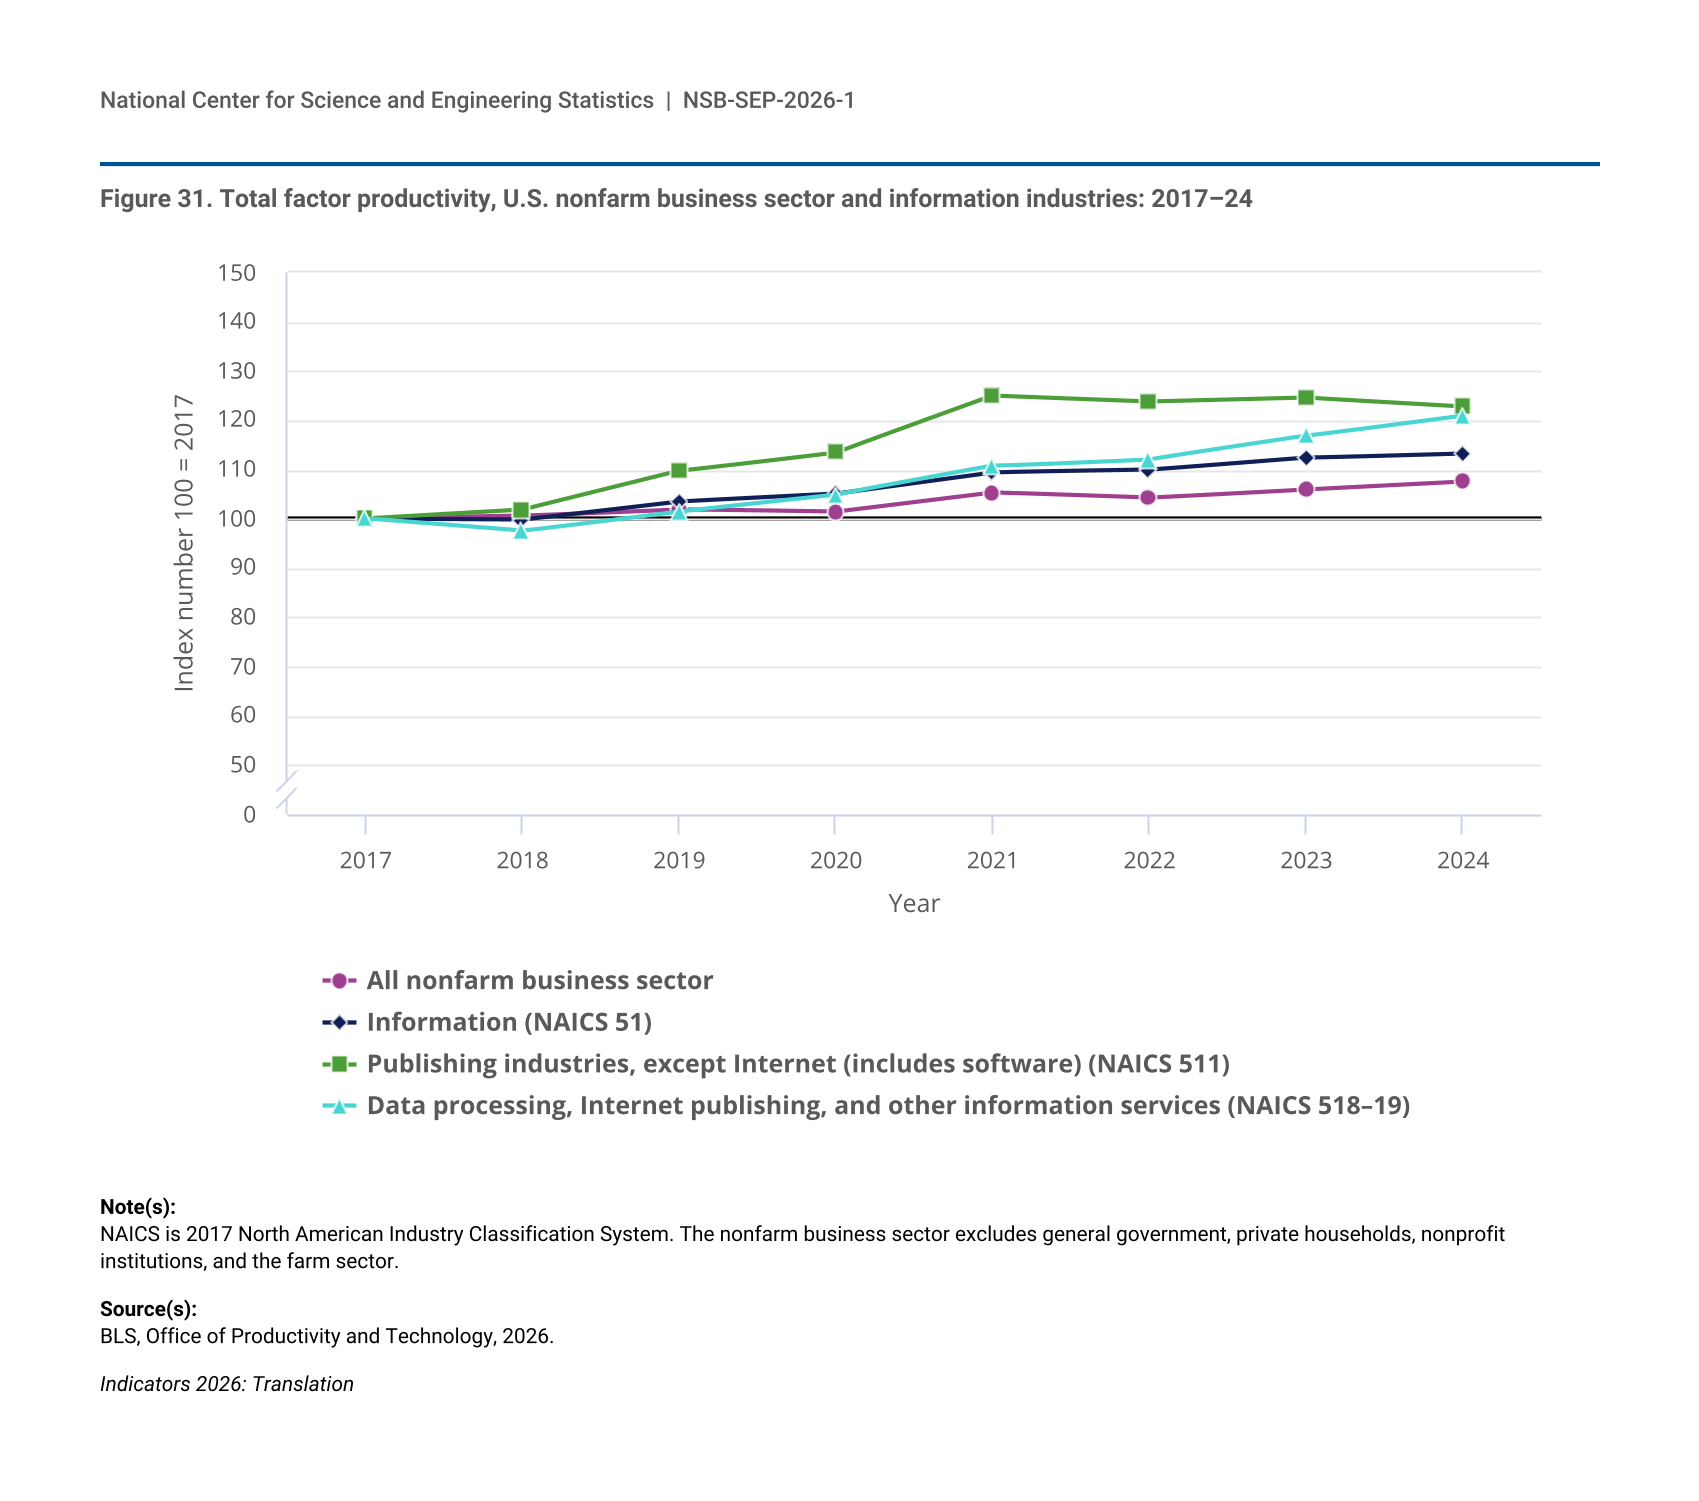
- Between 2017 and 2024, total factor productivity in the United States, a measure of an economy’s ability to generate outputs from inputs, increased faster for the information industry (13%) than for U.S. non-farm businesses overall (8%).
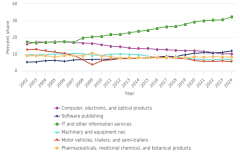
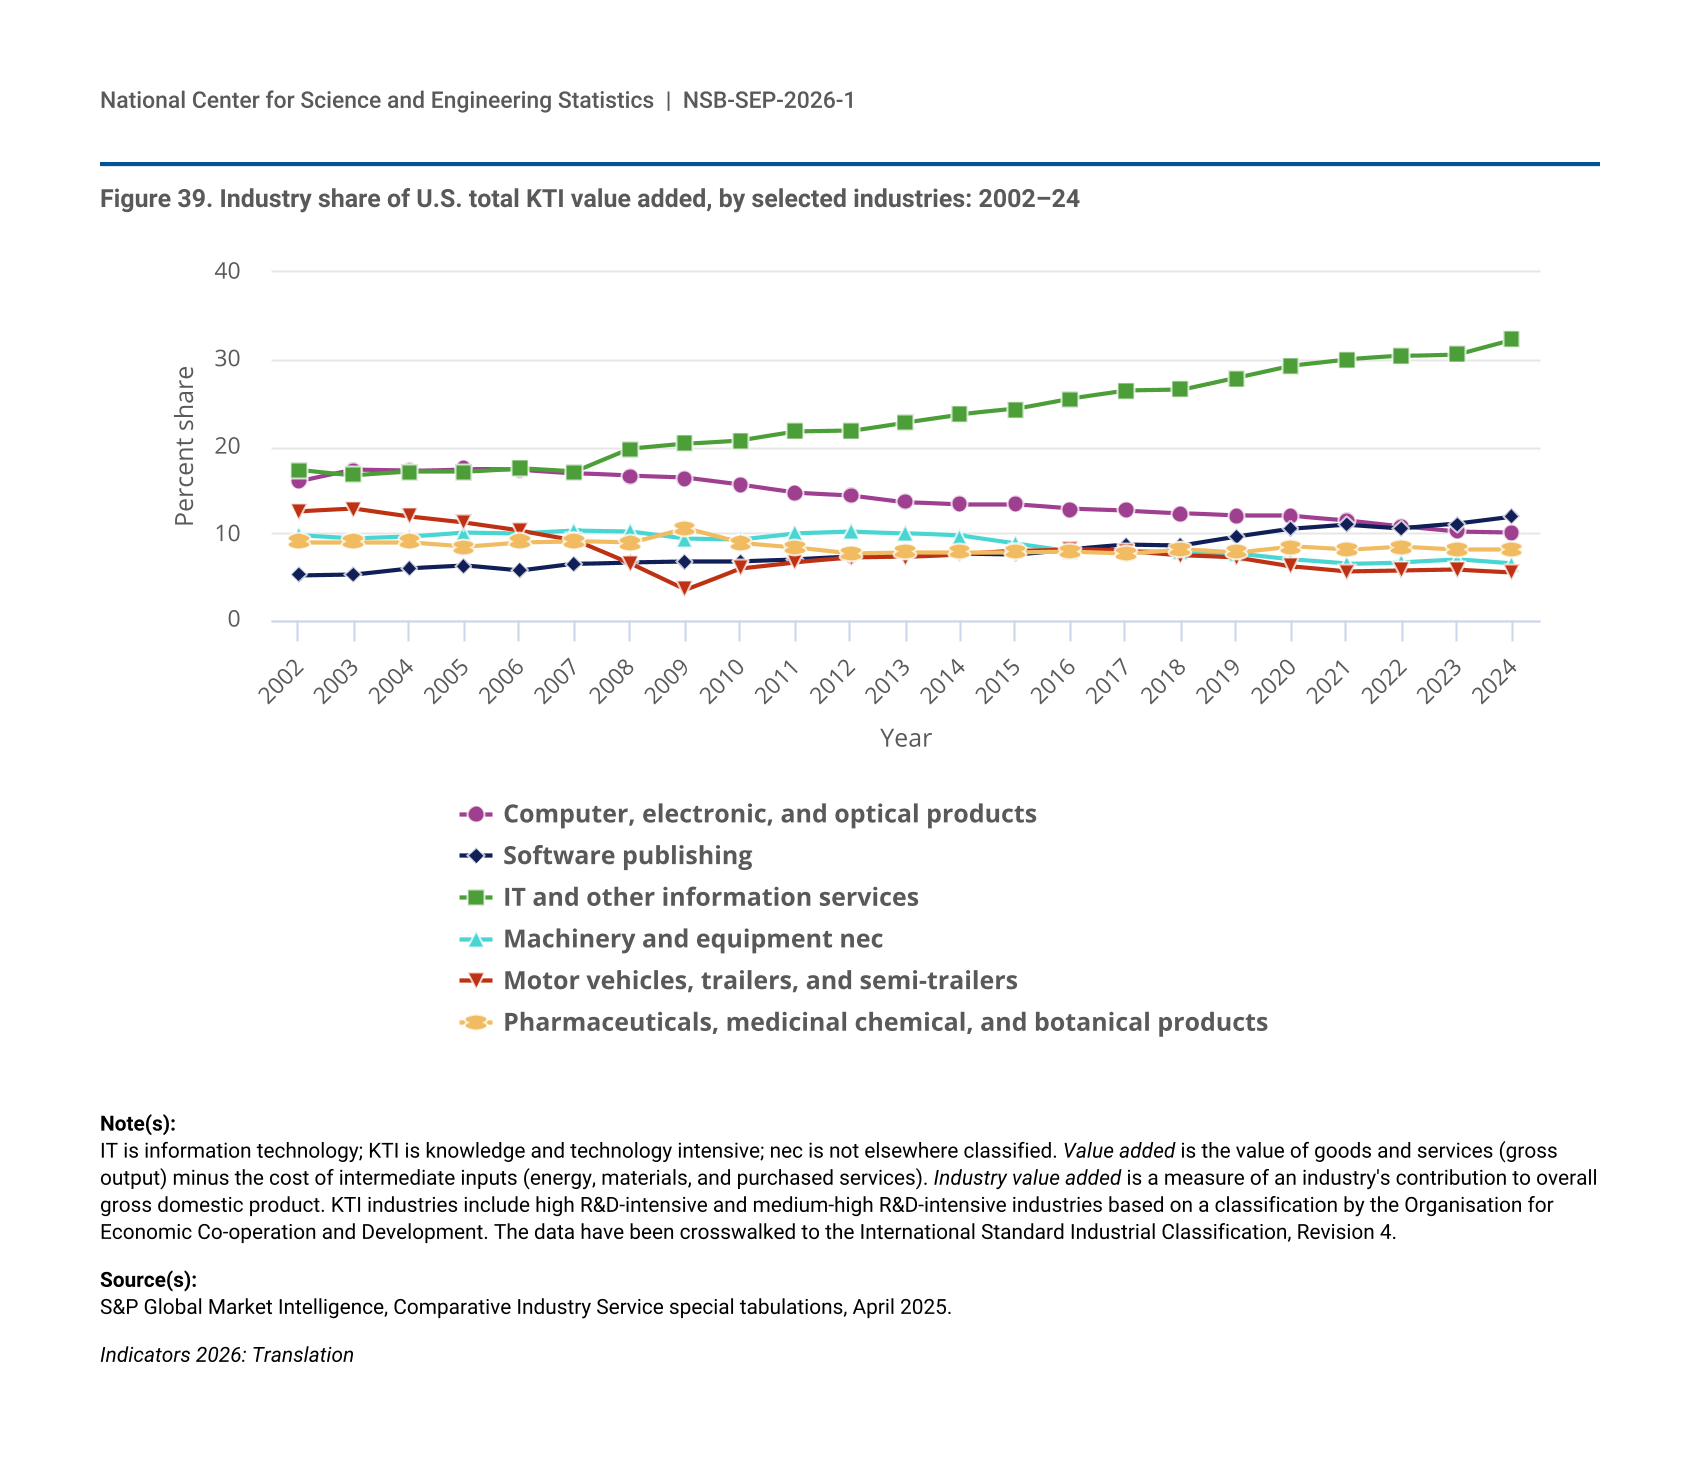
- In 2024, value added of U.S. KTI industries totaled $3.3 trillion and accounted for 11% of U.S. GDP. The information technology and other information services industry has been the largest U.S. KTI industry by value added since 2006, growing from 17% of total KTI value added in that year to 32% in 2024.
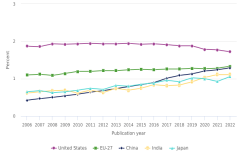
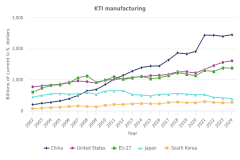
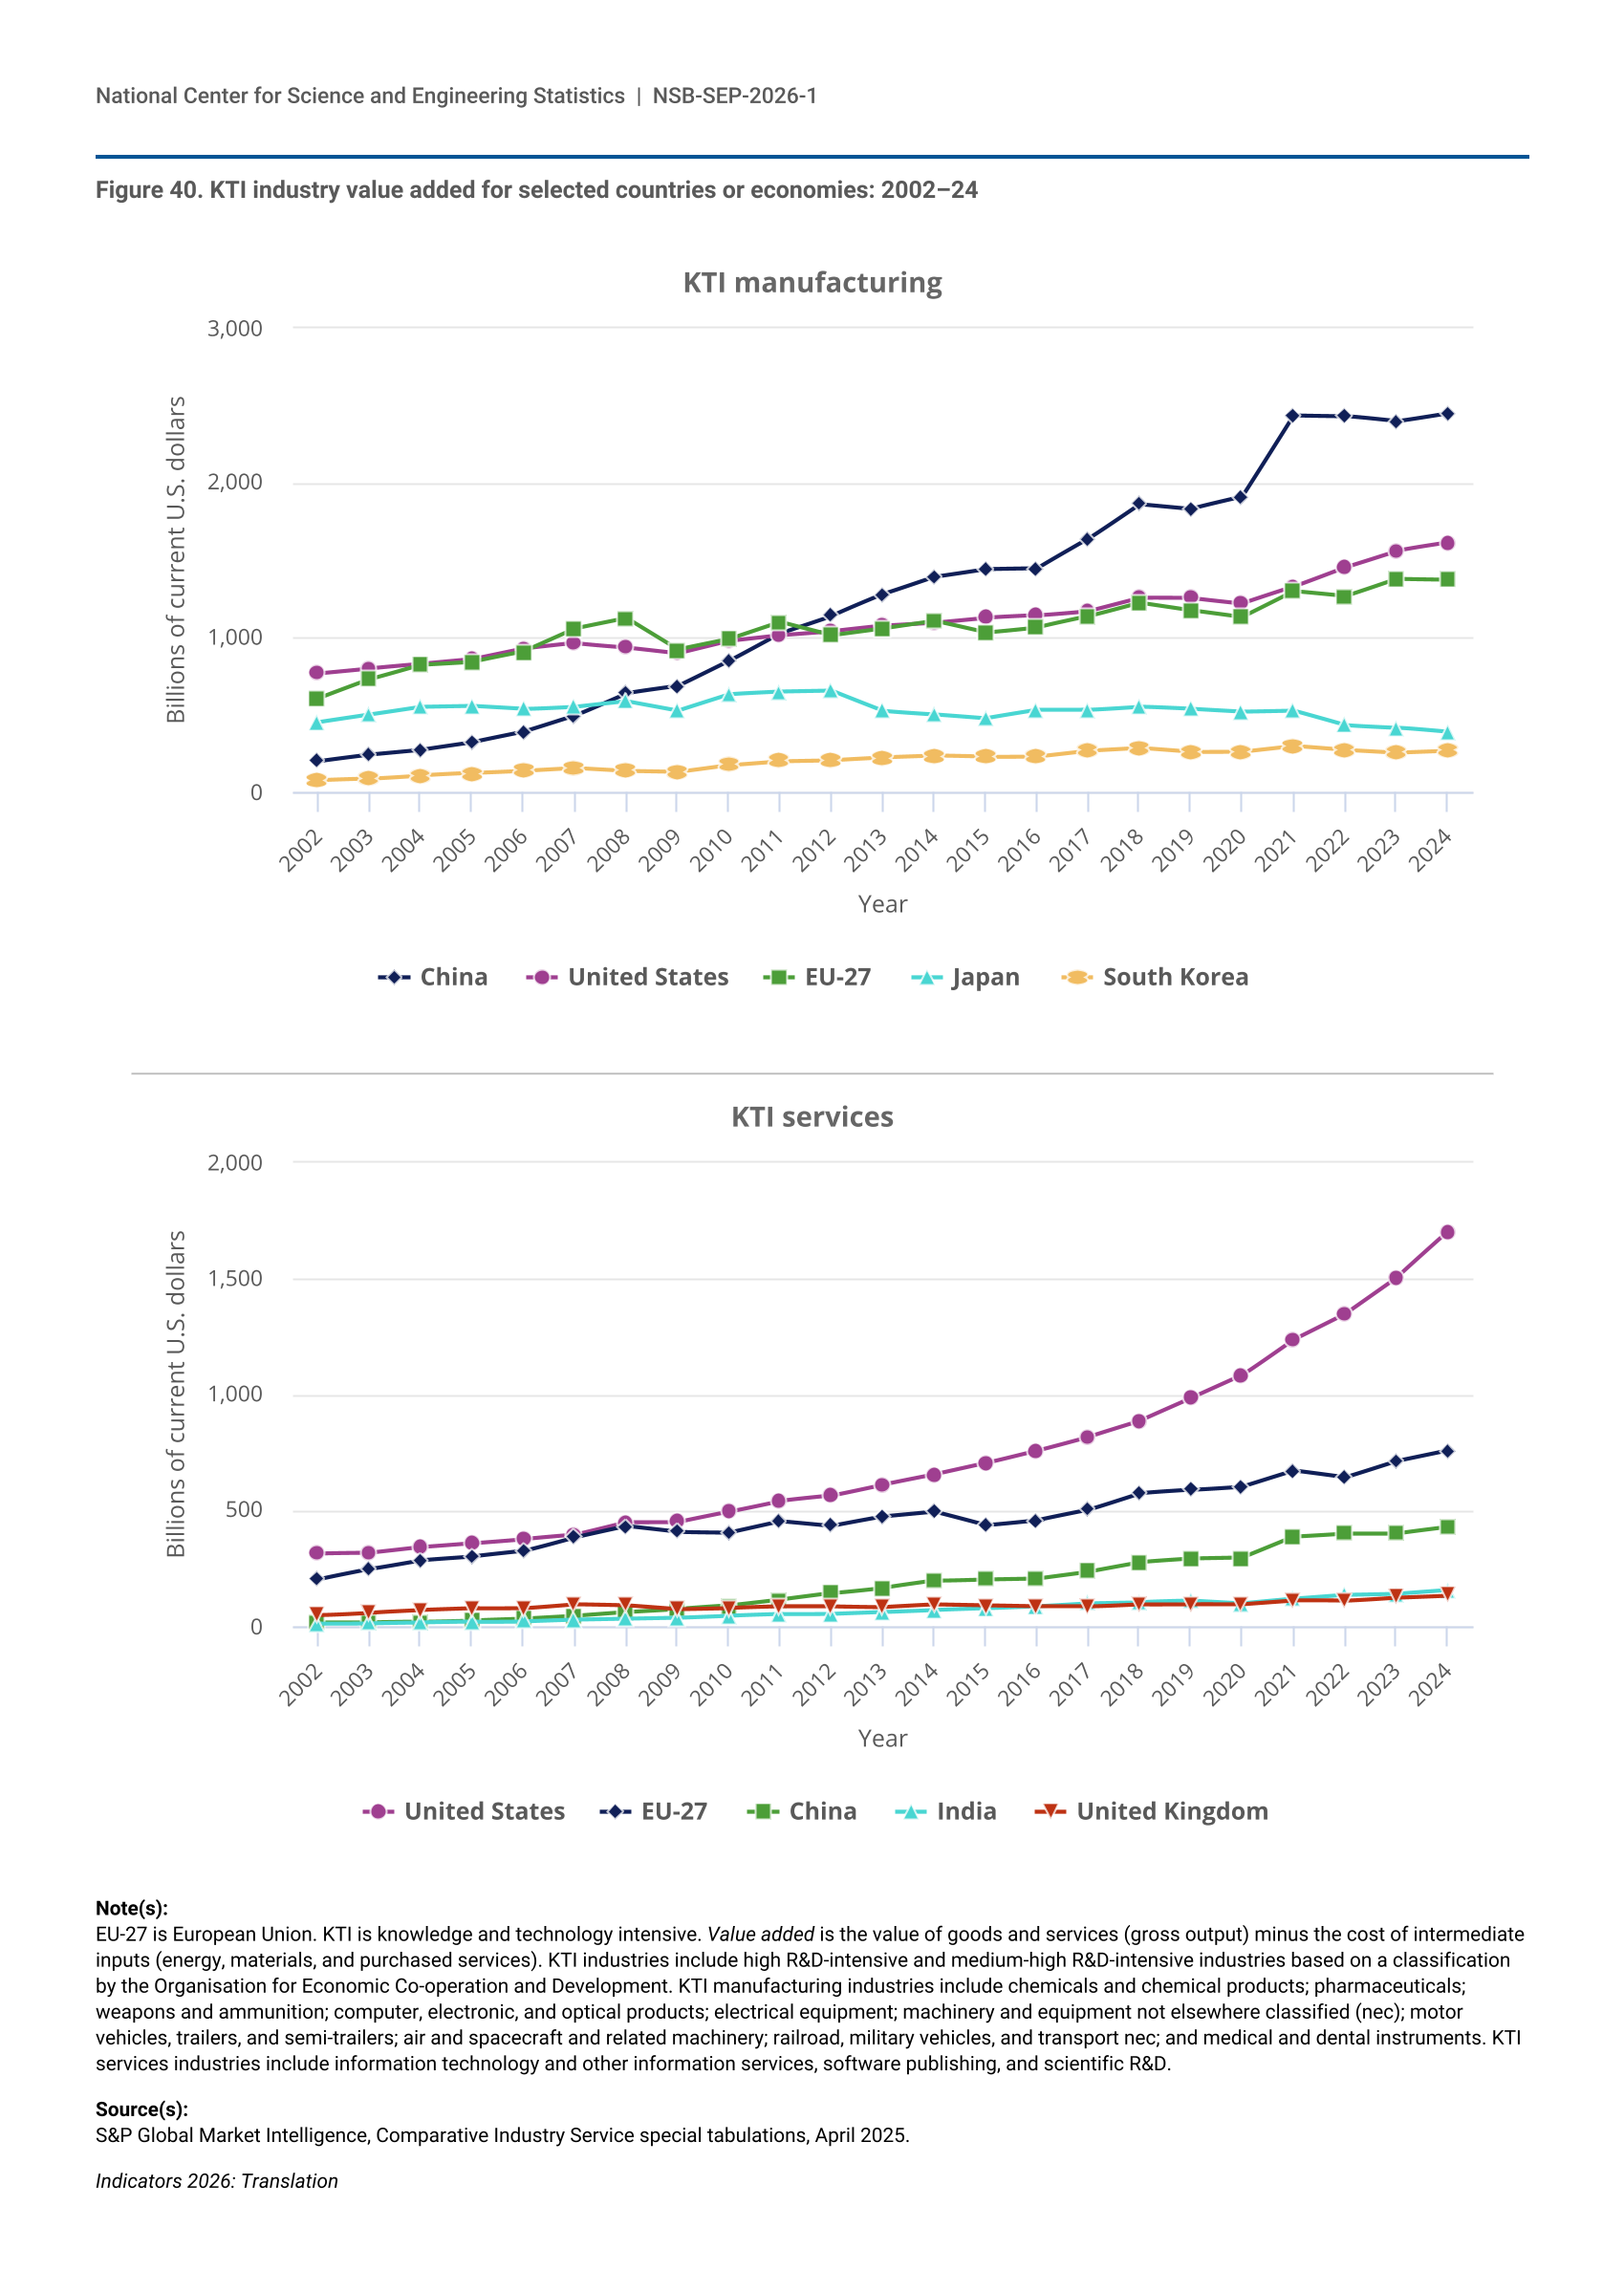
- KTI industries worldwide totaled $11.7 trillion in value added in 2024. The United States and China were the top two producers of KTI output globally, with 28% and 25% of the world total, respectively, followed by the EU-27 (18%).
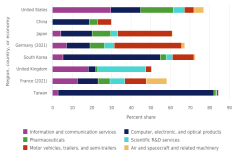
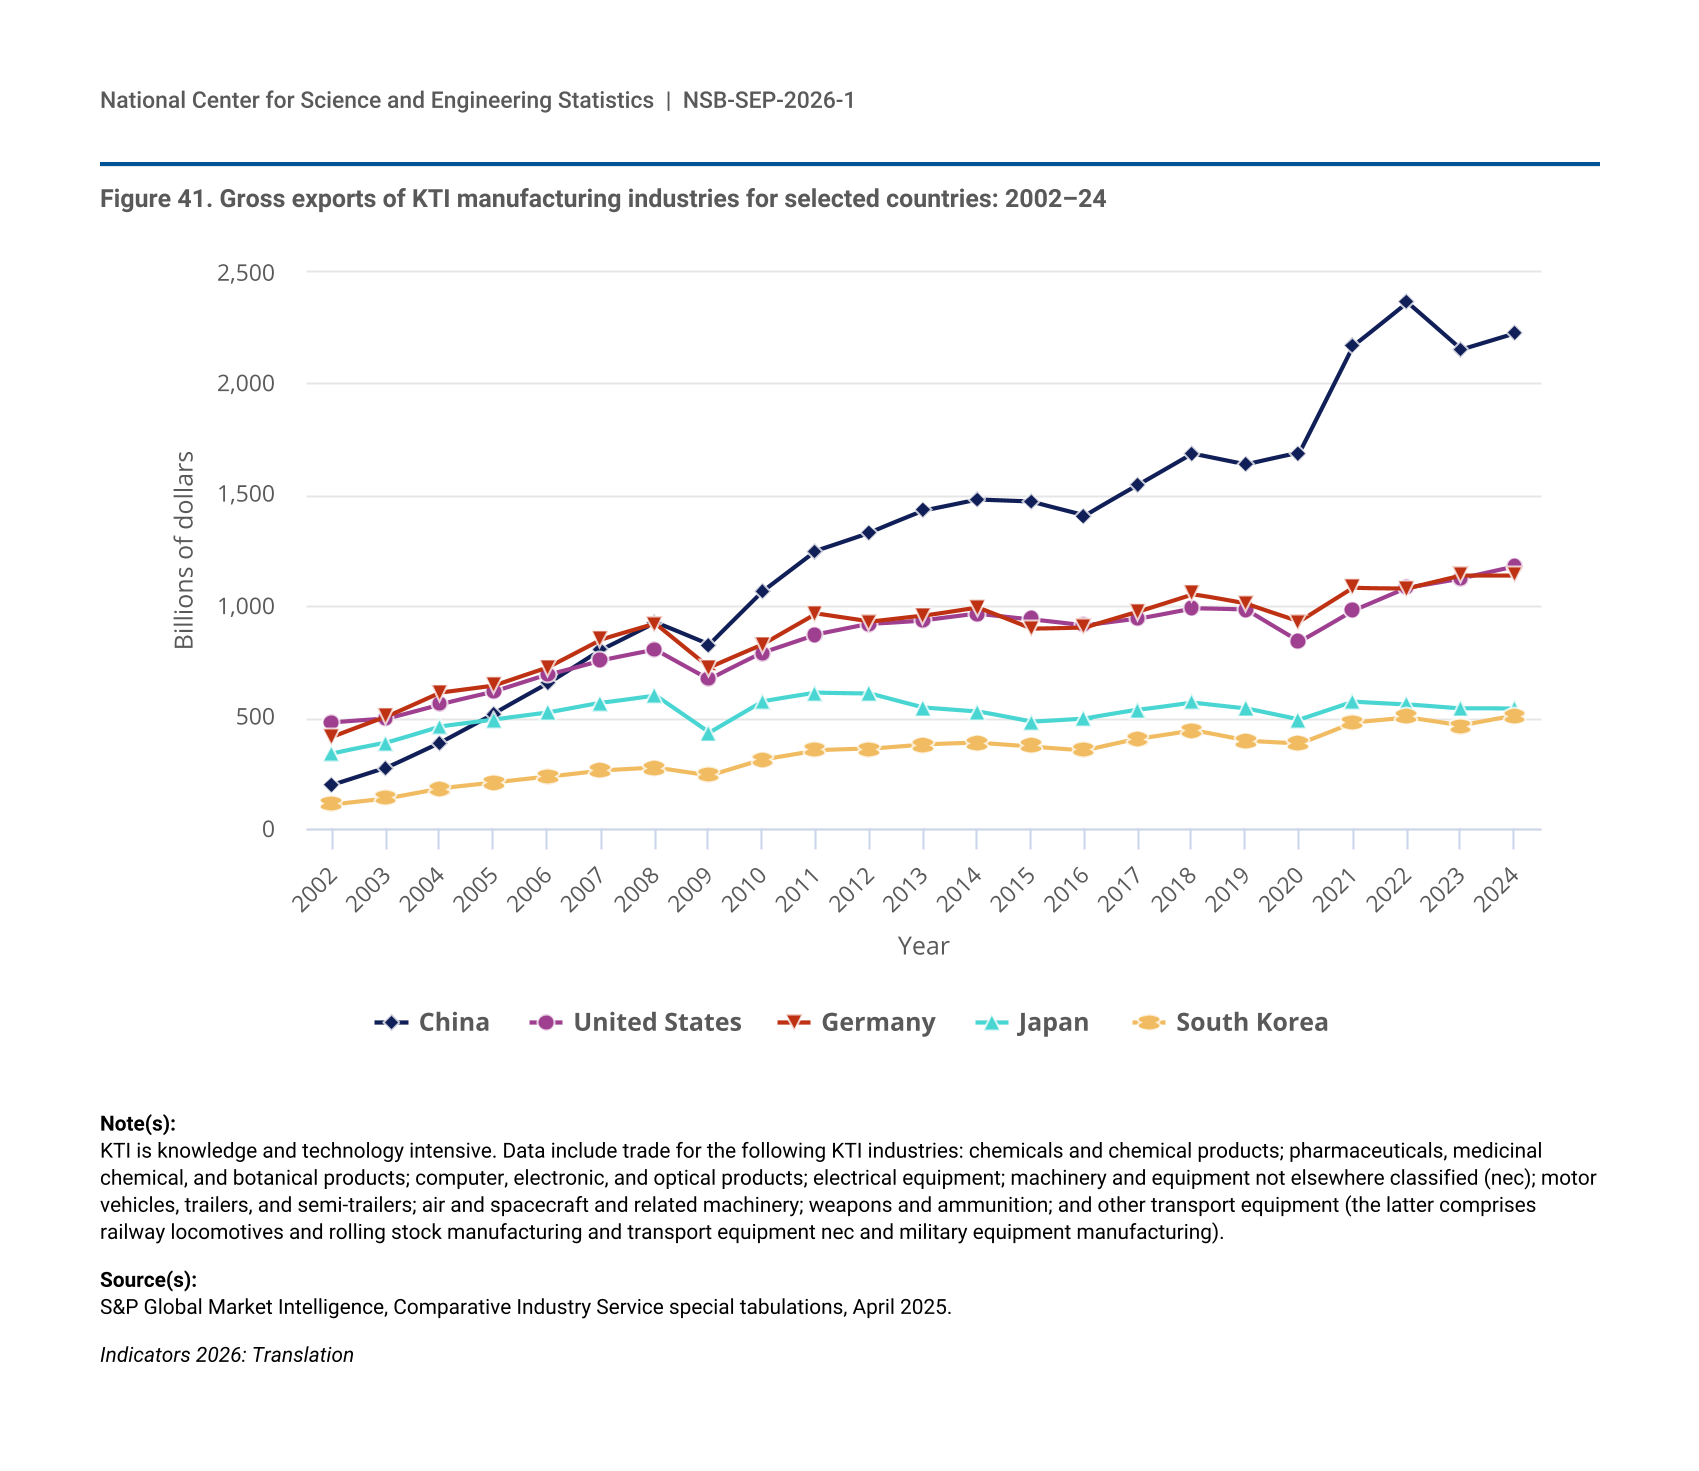
- China is the world leader in KTI manufacturing, with $2.4 trillion in value added in 2024, double its 2012 level. It has been the largest global exporter of KTI manufactured goods since 2008. In 2024, China had $2.2 trillion in KTI manufactured goods exports, accounting for 19% of the world total. The United States and Germany had $1.2 trillion and $1.1 trillion in exports, respectively.
- The United States held a dominant share of KTI services production, with $1.7 trillion in value added in 2024, accounting for a larger share of the global total (43%) than the EU-27 (19%) and China (11%) combined.
Innovation
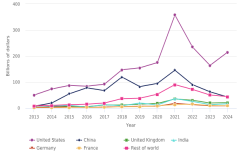
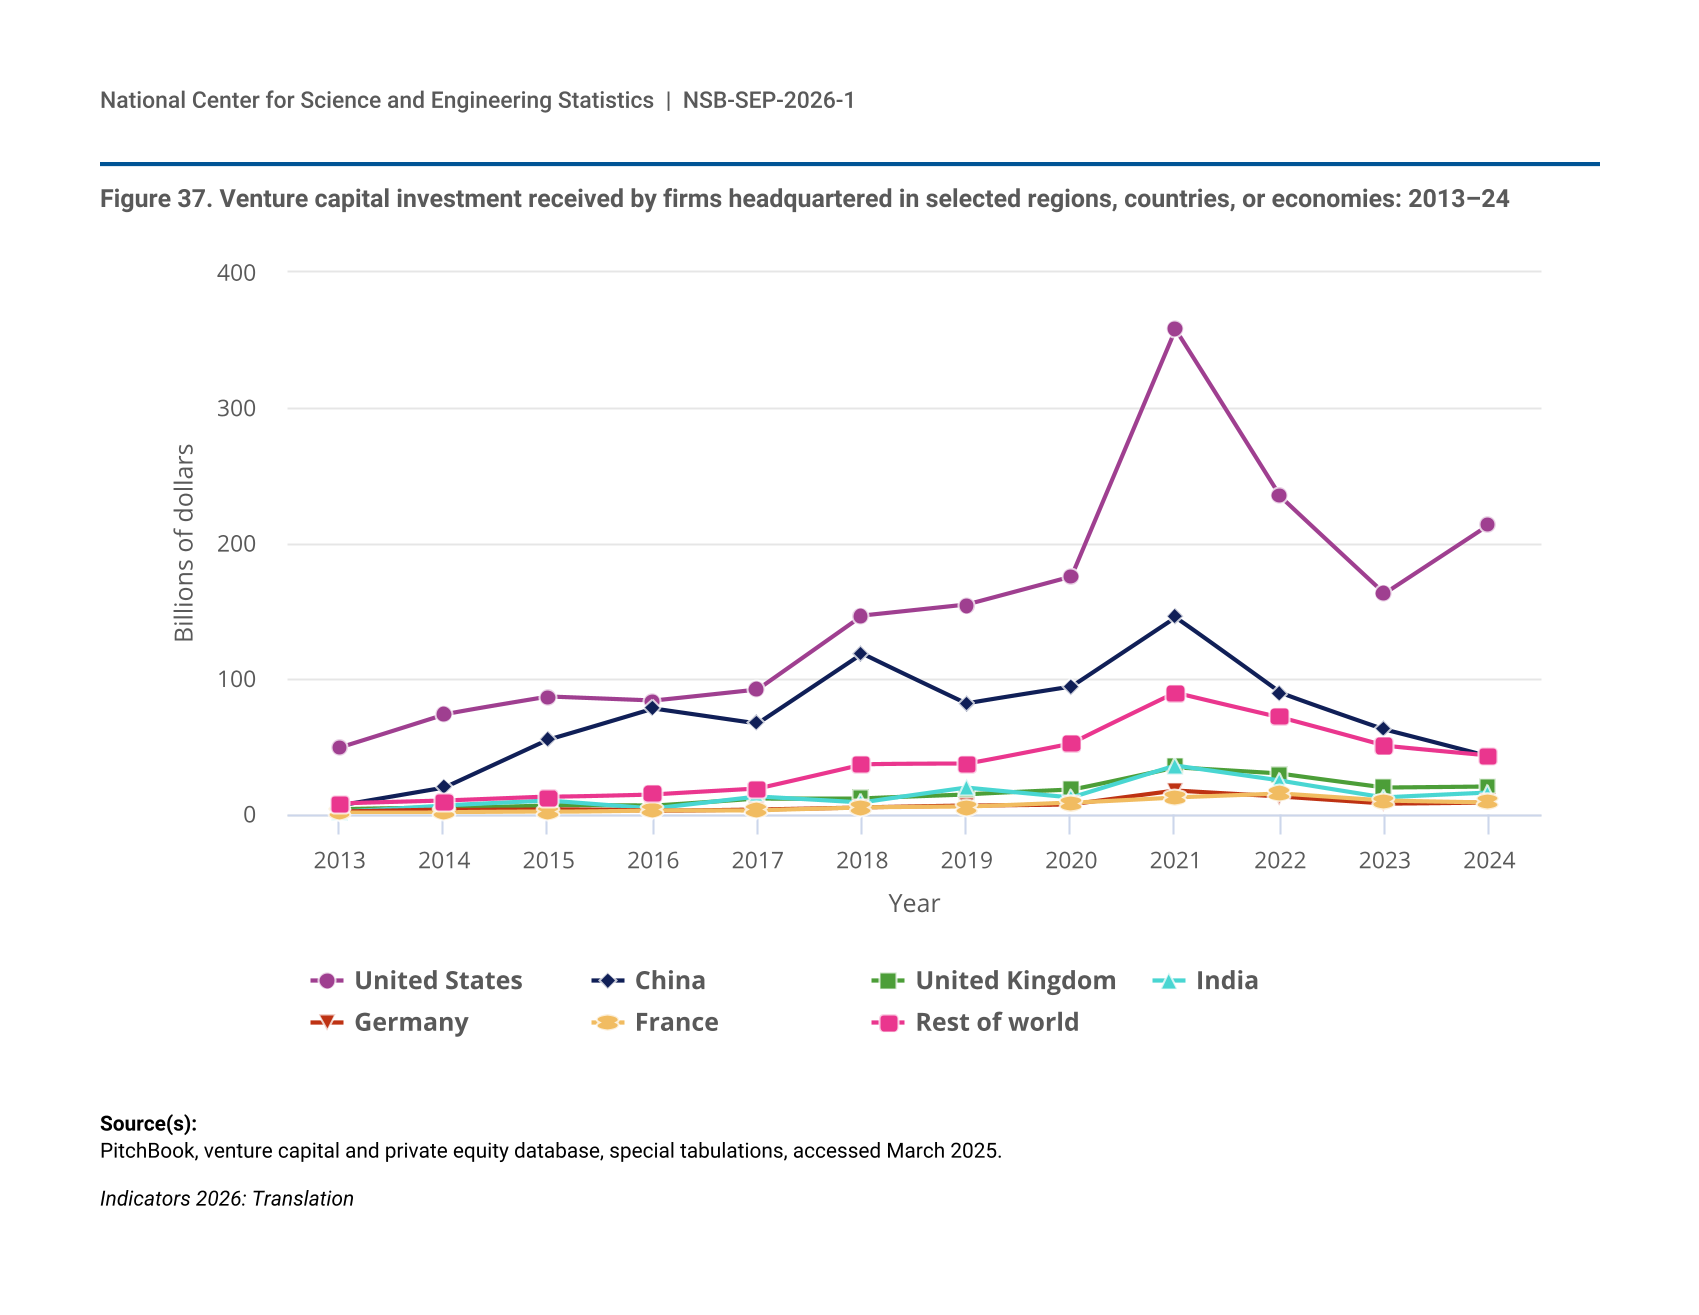
- Worldwide VC investment reached $354 billion in 2024, up from $327 billion in 2023 but roughly half of its peak value of $694 billion in 2021. Firms based in the United States accounted for 60% of global VC investment in 2024, followed by firms based in China (12%).
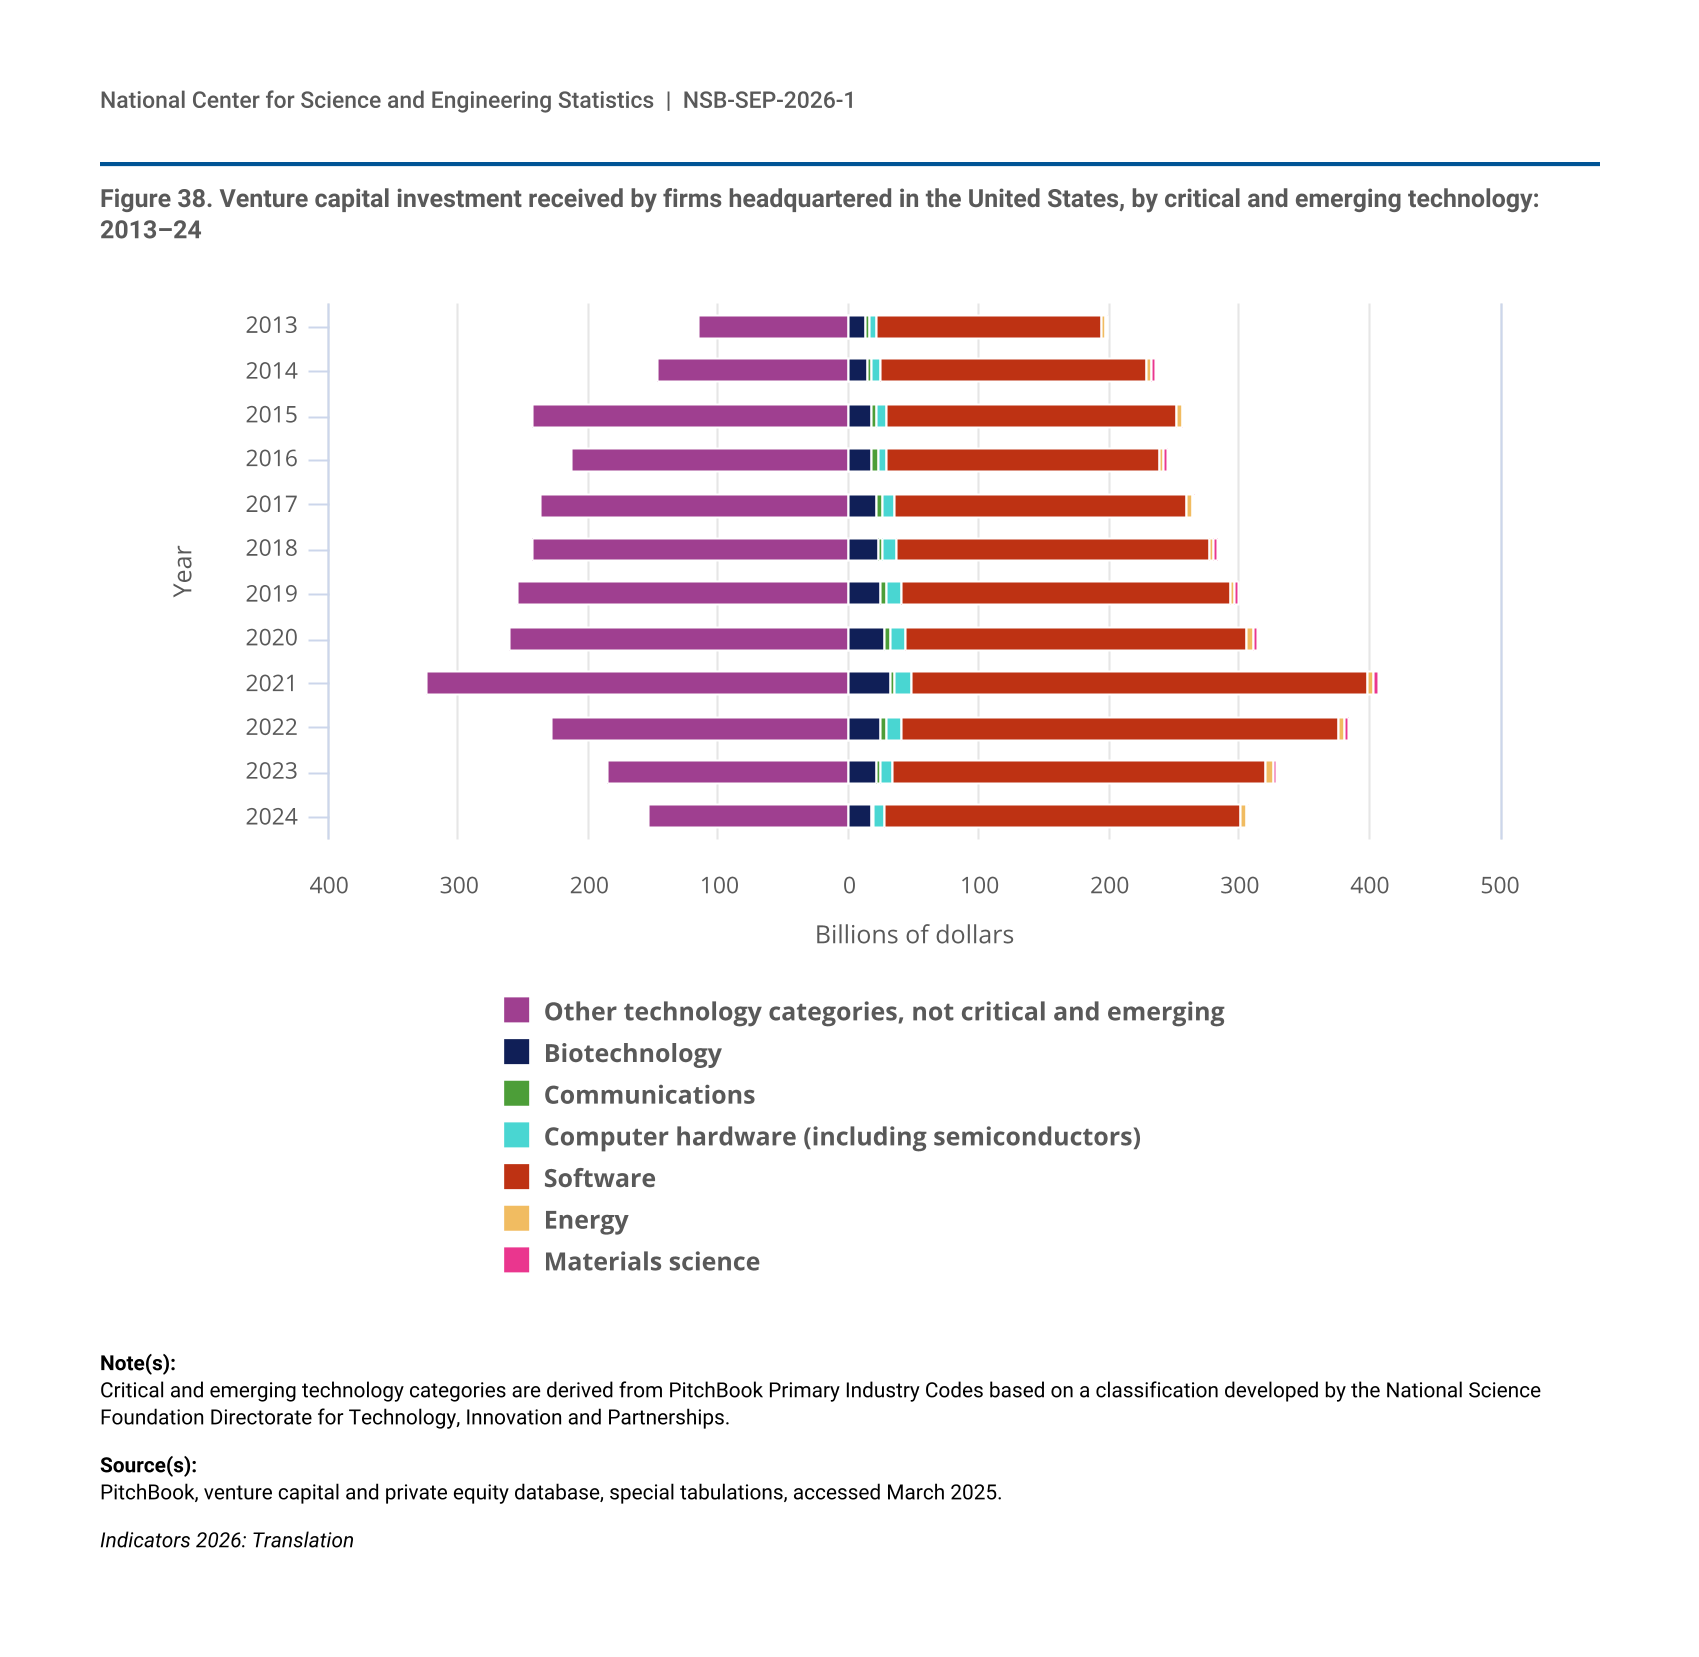
- VC investments in U.S. firms in CET areas accounted for two-thirds of total U.S. VC investment in 2024. Software firms received over 80% of funding for companies in CET areas and between 44% and 59% of total U.S. VC funding each year from 2013 to 2024.
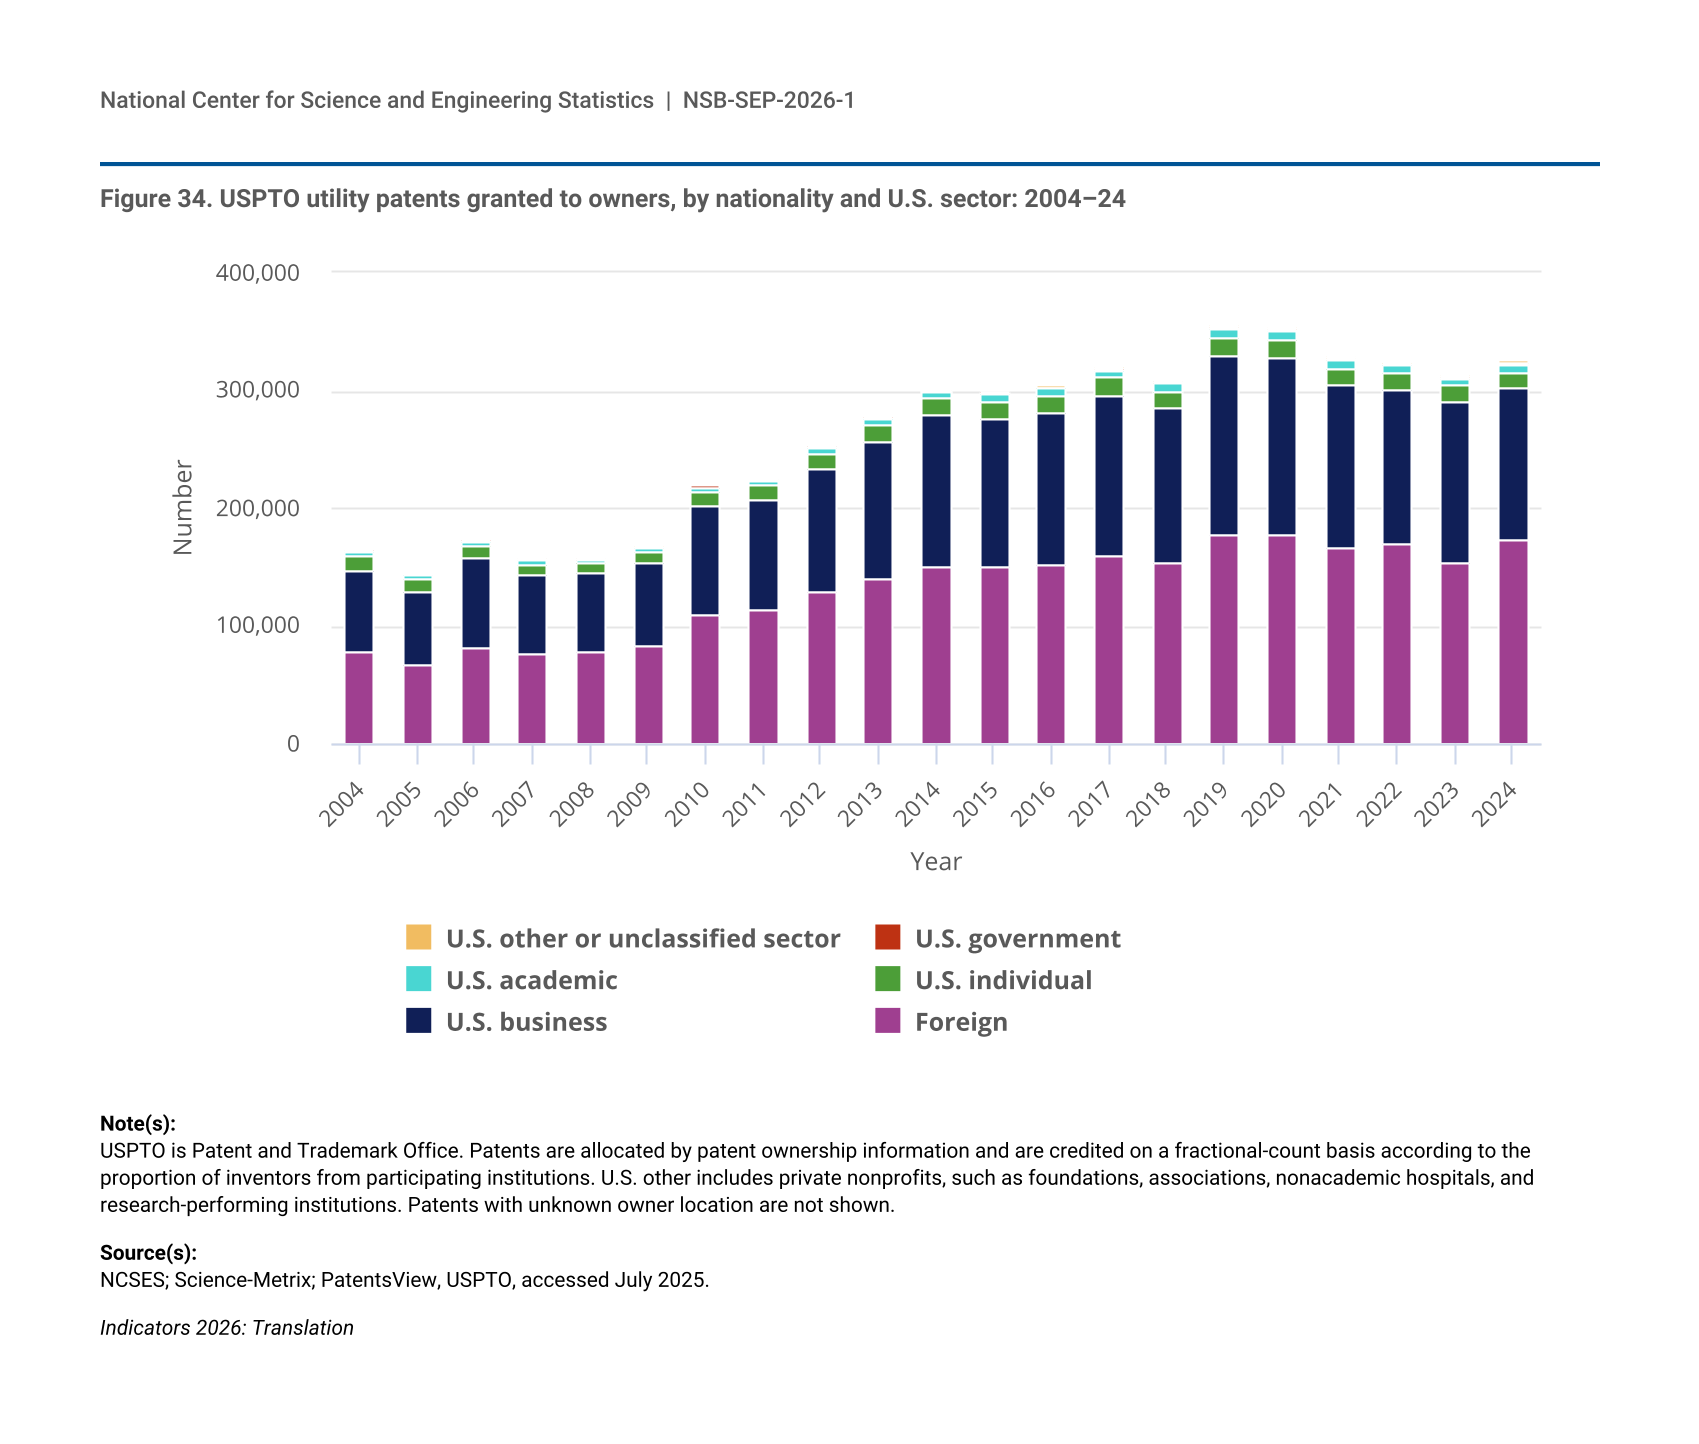
- In 2024, the Patent and Trademark Office (USPTO) awarded 326,000 utility patents—which are issued for a new process, machine, manufacture, or composition of matter. Of these, 47% were awarded to U.S. applicants. Businesses received the largest share of patents awarded to U.S applicants (85%).
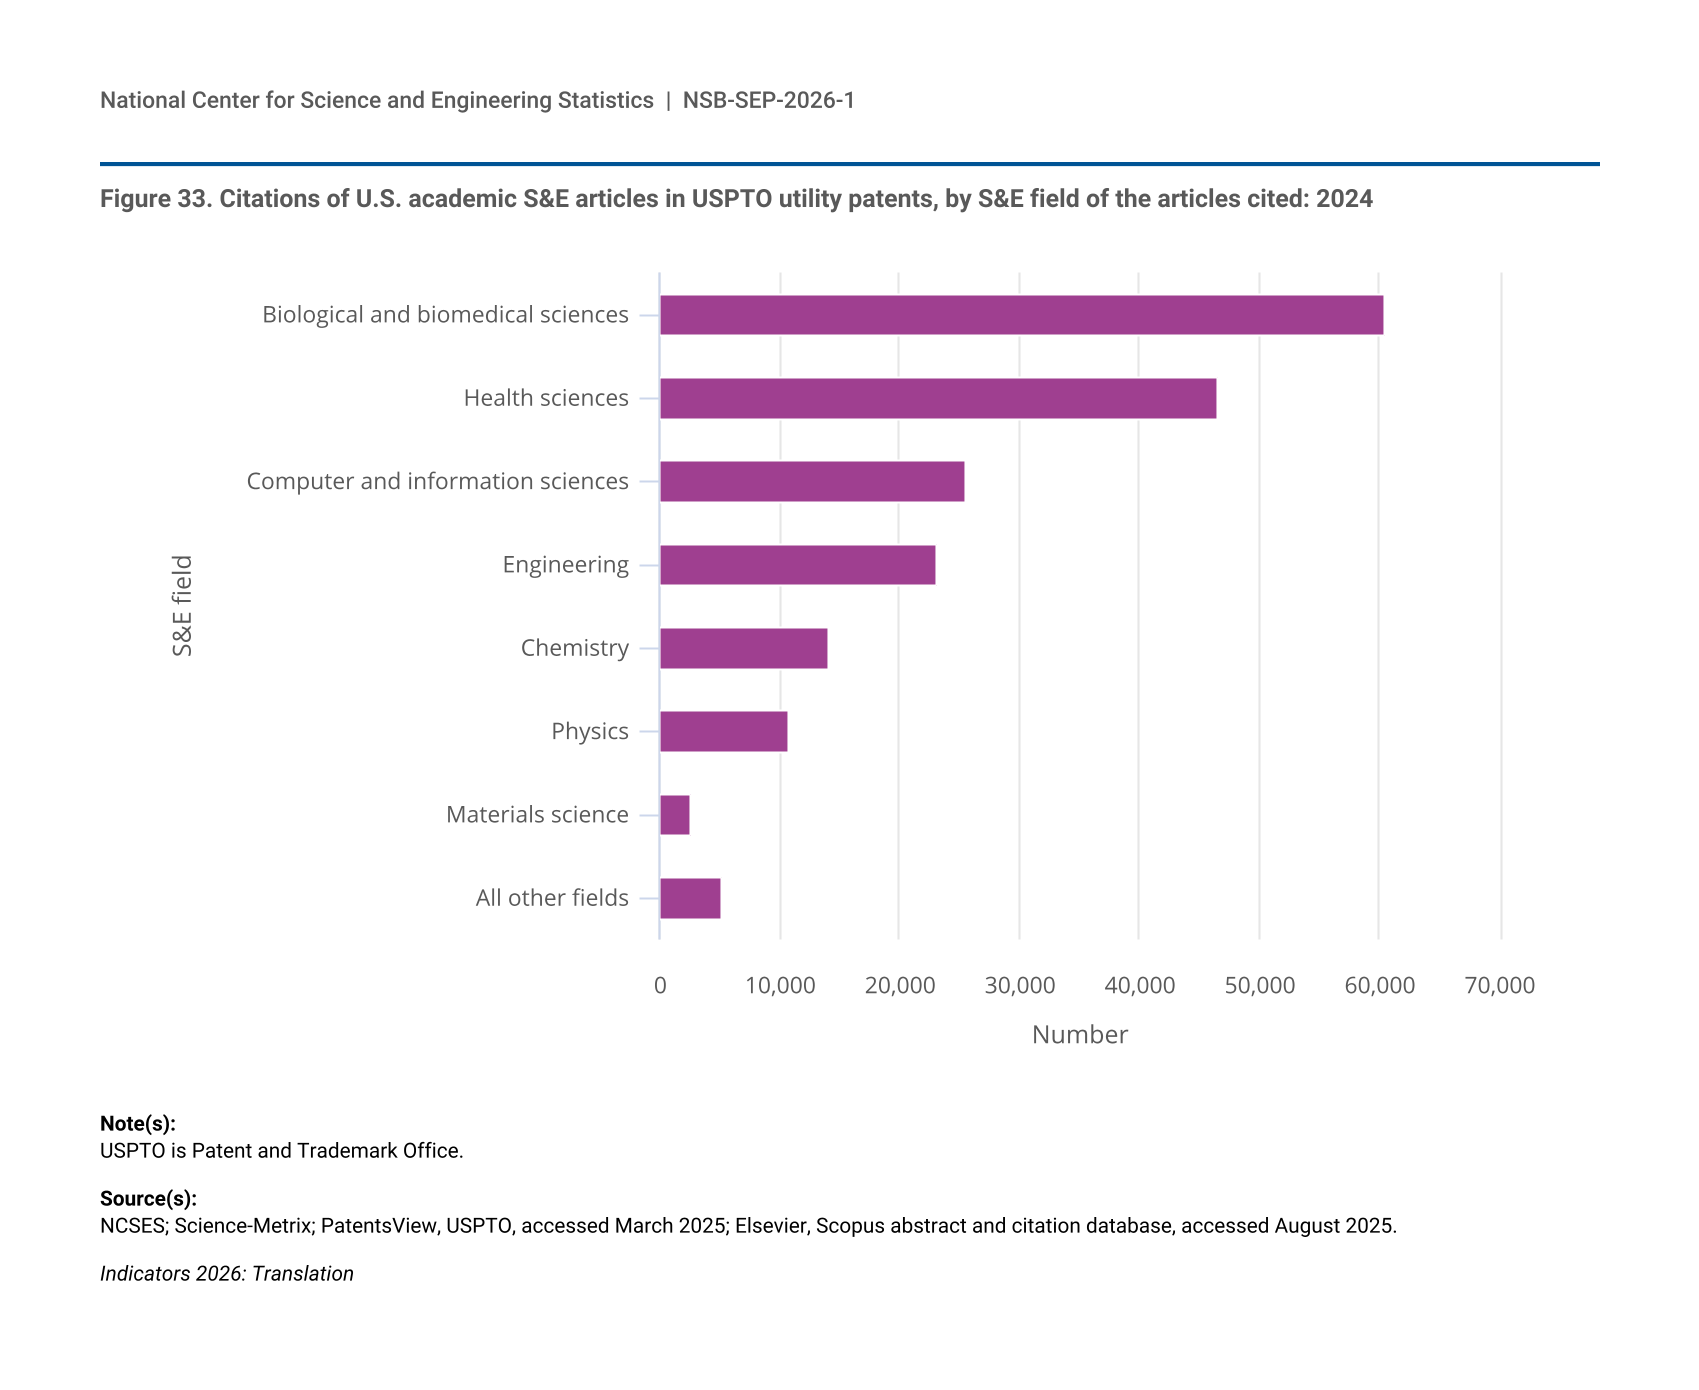
- The 326,000 USPTO patents issued in 2024 contained about 642,000 citations to S&E articles, indicative of scientific contributions to patented inventions. Citations to S&E articles by U.S. authors were most commonly in biological and biomedical sciences and in health sciences.
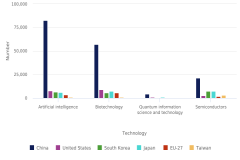
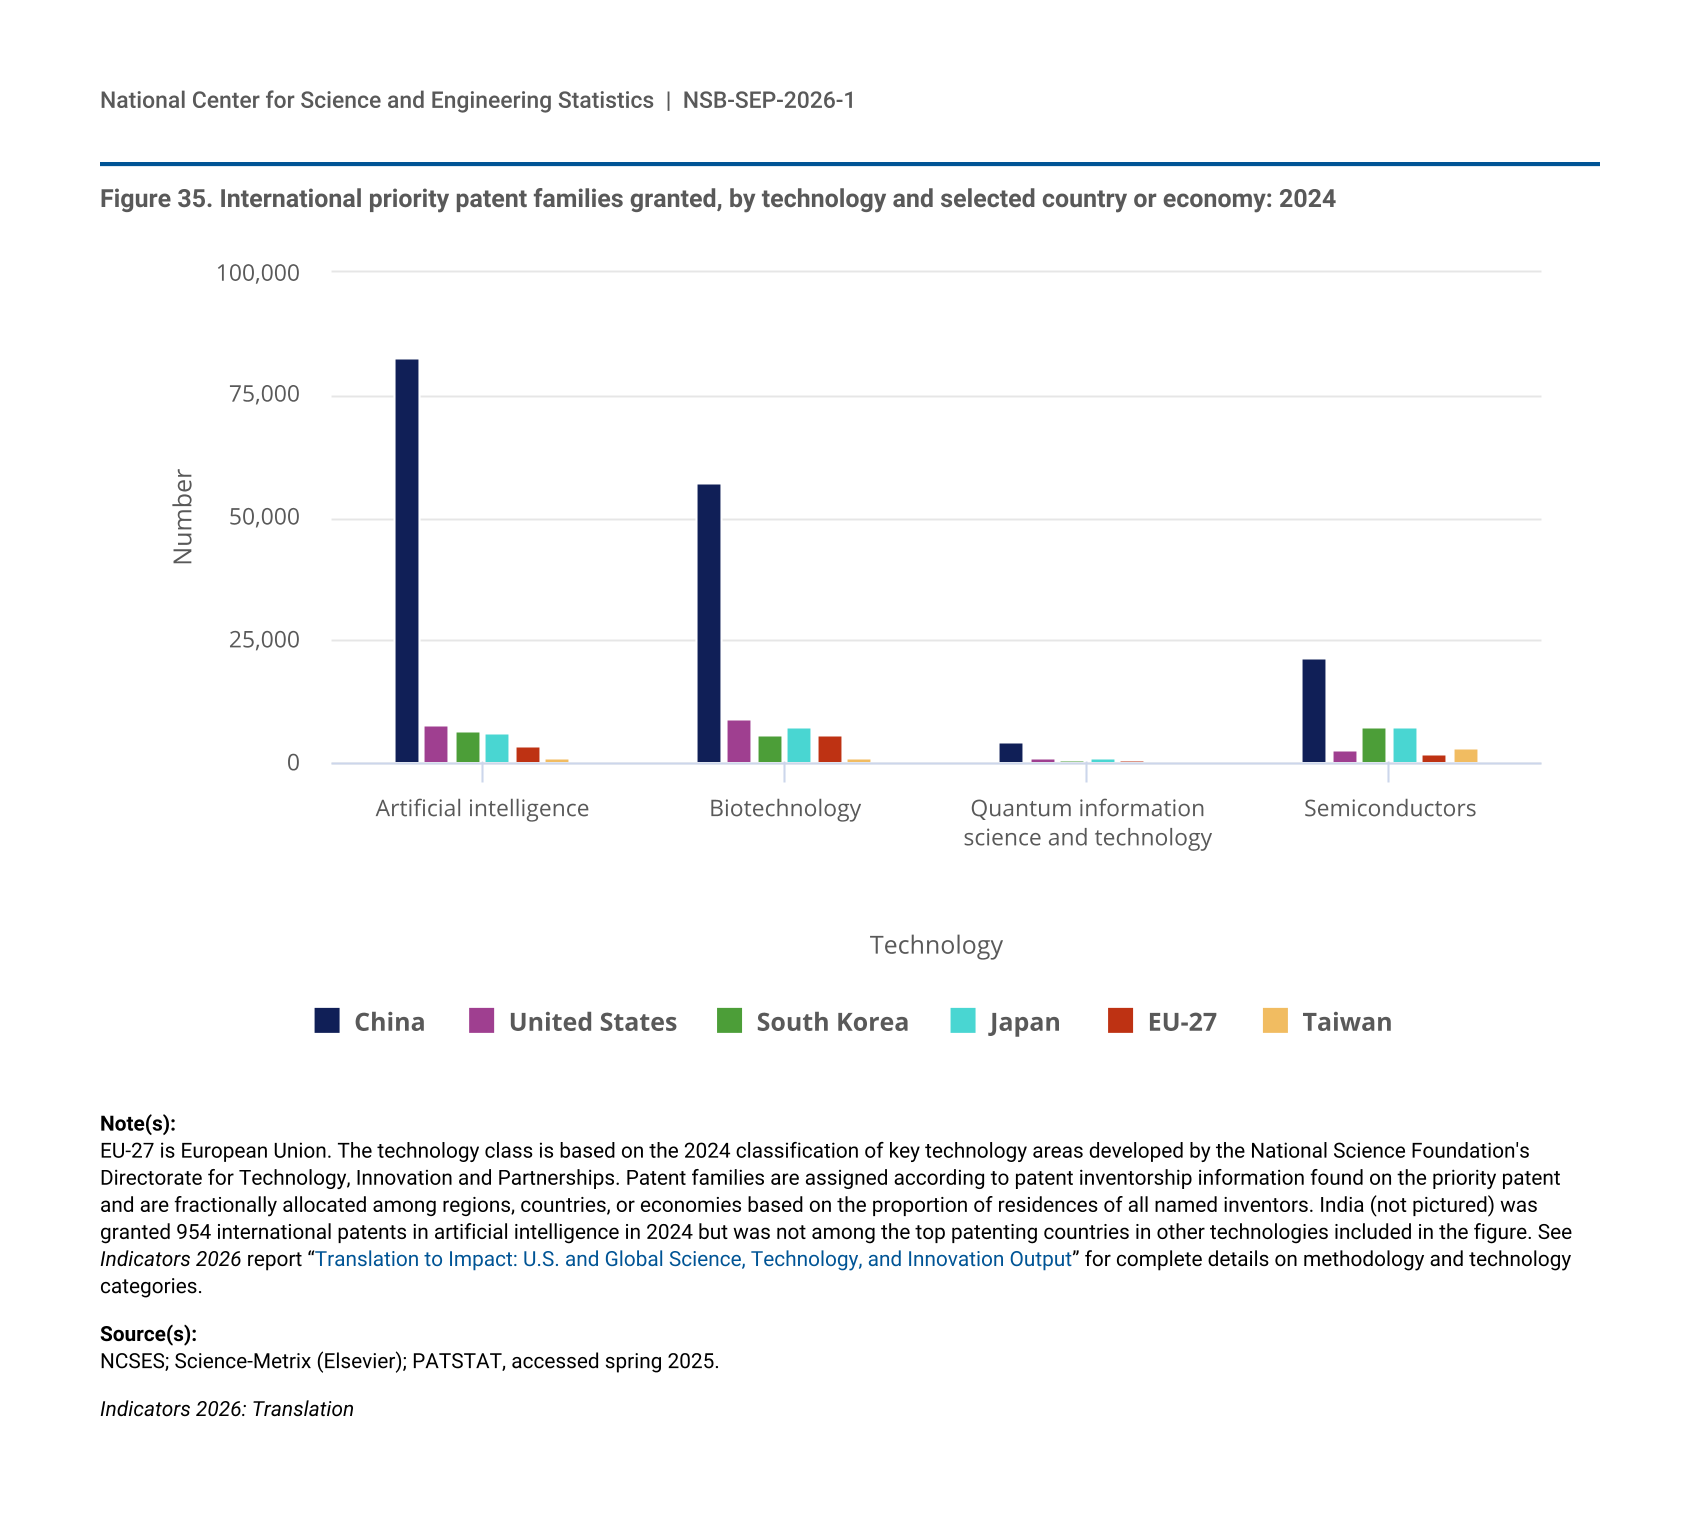
- In 2024, inventors in China were granted the most international patents (awarded in any jurisdiction globally and known as priority patent families) in AI, quantum information science and technology, biotechnology, semiconductors, and nuclear technologies.
- In many CET areas, a greater share of international patents (priority patent families) awarded to U.S. inventors in 2021 were in the top 1% of cited patents, a measure of patents’ impact on subsequent invention, compared with those from China and the EU-27.
This report provides new data on the state of the U.S. S&E enterprise as well as data drawn from three Science and Engineering Indicators 2026 thematic reports: STEM Talent: Education, Training, and Workforce; Discovery: R&D Activity and Research Publications; and Translation to Impact: U.S. and Global Science, Technology, and Innovation Output. The “Executive Summary” presents key takeaways about STEM education and the STEM workforce, R&D activity, and the outputs of R&D and innovative activities. The “Overview” section discusses the major trends shaping the contours of the U.S. S&E enterprise since the year 2000, including executive and legislative branch activities emphasizing CETs. It also provides a synthesis of the current state of the S&E enterprise drawn from the thematic sections that follow it. Those sections provide in-depth detail about the current state of STEM education and the STEM workforce, R&D activity, and the outputs of R&D and innovative activities in the United States and in an international context.