 An official website of the United States government
 Notes
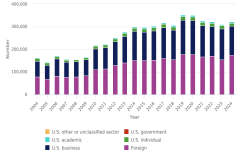
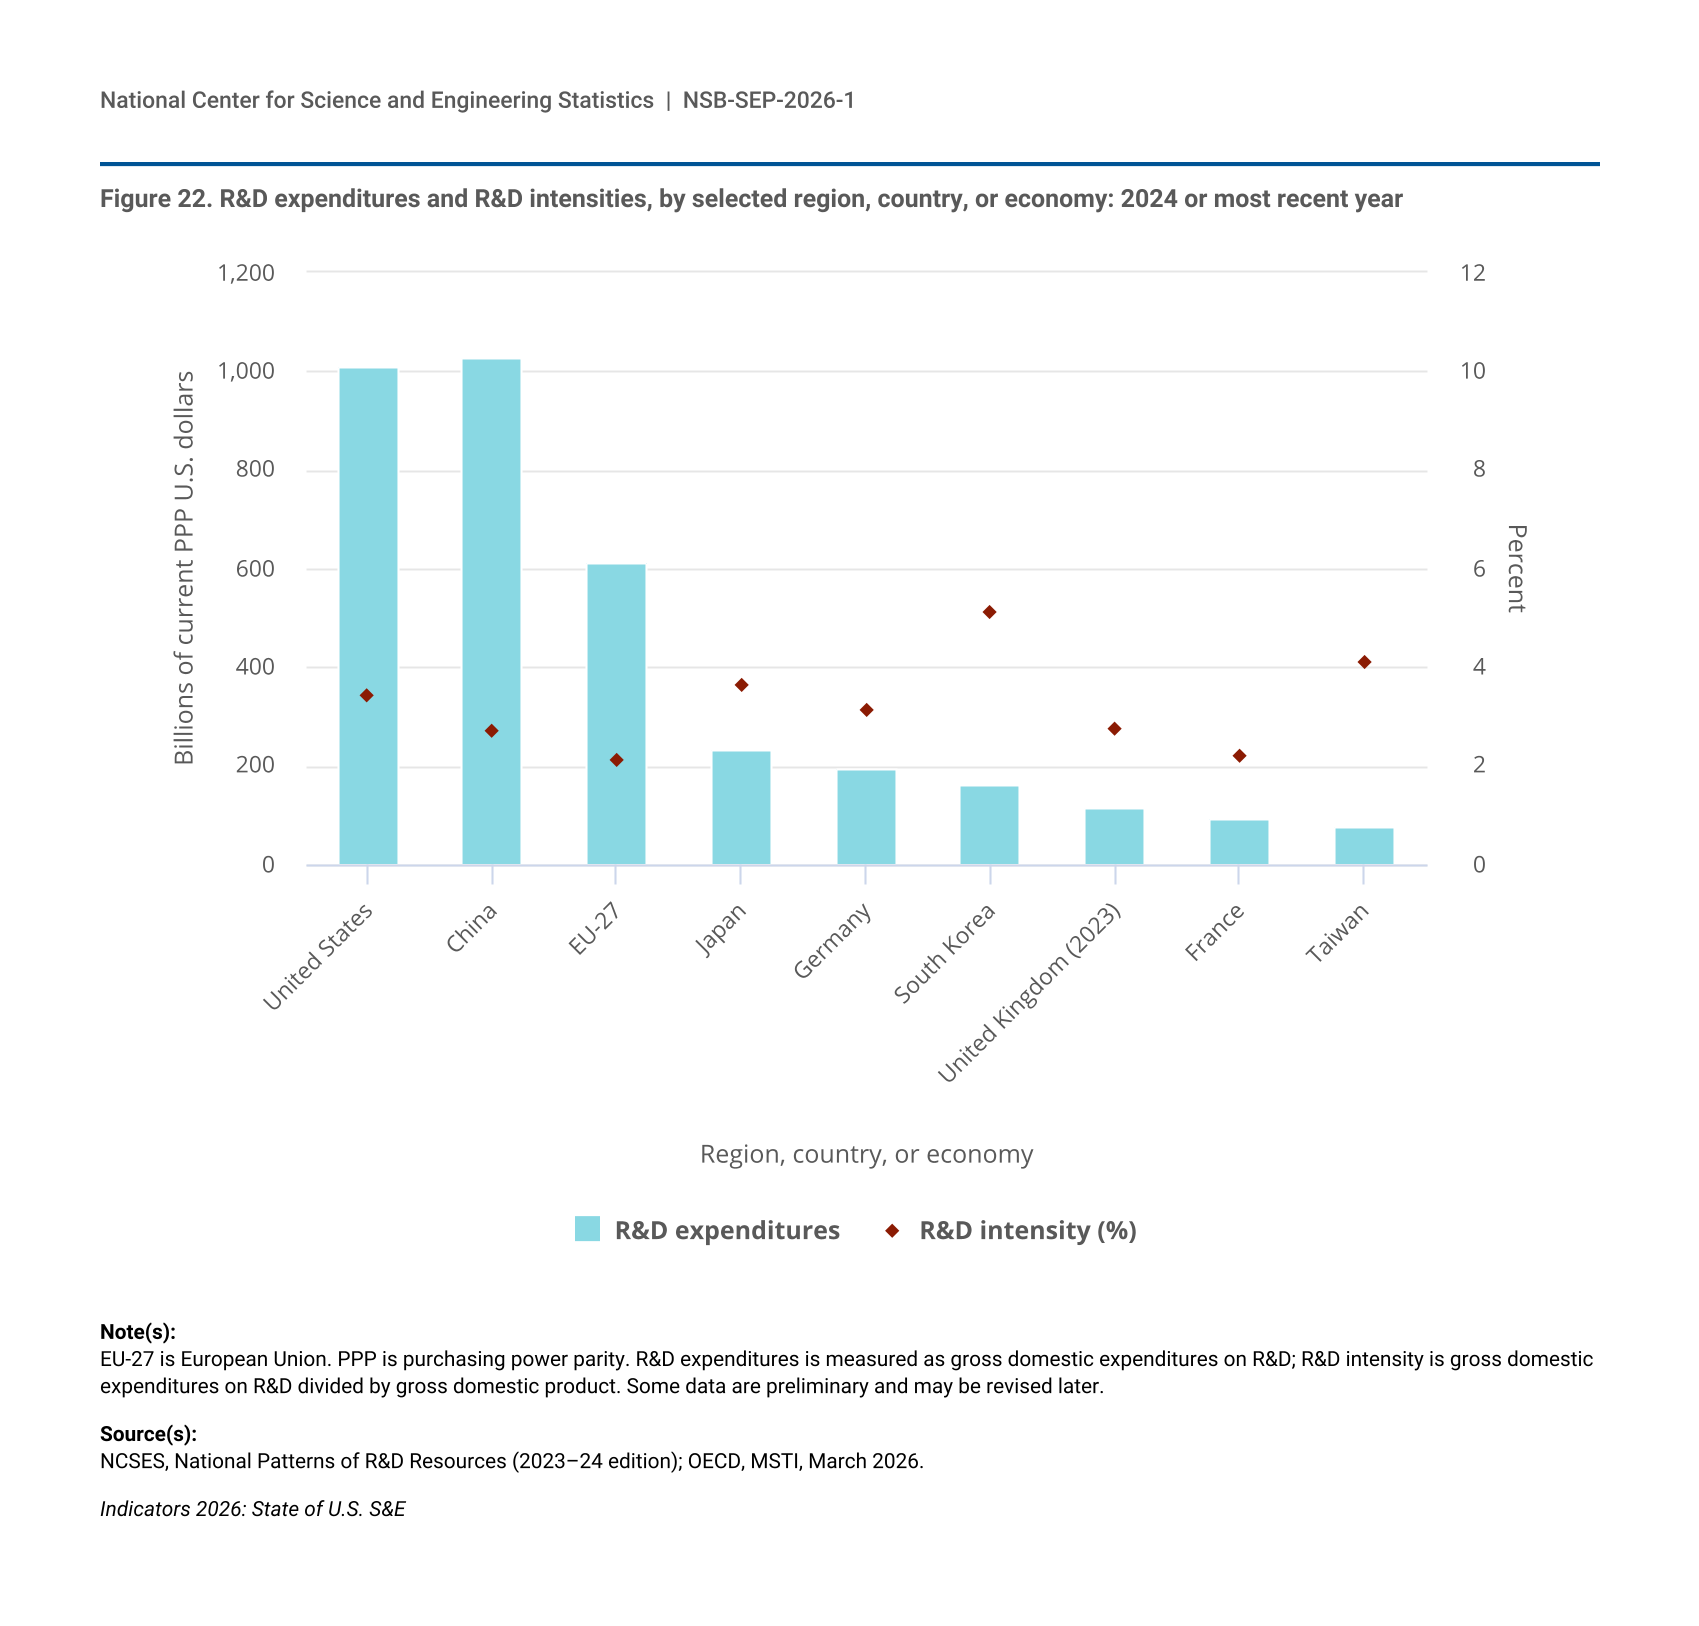
1 Revisions in 2023 U.S. GERD reported here reflect the use of reported data rather than respondent reported projected data and partial year estimates for data reported to the National Center for Science and Engineering Statistics (NCSES) on a fiscal year basis that were used in the Indicators 2026 report “Discovery: R&D Activity and Research Publications.” Data for 2024 are estimates based mainly on findings from the 2023 sectoral R&D expenditure surveys, preliminary information from the 2024 sectoral R&D expenditure surveys, and evident recent trends. They are likely to be revised.
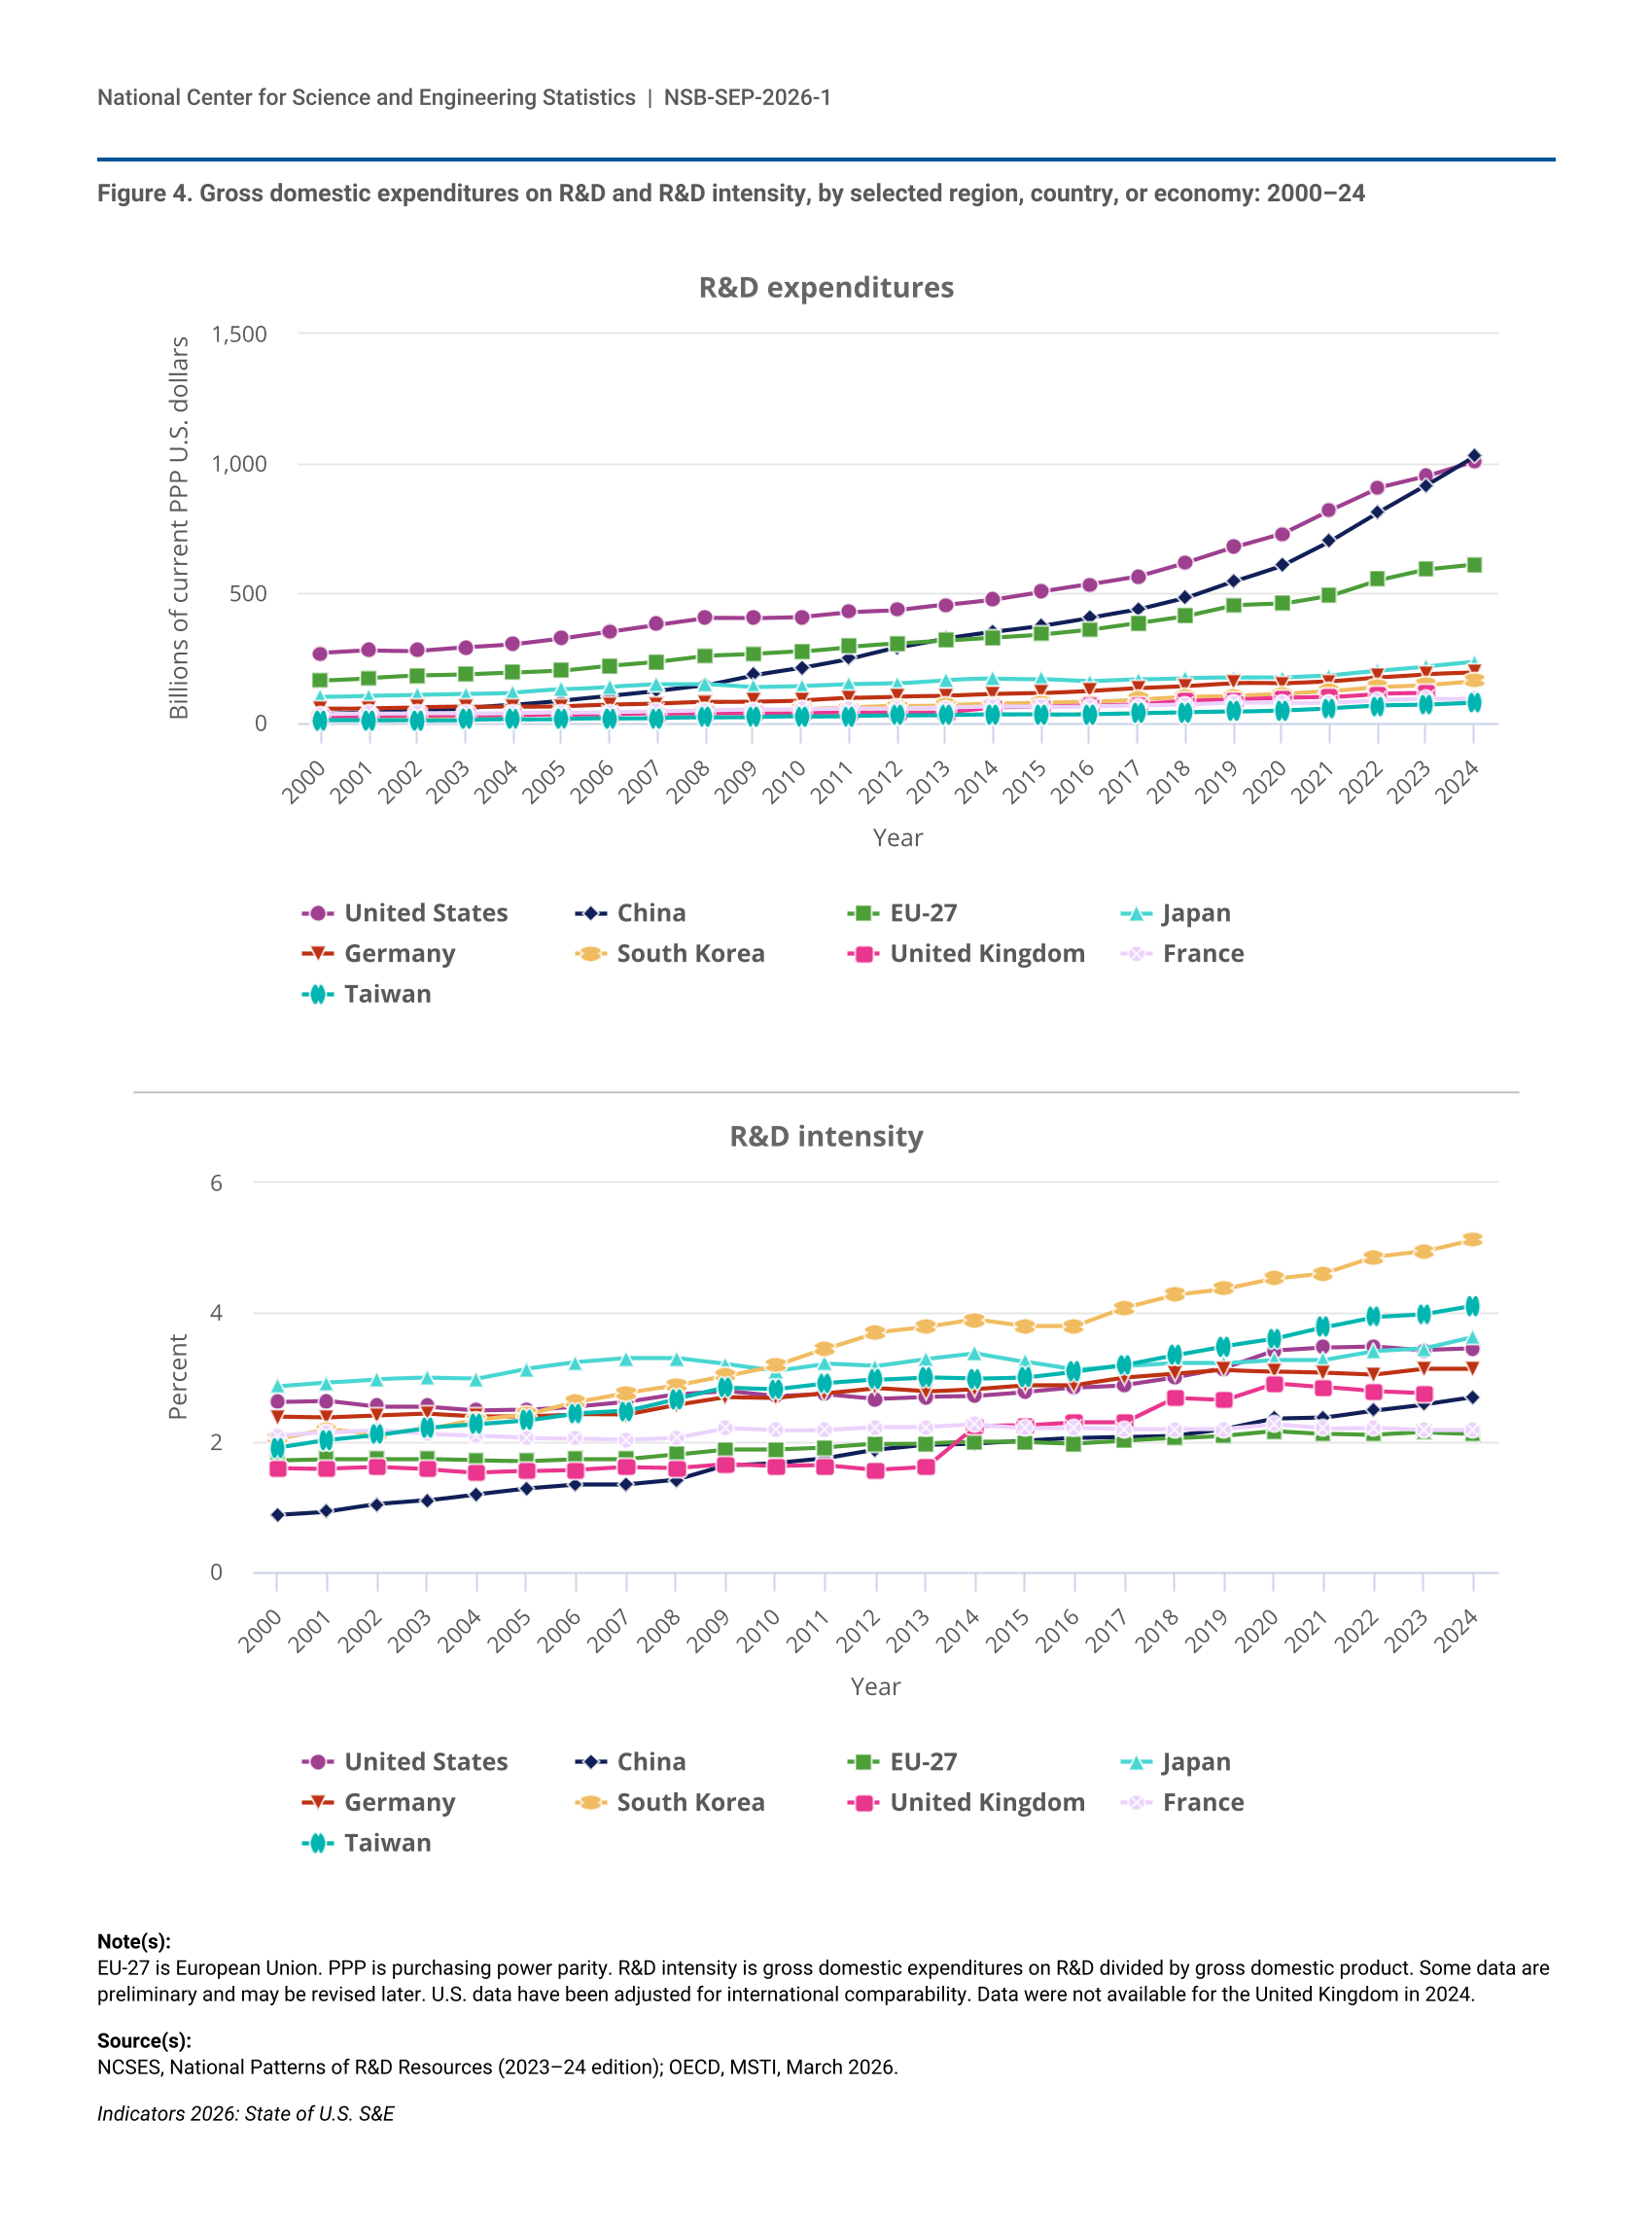
2 U.S. GERD as reported by the Organisation for Economic Co-operation and Development (OECD) differs slightly from the U.S. total domestic R&D performance tabulated earlier in this report. For consistency with international standards for the measurement of GERD, OECD includes U.S. domestic expenditures on capital for R&D, excludes depreciation on U.S. domestic R&D capital, and makes certain adjustments for foreign sources of funding of domestic R&D.
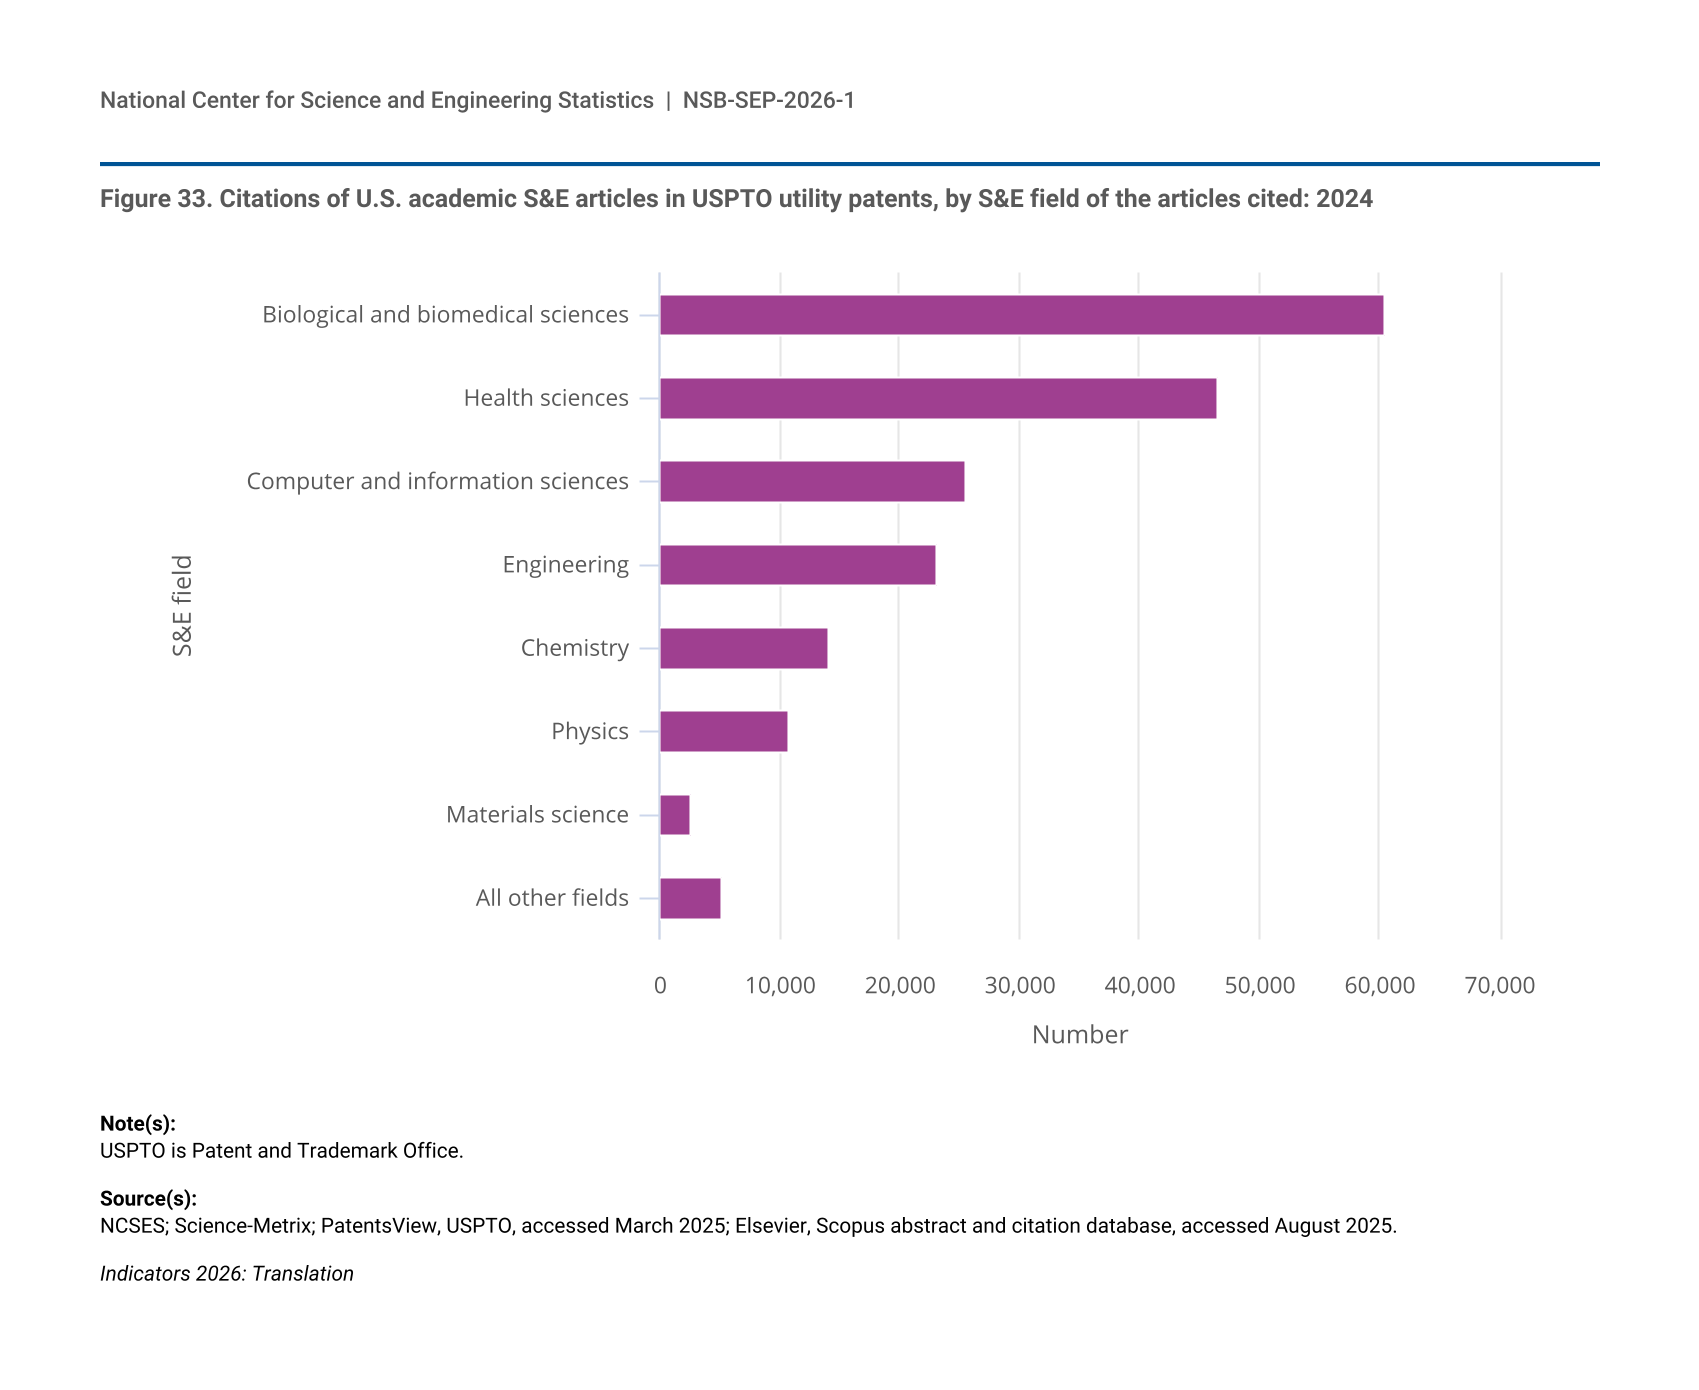
3 There is a minimum 3-year latency in the development of highly cited patent indicators because it takes time for enough patent citations to accumulate in specific fields to be a reliable measure of impact.
4 The section “STEM Talent: Education, Training, and Workforce” draws on data and sources in the Indicators 2026 report “STEM Talent: Education, Training, and Workforce.”
5 All comparative statements derived from sample surveys or assessments in this report have undergone statistical testing; unless otherwise noted, all comparisons are statistically significant at the 0.10 significance level.
6 SES is indicated by a student’s SES index score, which ranges from 0 to 9. Scores are categorized as Low SES (0–2), Middle SES (3–6), and High SES (7–9). In 2024, NAEP introduced a measure of SES comprising four components: (1) the student’s National School Lunch Program (NSLP) eligibility status, (2) the percentage of students eligible for NSLP at the school the student is attending, (3) the number of books at the student’s home, and (4) the highest level of education of either parent.
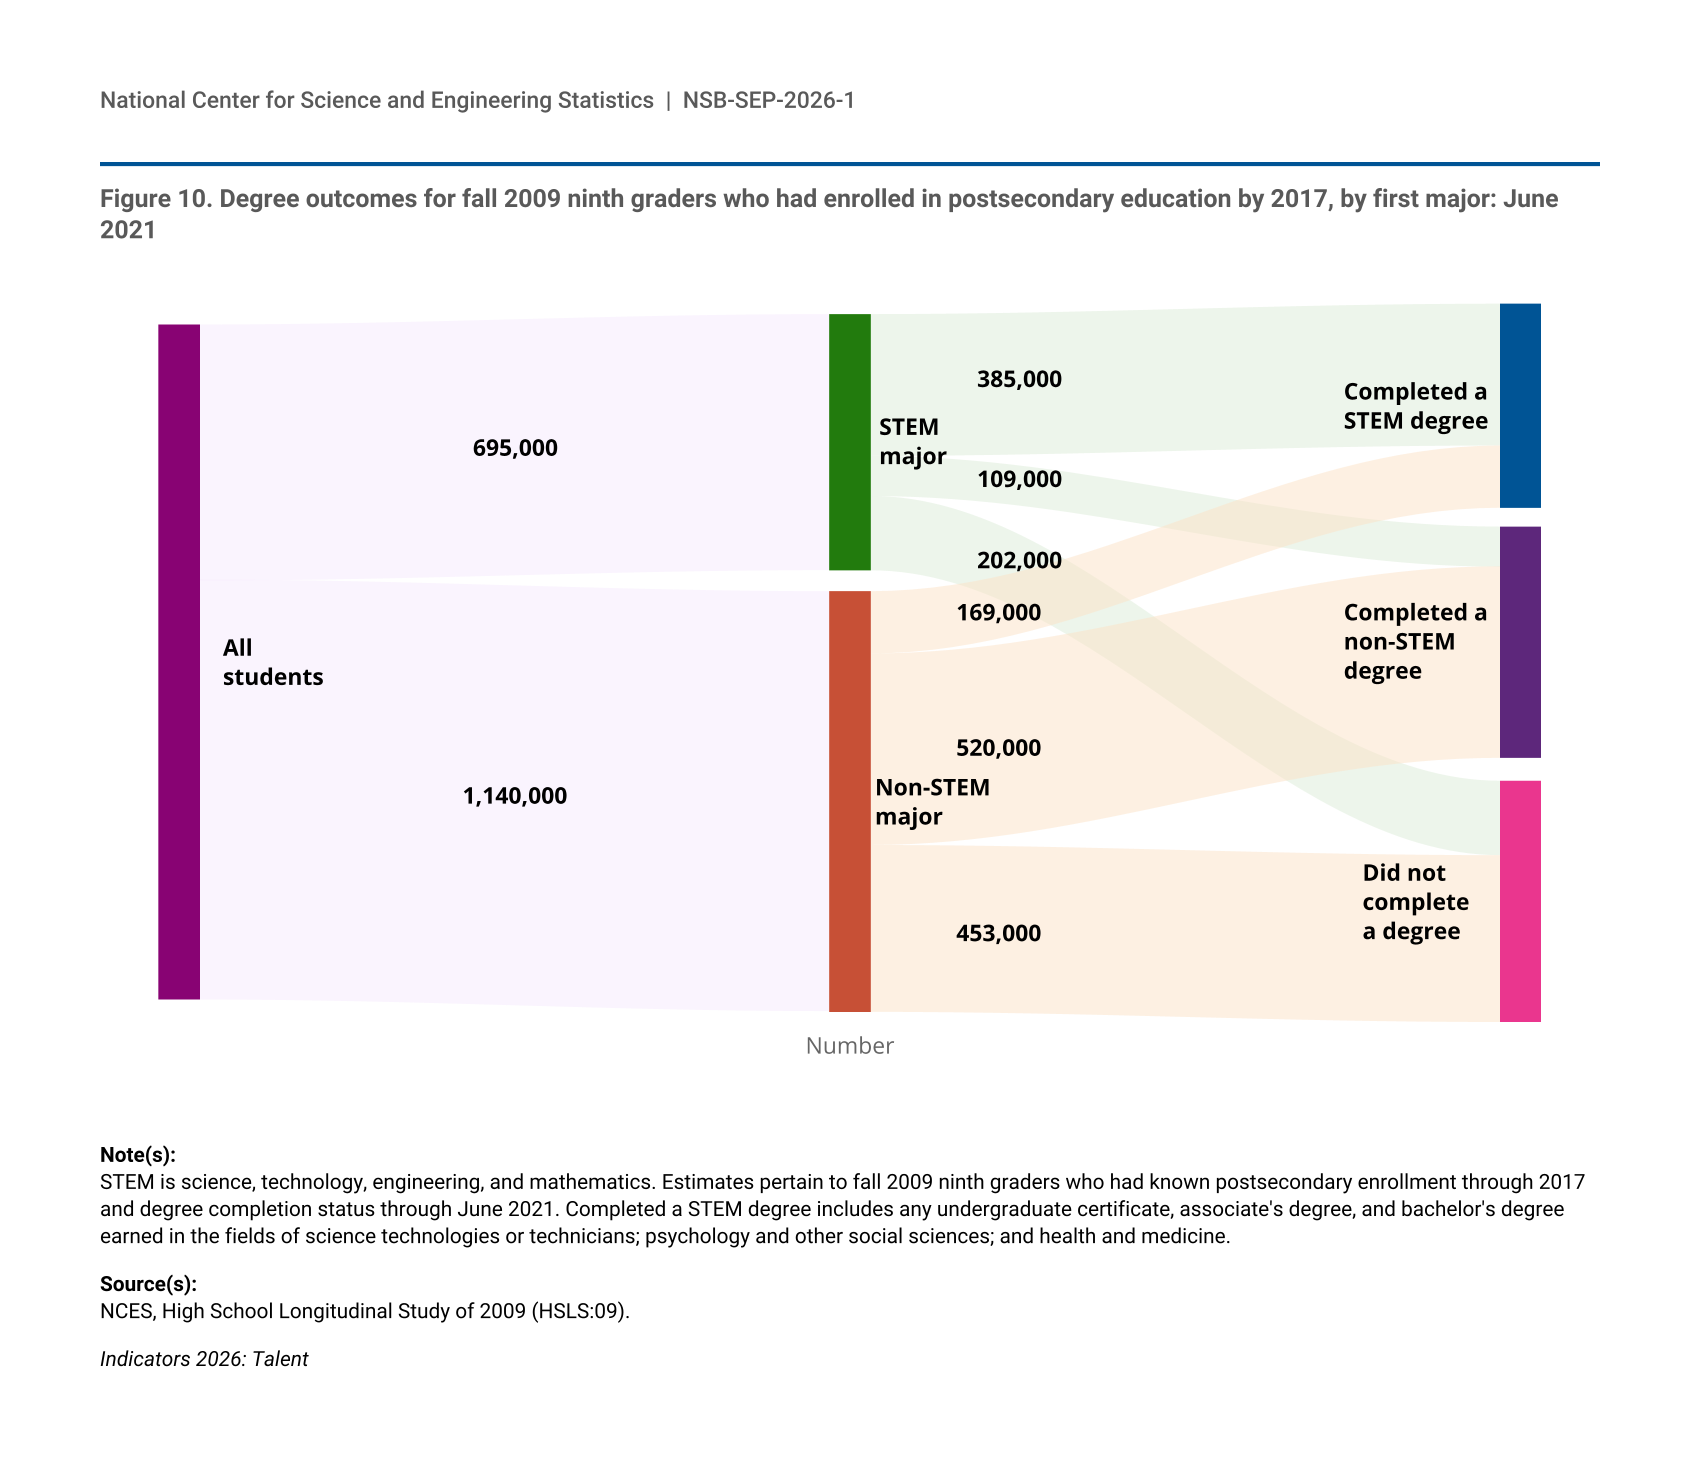
7 Degree outcomes are based on data as of spring 2021.
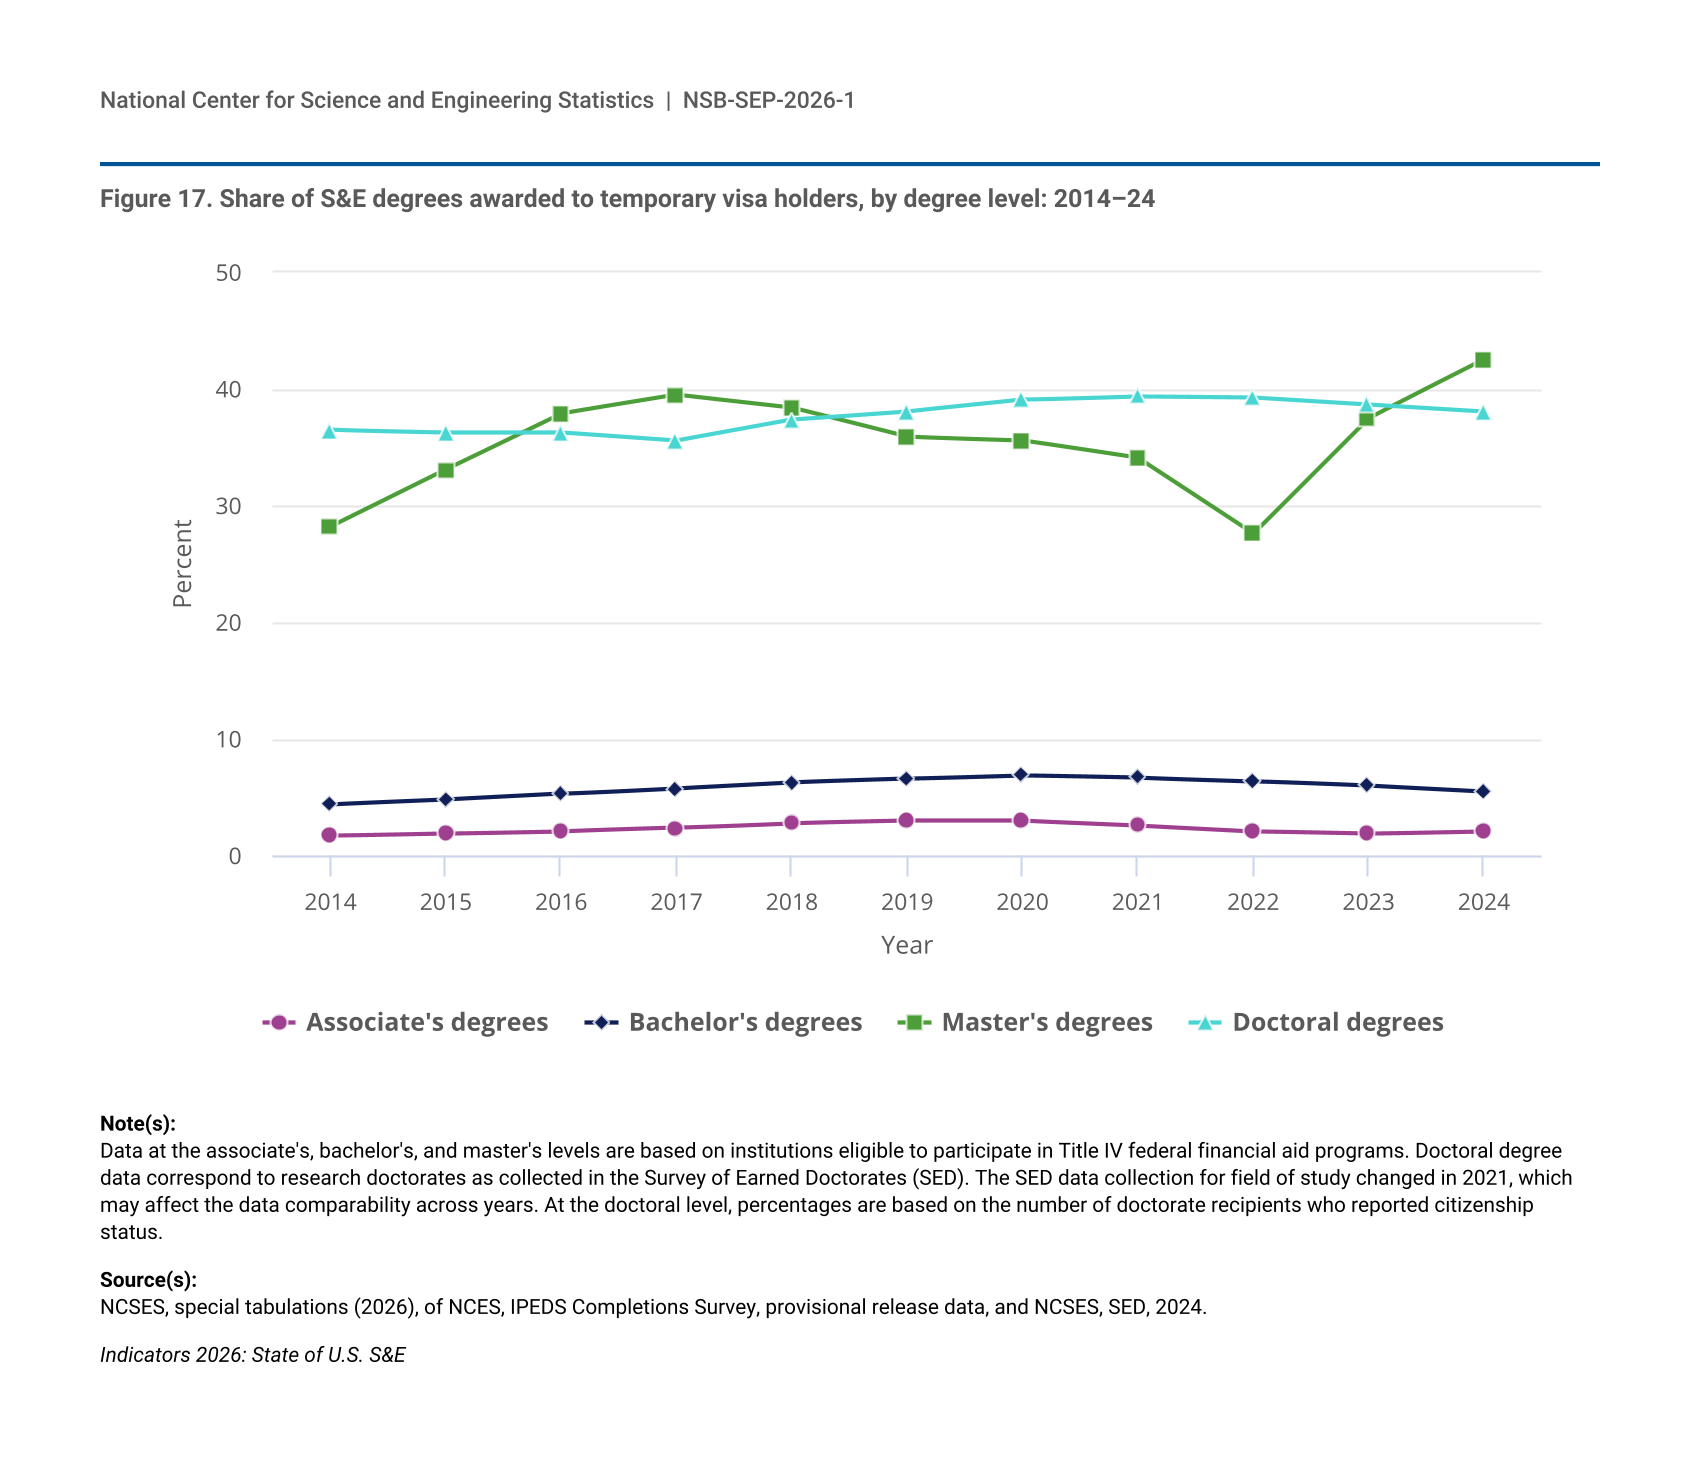
8 S&E degrees discussed here are categorized by institution location and include postsecondary degrees awarded to all students, regardless of their residence or where they earned a high school diploma or equivalent degree.
9 Calculations of degree shares exclude students of unknown race and ethnicity and those on temporary visas.
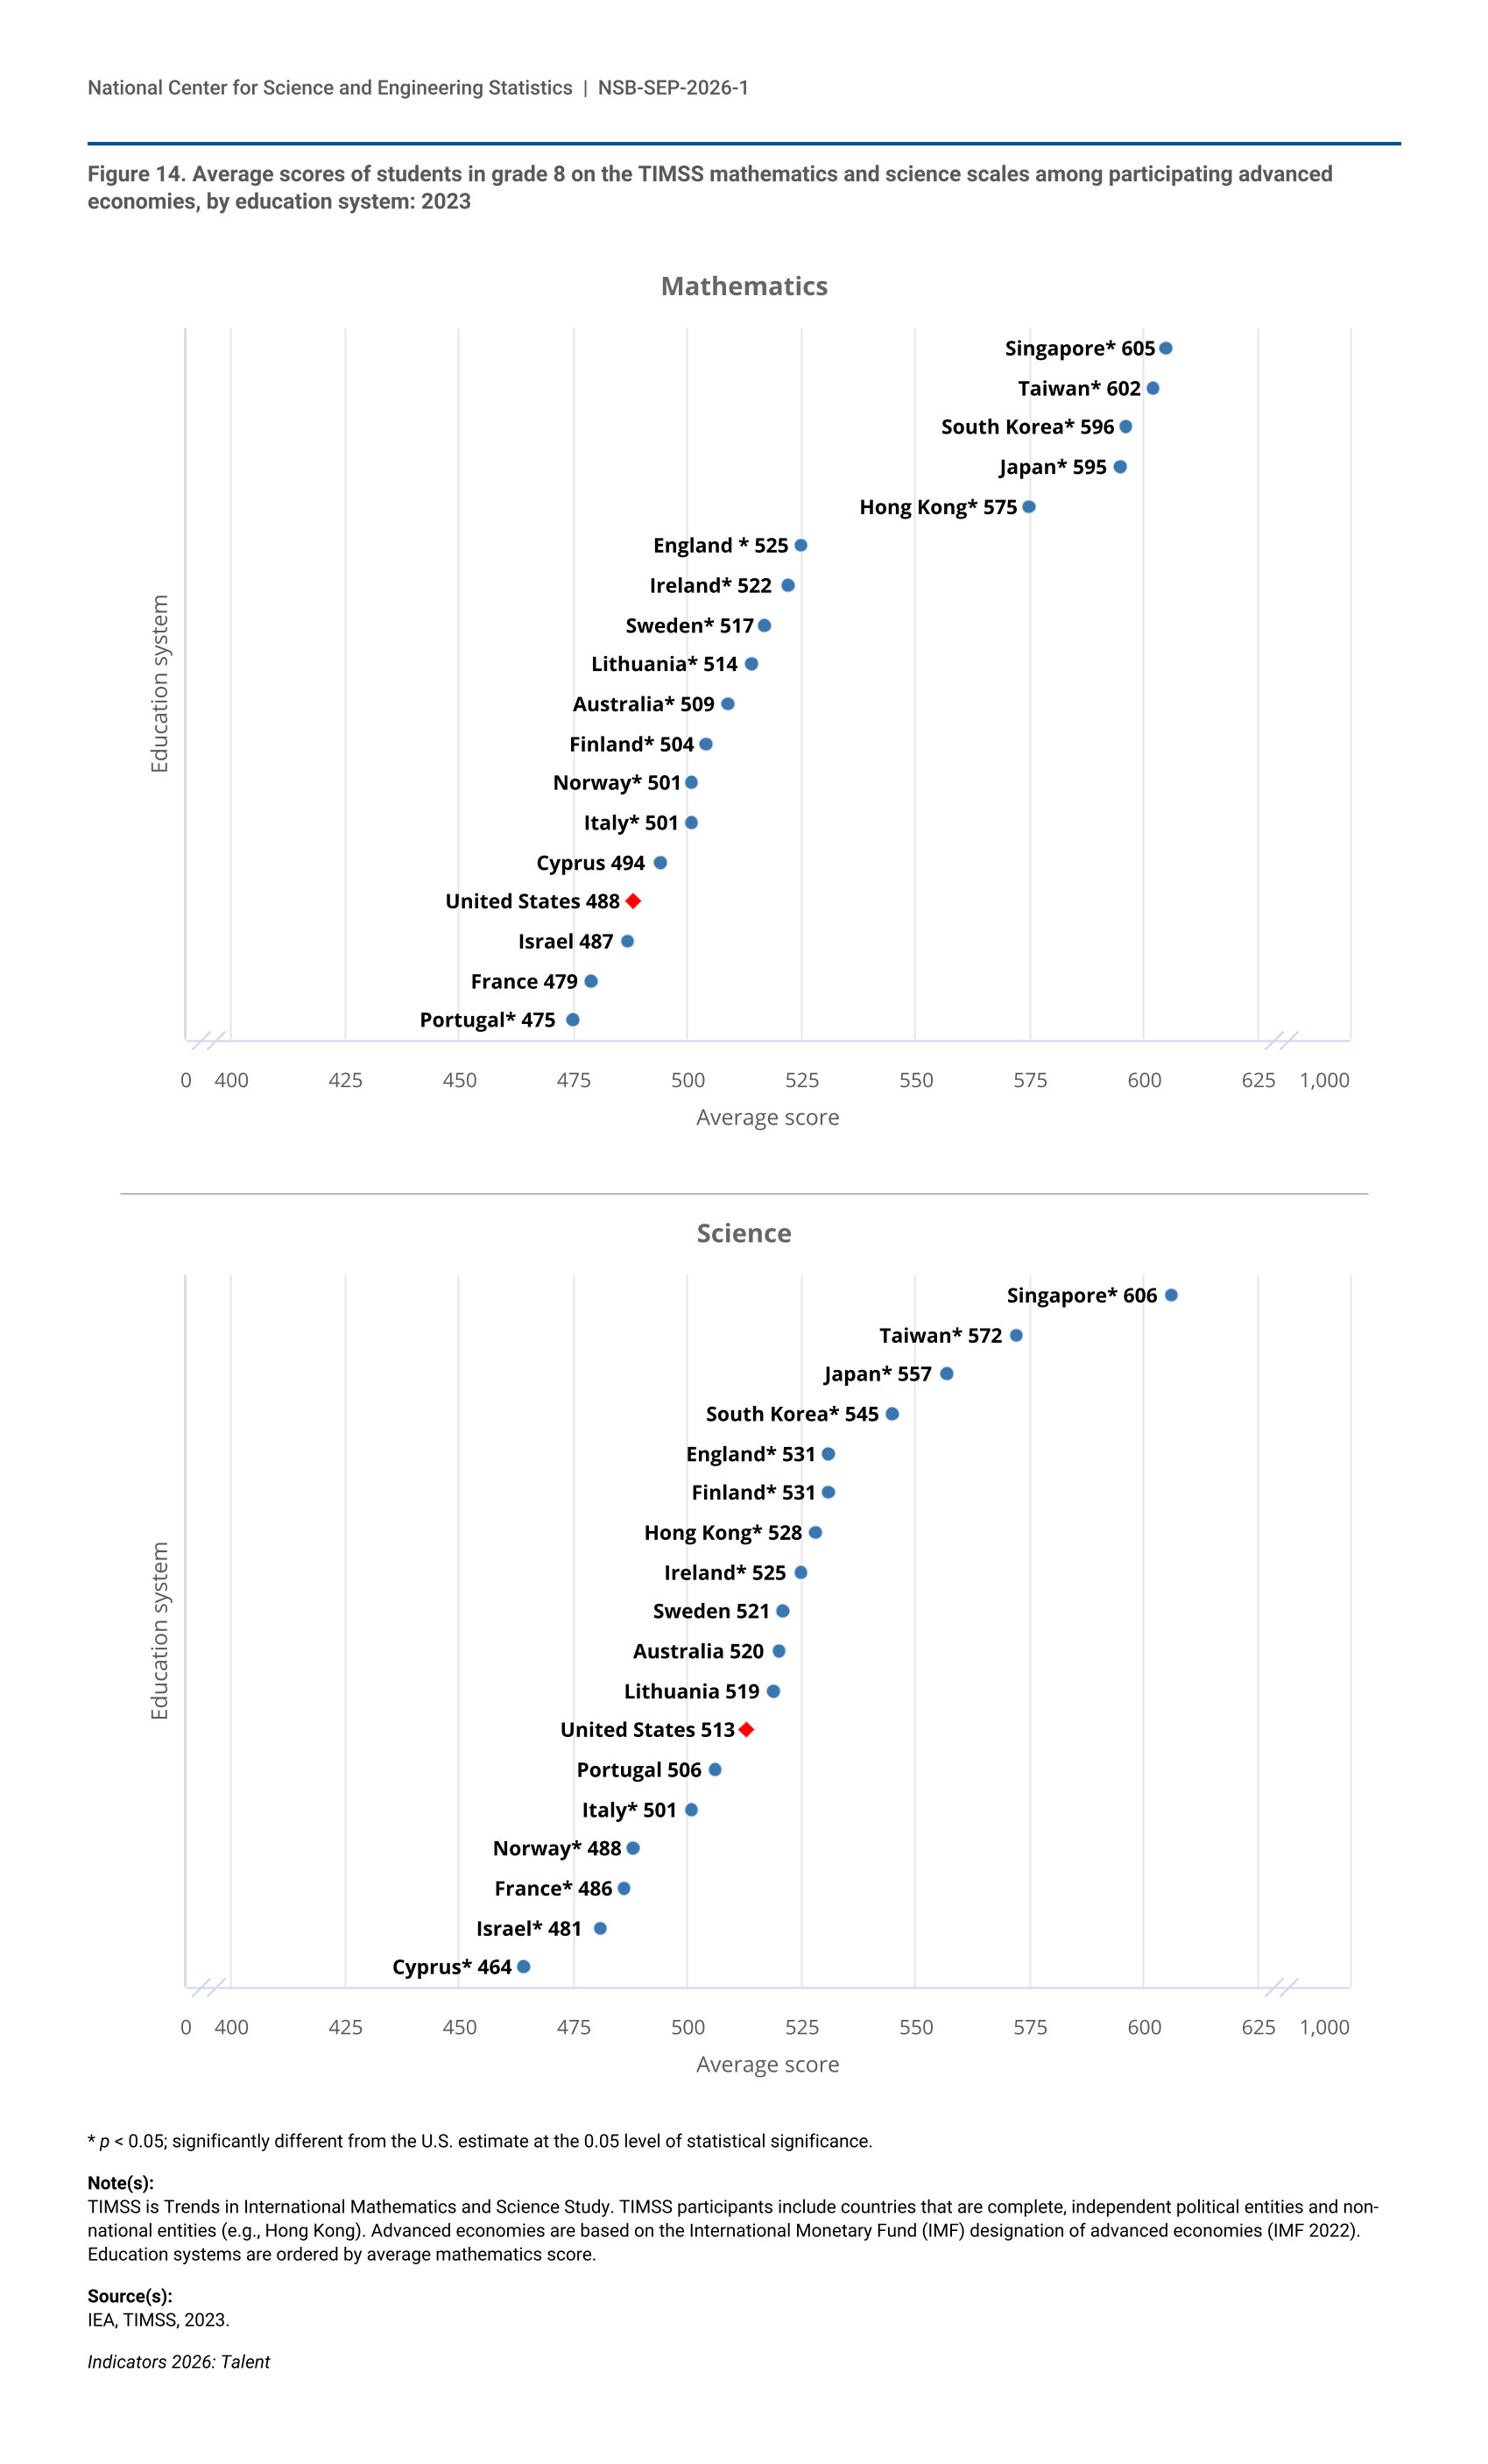
10 Although a total of 42 countries or education systems participated in both TIMSS 2023 assessments, this analysis focuses on U.S. student performance compared with students from other advanced economies.
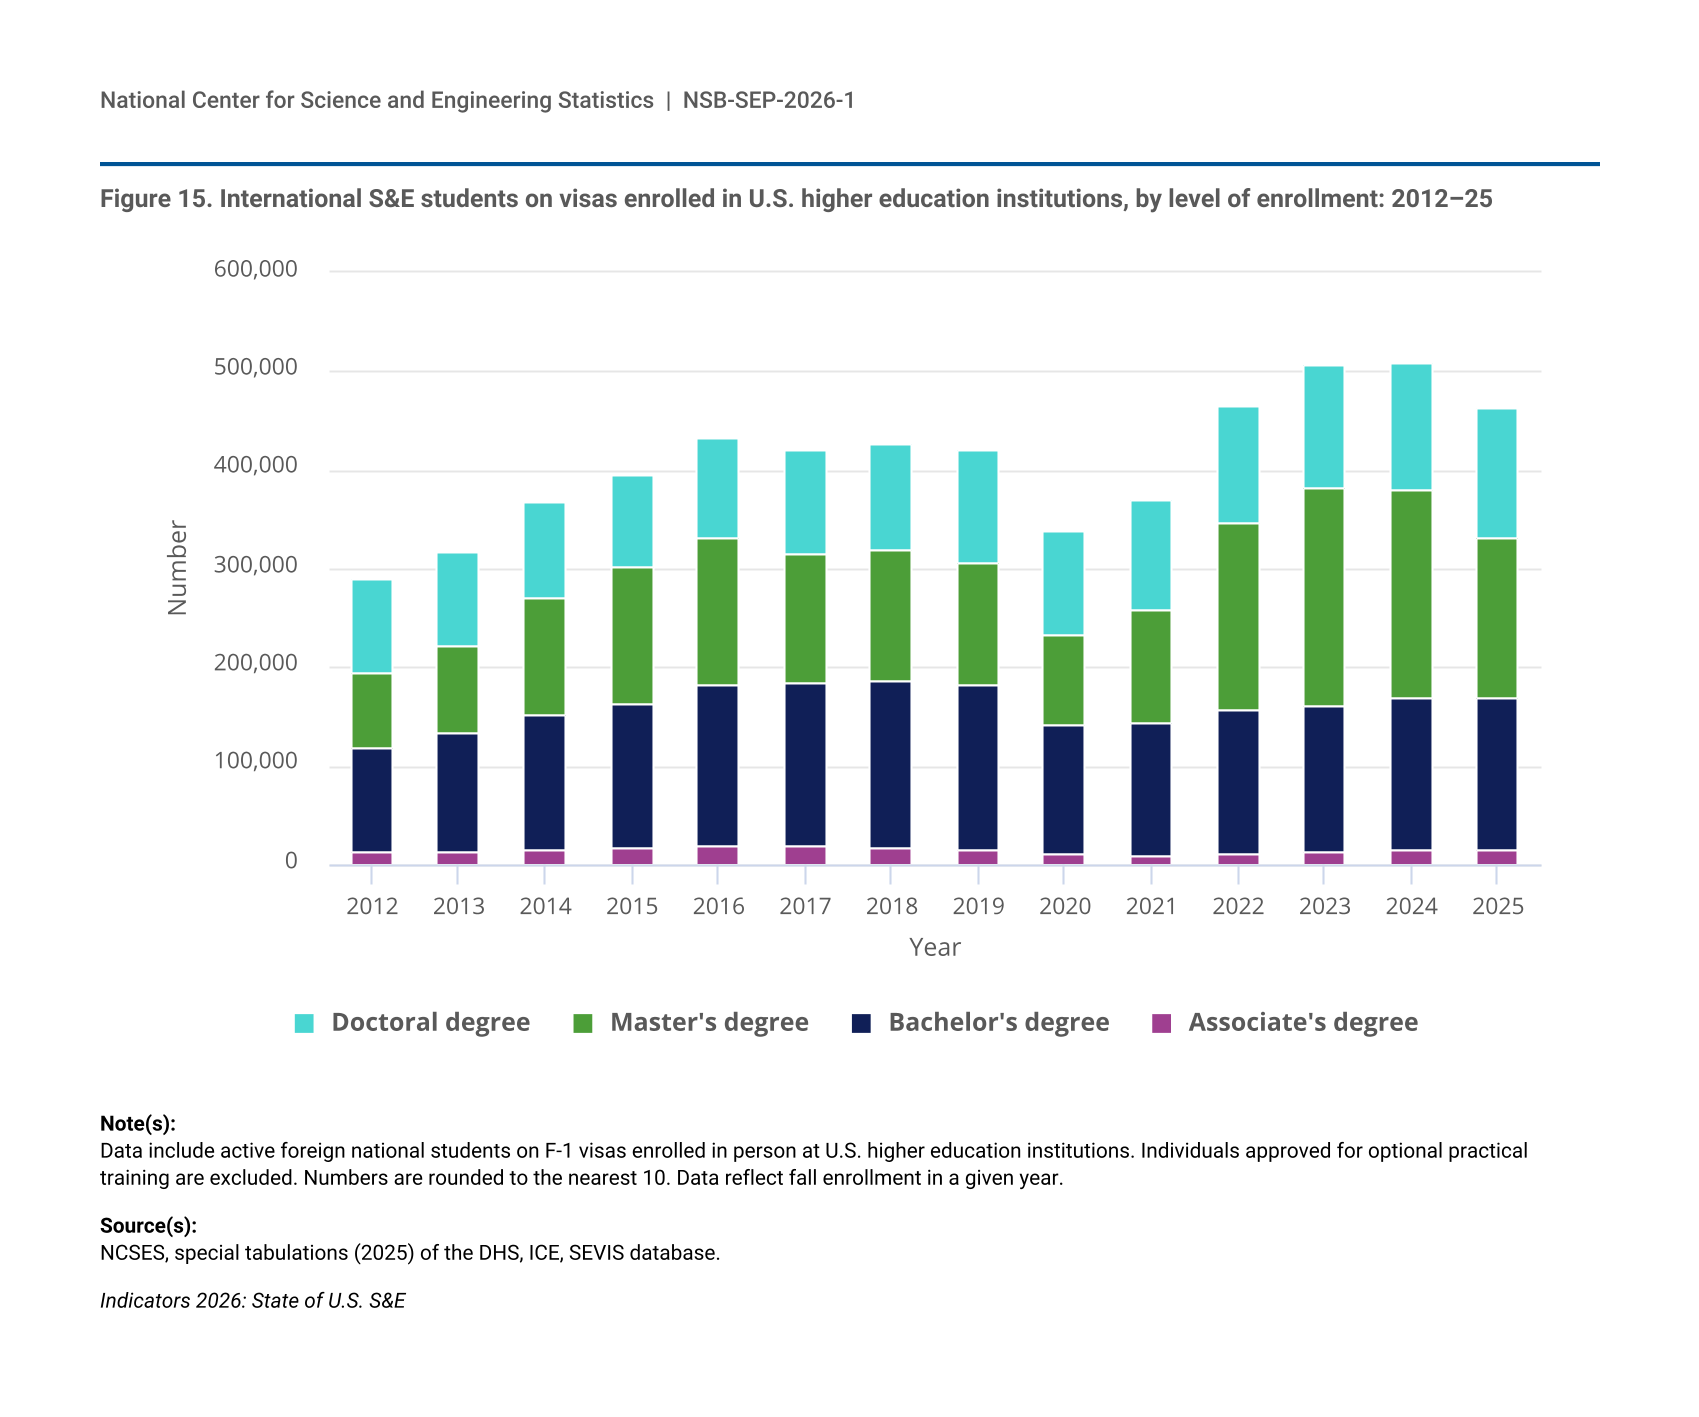
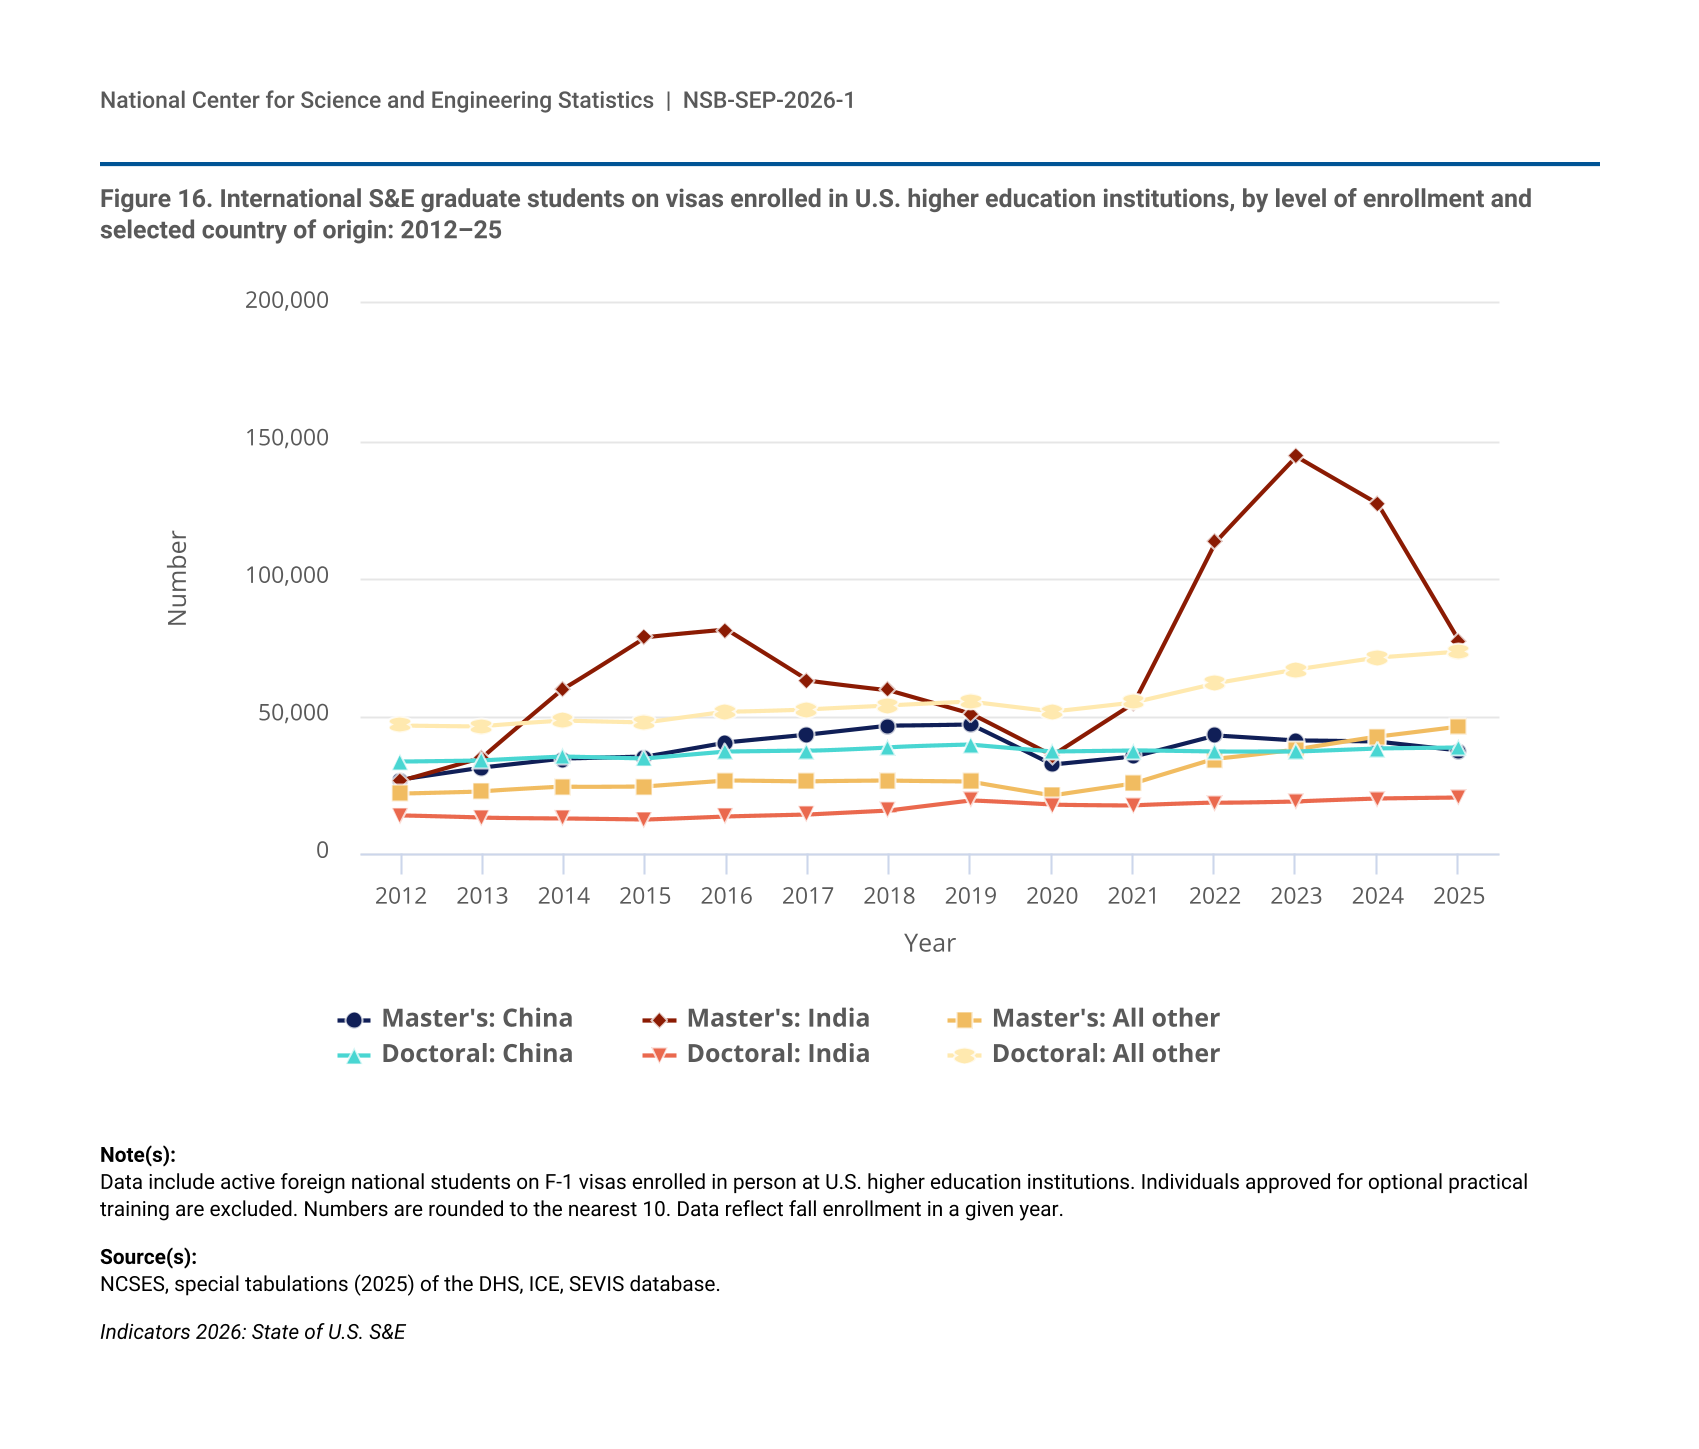
11 Dollar values are in current dollars. Unless otherwise stated, all dollar amounts in this section are provided in current dollars, unadjusted for inflation. Education-related travel includes all expenditures by travelers whose primary purpose for travel is education, including dependents and other travelers accompanying students. For more information on methodology, see BEA (2024).
12 Data reflect fall enrollment in a given year, include active foreign national students on F-1 visas enrolled in person at U.S. higher education institutions, and exclude individuals approved for optional practical training. An analysis of data on the enrollment of temporary visa holders in the Survey of Graduate Students and Postdoctorates in Science and Engineering shows similar trends.
13 NCSES, special tabulations (2025) of the Department of Homeland Security, Immigration and Customs Enforcement, Student and Exchange Visitor Information System database.
14 Country of origin is classified based on place of citizenship at birth.
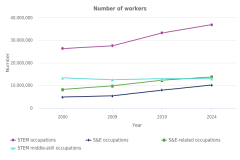
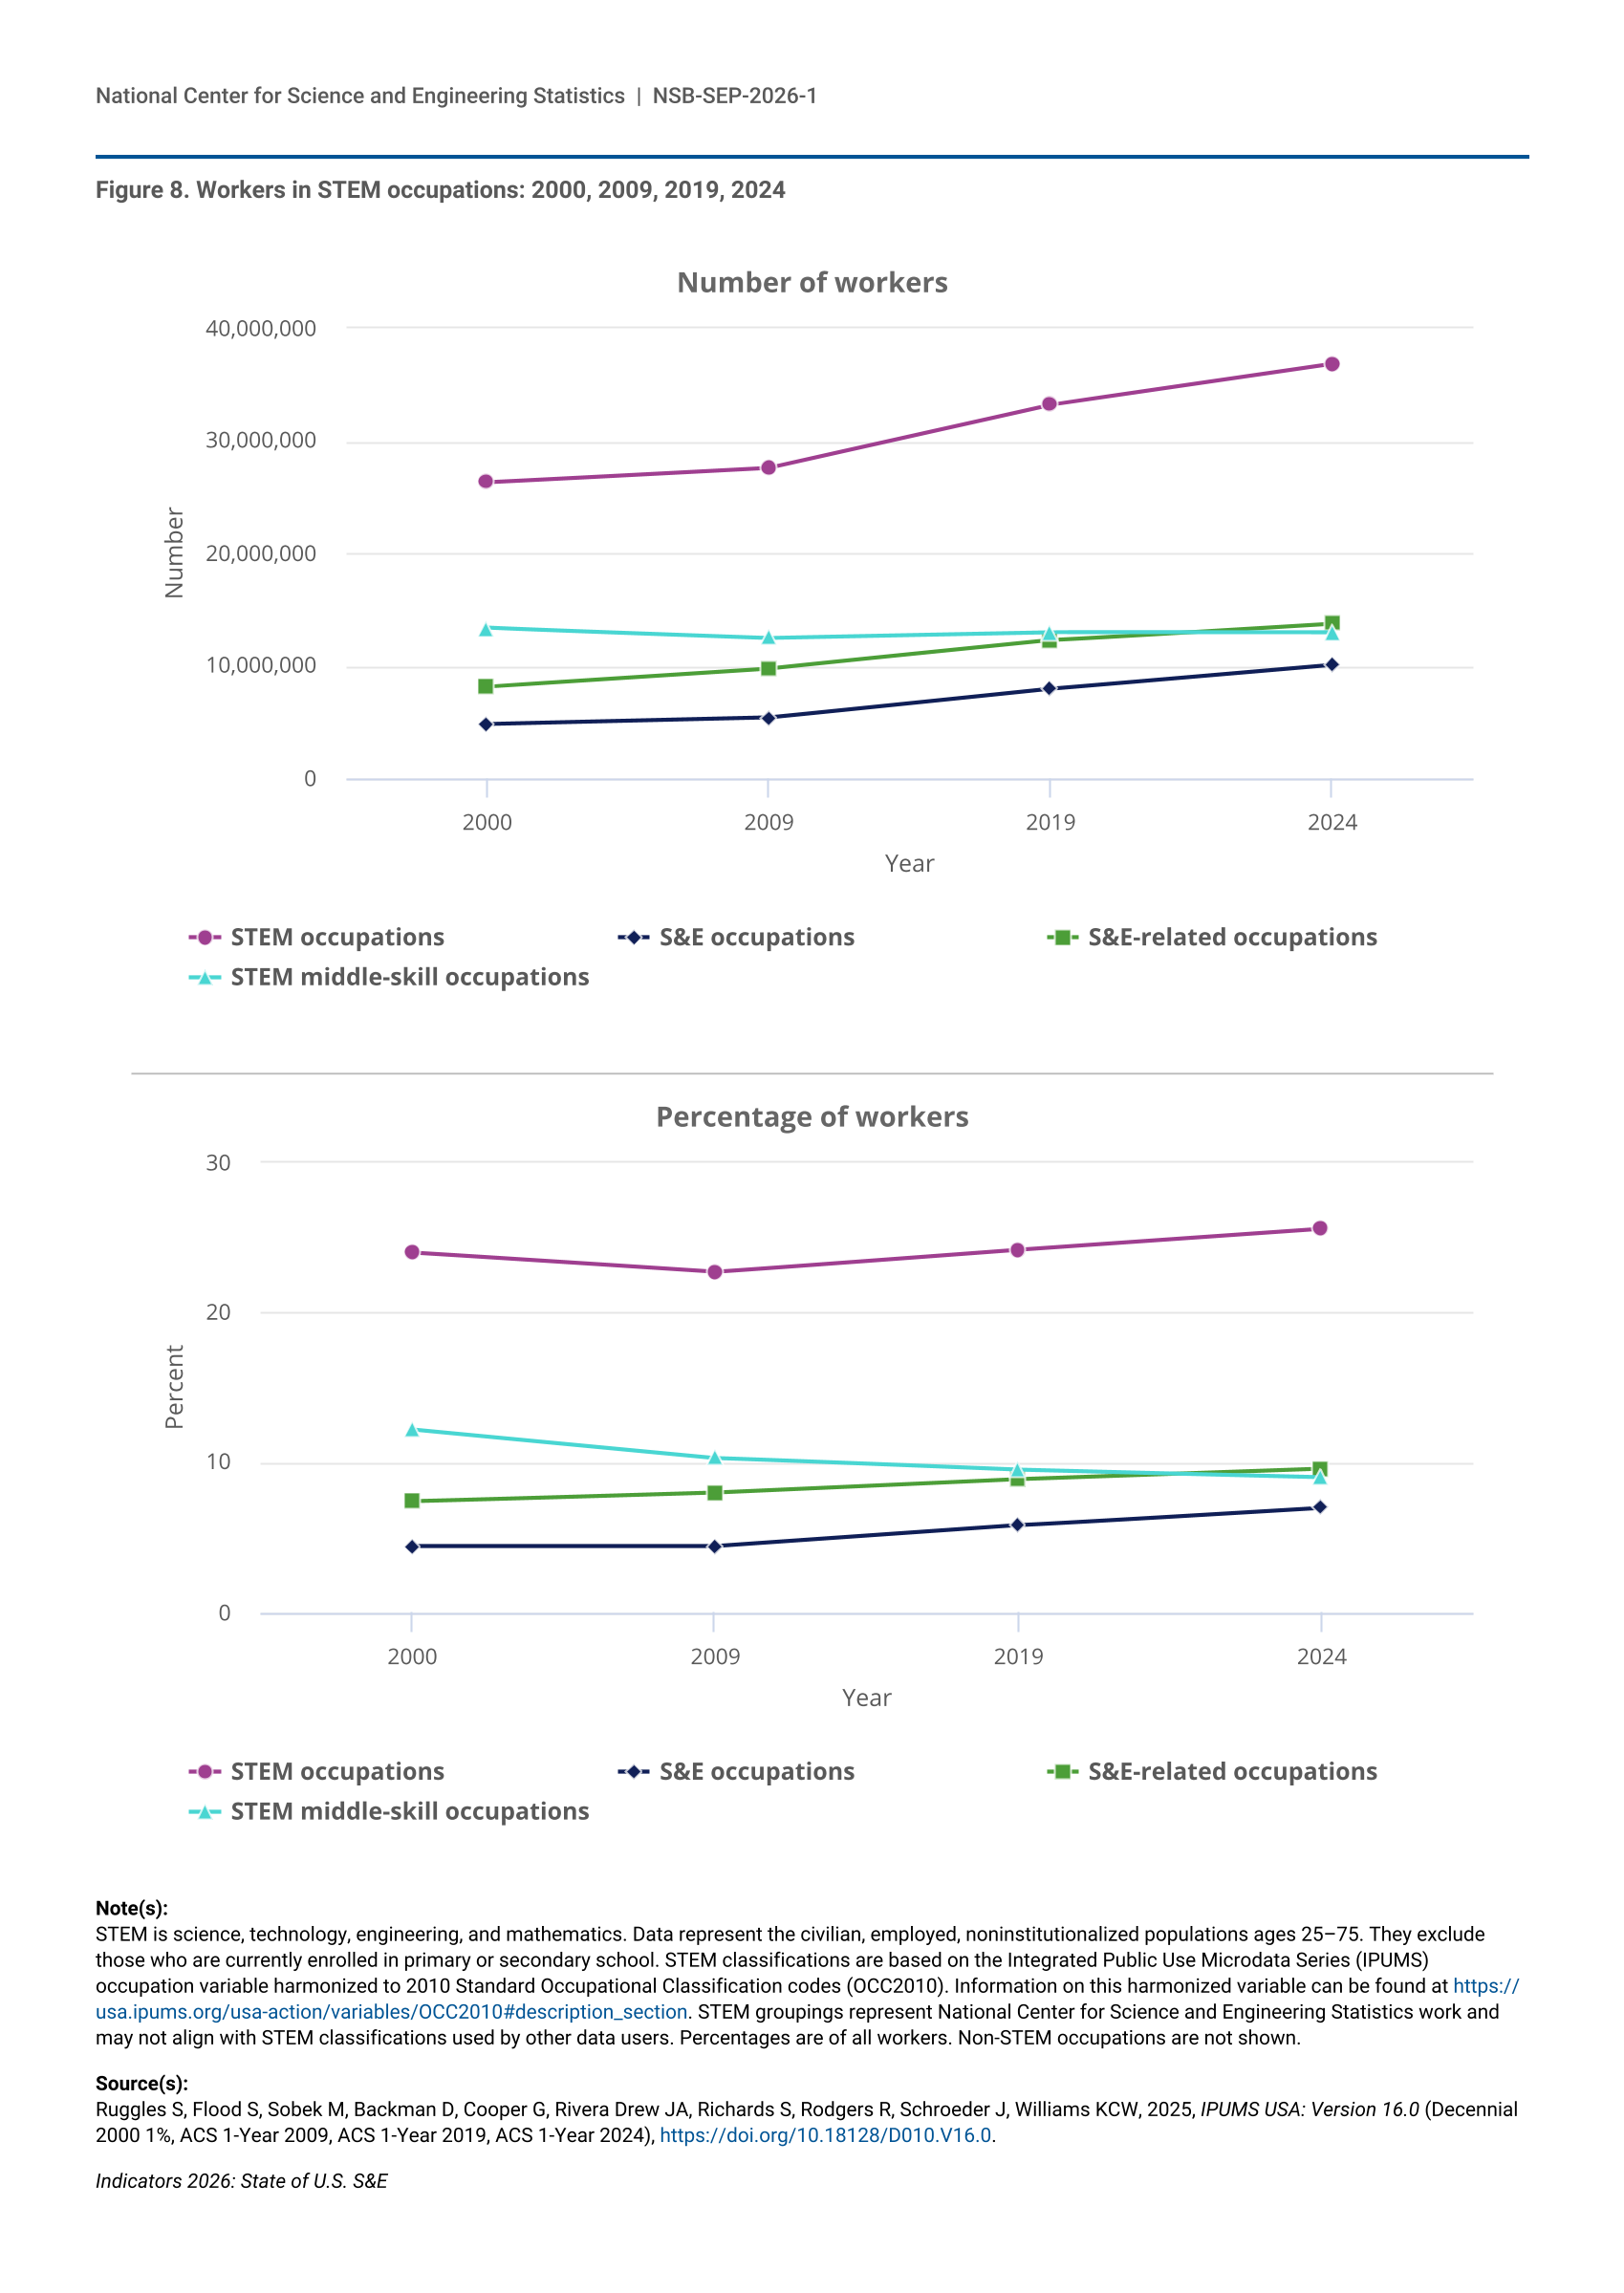
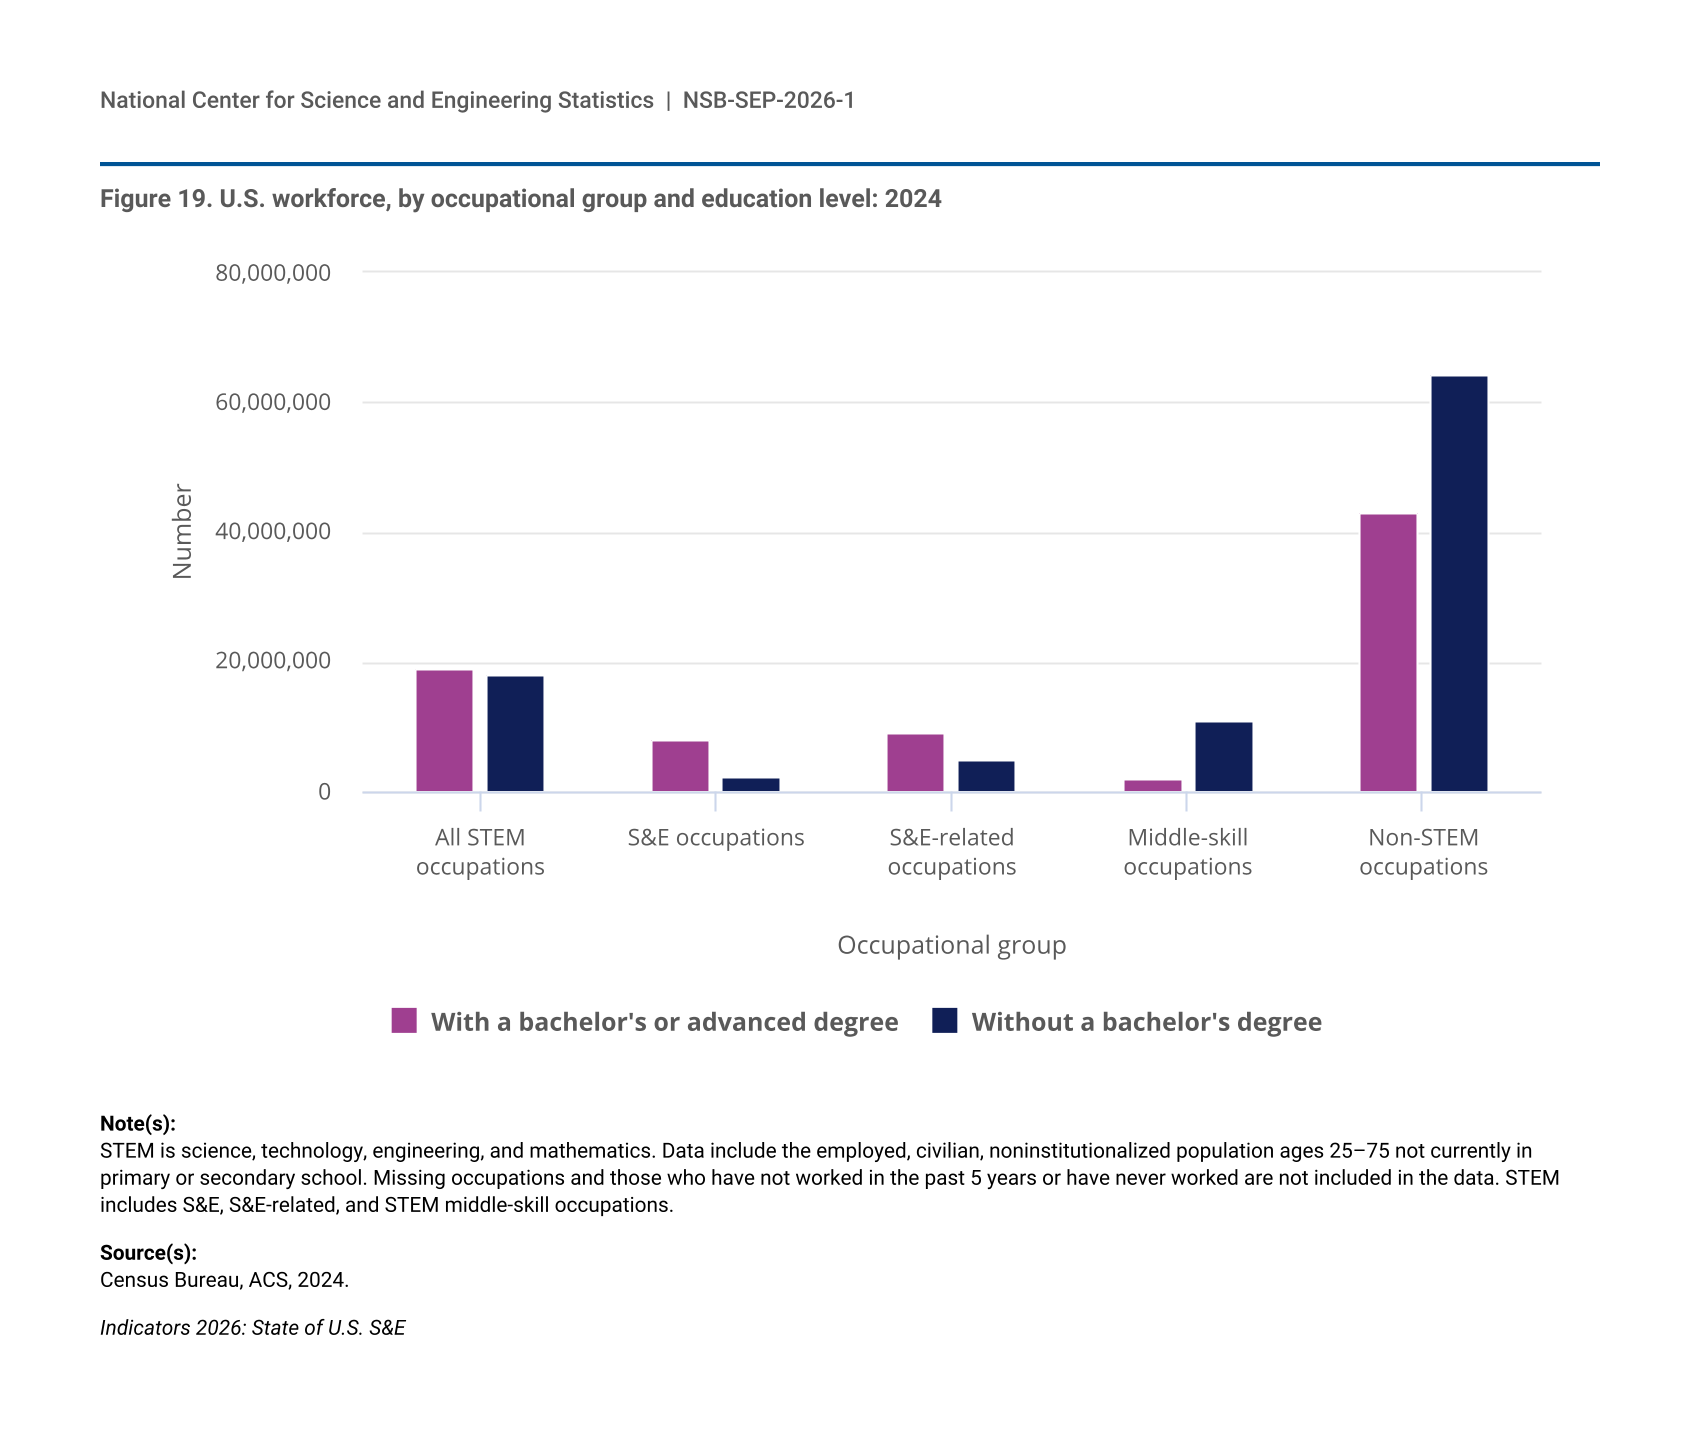
15 The workforce includes the employed, civilian, noninstitutionalized population ages 25–75 not currently enrolled in primary or secondary school. Missing occupations and those who have not worked in the past 5 years or have never worked are not included in the data. STEM includes S&E, S&E-related, and STEM middle-skill occupations.
16 Designation of STEM occupations is based on NCSES STEM classification, which differs from the STEM classification used by the Bureau of Labor Statistics.
17 Among those with a master’s degree or a professional degree, median earnings for full-time year-round S&E workers were not statistically different from the earnings for S&E-related workers.
18 Median earnings among S&E workers with some college were not statistically different from those among S&E workers with an associate's degree. Among STEM middle-skill workers, median earnings of those with an associate's degree were not statistically different from the earnings of those with a bachelor's degree.
19 The percentage of workers in STEM occupations was not statistically different between Washington and Vermont. The percentage of STEM workers in Washington was also not statistically different from the percentage in North Dakota.
20 The percentage of STEM workers without a bachelor’s degree in Mississippi was not statistically different from the percentage in West Virginia.
21 The section “Discovery: R&D Activity and Research Publications” draws on data and sources in the Indicators 2026 report “Discovery: R&D Activity and Research Publications.”
22 Data for the United States in this section and its accompanying figures reflect NCSES standards for domestic reporting of U.S. total R&D. This results in marginal differences from the data on gross expenditures on R&D that NCSES provides to OECD for international comparisons. Unless otherwise stated, all measurements of U.S. R&D performance in this report are in current dollars, unadjusted for inflation.
23 National Patterns of R&D Resources 2024 data are estimates based mainly on findings from the 2023 sectoral R&D expenditure surveys, preliminary information from the 2024 sectoral R&D expenditure surveys, and evident recent trends. They are likely to be revised.
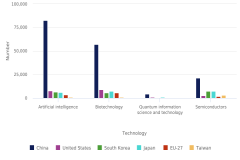
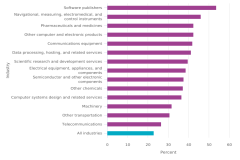
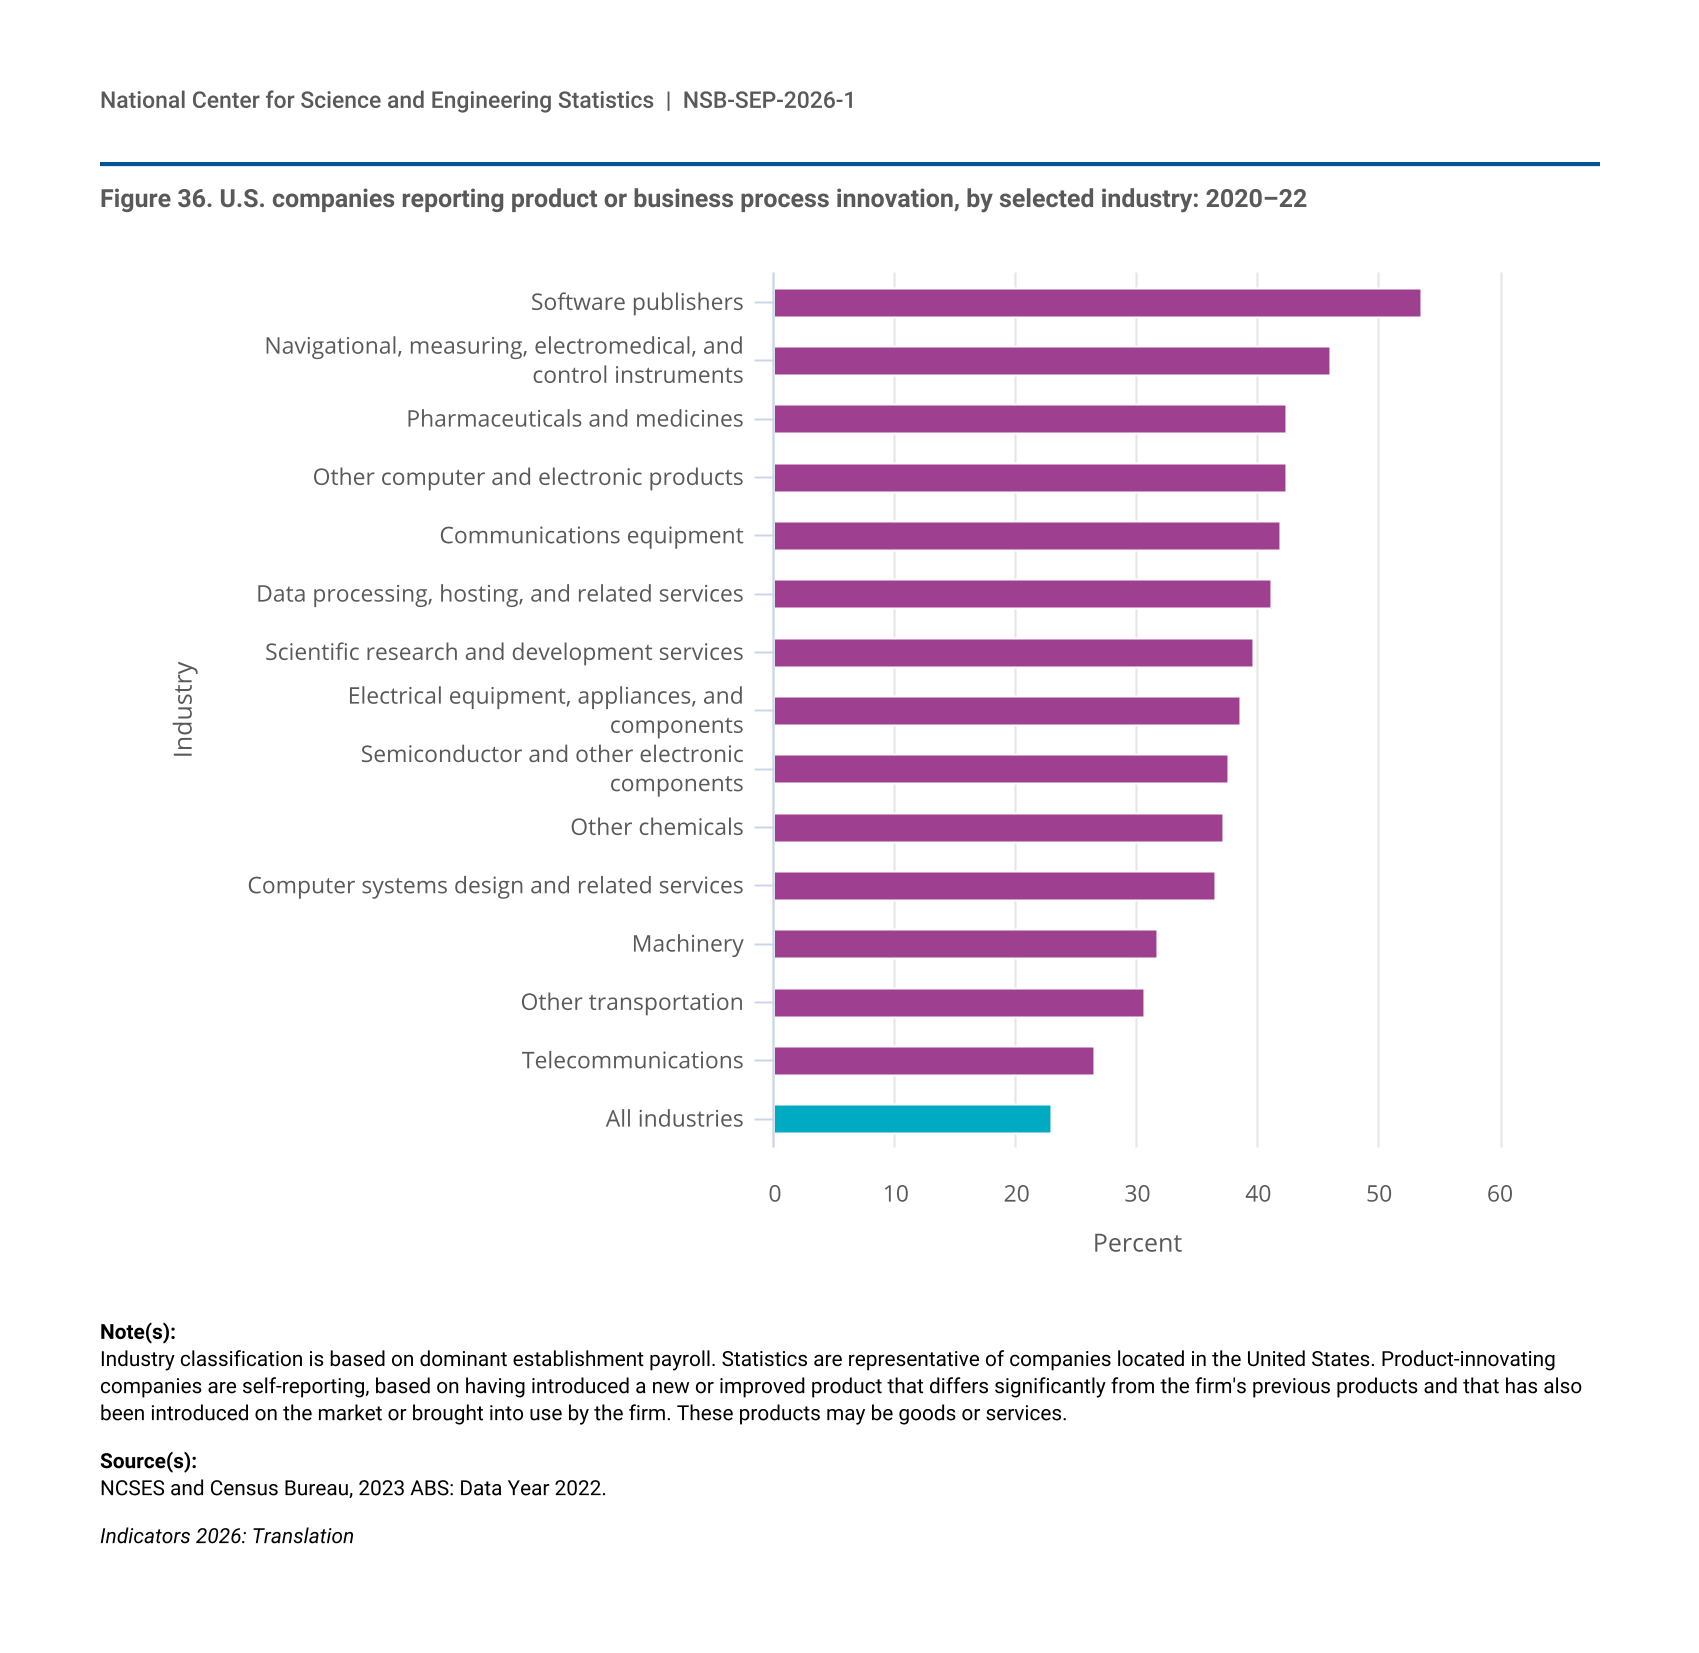
24 Excludes R&D performed by businesses with 9 or fewer domestic employees. Data in this section are representative of business with 10 or more domestic employees, which perform nearly all (99%) of business R&D in the United States (NCSES 2024a, 2024b).
25 Technology focus areas are not mutually exclusive; companies could report R&D in one, more than one, or no application area.
26 For details on methodology, see the Indicators 2026 report “Discovery: R&D Activity and Research Publications” section “Technical Appendix.”
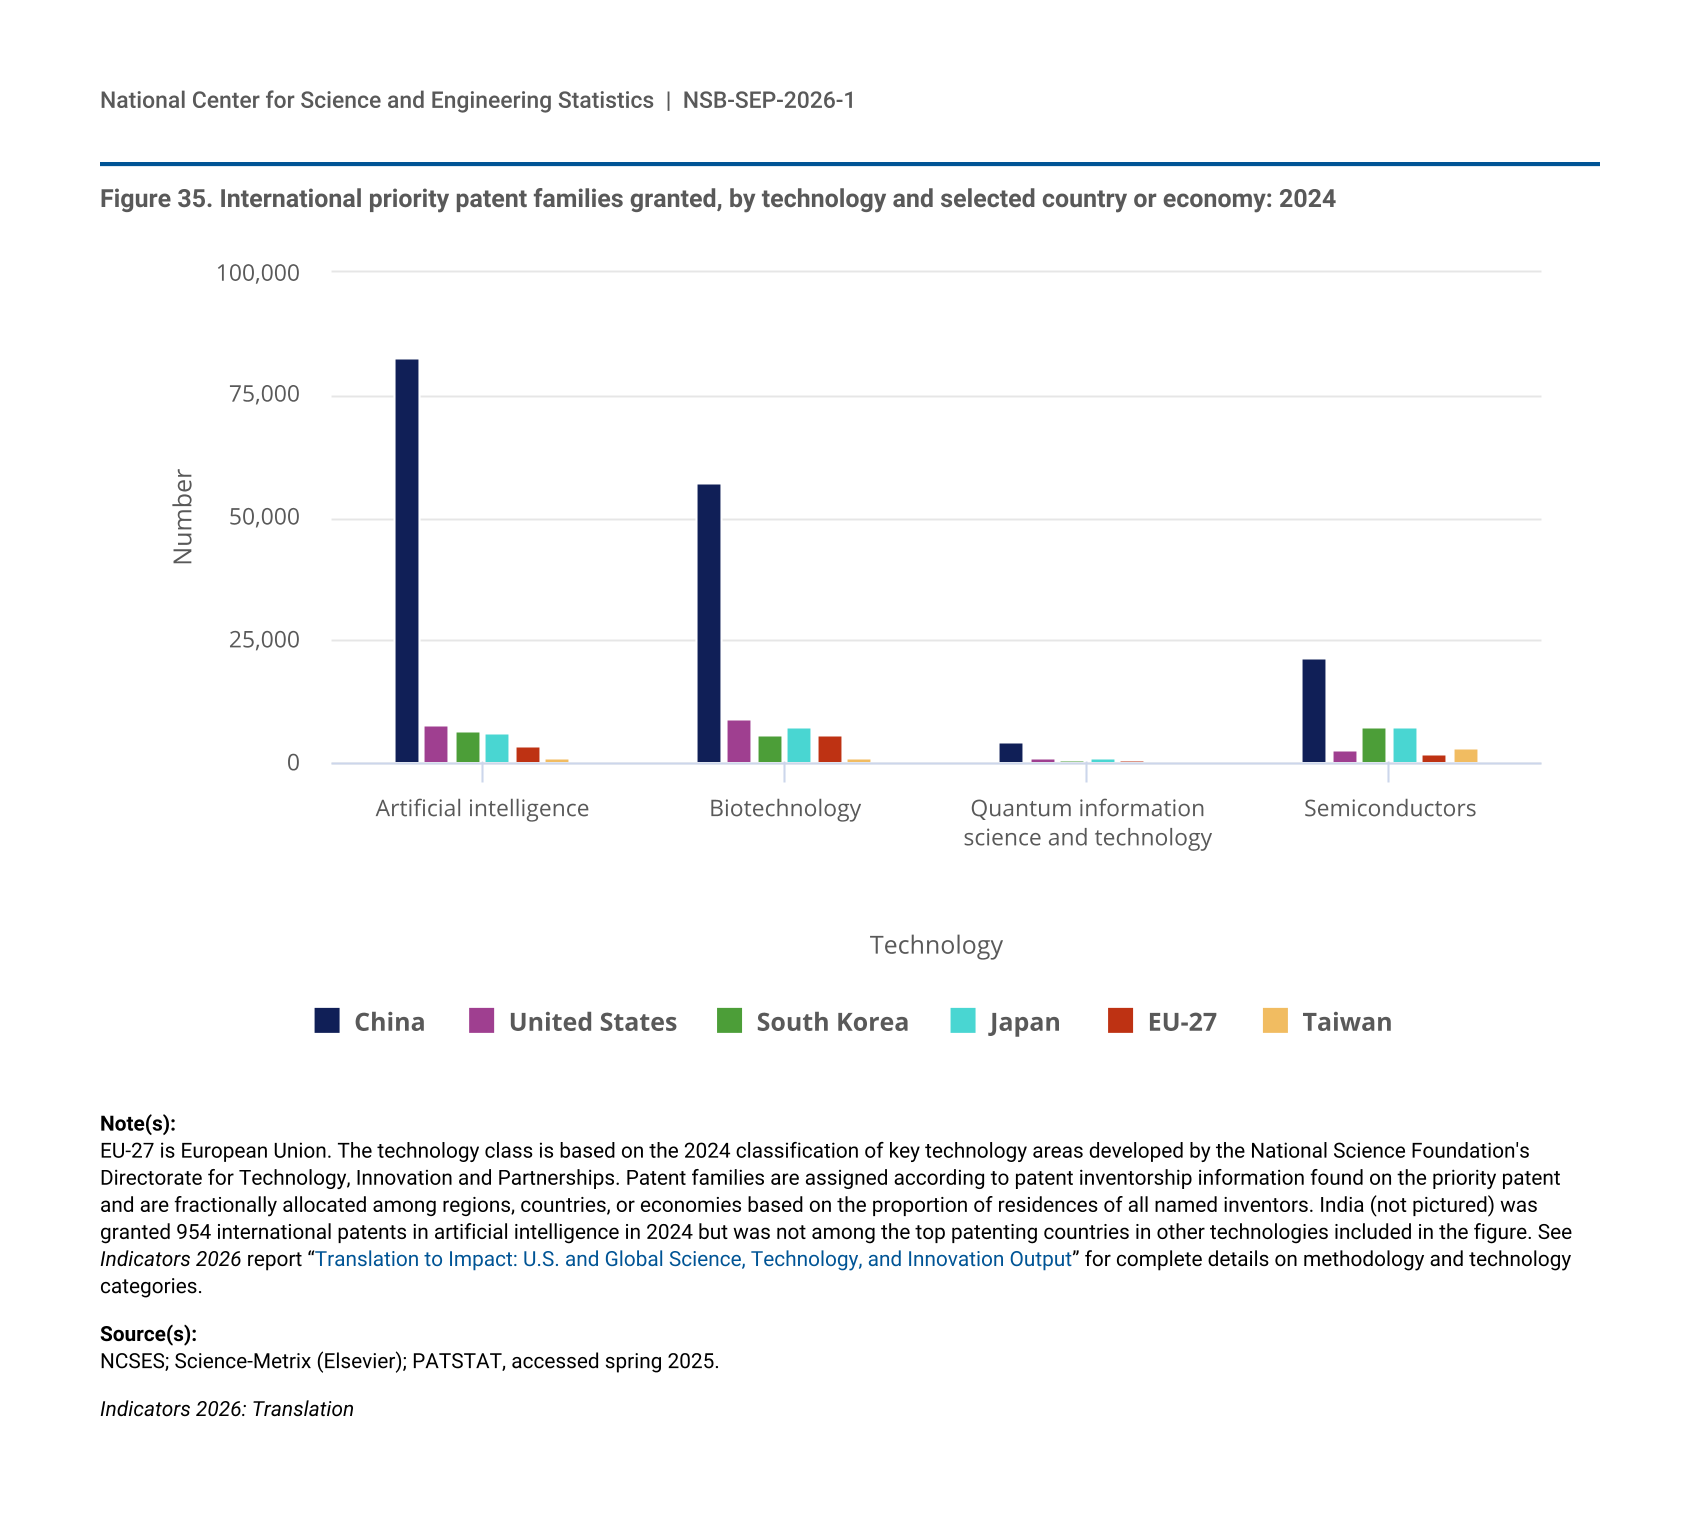
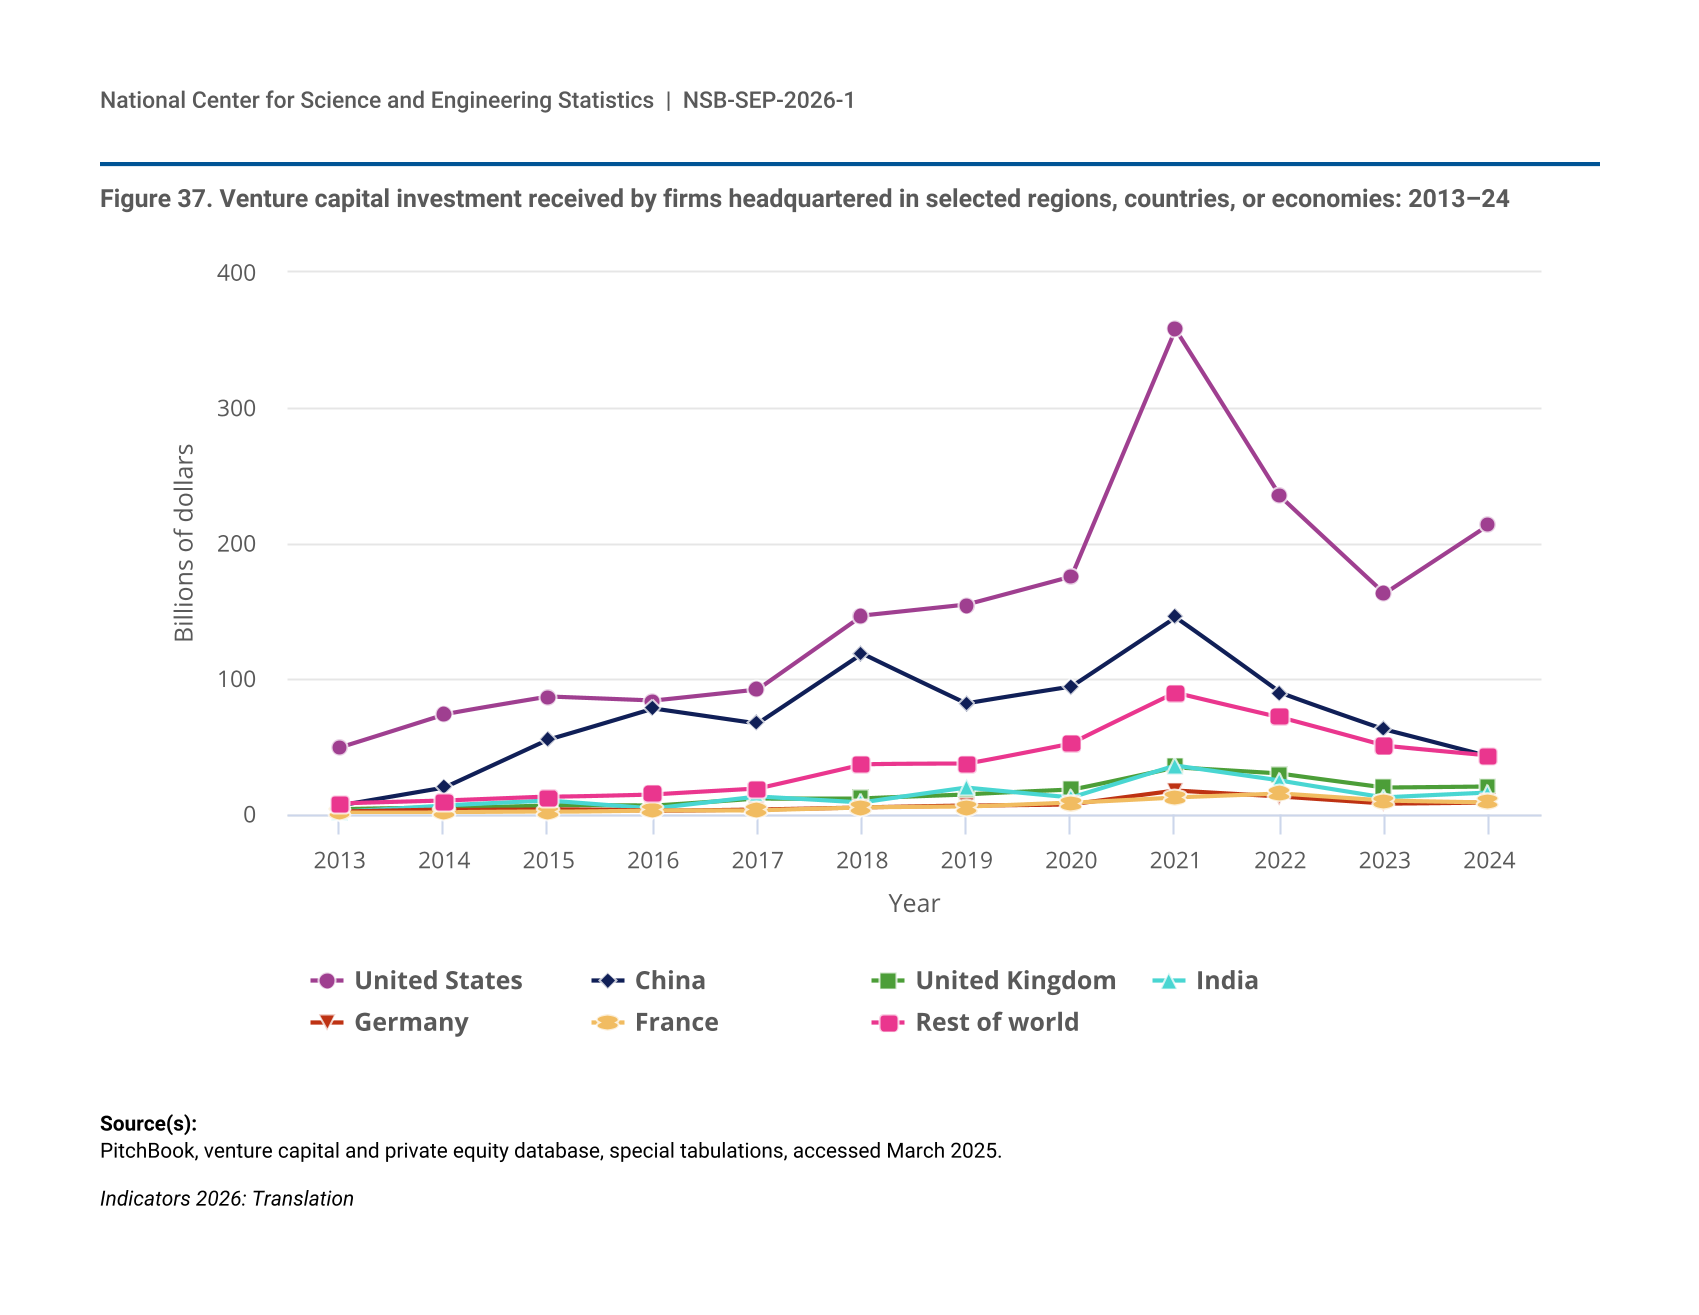
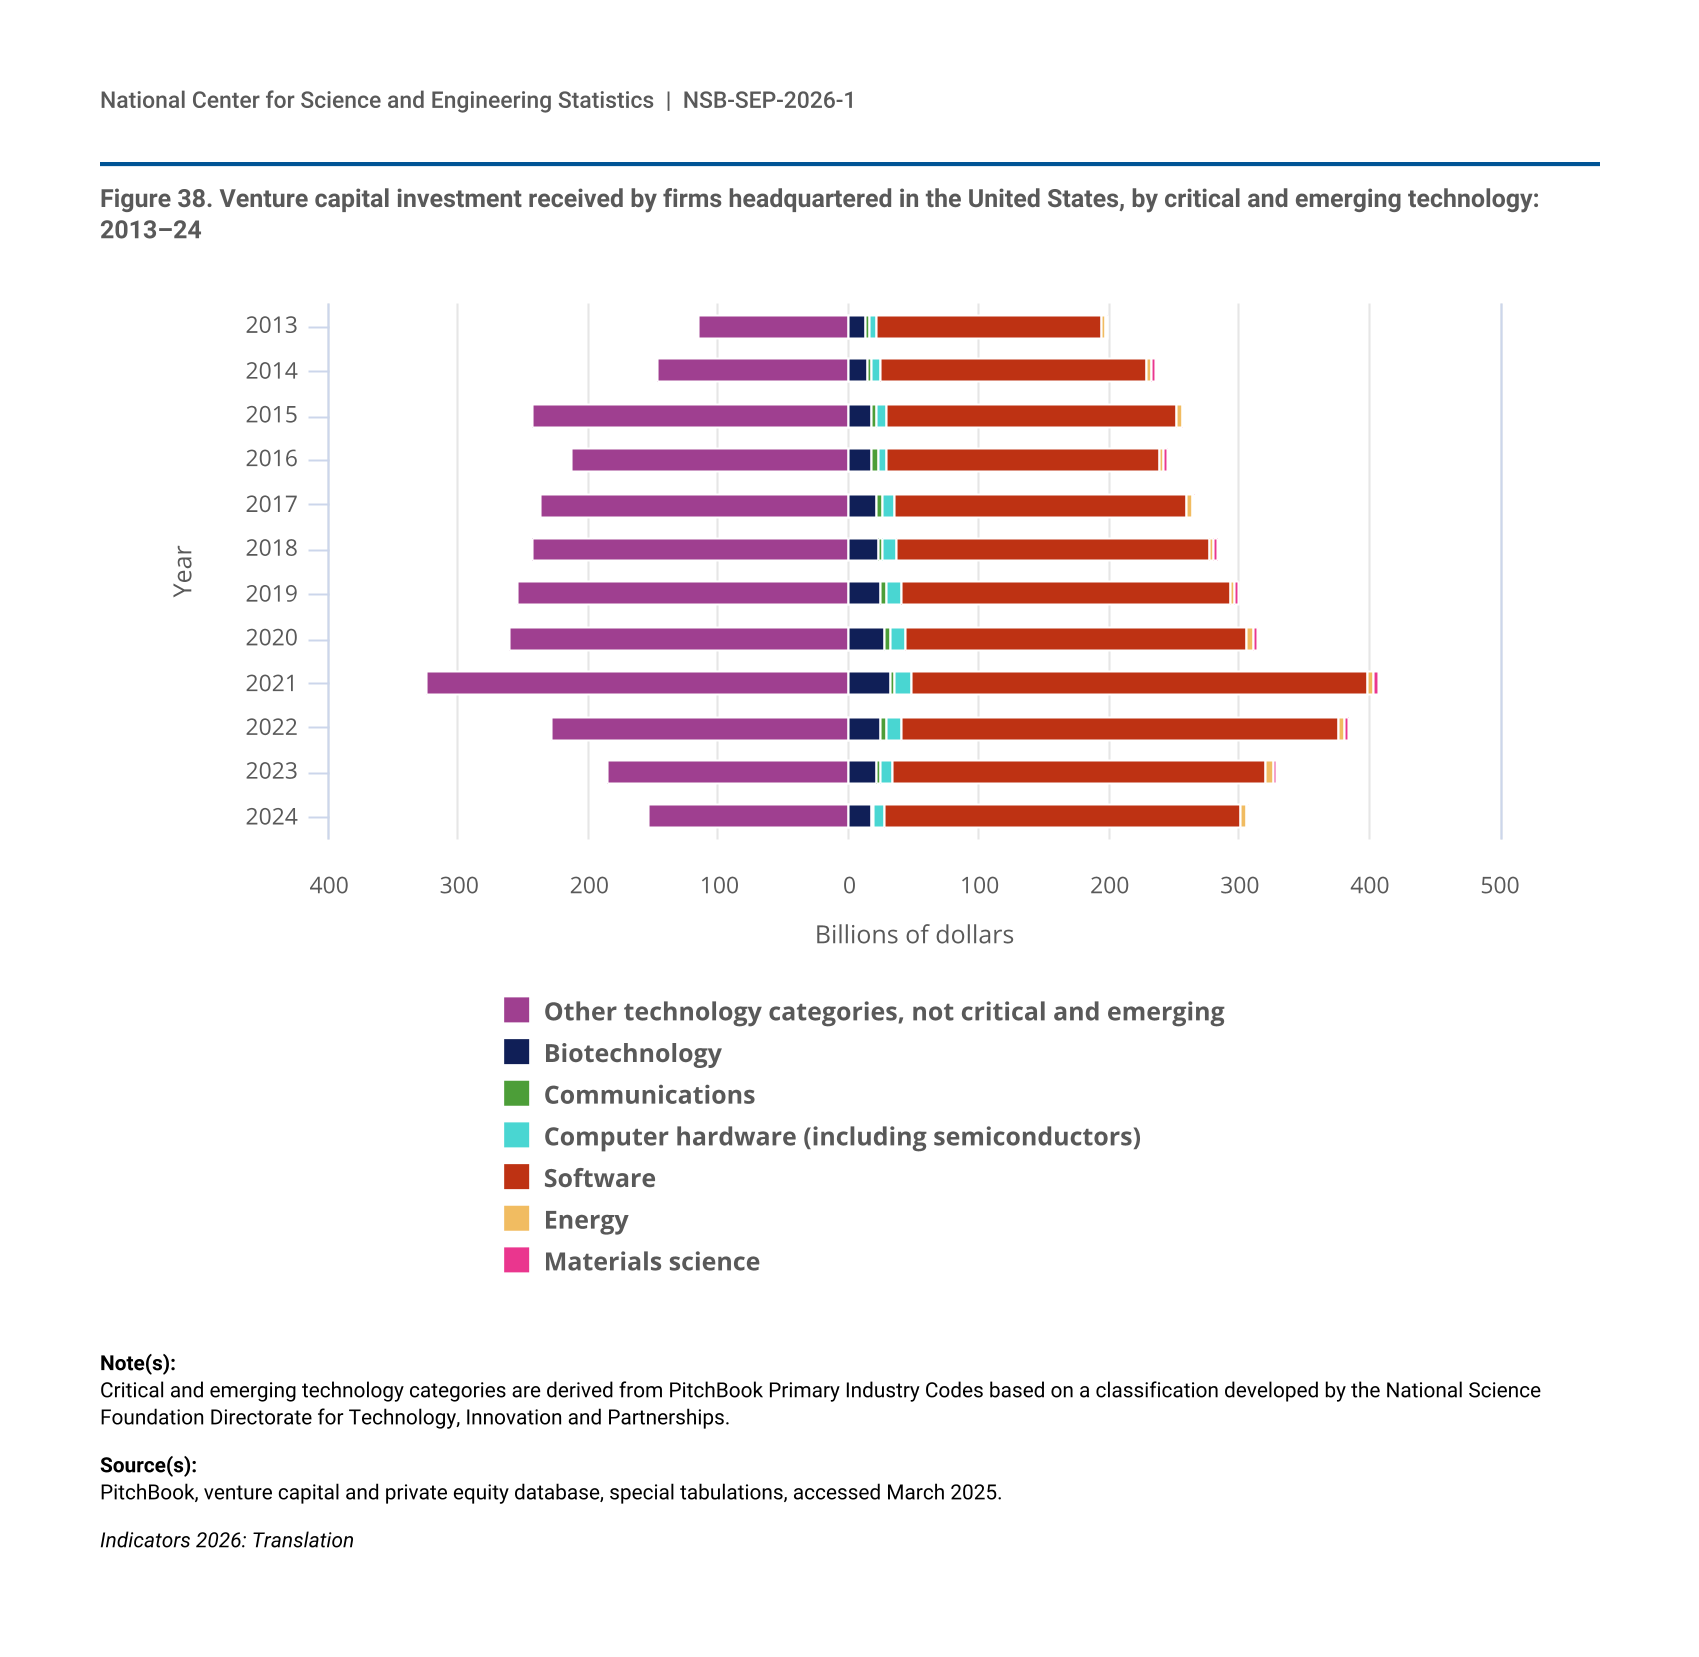
27 The section “Translation to Impact: U.S. and Global Science, Technology, and Innovation Output” draws on data and sources in the Indicators 2026 report “Translation to Impact: U.S. and Global Science, Technology, and Innovation Output.”
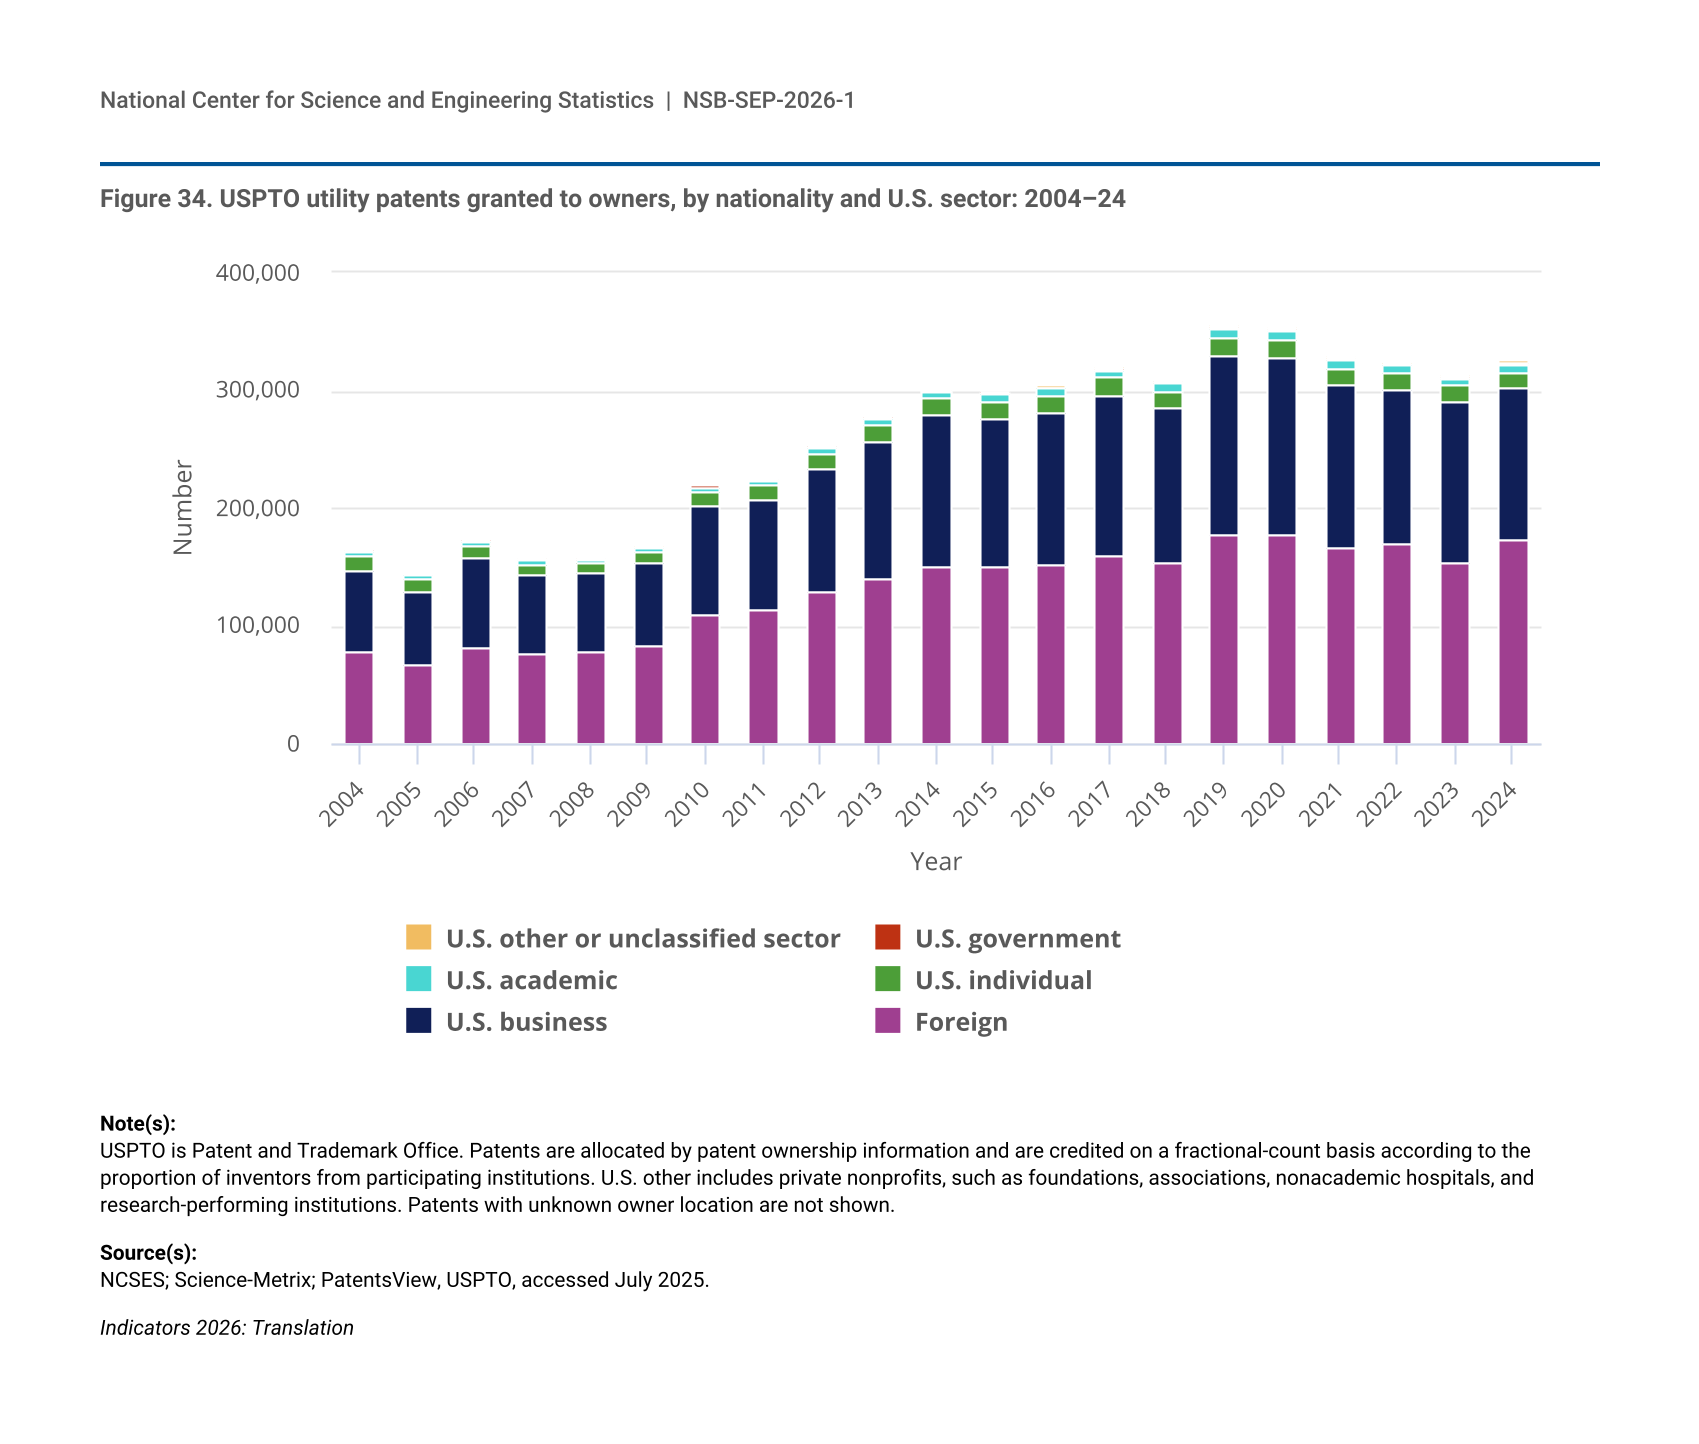
28 Patent totals cited in text include unclassified patents, which are not pictured in the related figures.
29 Technology categories for highly cited patents approximate but do not exactly match those for international priority patent families. For additional details, see the Indicators 2026 report “Translation to Impact: U.S. and Global Science, Technology, and Innovation Output.”
30 Categories described are aggregations of Nice classes. Trademarks are classified under the 11th edition of the Nice Classification (NCL) of goods and services, which classifies trademarks under 34 categories of goods and 11 categories of services.
31 Reported values are among only repositories with location information.
32 Unless otherwise stated, all dollar values in this section are provided in current dollars, unadjusted for inflation.