 An official website of the United States government
 Translation to Impact: U.S. and Global Science, Technology, and Innovation Output
Science, technology, and innovation (STI) activities expand the frontiers of fundamental and technical knowledge and often lead to new outputs such as research publications, new products and services, licensed technologies, and companies, which in turn impact economic output, productivity, and global trade. These outputs, along with the scientists, engineers, and skilled workers that enable them, contribute to the economic competitiveness and national security of the United States.
The impacts of S&E activities, particularly basic research, may not be realized for many years after they occur, thus making it challenging to assess the economic returns of investments in S&E. However, researchers have developed a variety of methods for estimating both short-term and long-term economic impacts of S&E activities. These approaches range from measuring the immediate economic impacts of S&E-related wages and procurement to calculating long-term effects on productivity from knowledge creation and diffusion (see Indicators 2026 report “Translation to Impact: U.S. and Global Science, Technology, and Innovation Output” sidebar “Measuring Short- and Long-Term Impacts of S&E Activity”).
Total Factor Productivity
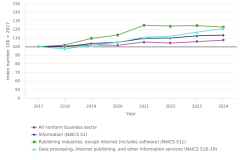
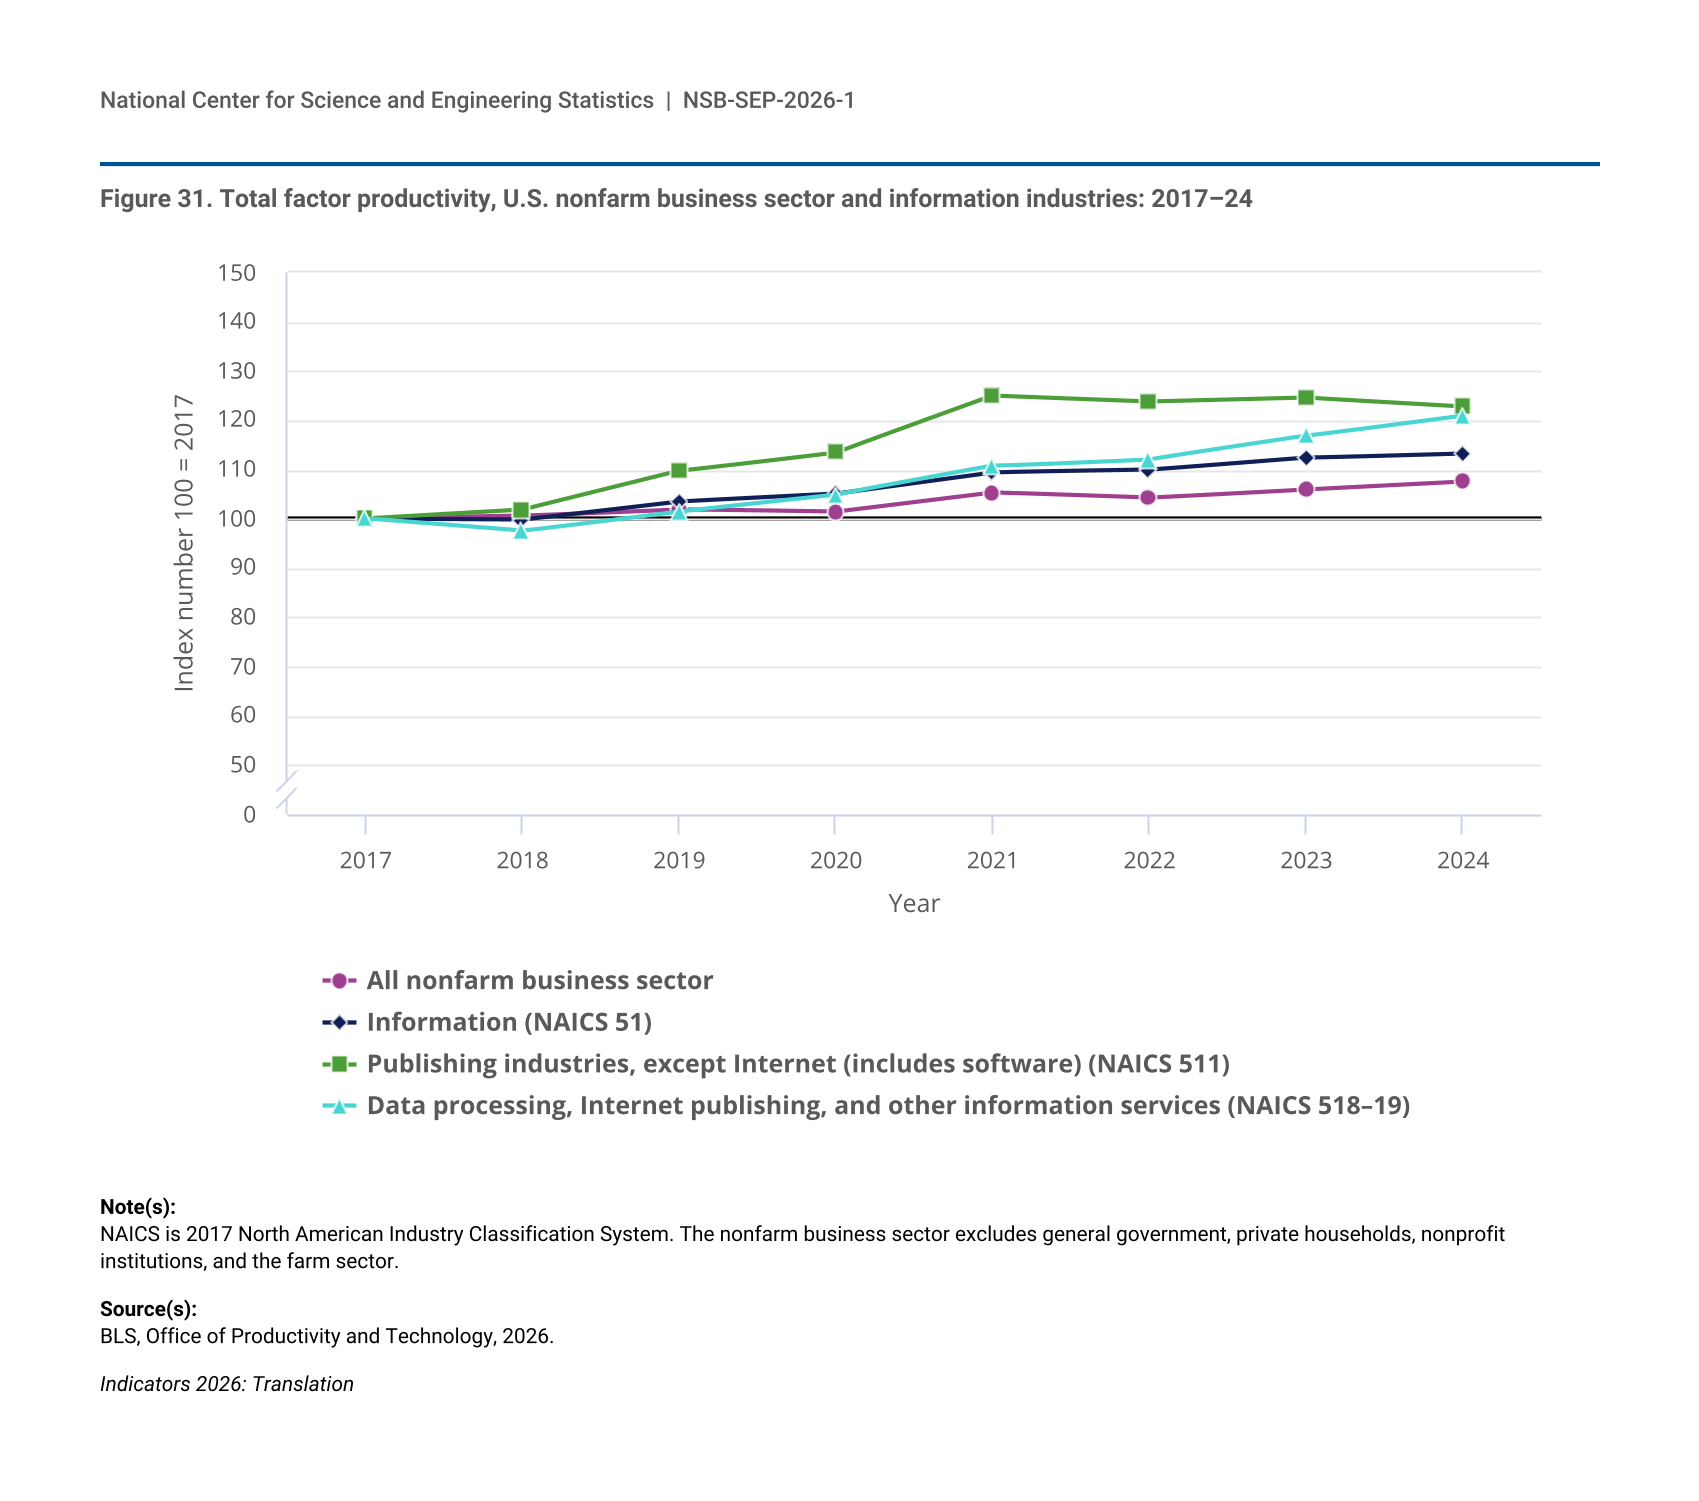
Total factor productivity (TFP) is an internationally comparable indicator of the impact of innovation and technological change on growth within an economy and its component industries. TFP is calculated by dividing output measures by input measures, gauging how efficiently inputs such as labor and capital are used to produce goods and services. Compared with the overall nonfarm business sector, TFP for the information sector has grown faster: 13% from 2017 to 2024, compared with 8% overall (Figure 31). Within the information sector, TFP for publishing industries (including software) and for data processing, Internet publishing, and other information services have increased by 23% and 21%, respectively, since 2017.
| Year | All nonfarm business sector | Information (NAICS 51) | Publishing industries, except Internet (includes software) (NAICS 511) | Data processing, Internet publishing, and other information services (NAICS 518–19) |
|---|---|---|---|---|
| 2017 | 100.0 | 100.0 | 100.0 | 100.0 |
| 2018 | 100.6 | 99.8 | 101.8 | 97.5 |
| 2019 | 101.9 | 103.5 | 109.7 | 101.5 |
| 2020 | 101.4 | 105.1 | 113.5 | 104.9 |
| 2021 | 105.3 | 109.4 | 125.0 | 110.7 |
| 2022 | 104.2 | 109.9 | 123.8 | 112.1 |
| 2023 | 105.9 | 112.4 | 124.6 | 116.8 |
| 2024 | 107.5 | 113.3 | 122.8 | 121.0 |
NAICS is 2017 North American Industry Classification System. The nonfarm business sector excludes general government, private households, nonprofit institutions, and the farm sector.
BLS, Office of Productivity and Technology, 2026.
AI has been identified as a rapidly growing general-purpose technology with broad-ranging implications for productivity and employment (see Indicators 2026 report “Translation to Impact: U.S. and Global Science, Technology, and Innovation Output” section “Total Factor Productivity and General-Purpose Technologies”). Industries in the information sector experiencing comparatively faster TFP growth in recent years have also utilized AI more widely than the private sector overall. According to the most recent data available (2020–22), economy-wide use of AI as part of production processes was 4% but was 26% in the software industry (North American Industry Classification System [NAICS] 5112) (NCSES 2025a). AI use as part of processes and methods was 20% for data processing, hosting, and related services (NAICS 518). Firms with more than 10,000 employees used AI as a production technology at more than twice the rate of firms with 1,000–9,999 employees (37% vs. 16%) and at nearly 10 times the rate of microbusinesses (1–9 employees) and small businesses (10–49 employees) (4% and 3%, respectively).
Knowledge and Technology Transfer
Federal Technology Transfer Activities
U.S. federal agencies frequently engage in processes and activities that support the translation of knowledge arising from R&D for wider use. In addition to broad federal funding and performance of R&D, federal employees engage in activities such as patenting, publishing, and creating open-source software (OSS). Researchers at federal agencies report the development of new techniques and technologies in the form of invention disclosures and participate in cooperative R&D agreements (CRADAs). CRADAs involve the coordination of a federal agency or laboratory with one or more nonfederal organizations in which the nonfederal organization provides resources for research activities and in exchange receives the option of exclusive licensing of any newly produced technologies. For prior data on these topics, see the Indicators 2024 report “Invention, Knowledge Transfer, and Innovation” (NSB 2024).
Federal agencies fund a significant share of the nation’s R&D, and acknowledgements of federal support in peer-reviewed S&E research publications are evidence of the federal government’s role in creating and diffusing knowledge. From 2002 to 2023, nine federal agencies each received more than 25,000 acknowledgements of funding in S&E articles (Table 6). The top agencies included HHS (including NIH) with nearly 2 million funding acknowledgements, and NSF with over 900,000 acknowledgments. HHS and NSF were also the most frequently acknowledged federal agencies within HCAs, those articles among the top 1% most-cited globally. Relative citation indices for all nine agencies listed were above 1.0, indicating significant scientific impact. Index scores were highest for DOD (3.6), DOE (2.9), and NSF (2.7).
Articles are classified by their year of publication. Whole counting is used. An article is considered to be federally funded if the funding information tied with the publication record in Scopus links it with one of the U.S. federal agencies. Not all Scopus publications have funding information available, and coverage has evolved with time. Because citation scores are not computed after 2022, the relative citation index is not simply the ratio of the count of publications in the top 1% over the total number of publications because publications without a citation score are excluded in the denominator.
NCSES; Science-Metrix; Elsevier, Scopus abstract and citation database, accessed February 2025.
Indicators 2026: State of U.S. S&E
University Technology Transfer Activities
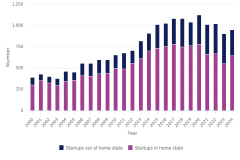
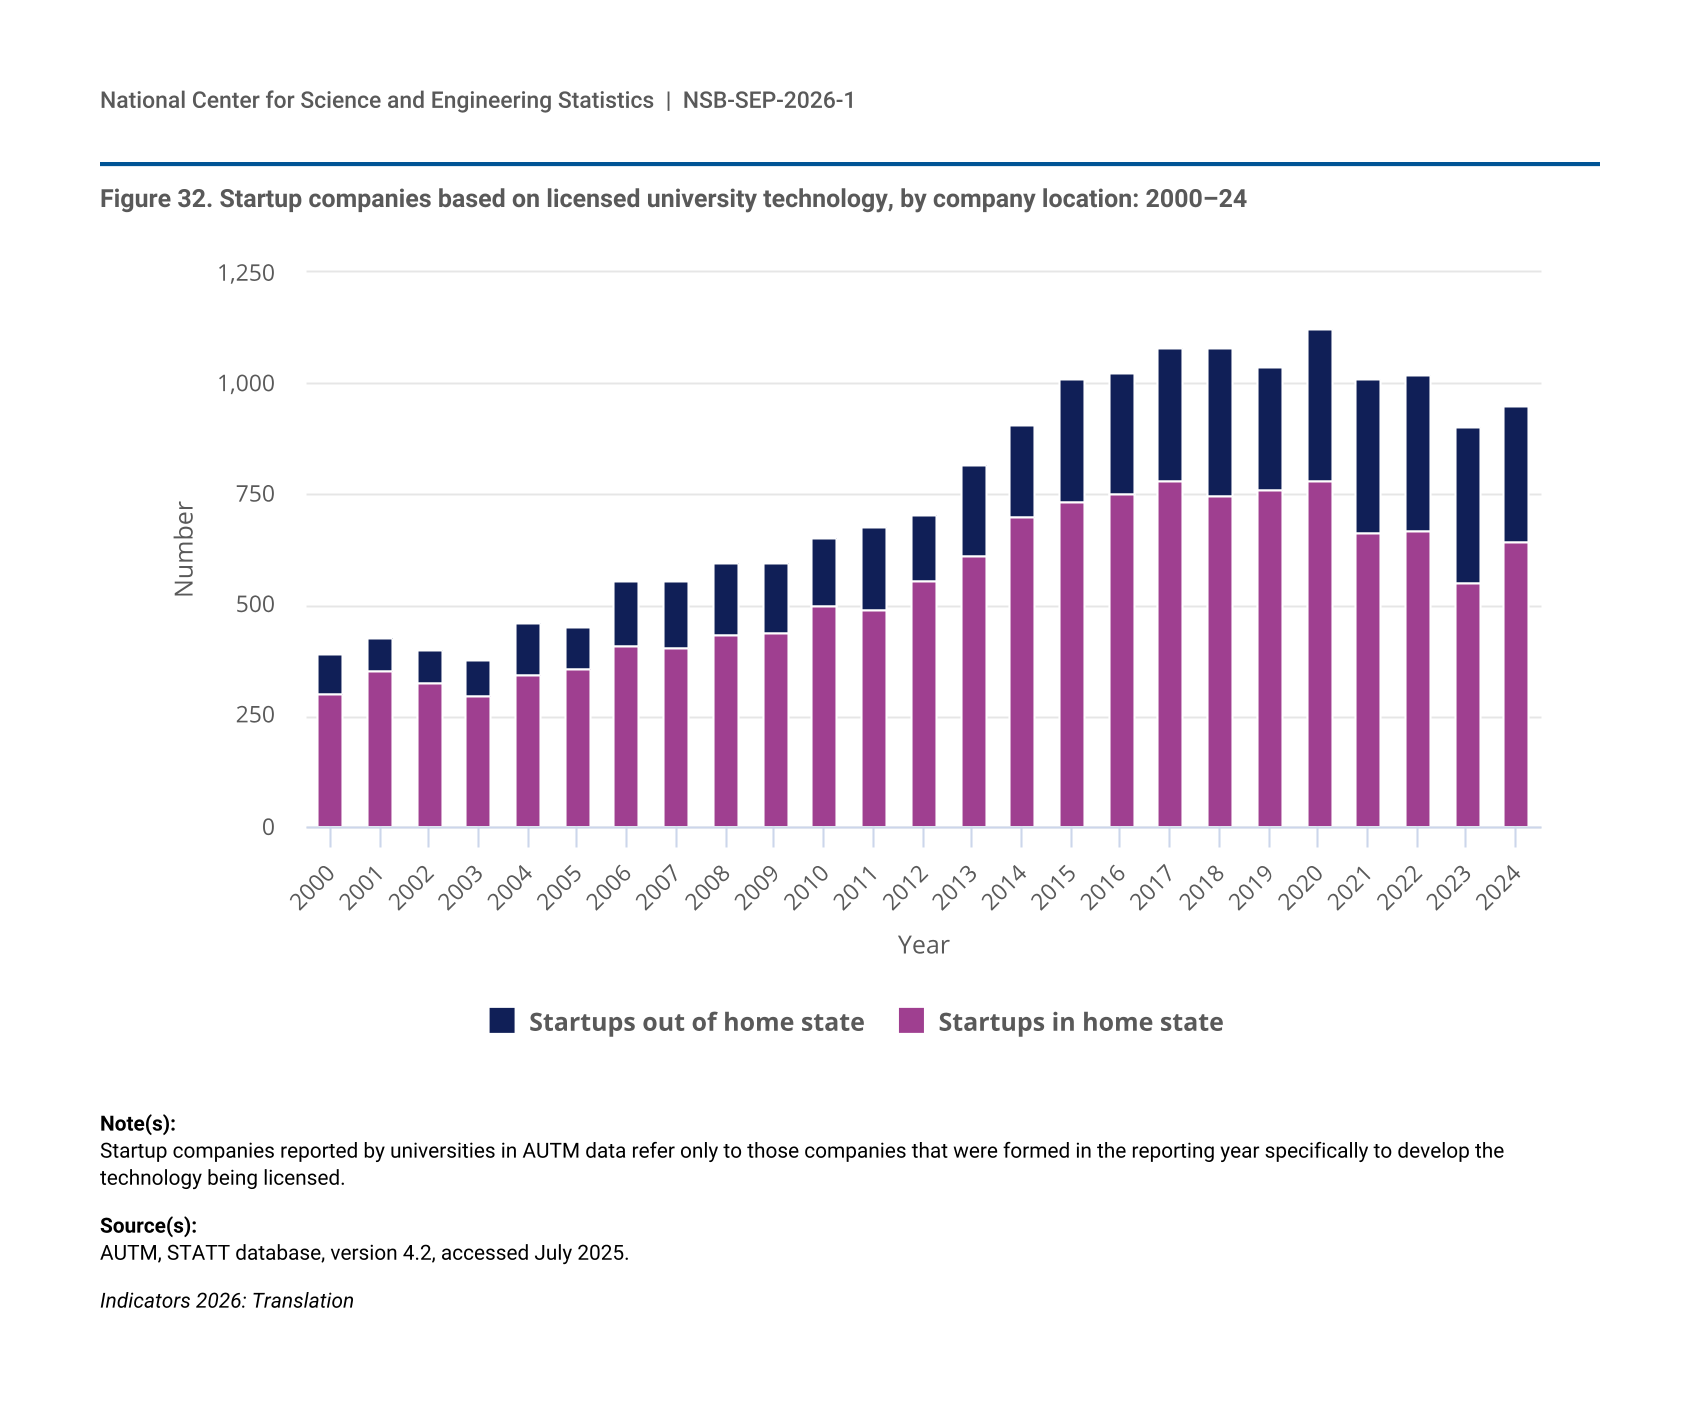
Universities may leverage the results of their research into private-sector innovations through licensing outside the university and forming startup companies. Patented inventions can be licensed directly to a preestablished external party or to a new startup; alternately, an exclusive option can be granted for licensing rights at a future date. U.S. universities issued 7,673 new licenses and 1,534 options in 2024. There were 951 university-related startups launched in 2024, a decline from the peak of 1,125 in 2020 (Figure 32). The majority of university-related startups since 2000 were launched in the home state of the research university from which the technology was transferred, ranging from 83% in 2001 to 61% in 2023. Startups formed specifically to develop and license university technology are a small subset of newly established businesses in the United States. However, these startups, often launched by university faculty and students, are one of the most direct means of translating findings and innovation from universities to the private sector.
| Year | Startups in home state | Startups out of home state |
|---|---|---|
| 2000 | 299 | 89 |
| 2001 | 353 | 73 |
| 2002 | 325 | 76 |
| 2003 | 295 | 79 |
| 2004 | 344 | 118 |
| 2005 | 357 | 94 |
| 2006 | 410 | 144 |
| 2007 | 402 | 153 |
| 2008 | 430 | 165 |
| 2009 | 435 | 161 |
| 2010 | 498 | 153 |
| 2011 | 491 | 185 |
| 2012 | 554 | 151 |
| 2013 | 611 | 207 |
| 2014 | 702 | 207 |
| 2015 | 735 | 277 |
| 2016 | 752 | 272 |
| 2017 | 782 | 298 |
| 2018 | 749 | 331 |
| 2019 | 763 | 277 |
| 2020 | 778 | 347 |
| 2021 | 663 | 346 |
| 2022 | 668 | 350 |
| 2023 | 552 | 351 |
| 2024 | 642 | 309 |
Startup companies reported by universities in AUTM data refer only to those companies that were formed in the reporting year specifically to develop the technology being licensed.
AUTM, STATT database, version 4.2, accessed July 2025.
Knowledge Flows: Patent Citations to Academic Research
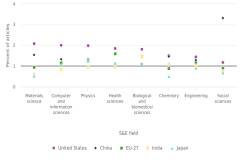
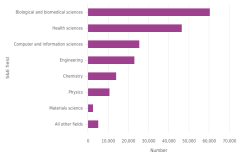
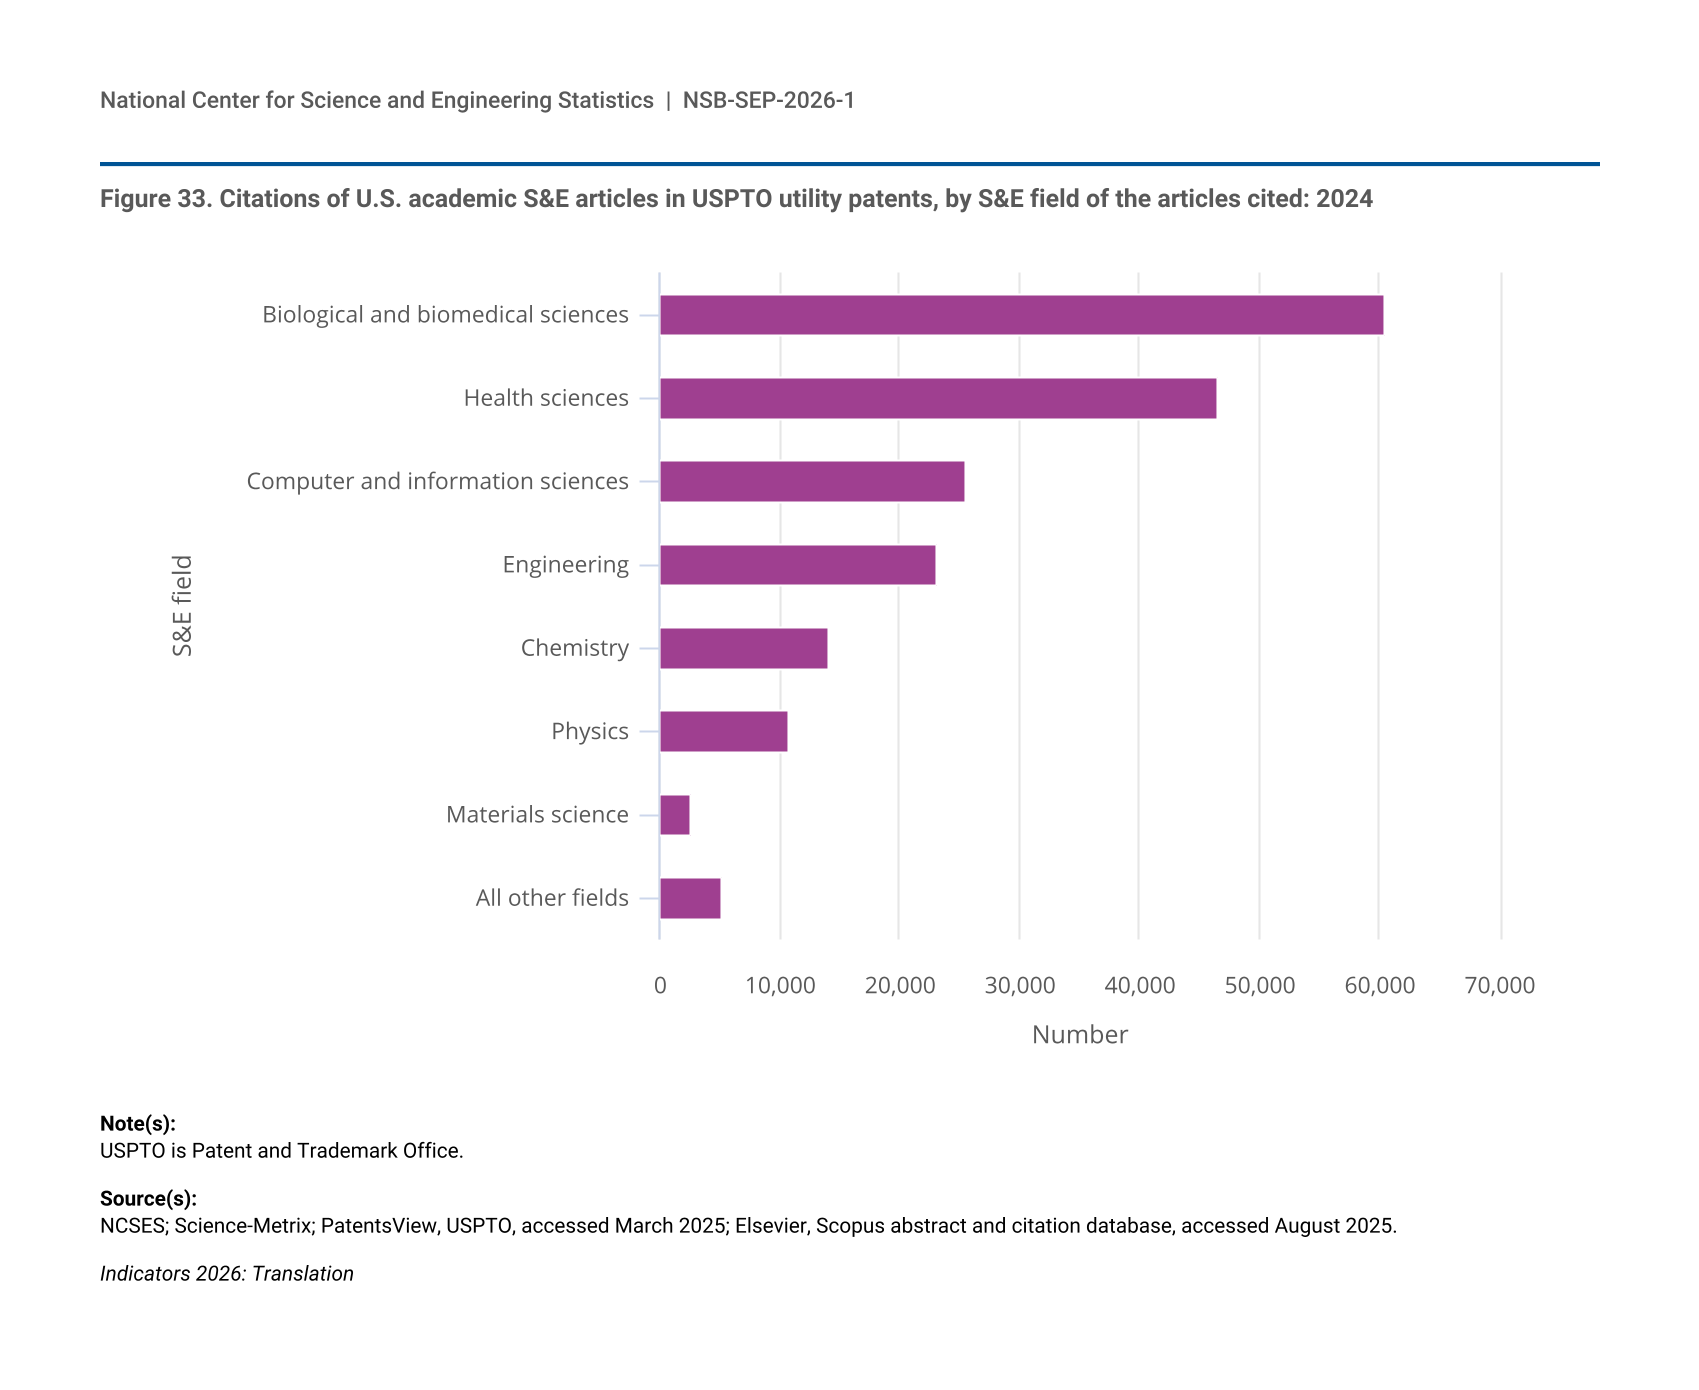
Publicly funded knowledge also flows into the market through its contribution to patents for useful inventions. When peer-reviewed publications are cited in patent documents, the linkage suggests that scientific literature may have contributed knowledge to the patented invention. U.S. patents issued in 2024 contained about 642,000 citations to S&E articles, 56% of which were to foreign authors, 29% to U.S. academic authors, 7% to U.S. business authors, and the remainder to other or a combination of U.S. sectors. Patent citations to S&E articles by U.S. academic authors were most commonly made to articles in biological and biomedical sciences and in health sciences (Figure 33). Together, articles in these two fields accounted for 57% of all S&E articles from the U.S. academic sector that were cited by U.S. patents in 2024.
| S&E field | Citations |
|---|---|
| Biological and biomedical sciences | 60,387 |
| Health sciences | 46,628 |
| Computer and information sciences | 25,581 |
| Engineering | 23,055 |
| Chemistry | 14,146 |
| Physics | 10,849 |
| Materials science | 2,646 |
| All other fields | 5,197 |
USPTO is Patent and Trademark Office.
NCSES; Science-Metrix; PatentsView, USPTO, accessed March 2025; Elsevier, Scopus abstract and citation database, accessed August 2025.
Invention for the U.S. Market: U.S. Patent Trends
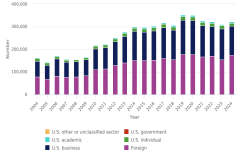
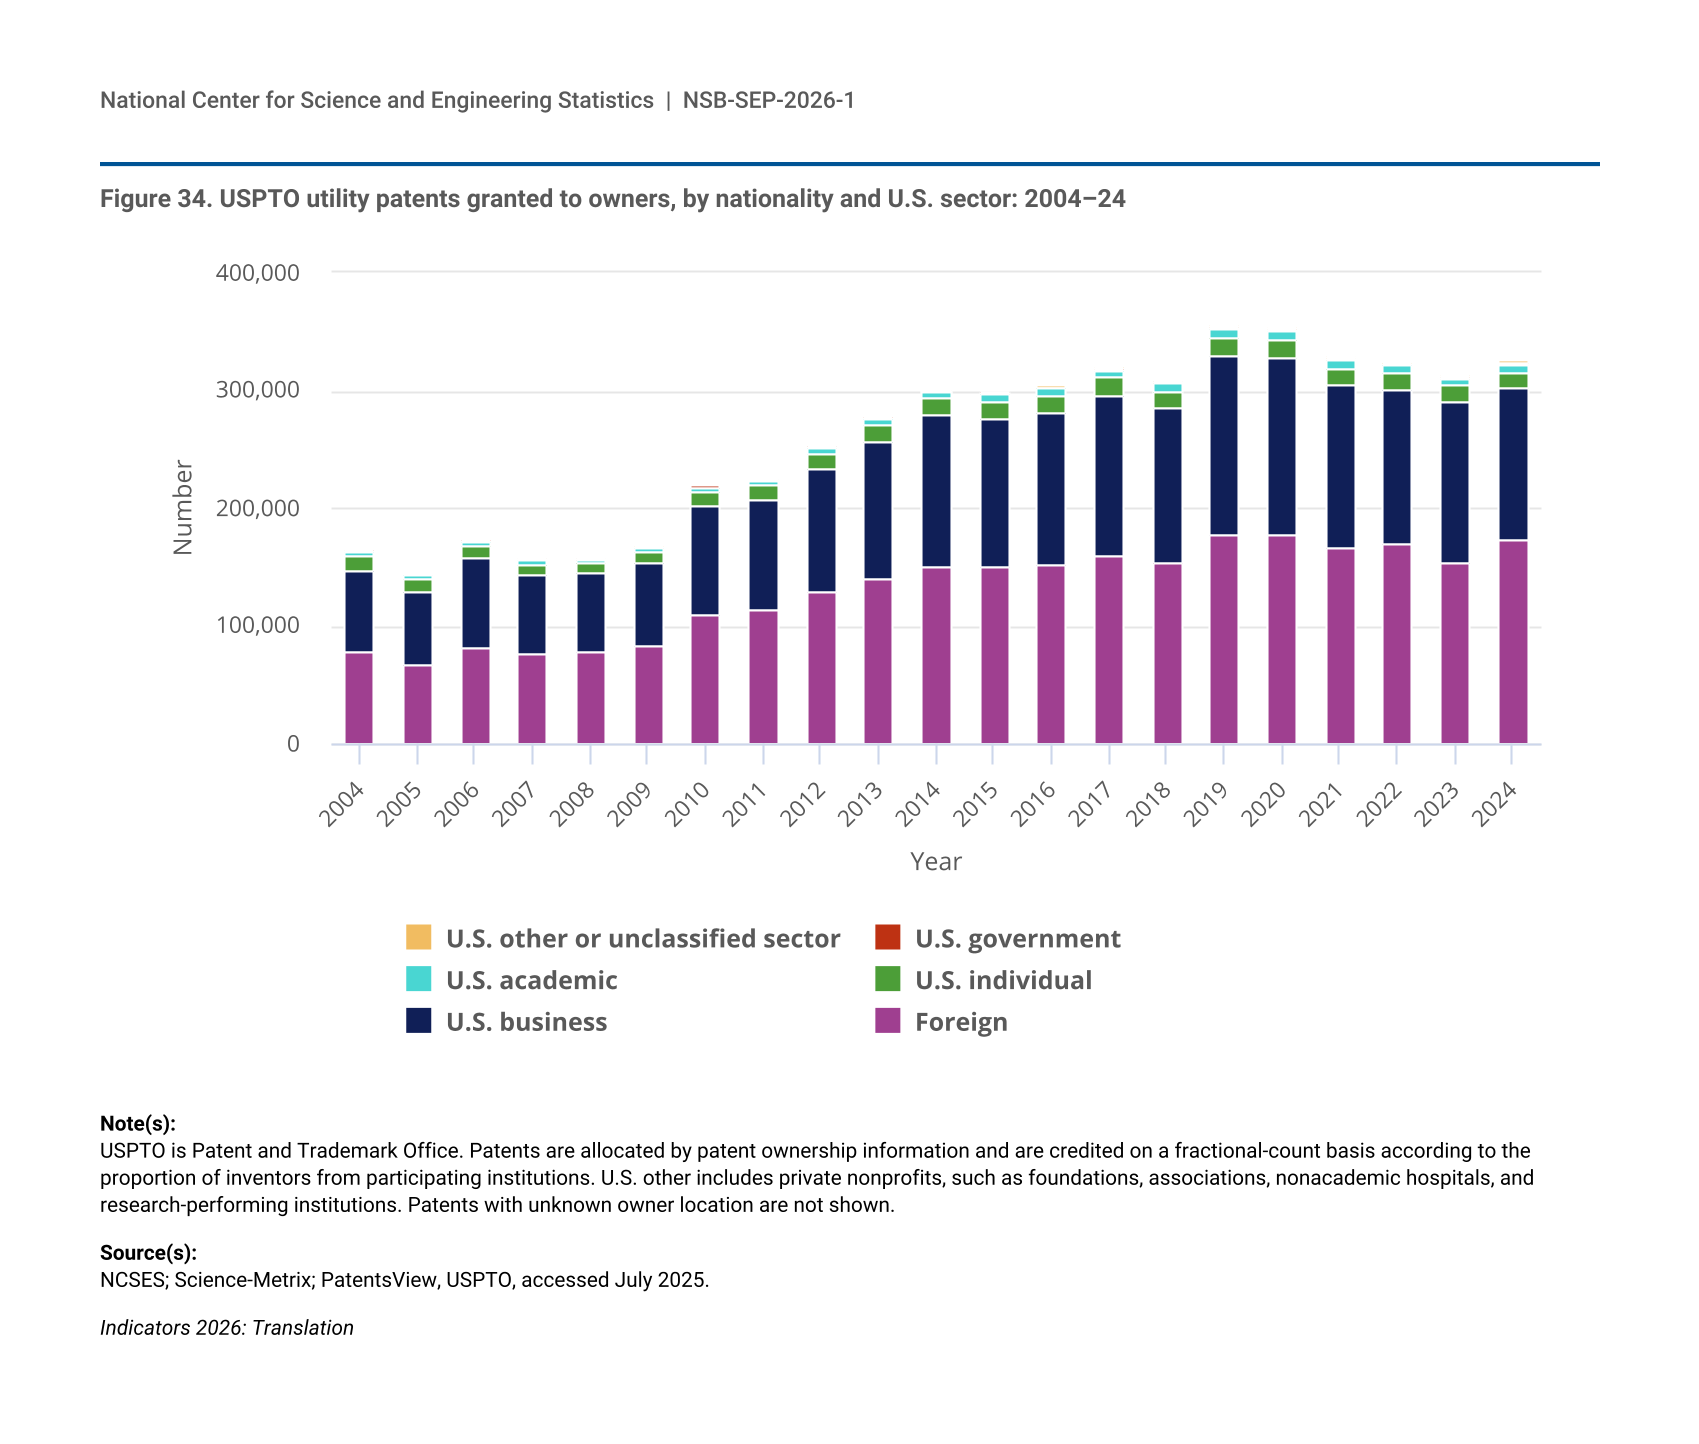
Invention is the creation of new and useful products and processes as well as their improvement (see the “Glossary” section for related definitions). The USPTO grants protection for inventions in the U.S. market, and patent documents provide detailed information that is widely used to understand invention activity. The USPTO awarded 326,000 utility patents in 2024, of which 152,000 (47%) were assigned to domestic U.S. owners (Figure 34). Businesses received by far the largest share of patents awarded to U.S owners (85%), whereas individual filers and those in academia and government accounted for much smaller shares. Patents assigned to U.S. businesses declined 15% between 2019 and 2024, in contrast to a general upward trend from 2008 to 2019. The share of USPTO patents awarded to foreign owners has continued to increase, reaching 53% in 2024.
| Year | Foreign | U.S. business | U.S. individual | U.S. academic | U.S. government | U.S. other or unclassified sector |
|---|---|---|---|---|---|---|
| 2004 | 78,084 | 69,389 | 12,181 | 3,262 | 1,019 | 425 |
| 2005 | 67,615 | 61,723 | 10,482 | 2,876 | 844 | 330 |
| 2006 | 82,239 | 74,610 | 12,006 | 3,520 | 1,008 | 407 |
| 2007 | 76,192 | 66,550 | 10,050 | 3,215 | 946 | 331 |
| 2008 | 78,216 | 66,130 | 9,205 | 3,024 | 905 | 281 |
| 2009 | 83,055 | 70,646 | 9,210 | 3,265 | 931 | 328 |
| 2010 | 109,149 | 91,856 | 12,556 | 4,516 | 1,257 | 482 |
| 2011 | 113,068 | 93,769 | 11,906 | 4,414 | 1,195 | 487 |
| 2012 | 128,616 | 105,242 | 12,810 | 5,042 | 1,359 | 539 |
| 2013 | 139,354 | 117,539 | 13,914 | 5,625 | 1,447 | 605 |
| 2014 | 150,216 | 128,672 | 14,421 | 6,086 | 1,430 | 764 |
| 2015 | 151,166 | 125,739 | 14,078 | 6,180 | 1,376 | 815 |
| 2016 | 152,730 | 128,858 | 13,902 | 6,630 | 1,299 | 666 |
| 2017 | 159,565 | 136,724 | 14,348 | 7,005 | 1,342 | 994 |
| 2018 | 154,379 | 131,419 | 13,760 | 6,892 | 1,312 | 1,072 |
| 2019 | 177,043 | 152,821 | 15,173 | 7,795 | 1,434 | 1,632 |
| 2020 | 176,567 | 151,535 | 14,759 | 7,841 | 1,244 | 1,718 |
| 2021 | 166,585 | 138,011 | 14,229 | 7,228 | 1,262 | 1,732 |
| 2022 | 170,554 | 130,558 | 13,619 | 6,752 | 1,291 | 1,888 |
| 2023 | 154,281 | 136,375 | 13,170 | 6,612 | 1,364 | 1,870 |
| 2024 | 173,529 | 129,766 | 12,262 | 6,761 | 1,289 | 1,959 |
USPTO is Patent and Trademark Office. Patents are allocated by patent ownership information and are credited on a fractional-count basis according to the proportion of inventors from participating institutions. U.S. other includes private nonprofits, such as foundations, associations, nonacademic hospitals, and research-performing institutions. Patents with unknown owner location are not shown.
NCSES; Science-Metrix; PatentsView, USPTO, accessed July 2025.
The organizations with the highest level of USPTO patenting include both domestic and foreign businesses. The organizations with the largest number of USPTO patents granted in 2024 were Samsung (10,220), Taiwan Semiconductor Manufacturing Company (TSMC) (3,994), and Apple (3,505) (Table 7). The presence of these businesses among the top patenting organizations is an indication of the strategic value they see in intellectual property (IP) protection in the U.S. market. Many of the organizations with the greatest number of patents are also among the most highly valued companies in the world, with market capitalizations reaching into the trillions of dollars in recent years. For example, TSMC, Apple, Alphabet (Google), Microsoft, and Amazon were all among the top USPTO patenting organizations in 2024, and as of April 2026, these organizations were all in the top 10 companies globally by market capitalization, valued at more than $1 trillion each (Nasdaq 2026).
USPTO is Patent and Trademark Office. Patents are allocated according to patent ownership information. Patents are credited on a full-count basis (i.e., for patents with collaborating institutions, each institution receives full credit on the basis of the proportion of inventors from participating institutions). Organizations with more than 1,000 patents are shown. Curated profiles of organizations are based on the disambiguation information available in PatentsView. Subsidiaries are not merged under the profile of their parent organization.
NCSES; Science-Metrix (Elsevier); PatentsView, USPTO, accessed March 2025.
Indicators 2026: State of U.S. S&E
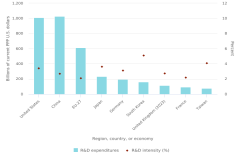
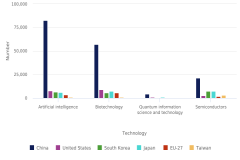
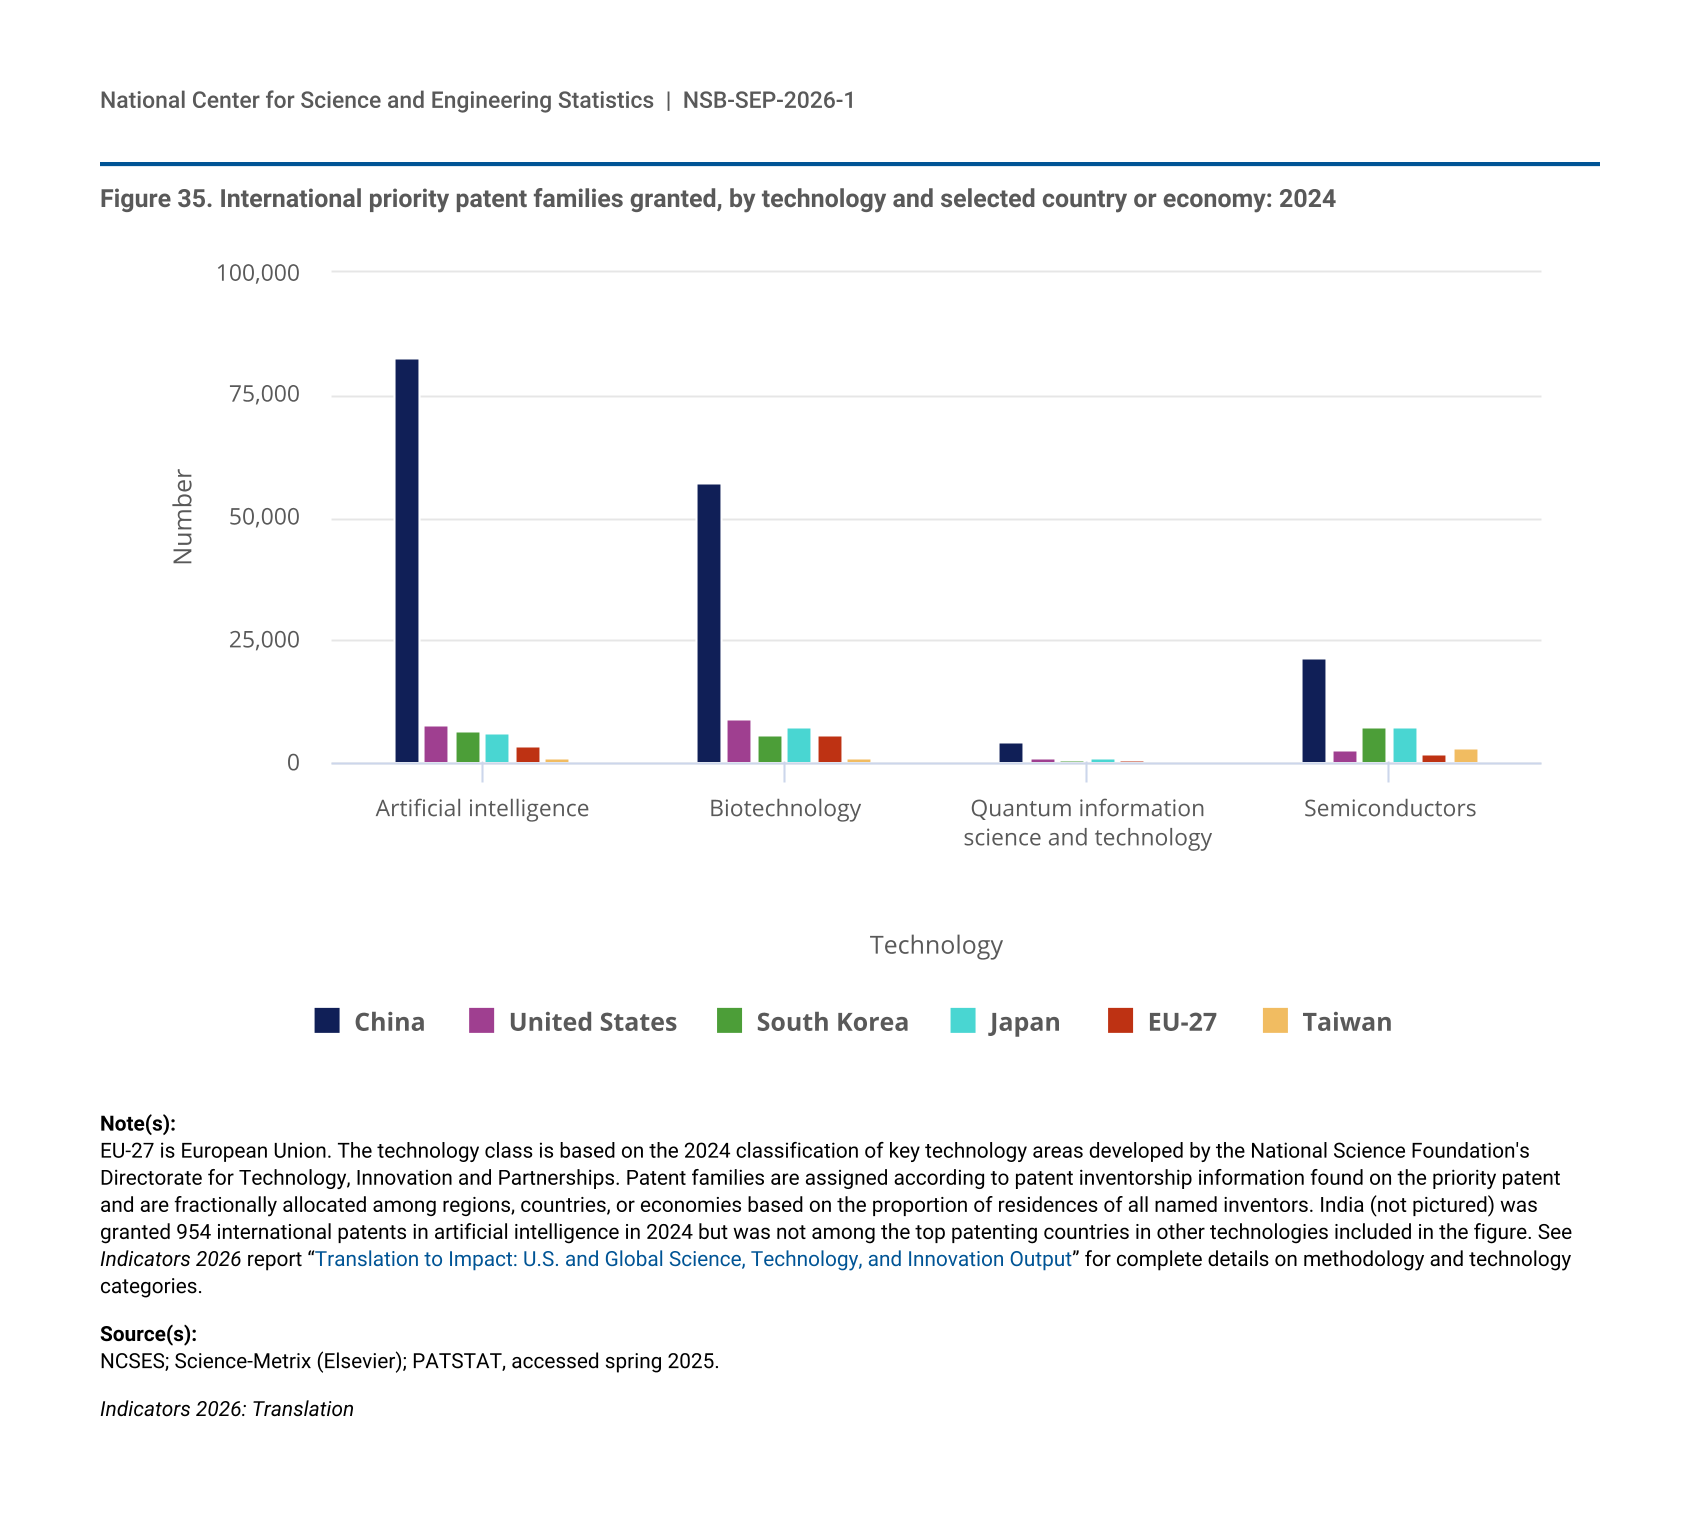
Invention in Critical and Emerging Technologies: International Patenting
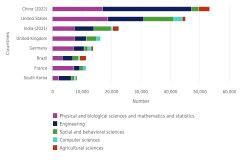
International priority patent families provide a more globally representative picture of patenting of inventions compared with USPTO patents (see the “Glossary” section for definition). Inventors who apply for these patents are implicitly preparing to seek protection in more than one international market. This section focuses on international patenting trends for leading countries and economies in five CET areas identified by policymakers in recent years for their strategic importance: AI, QIST, biotechnology, semiconductors, and nuclear technologies (Biden 2022; Kratsios 2025; NSTC 2025; Trump 2025).
China accounts for large shares of priority patent families across all five CETs. Inventors in China were granted by far the most priority patent families in AI (about 83,000), biotechnology (57,000), and QIST (4,000) (Figure 35). In each of these technology areas, inventors in China accounted for nearly half or more than the global total. The United States, South Korea, Japan, and the EU-27 were consistently the other top patenting countries and economies across these three categories but collectively still had fewer priority patent families than China (NSB 2026b: Figure TRN-8, Figure TRN-11, Figure TRN-14, Figure TRN-17).
| Technology | China | United States | South Korea | Japan | EU-27 | Taiwan |
|---|---|---|---|---|---|---|
| Artificial intelligence | 82,708 | 7,584 | 6,377 | 5,778 | 3,374 | 826 |
| Biotechnology | 57,146 | 8,891 | 5,513 | 7,369 | 5,590 | 1,050 |
| Quantum information science and technology | 4,319 | 812 | 524 | 940 | 443 | 183 |
| Semiconductors | 21,329 | 2,709 | 7,192 | 7,040 | 1,667 | 3,108 |
EU-27 is European Union. The technology class is based on the 2024 classification of key technology areas developed by the National Science Foundation's Directorate for Technology, Innovation and Partnerships. Patent families are assigned according to patent inventorship information found on the priority patent and are fractionally allocated among regions, countries, or economies based on the proportion of residences of all named inventors. India (not pictured) was granted 954 international patents in artificial intelligence in 2024 but was not among the top patenting countries in other technologies included in the figure. See Indicators 2026 report “Translation to Impact: U.S. and Global Science, Technology, and Innovation Output” for complete details on methodology and technology categories.
NCSES; Science-Metrix (Elsevier); PATSTAT, accessed spring 2025.
China was the largest producer of international priority patent families in semiconductors and nuclear technologies in 2024 (NSB 2026b: Table STRN-21 and Table STRN-27). Compared with other CETs, priority patent families in semiconductors were more distributed throughout East Asia, where the top four countries and economies—China (about 21,000 patents), South Korea (7,000), Japan (7,000), and Taiwan (3,000)—collectively accounted for nearly 90% of total priority patent families (NSB 2026b: Table STRN-21). Taiwan was most prominent in semiconductors, where 7% of priority patent families were attributed to it, substantially higher than its share of the global total in other CETs. A much smaller number of priority patent families is granted in nuclear technologies relative to the other critical technologies, although inventors from China still accounted for the largest share (68%) of the global total in 2024. South Korea, Japan, and the United States were the next-largest sources of priority patent families in nuclear technologies; Taiwan ranked comparatively lower in this category.
The position of major patenting countries and economies changes substantially when focusing the analysis on highly cited patents, which provide a measure of patents’ impact on subsequent invention. Across many CET areas, priority patent families awarded in 2021 to U.S. inventors were more likely to be in the top 1% of cited patents compared with those from China and the EU-27. For example, the United States had a highly cited patent share of 1.73 in AI, machine learning, autonomy, and related advances compared with 1.36 for China and 0.84 for the EU-27 (NSB 2026b: Table STRN-17). The United States had a significantly higher patent citation share than China in other technologies in which China was by far the largest producer of international patents: QIST (1.84 vs. 1.27) and biotechnology, medical technology, genomics, and synthetic biology (3.07 vs. 1.18) (NSB 2026b: Table STRN-20 and Table STRN-26).
Innovation
Innovation is the translation of knowledge arising from R&D activities into new or improved products, processes, or services with real-world applications (see the “Glossary” section for internationally comparable definition). Innovation is measured through its incidence (survey measurement), activities (STEM education and workforce), outputs (products and processes), outcomes (economic growth and societal benefits), and the creation of intangible capital (Aizcorbe, Moylan, and Robbins 2009). Three indicators of innovation are discussed in this section: business registration of trademarks, OSS contributions, and the introduction of new products and processes in the business sector.
Trademarks
Trademark data complement patent data as indicators of innovation activity. In 2024, USPTO registered about 378,000 trademarks to owners across the world, including about 212,000 registered to U.S. owners. Trademarks are particularly valuable as innovation indicators for firms that produce services and firms that are knowledge or innovation intensive. Three service-industry categories—education, training, entertainment, and sporting and cultural activities (about 41,000); scientific research, information, and communication technology (35,000); and advertising, business management, business administration, and office functions (35,000)—had the highest number of U.S.-registered trademarks in 2024.
Open-Source Software
Some inventions and knowledge products are created with the intention of being widely shared. Broadly defined, OSS is any software that is accessed, modified, and distributed freely. Economists have estimated a value of $8.8 trillion for the OSS used by businesses (Layne 2024). Based on data from GitHub, the world’s largest source code–hosting platform, the United States has the highest number of contributors to OSS repositories, although participation has become increasingly global. For new repositories created in 2010, 37% of GitHub contributors were from the United States; by 2023, U.S. contributors accounted for 15% of new repositories. In 2023, seven countries accounted for over half of the contributors to repositories (regardless of the year of the repository’s creation). Contributors from the United States accounted for the largest share of GitHub repository contributors (16.2%), followed by Brazil (7.5%) and India (7.5%).
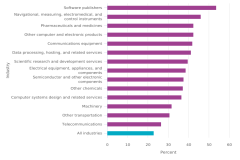
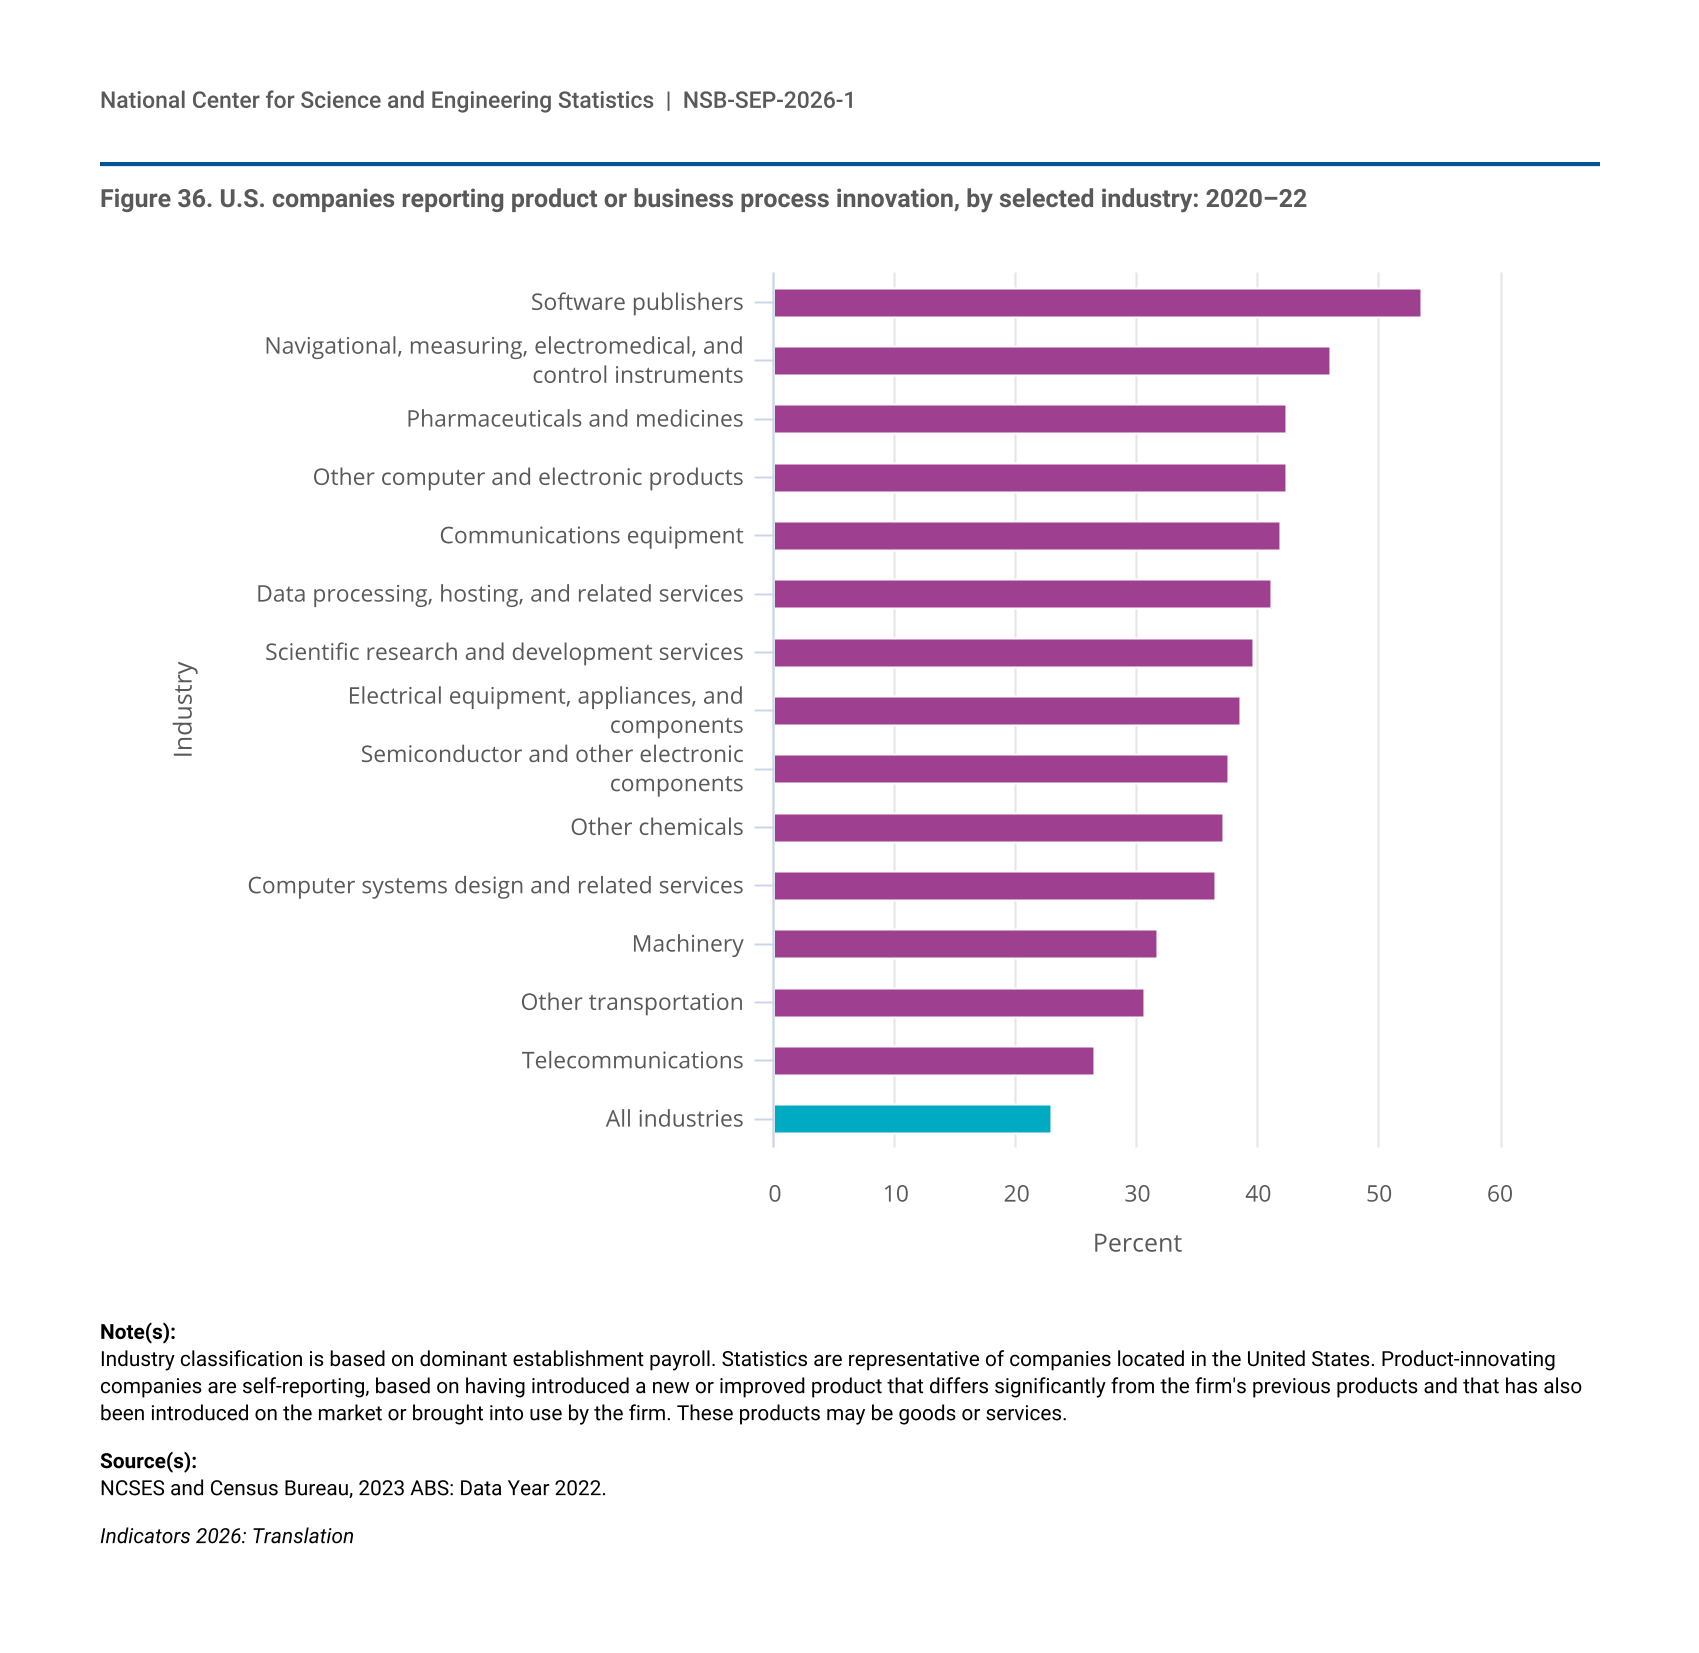
Business-Reported Innovation Rates
A key indicator of business-sector innovation is the proportion of companies within an industry that introduce new or significantly improved products and processes. Slightly less than a quarter (23%) of U.S. companies introduced a product or process innovation during the 3-year period of 2020–22 (Figure 36). Many of the industries that invest heavily in R&D also have high innovation rates (see the “Business R&D” section). Software publishers had the highest rate of reported innovation; 54% of companies in this industry reported having introduced a product innovation within the 2020–22 period.
| Industry | Percent |
|---|---|
| Software publishers | 53.6 |
| Navigational, measuring, electromedical, and control instruments | 46.1 |
| Pharmaceuticals and medicines | 42.4 |
| Other computer and electronic products | 42.4 |
| Communications equipment | 41.9 |
| Data processing, hosting, and related services | 41.2 |
| Scientific research and development services | 39.6 |
| Electrical equipment, appliances, and components | 38.6 |
| Semiconductor and other electronic components | 37.6 |
| Other chemicals | 37.3 |
| Computer systems design and related services | 36.6 |
| Machinery | 31.8 |
| Other transportation | 30.7 |
| Telecommunications | 26.6 |
| All industries | 22.9 |
Industry classification is based on dominant establishment payroll. Statistics are representative of companies located in the United States. Product-innovating companies are self-reporting, based on having introduced a new or improved product that differs significantly from the firm's previous products and that has also been introduced on the market or brought into use by the firm. These products may be goods or services.
NCSES and Census Bureau, 2023 ABS: Data Year 2022.
Business Dynamics and Venture Capital
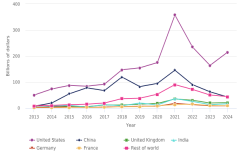
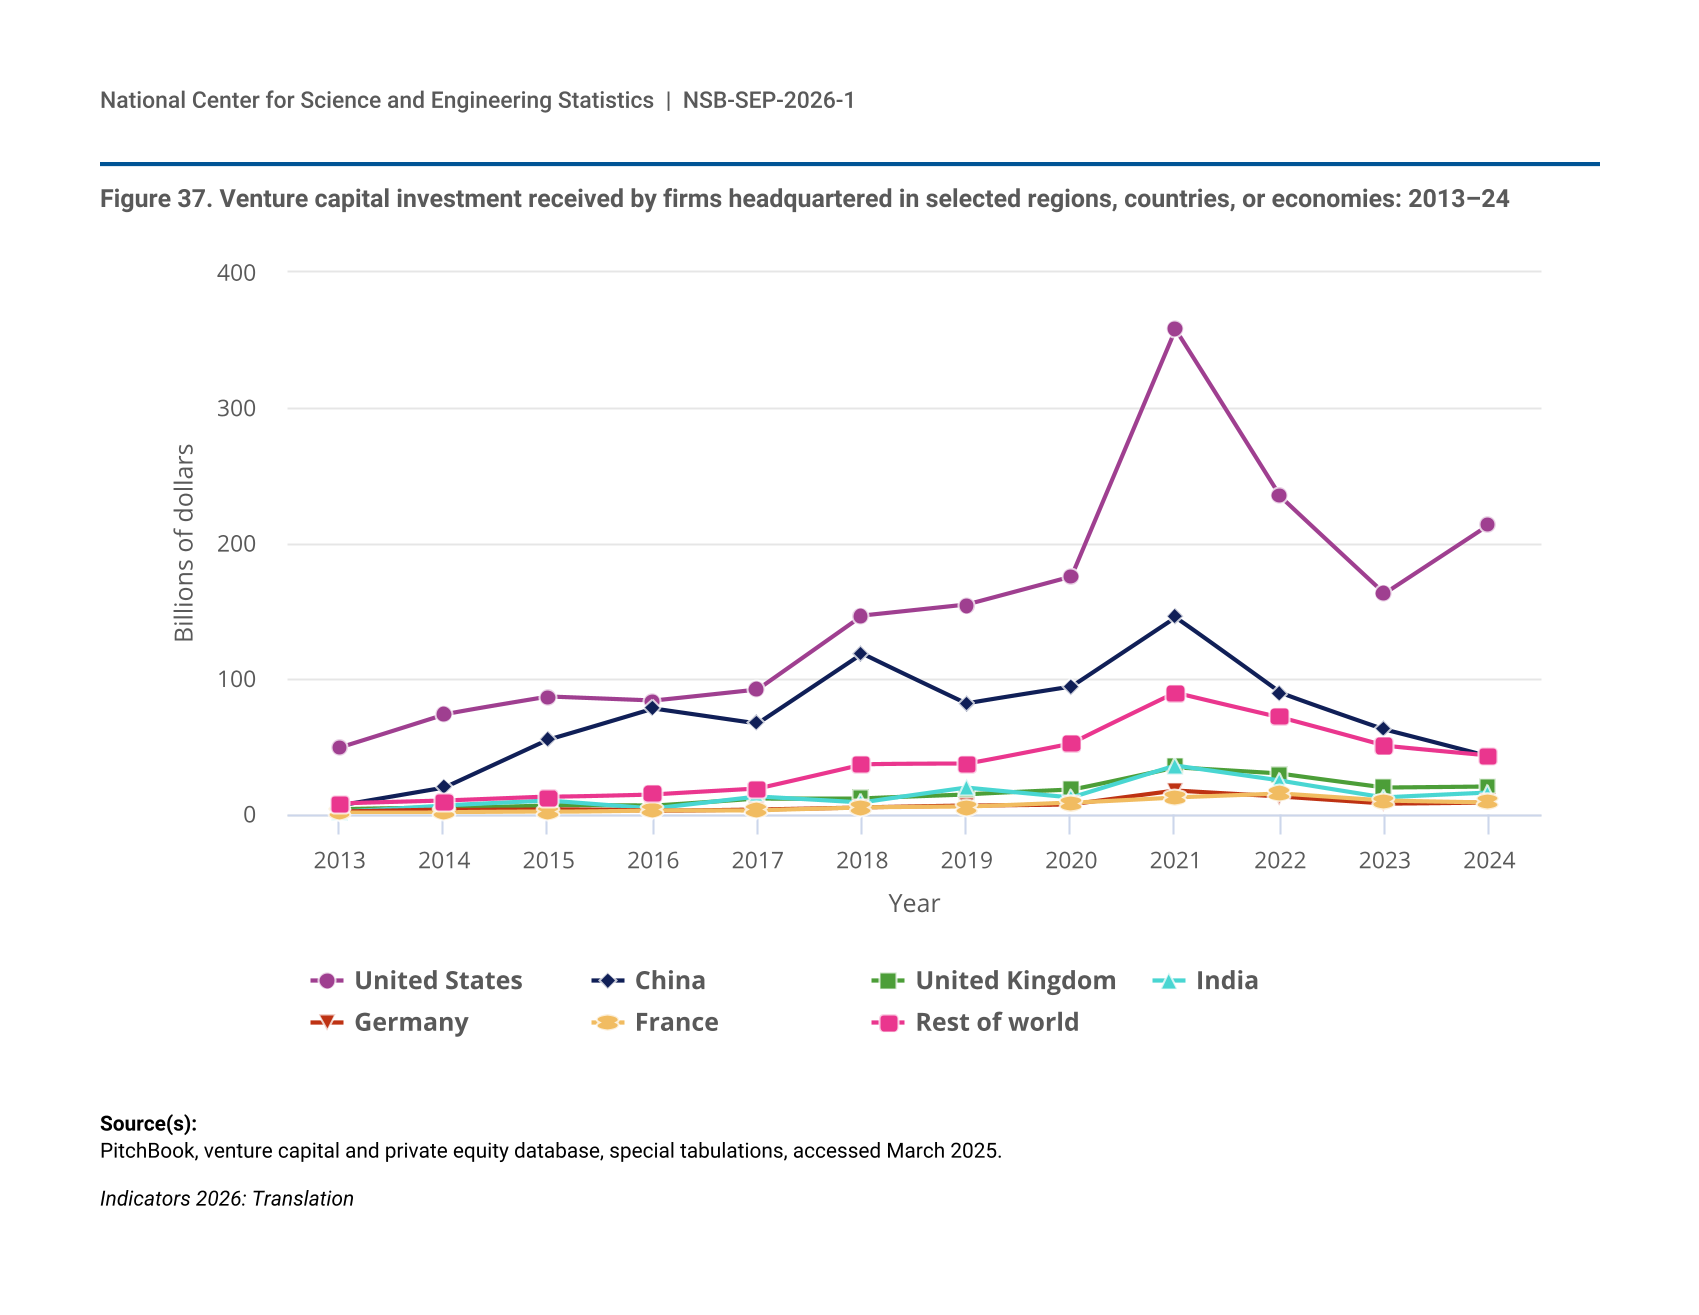
Startups (firms less than 1 year old) are major drivers of job growth and innovation in the United States. Firm creation in the United States peaked in 2006 at 542,000 and declined in subsequent years during the global financial crisis of 2007–09. Since 2010 and through the COVID-19 pandemic, firm creation has continued trending upward, reaching 520,000 in 2022, still short of the 2006 peak. Although venture capital (VC) funds only a small share of new private firms, it plays a substantial role in the innovation process through investment in startups with high growth potential, including those that engage in R&D. Worldwide VC investment was $354 billion in 2024, greater than its level in 2023 ($327 billion) but roughly half of its peak value in 2021 ($694 billion) (Figure 37). U.S. firms consistently received the most VC investment each year between 2013 and 2024. Firms based in the United States accounted for 60% of global VC investment in 2024, followed by firms based in China (12%).
| Year | United States | China | United Kingdom | India | Germany | France | Rest of world |
|---|---|---|---|---|---|---|---|
| 2013 | 49.3 | 6.3 | 3.6 | 1.7 | 1.6 | 1.4 | 7.7 |
| 2014 | 73.8 | 19.5 | 4.5 | 6.6 | 3.1 | 1.5 | 9.7 |
| 2015 | 86.5 | 55.1 | 6.6 | 10.1 | 3.6 | 1.8 | 12.7 |
| 2016 | 83.5 | 78.2 | 6.1 | 4.2 | 2.4 | 3.0 | 14.7 |
| 2017 | 91.8 | 67.0 | 11.6 | 13.1 | 3.6 | 2.9 | 19.0 |
| 2018 | 146.3 | 118.6 | 11.8 | 8.6 | 5.1 | 4.8 | 36.9 |
| 2019 | 154.5 | 82.0 | 14.5 | 19.4 | 6.4 | 5.3 | 37.1 |
| 2020 | 175.2 | 94.1 | 17.8 | 12.2 | 7.3 | 8.4 | 52.4 |
| 2021 | 358.2 | 145.4 | 34.7 | 35.8 | 17.4 | 12.5 | 89.6 |
| 2022 | 234.8 | 89.5 | 30.0 | 24.8 | 13.0 | 15.3 | 71.6 |
| 2023 | 163.2 | 62.8 | 19.9 | 12.5 | 7.8 | 10.0 | 50.4 |
| 2024 | 214.0 | 42.7 | 20.7 | 15.9 | 8.8 | 8.6 | 43.4 |
PitchBook, venture capital and private equity database, special tabulations, accessed March 2025.
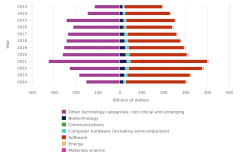
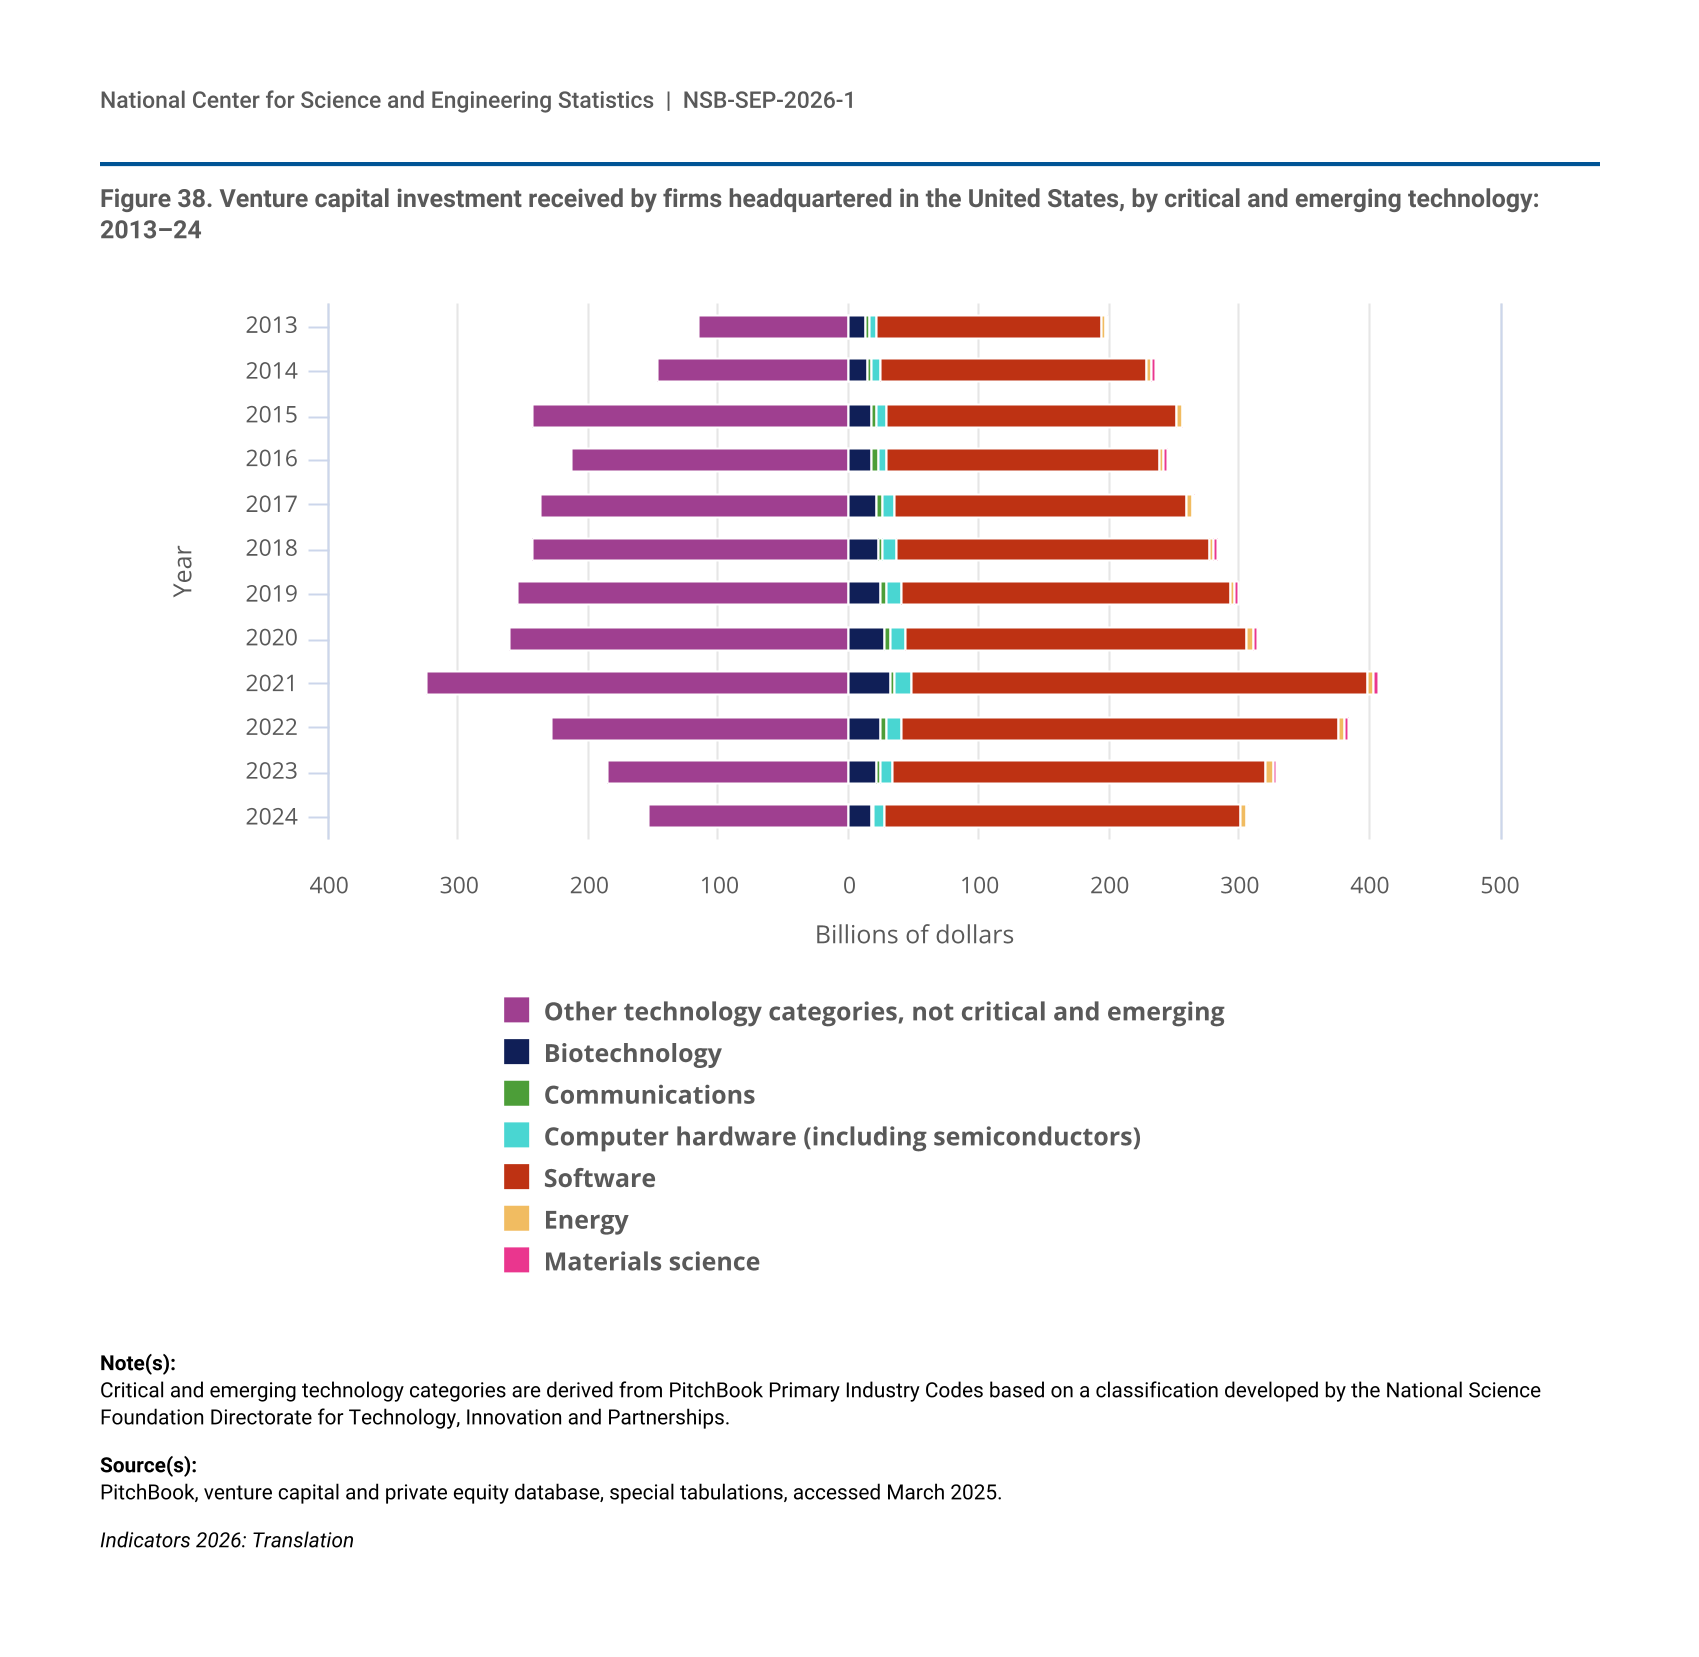
VC investments can support firms developing CETs in the United States. VC investments in firms in CET areas accounted for over half of total U.S. VC investments each year from 2013 to 2024, and two-thirds of total VC investment in 2024 (Figure 38). Software firms received over 80% of VC funding allocated to CETs and between 44% and 59% of total U.S. VC funding, each year during this period. The share of CET VC funding going to software firms was comparatively higher than software publishing’s share of value added by U.S. KTI services (see section “KTI Industries in the United States”). Biotechnology received the next-largest share of VC funding among CET areas, accounting for between 6% and 9% each year from 2013 to 2024. Computer hardware (including semiconductors) was the next-largest CET area in terms of VC funding. Investment in all CET areas was lower in 2024 than in 2021, the peak VC investment year for all CETs aside from energy.
| Year | Other technology categories, not critical and emerging | Biotechnology | Communications | Computer hardware (including semiconductors) | Software | Energy | Materials science |
|---|---|---|---|---|---|---|---|
| 2013 | 114.7 | 12.6 | 3.6 | 5.0 | 173.6 | 2.7 | 1.5 |
| 2014 | 147.0 | 14.1 | 4.1 | 6.6 | 205.2 | 3.3 | 1.9 |
| 2015 | 242.6 | 17.4 | 4.5 | 7.7 | 222.9 | 3.7 | 2.4 |
| 2016 | 213.1 | 18.0 | 4.0 | 7.9 | 209.4 | 3.1 | 2.3 |
| 2017 | 237.0 | 21.8 | 4.1 | 9.1 | 225.5 | 3.4 | 2.6 |
| 2018 | 243.6 | 23.0 | 3.7 | 10.7 | 239.7 | 3.3 | 2.7 |
| 2019 | 254.3 | 25.0 | 4.4 | 10.2 | 254.3 | 3.4 | 2.6 |
| 2020 | 260.5 | 27.4 | 4.5 | 11.1 | 264.0 | 4.0 | 2.6 |
| 2021 | 324.3 | 31.6 | 4.5 | 11.9 | 351.6 | 4.9 | 2.9 |
| 2022 | 228.1 | 24.9 | 4.2 | 10.8 | 336.7 | 4.7 | 2.6 |
| 2023 | 184.8 | 20.9 | 3.6 | 9.3 | 287.4 | 5.1 | 2.3 |
| 2024 | 153.2 | 17.3 | 3.0 | 7.7 | 273.6 | 4.5 | 1.6 |
Critical and emerging technology categories are derived from PitchBook Primary Industry Codes based on a classification developed by the National Science Foundation Directorate for Technology, Innovation and Partnerships.
PitchBook, venture capital and private equity database, special tabulations, accessed March 2025.
Production Patterns of Knowledge- and Technology-Intensive Industries
KTI industries are important funders and performers of R&D, produce high-value products and services and intangible assets, and contribute to national economic competitiveness in global markets. KTI industries are defined as those with high and medium-high R&D intensities based on an internationally comparable taxonomy and include 10 industries in manufacturing and 3 industries in services (see the “Glossary” section for list of KTI industries) (OECD 2016). KTI output is measured as the value of goods and services (gross output) minus the cost of intermediate inputs (energy, materials, and purchased services)—henceforth, value added (see the “Glossary” section for definition of value added).
KTI Industries in the United States
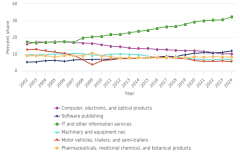
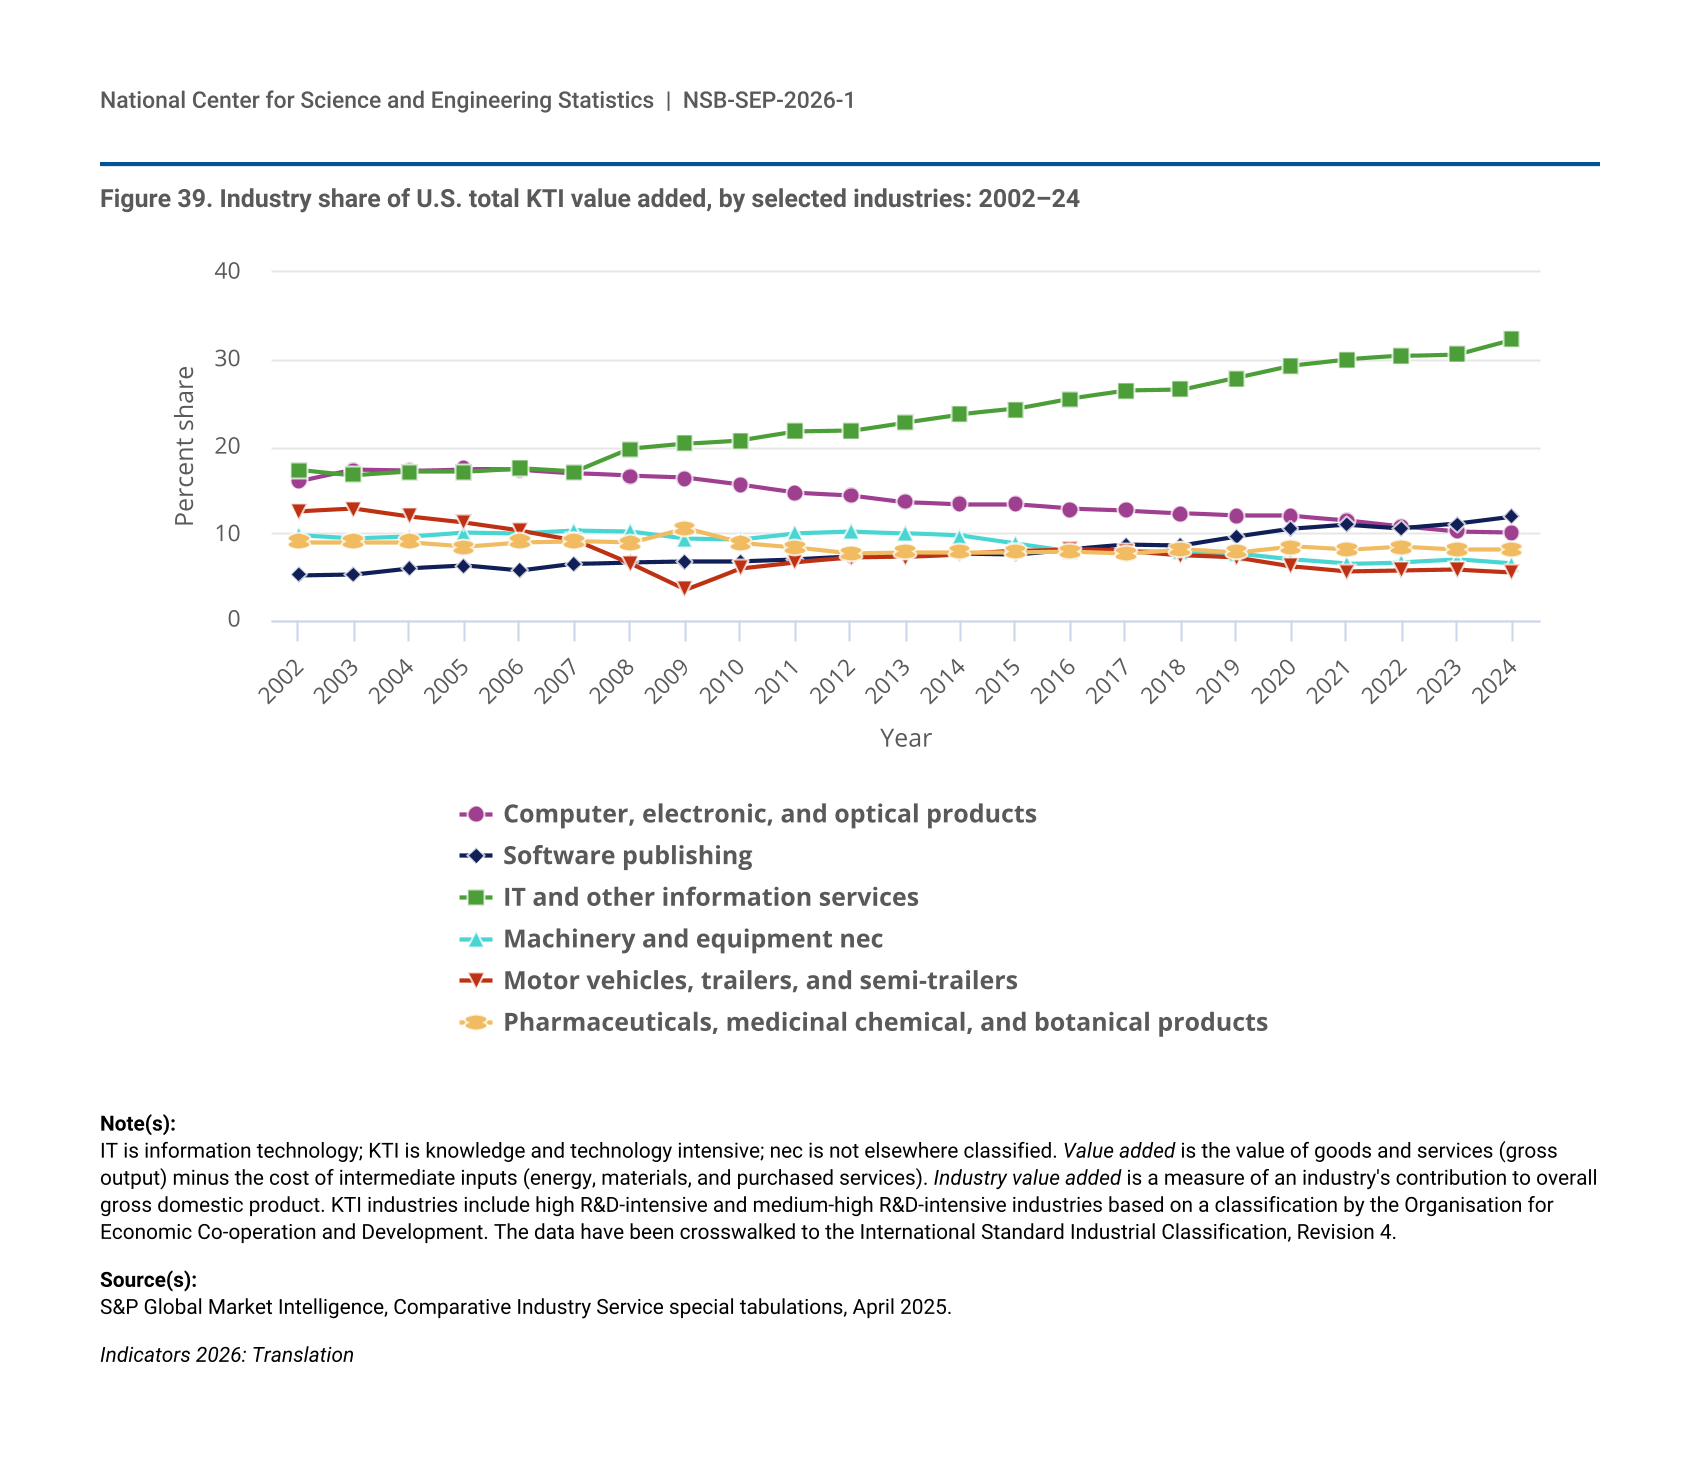
In 2024, value added of U.S. KTI industries totaled $3.3 trillion and accounted for 11% of U.S. GDP, a share little changed since 2002. The share of total U.S. KTI value added contributed by manufacturing has decreased over the last two decades as the share attributable to KTI services has increased, from about a third in 2002 to just over half in 2024. This growth has been led by IT and other information services and by software publishing (Figure 39). The IT and other information services industry has been the largest KTI industry by value added since 2006, growing from 17% of total KTI value added in that year to 32% in 2024. The pharmaceuticals industry has accounted for between 8% and 11% of the KTI industry total during this period, whereas motor vehicles, trailers, and semi-trailers manufacturing has steadily decreased from 13% in 2002 to 5% in 2024.
| Year | Computer, electronic, and optical products | Software publishing | IT and other information services | Machinery and equipment nec | Motor vehicles, trailers, and semi-trailers | Pharmaceuticals, medicinal chemical, and botanical products |
|---|---|---|---|---|---|---|
| 2002 | 16.0 | 5.2 | 17.3 | 9.8 | 12.5 | 9.0 |
| 2003 | 17.3 | 5.3 | 16.7 | 9.4 | 12.8 | 9.0 |
| 2004 | 17.2 | 6.0 | 17.1 | 9.6 | 11.9 | 9.0 |
| 2005 | 17.4 | 6.3 | 17.1 | 10.1 | 11.2 | 8.5 |
| 2006 | 17.3 | 5.7 | 17.5 | 10.0 | 10.3 | 9.0 |
| 2007 | 16.9 | 6.5 | 17.1 | 10.3 | 9.2 | 9.1 |
| 2008 | 16.6 | 6.7 | 19.7 | 10.2 | 6.5 | 8.9 |
| 2009 | 16.4 | 6.8 | 20.3 | 9.4 | 3.5 | 10.6 |
| 2010 | 15.6 | 6.8 | 20.7 | 9.3 | 6.0 | 8.9 |
| 2011 | 14.7 | 7.0 | 21.7 | 10.0 | 6.7 | 8.4 |
| 2012 | 14.4 | 7.3 | 21.8 | 10.2 | 7.2 | 7.7 |
| 2013 | 13.6 | 7.5 | 22.8 | 10.0 | 7.3 | 7.8 |
| 2014 | 13.3 | 7.7 | 23.7 | 9.7 | 7.6 | 7.8 |
| 2015 | 13.3 | 7.6 | 24.3 | 8.8 | 8.0 | 7.8 |
| 2016 | 12.8 | 8.2 | 25.5 | 7.9 | 8.2 | 7.9 |
| 2017 | 12.6 | 8.7 | 26.4 | 8.0 | 8.0 | 7.7 |
| 2018 | 12.3 | 8.6 | 26.5 | 7.8 | 7.5 | 8.2 |
| 2019 | 12.0 | 9.6 | 27.9 | 7.7 | 7.2 | 7.8 |
| 2020 | 12.0 | 10.5 | 29.3 | 7.0 | 6.2 | 8.5 |
| 2021 | 11.5 | 11.0 | 30.0 | 6.5 | 5.6 | 8.1 |
| 2022 | 10.8 | 10.6 | 30.4 | 6.7 | 5.7 | 8.5 |
| 2023 | 10.2 | 11.1 | 30.6 | 7.0 | 5.8 | 8.2 |
| 2024 | 10.1 | 11.9 | 32.3 | 6.5 | 5.5 | 8.2 |
IT is information technology; KTI is knowledge and technology intensive; nec is not elsewhere classified. Value added is the value of goods and services (gross output) minus the cost of intermediate inputs (energy, materials, and purchased services). Industry value added is a measure of an industry's contribution to overall gross domestic product. KTI industries include high R&D-intensive and medium-high R&D-intensive industries based on a classification by the Organisation for Economic Co-operation and Development. The data have been crosswalked to the International Standard Industrial Classification, Revision 4.
S&P Global Market Intelligence, Comparative Industry Service special tabulations, April 2025.
KTI Industries in the Global Economy
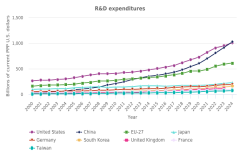
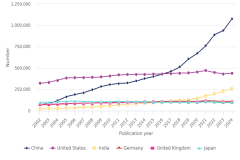
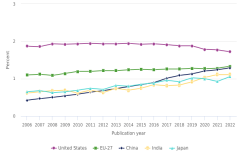
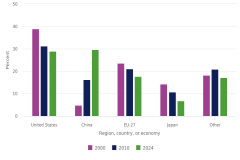
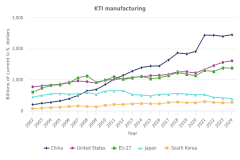
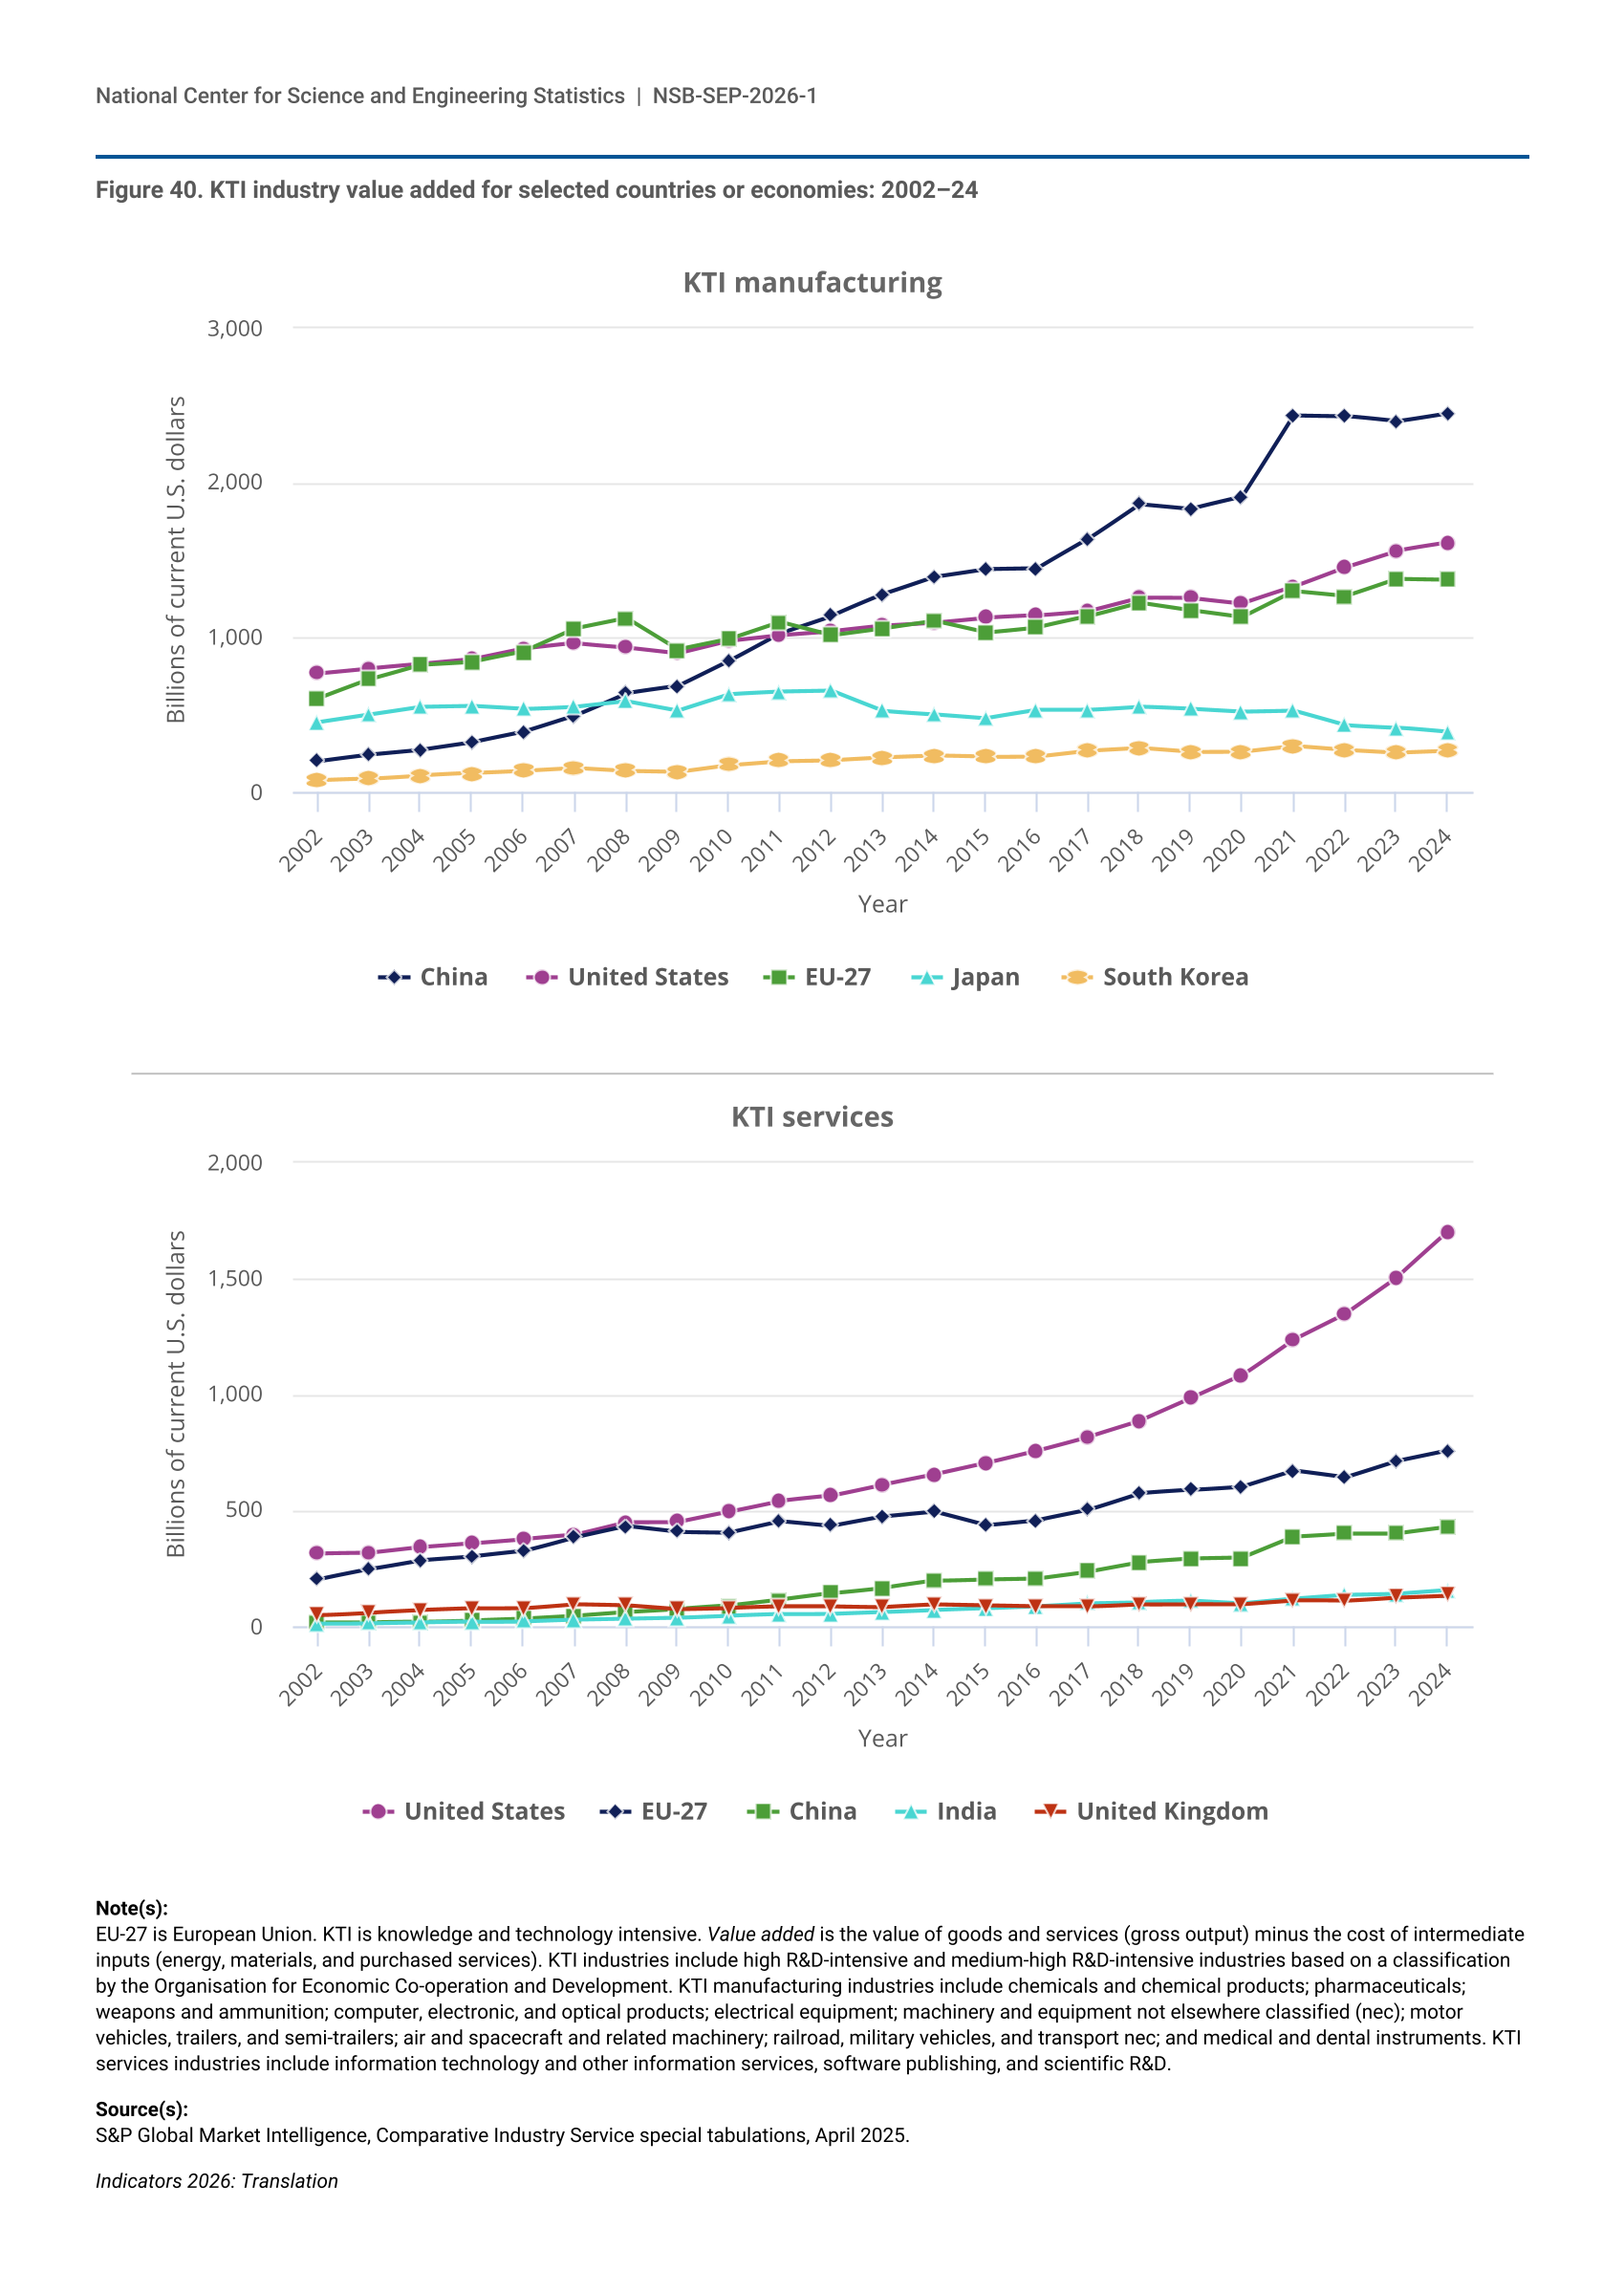
Value added of KTI industries worldwide totaled $11.7 trillion in 2024, a 4.2% increase from 2023. The United States, China, the EU-27, Japan, and South Korea together accounted for about 80% of global KTI value added in 2024. The United States and China were the top two producers of KTI output globally, with $3.3 trillion (28% of the world total) and $2.9 trillion (25%), respectively, followed by the EU-27, with $2.1 trillion (18%).
China is the world leader in KTI manufacturing, with $2.4 trillion in value added in 2024; by 2012, it had surpassed the United States and the EU-27 in KTI manufacturing and has since doubled its output (Figure 40). Even though China had the largest global share of overall KTI manufacturing value added in 2024, the United States had the largest share in four KTI industries: air and spacecraft and related machinery (51%), medical and dental instruments (35%), pharmaceuticals (including pharmaceutical biotechnology) (28%), and weapons and ammunitions (20%). For KTI services, the United States leads with $1.7 trillion in value added in 2024, accounting for a larger share of the global total (43%) than the EU-27 (19%) and China (11%) combined. India and the United Kingdom each had a comparatively larger global presence in KTI services—accounting for 4% and 3% of the world total, respectively—than they did in KTI manufacturing (2% each).
| Year | China | United States | EU-27 | Japan | South Korea |
|---|---|---|---|---|---|
| 2002 | 201 | 767 | 605 | 450 | 77 |
| 2003 | 242 | 799 | 728 | 499 | 86 |
| 2004 | 273 | 827 | 823 | 549 | 108 |
| 2005 | 321 | 857 | 842 | 555 | 122 |
| 2006 | 388 | 926 | 907 | 536 | 137 |
| 2007 | 494 | 962 | 1,056 | 553 | 155 |
| 2008 | 640 | 937 | 1,123 | 589 | 136 |
| 2009 | 684 | 899 | 920 | 528 | 130 |
| 2010 | 848 | 980 | 987 | 633 | 175 |
| 2011 | 1,029 | 1,017 | 1,099 | 648 | 201 |
| 2012 | 1,141 | 1,042 | 1,015 | 654 | 207 |
| 2013 | 1,278 | 1,077 | 1,059 | 525 | 224 |
| 2014 | 1,391 | 1,097 | 1,108 | 504 | 235 |
| 2015 | 1,441 | 1,128 | 1,032 | 478 | 227 |
| 2016 | 1,446 | 1,142 | 1,067 | 531 | 231 |
| 2017 | 1,636 | 1,172 | 1,137 | 532 | 269 |
| 2018 | 1,863 | 1,258 | 1,227 | 554 | 287 |
| 2019 | 1,832 | 1,256 | 1,178 | 538 | 261 |
| 2020 | 1,908 | 1,221 | 1,133 | 520 | 263 |
| 2021 | 2,436 | 1,328 | 1,300 | 527 | 300 |
| 2022 | 2,432 | 1,455 | 1,267 | 433 | 273 |
| 2023 | 2,396 | 1,561 | 1,381 | 418 | 255 |
| 2024 | 2,450 | 1,611 | 1,376 | 388 | 267 |
| Year | United States | EU-27 | China | India | United Kingdom |
|---|---|---|---|---|---|
| 2002 | 315 | 204 | 17 | 11 | 48 |
| 2003 | 317 | 247 | 17 | 13 | 60 |
| 2004 | 342 | 286 | 20 | 16 | 70 |
| 2005 | 359 | 301 | 27 | 19 | 77 |
| 2006 | 377 | 324 | 34 | 22 | 79 |
| 2007 | 395 | 385 | 46 | 29 | 97 |
| 2008 | 450 | 433 | 62 | 33 | 92 |
| 2009 | 451 | 408 | 75 | 37 | 75 |
| 2010 | 495 | 406 | 89 | 46 | 80 |
| 2011 | 542 | 455 | 115 | 53 | 86 |
| 2012 | 563 | 434 | 143 | 55 | 86 |
| 2013 | 611 | 474 | 167 | 63 | 83 |
| 2014 | 654 | 495 | 197 | 72 | 94 |
| 2015 | 703 | 436 | 204 | 79 | 90 |
| 2016 | 758 | 459 | 208 | 88 | 86 |
| 2017 | 818 | 503 | 237 | 101 | 85 |
| 2018 | 886 | 575 | 277 | 105 | 96 |
| 2019 | 983 | 588 | 291 | 110 | 97 |
| 2020 | 1,082 | 603 | 295 | 98 | 96 |
| 2021 | 1,238 | 672 | 386 | 118 | 112 |
| 2022 | 1,349 | 642 | 400 | 135 | 110 |
| 2023 | 1,505 | 713 | 400 | 140 | 125 |
| 2024 | 1,702 | 759 | 427 | 156 | 134 |
EU-27 is European Union. KTI is knowledge and technology intensive. Value added is the value of goods and services (gross output) minus the cost of intermediate inputs (energy, materials, and purchased services). KTI industries include high R&D-intensive and medium-high R&D-intensive industries based on a classification by the Organisation for Economic Co-operation and Development. KTI manufacturing industries include chemicals and chemical products; pharmaceuticals; weapons and ammunition; computer, electronic, and optical products; electrical equipment; machinery and equipment not elsewhere classified (nec); motor vehicles, trailers, and semi-trailers; air and spacecraft and related machinery; railroad, military vehicles, and transport nec; and medical and dental instruments. KTI services industries include information technology and other information services, software publishing, and scientific R&D.
S&P Global Market Intelligence, Comparative Industry Service special tabulations, April 2025.
Global Semiconductor Production
Semiconductors (also called computer chips or microchips) are key enabling components of many CETs. Semiconductor production occurs along global value chains that include R&D, engineering, and design; fabrication; and assembly, testing, and packing stages (CRS 2023). In 2002 and 2003, the United States and Japan together accounted for over half (53%) of value-added semiconductor production, with the EU-27 producing another 11%. Since 2002, China, Taiwan, and South Korea have substantially increased their shares of semiconductor production, while shares for the United States, Japan, and the EU-27 have significantly decreased. In 2024, just over half of global value-added semiconductor production occurred in China (30%) and Taiwan (22%), followed by the United States (19%) and South Korea (11%).
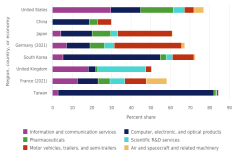
Trade in Knowledge- and Technology-Intensive Industries
KTI Manufacturing Exports
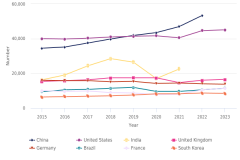
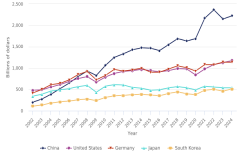
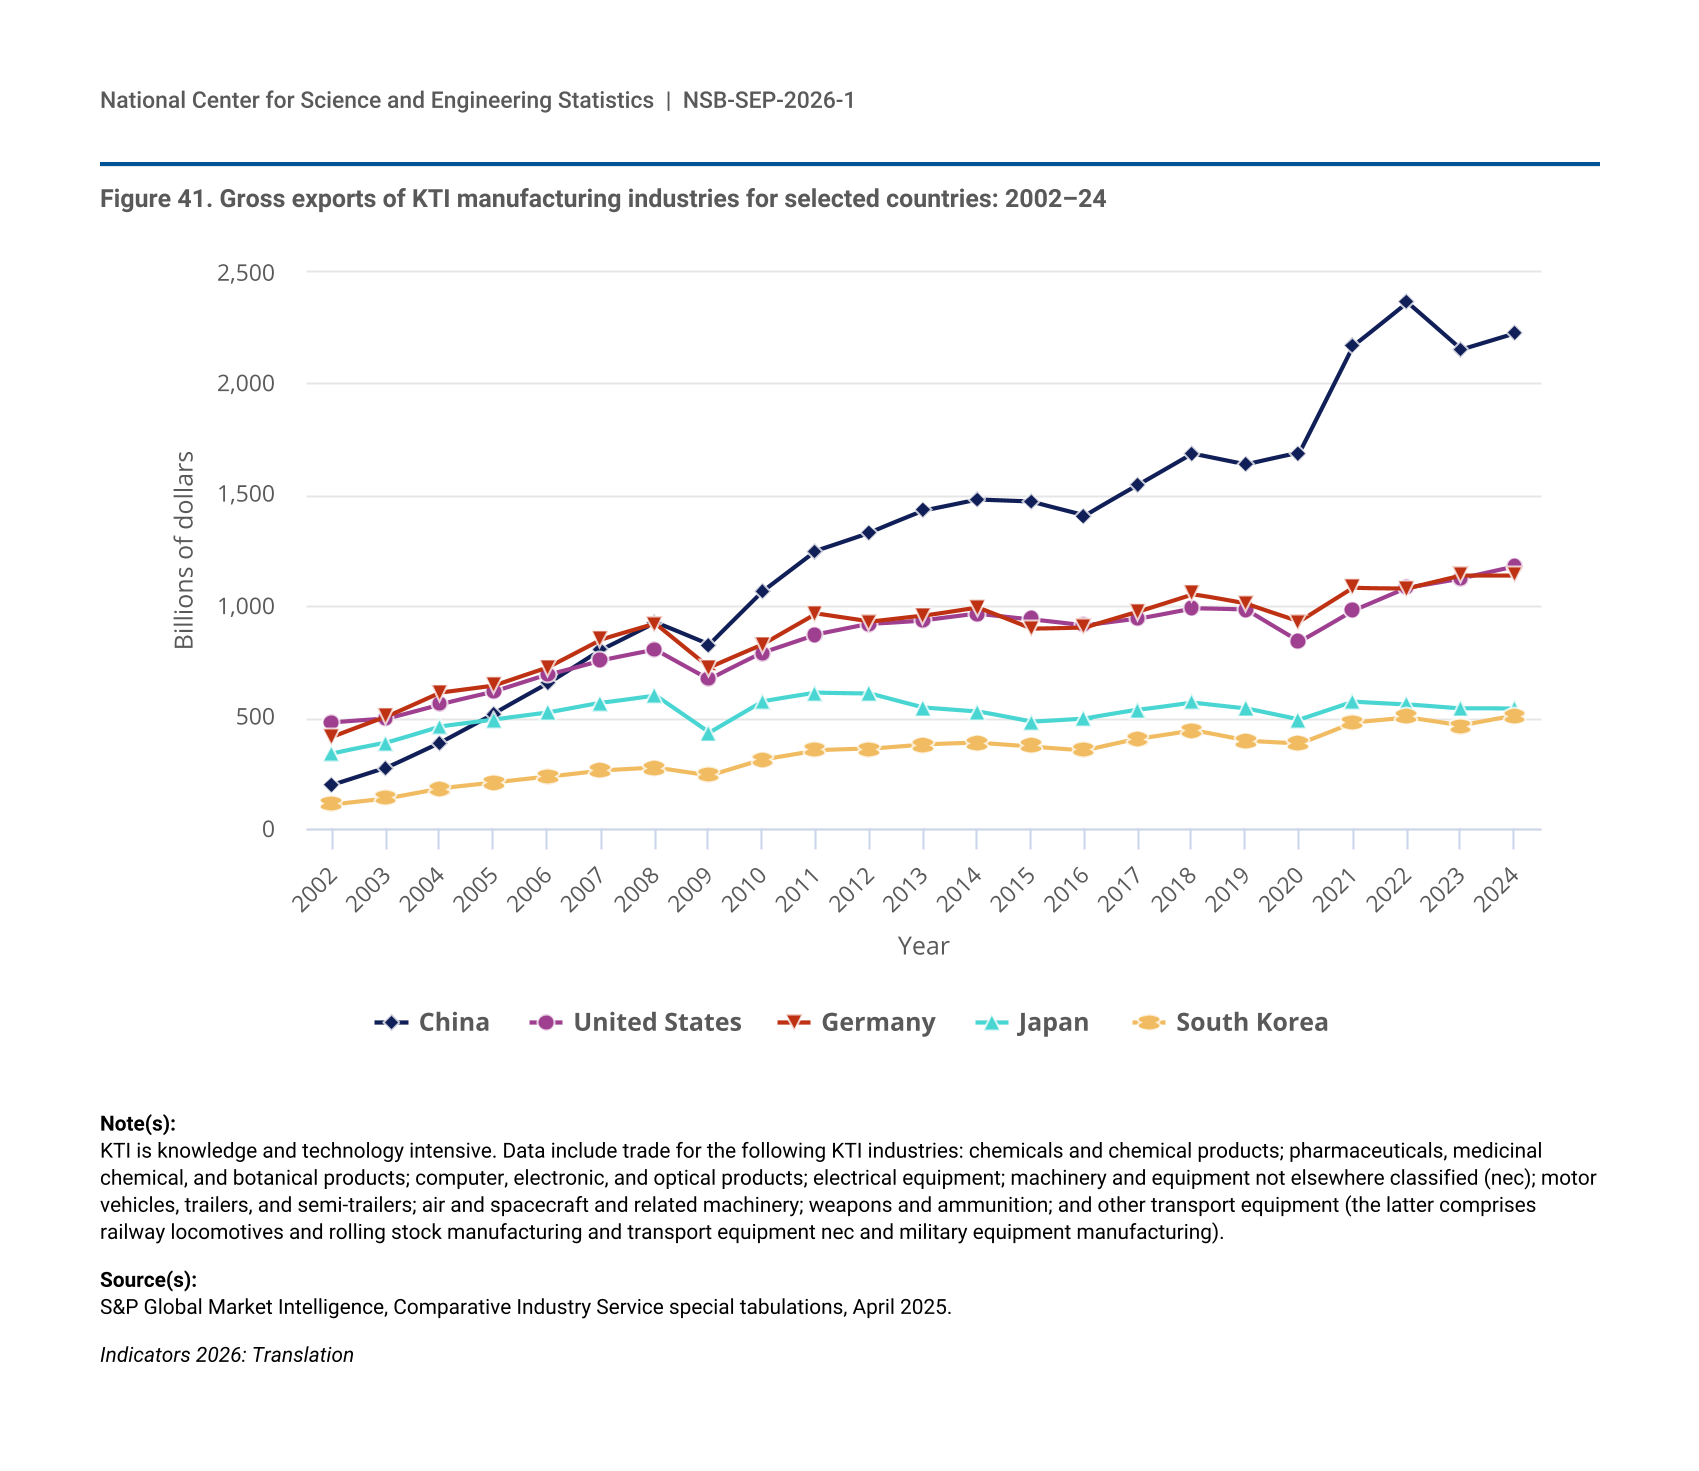
International trade is a key conduit for knowledge and technology spillovers, and exports are an indicator of an economy’s competitiveness in the world market. Global KTI manufacturing goods exports reached $11.7 trillion in 2024, a 3% increase from 2023. China has been the largest exporter globally of KTI manufacturing goods since 2008 (Figure 41), with $2.2 trillion in exports in 2024, accounting for 19% of the world total. The United States and Germany were the next-largest KTI manufacturing exporters in 2024, with $1.2 trillion and $1.1 trillion in exports, respectively. By 2024, all major KTI manufacturing exporters except China and Japan exceeded their 2022 export levels.
| Year | China | United States | Germany | Japan | South Korea |
|---|---|---|---|---|---|
| 2002 | 197 | 479 | 413 | 340 | 110 |
| 2003 | 274 | 495 | 502 | 386 | 136 |
| 2004 | 388 | 560 | 611 | 459 | 181 |
| 2005 | 518 | 615 | 643 | 489 | 206 |
| 2006 | 651 | 691 | 724 | 520 | 233 |
| 2007 | 805 | 757 | 850 | 565 | 262 |
| 2008 | 928 | 804 | 920 | 599 | 275 |
| 2009 | 827 | 672 | 725 | 432 | 239 |
| 2010 | 1,066 | 790 | 828 | 573 | 312 |
| 2011 | 1,249 | 872 | 966 | 611 | 353 |
| 2012 | 1,331 | 920 | 930 | 608 | 359 |
| 2013 | 1,428 | 937 | 958 | 545 | 379 |
| 2014 | 1,478 | 967 | 996 | 527 | 387 |
| 2015 | 1,469 | 942 | 900 | 480 | 370 |
| 2016 | 1,408 | 913 | 906 | 495 | 353 |
| 2017 | 1,546 | 943 | 977 | 534 | 405 |
| 2018 | 1,686 | 990 | 1,054 | 568 | 443 |
| 2019 | 1,637 | 983 | 1,010 | 542 | 394 |
| 2020 | 1,689 | 840 | 931 | 491 | 382 |
| 2021 | 2,170 | 981 | 1,082 | 572 | 479 |
| 2022 | 2,365 | 1,084 | 1,081 | 560 | 501 |
| 2023 | 2,153 | 1,126 | 1,138 | 541 | 463 |
| 2024 | 2,226 | 1,179 | 1,139 | 539 | 507 |
KTI is knowledge and technology intensive. Data include trade for the following KTI industries: chemicals and chemical products; pharmaceuticals, medicinal chemical, and botanical products; computer, electronic, and optical products; electrical equipment; machinery and equipment not elsewhere classified (nec); motor vehicles, trailers, and semi-trailers; air and spacecraft and related machinery; weapons and ammunition; and other transport equipment (the latter comprises railway locomotives and rolling stock manufacturing and transport equipment nec and military equipment manufacturing).
S&P Global Market Intelligence, Comparative Industry Service special tabulations, April 2025.
The distribution of KTI manufacturing exports across industries differs substantially among the top KTI manufacturing exporters. Exporters from the computer, electronic, and optical products industry (which include computer chips or semiconductors) accounted for the largest shares of KTI manufacturing exports from China (47%), South Korea (42%), and the United States (26%) in 2024. Motor vehicles, trailers, and semi-trailers accounted for the largest share of KTI manufacturing exports from Japan (32%) and Germany (28%).
KTI Manufacturing Trade Balances
The U.S. trade deficit in KTI manufacturing goods has grown steadily over the last two decades, increasing from $155 billion in 2002 to $794 billion in 2024. Although the United States was the second-largest KTI manufacturing exporter in 2024, it was by far the largest importer; the difference between exports ($1.2 trillion) and imports ($2.0 trillion) resulted in the United States experiencing the largest trade deficit among the world’s major economies. In contrast, Germany, which had a similar level of KTI manufacturing exports ($1.1 trillion) to the United States, had a trade surplus of $338 billion in 2024 due to its much lower level of imports. China, the world’s largest KTI manufacturing exporter, has had a KTI manufacturing trade surplus above $1 trillion since 2021 and reached a high of $1.4 trillion in 2024.