An official website of the United States government


Featured Survey Analysis
Microbusinesses Performed $5.9 Billion of R&D in the United States in 2023
August 17, 2026
Product ID: NSF 26-324
An official website of the United States government
Official websites use .gov
A .gov website belongs to an official government organization in the United States.
Secure .gov websites use HTTPS
A lock ( ) or https:// means you’ve safely connected to the .gov website. Share sensitive information only on official, secure websites.


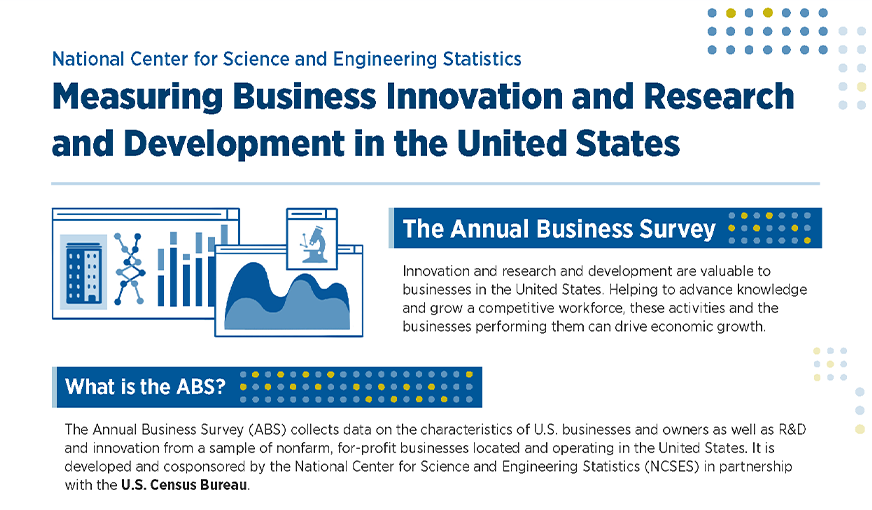
The ABS is the primary source of information on research and development among for-profit businesses operating in the United States with one to nine employees. The ABS also collects data on innovation, technology, intellectual property, and financing from U.S.-based companies of all sizes.
The ABS collects data on research and development (for businesses with one to nine employees), innovation, technology, intellectual property, and business owner characteristics, with additional rotating content that changes from year to year.
The ABS is cosponsored by the National Center for Science and Engineering Statistics within the U.S. National Science Foundation and the Census Bureau.
| Status | Active |
|---|---|
| Frequency | Annual |
| Reference Period | Calendar year 2023 |
|---|---|
| Released | 17 August 2026 |
The Annual Business Survey (ABS) is the primary source of information on research and development (R&D) expenditures for nonfarm, for-profit, businesses operating in the United States with one to nine employees. The ABS also collects data on innovation-related data, globalization, and business owner characteristics from nonfarm, for-profit, businesses operating in the United States with at least one employee.
Modules on Domestic and Foreign Transactions and on Management Practices were added. A module on Financing was removed and modules on Goods, Services, and Business Processes and on Technology and Intellectual Property were reduced. Some of the modules removed or questions from the removed modules may return in future questionnaires.
Annual.
Calendar year 2017; for innovation, the reference period was 2015–17.
Calendar year 2023; for innovation, the reference period was 2021–23.
All nonfarm businesses in the United States.
Sample survey of for-profit companies with a U.S. presence engaged in the mining, utilities, construction, manufacturing, wholesale trade, retail trade, or services industries.
Approximately 5,600,000 employer businesses.
In 2017 and every fifth year thereafter, the ABS sample size is approximately 850,000 employer businesses. In other years, the ABS sample size is about 300,000 employer businesses. For this survey cycle (2024 ABS: data year 2023), the sample size was 330,000.
Key variables of interest are listed below.
The target population consists of all for-profit nonfarm companies that are physically located in the United States, that have at least one establishment classified as being an in-scope sector based on the North American Industry Classification System (NAICS), and that were in business during the survey reference year and data collection period.
The Business Register, maintained by the Census Bureau, is the source used to create the sampling frame for the ABS.
The ABS has a systematic stratified sampling design that uses simple random sampling within strata. Stratification is based on the NAICS industry code. Companies were selected with certainty if they are known R&D performers with one to nine employees, have 500 or more employees, or meet sampling stratum-specific cutoffs for receipts and payroll.
The ABS collects data electronically.
All data submitted by respondent companies are reviewed to ensure that data fields are complete and that data are internally consistent. Survey responses often include errors that require correction or unusual patterns that require validation. Automated edit checks are applied to improve the efficiency of data review and correction. Edit checks are designed to catch arithmetic errors and logically inconsistent responses (balance edits). The remaining automated edit checks are designed to flag outliers for further review (analytical edits). If additional information or data corrections are needed, respondents may be contacted to clarify or correct data. If additional information or corrected data cannot be obtained from respondents, data are imputed.
Estimates are produced from sums of weighted data (reported or imputed). Exceptions are described in detail in the annual reports containing data tables.
Estimates of sampling errors associated with the data tables are available by request.
There can be both undercoverage error, where units are not included in the frame, and overcoverage error, where units included in the frame are out of scope for the population of interest. The ABS uses the 2022 Business Register to construct the frame, so any changes in businesses that would change the inclusion or exclusion of the business to the survey scope could be sources of coverage error. Prior to tabulation, survey units’ information is updated with the most recently available Business Register data to mitigate this source of error.
Unit nonresponse is done by adjusting weighted reported and imputed data by multiplying each company's sampling weight by a nonresponse adjustment factor. Detailed descriptions of the adjustments for nonresponse are available in the ABS Technical Notes.
Expected sources of measurement error include differences in respondent interpretations of the definitions of R&D activities and differences in how companies count and report numbers of employees in various categories, including whether they work on R&D full time or part time. Although quantitative metrics of measurement error are not available, there are ongoing efforts to minimize measurement error, including questionnaire pretesting, improvement of questionnaire wording and format, inclusion of more cues and examples in the questionnaire instructions, in-person and telephone interviews and consultations with respondents, and post-survey evaluations.
Data produced from the ABS are available at the survey page.
The ABS is a cross-sectional survey designed to produce annual estimates of R&D performance and related statistics.
ABS data are published in NCSES InfoBriefs and data table reports and are available at the survey page.
Results from this survey are available at the survey page. The ABS contains confidential data that are protected under Title 13 and Title 26 of the U.S. Code. Restricted microdata will be available at any of the 15 secure Research Data Centers administered by the Census Bureau. Researchers interested in accessing microdata can apply for a restricted-use license by submitting a proposal through the Standard Application Process (SAP). The proposal will be evaluated based on the benefit to the sponsoring agencies, scientific merit, feasibility, and risk of disclosure. To learn more and apply for access, visit the Apply for Access to Restricted-Use Census Bureau Microdata page or the Standard Application Process. For additional information about the application process, including how to initiate a project, please contact the administrator at the primary site where the research will be conducted. Per the Federal Cybersecurity Enhancement Act of 2015, the data are protected from cybersecurity risks through screening of the systems that transmit the data.
Purpose. The Annual Business Survey (ABS) provides information on selected economic and demographic characteristics for businesses and business owners by sex, ethnicity, race, and veteran status. Further, the survey measures research and development (R&D) for microbusinesses; business topics, such as innovation and technology; and other business characteristics. The ABS is cosponsored by the National Center for Science and Engineering Statistics (NCSES) within the U.S. National Science Foundation (NSF) and the Census Bureau. The ABS replaces the quinquennial Survey of Business Owners for employer businesses, the Annual Survey of Entrepreneurs, the Business R&D and Innovation for Microbusinesses Survey, and the Innovation section of the Business R&D and Innovation Survey.
The ABS is designed to incorporate new content each survey year based on topics of relevance. For the 2024 ABS (data year 2023), content includes company information; owner characteristics; goods, services, and business processes; R&D for microbusinesses; research activities at nonprofit organizations; technology transfer and intellectual property; domestic and foreign transactions; and management practices. The ABS also collects various data regarding business owners, such as sex, ethnicity, race, veteran status, and other business characteristics. R&D data are collected on the ABS for businesses with a W-2 employment range between one and nine employees.
Data collection authority. Title 13, U.S. Code, Sections 8(b), 131, and 182; Title 42, U.S. Code, Sections 1861–76 (National Science Foundation Act of 1950, as amended); and Section 505 within the America COMPETES Reauthorization Act of 2010, authorize this collection. Sections 224 and 225 of Title 13 require mandatory response. Collected under Office of Management and Budget (OMB) control number 0607-1004, expiring 31 May 2027. NCSES has reviewed this product for unauthorized disclosure of confidential information and approved its release (NCSES-DRN26-022).
Survey sponsor. NCSES and the Census Bureau.
Survey collection and tabulation agent. The survey is conducted annually by the Census Bureau in accordance with an interagency agreement with NCSES.
Frequency. Annual.
Initial survey year. Calendar year 2017; for innovation, the reference period was 2015–17.
Reference period. Calendar year 2023; for innovation, the reference period is 2021–23.
Response unit. All nonfarm businesses in the United States.
Sample or census. Sample.
Population size. A total of 5.6 million employer firms; approximately 506,000 firms with one to nine employees and in North American Industry Classification System (NAICS) industries 31–33 (manufacturing), 42 (wholesale trade), 51 (information), 5413 (architectural, engineering, and related services), 5415 (computer systems design and related services), or 5417 (scientific research and development services) were in scope for the R&D module.
Sample size. A total of 330,000 employer businesses.
Target population. Included are all nonfarm businesses filing Internal Revenue Service (IRS) tax forms as individual proprietorships, partnerships, or any type of corporation and with receipts of $1,000 or more. The ABS covers firms with paid employees only. The ABS is conducted on a company or firm basis rather than an establishment basis.
Sampling frame. The sampling universe was constructed from the final 2022 Business Register. The Business Register is the Census Bureau’s comprehensive database of U.S. businesses. Business Register data are compiled from a combination of business tax returns, data collected from the economic census, and data from other Census Bureau surveys. The Business Register includes sole proprietorships, partnerships, and corporations reporting business activity to the IRS on any one of the following IRS tax forms: 1040 (Schedule C), “Profit or Loss from Business” (Sole Proprietorship); 1065, “U.S. Return of Partnership Income”; 941, “Employer’s Quarterly Federal Tax Return”; 944, “Employer’s Annual Federal Tax Return”; or any one of the 1120 corporate tax forms.
The Business Register contains establishments that are out of scope for the ABS sample. These establishments are removed from the sampling universe. They include the following:
Information on industry classification, receipts, payroll, and employment was extracted from the Business Register during the frame construction.
The sample is also designed to estimate demographic characteristics of the business owners. To efficiently sample for demographic characteristics, a variety of sources of information is used to estimate the likelihood that a business is a woman- or minority-owned business. Administrative sources include the Decennial Census, the American Community Survey (ACS), and the Numident file, which is the Social Security Administration’s (SSA) comprehensive database of information from Social Security applications. Individual business owners are identified through IRS K-1 filings for partnerships and corporations and from the Business Register for sole proprietorships. The owners are matched to the 2000 and 2010 Decennial Censuses to get race, sex, and ethnicity data; to the 2005–22 ACS; and to the Numident file (in that order) through a Protected Identification Key. Country of birth is also identified through the linkages to the ACS or Numident data. Each firm is then placed in one of the following seven strata for sampling: American Indian or Alaska Native, Asian, Black or African American, Hispanic, non-Hispanic White men or publicly owned firm, Native Hawaiian and Other Pacific Islander, and women owned. Businesses are assigned to one and only one stratum, with priority given to the less common race and ethnicity groups.
Sample design. The ABS frame is stratified by state, expected owner race or ethnicity, and industry and is systematically sampled within each stratum. A standard type of estimation for stratified systematic sampling is used. Large companies were selected with certainty based on volume of sales, payroll, or number of paid employees. Certainty cases have a selection probability of 1, a sampling weight of 1, and represent only themselves. Specifically for the 2024 ABS (data year 2023), firms were selected with certainty if they met any of the following criteria:
The certainty cutoffs vary by sampling stratum, and each stratum is sampled at varying rates, depending on the number and size of firms in a particular stratum.
The remaining frame is subjected to stratified systematic random sampling. Sampling rates vary by strata and are determined by the following calculations. Note that a systematic sample uses take rate to sample, and the sampling rate is 1/take rate.
The ABS sample consisted of 330,000 employer businesses. There were 74,000 selected with certainty. The certainty portion of the sample consisted of
The remaining 256,000 noncertainty cases were selected using the systematic stratified random sample selection. The maximum sample weight was 40.
Data collection. Prior to mailing the survey, certain businesses selected were determined to be out of scope and were not contacted. The survey was mailed to 330,000 employer businesses in July 2024. Businesses were sent a letter informing them of their requirement to report. The letter also provided instructions on how to access the survey and submit online. There were three mail follow-ups conducted to increase response. Additionally, the Census Bureau conducted e-mail follow-ups to respondents who entered the electronic system but did not submit the questionnaire. The collection period closed in December 2024.
Mode. The 2024 ABS (data year 2023) was collected using the electronic instrument.
Check-in rate. The check-in rate is defined as the unweighted number of surveys that were submitted online by in-scope companies, divided by the unweighted total number of all in-scope companies in the sample. Response to individual questions did not factor into this metric. At the close of the collection period in December 2024, 195,000 responses were submitted (59% of the sample).
An additional 704 businesses contacted the Census Bureau to indicate that the business was no longer in operation or had been sold for the reference year via the call center. In addition, 605 businesses contacted the Census Bureau to indicate that the business was no longer in operation or had been sold for the reference year via the online portal.
Businesses selected to report R&D represented 34% of those mailed. Of the businesses mailed and selected to report R&D, 71,000 businesses (63%) submitted responses.
Unit response rate (URR). The URR is the unweighted number of responding companies for the survey. For the ABS, response is defined as a company providing the number of owners, number of paid owners, and number of employees or a company responding that it ceased operations prior to 2023.
For the ABS, the URR was 64%. The URR for businesses eligible to report the R&D module was 63%.
Item response rates (IRR). The 2024 ABS (data year 2023) collected data on approximately 650 variables, and the distribution of values reported by sample companies is highly skewed. Thus, rather than report unweighted item response rates, total quantity response rates are calculated, which are based on weighted data. The survey skip patterns vary for respondents; therefore, it can be impossible to know an exact denominator for item response calculations.
Total quantity response rate (TQRR). For a given published estimate other than count or ratio estimates, TQRR is the percentage of the weighted estimate based on data that were reported by units in the sample or on data that were obtained from other sources and were determined to be equivalent in quality to reported data and weighted only by sampling but not nonresponse weights. The TQRR for total sales in the United States in 2023 was 69.3%.
Total quantity nonresponse rate (TQNR). For a given published estimate, TQNR, defined as 100% minus TQRR, is calculated for each tabulation cell from the ABS, except for cells that contain count or ratio estimates. TQNR measures the combined effect of the procedures used to handle unit and item nonresponse on the weighted ABS estimate. Detailed imputation rates are available on request.
Data editing. Prior to tabulating the data, response data were reviewed and edited to correct reporting errors. R&D data were tabulated for records reporting $50,000 or more in R&D expenditures.
Additionally, R&D data were only tabbed for records classified in the following NAICS industries:
Survey analysts reviewed the R&D reported by the survey respondents. Research was done by evaluating the reported business descriptions, reported R&D-to-sales ratio, and company website information. The majority of corrections involved false-positive reports or data reported using incorrect units (such as whole dollars instead of thousands of dollars). For NAICS industries 5415 and 5417, it is difficult to differentiate R&D from other technical work based solely on company website information.
Additional data errors were detected and corrected through mass corrections and an automated data edit system designed to review the data for reasonableness and consistency. The editing process interactively performed corrections by using standard procedures to fix detectable errors. Quality control techniques were used to verify that operating procedures were carried out as specified.
Unit nonresponse. Unit nonresponse is handled by adjusting weighted reported data as follows. Each company’s sampling weight is multiplied by a nonresponse adjustment factor. To calculate the adjustment factors, each company in the sample that is eligible for tabulation is assigned to one (and only one) adjustment cell. The adjustment cells are based on employment size and NAICS sector. For employment size, there are five categories: 1–4 employees, 5–9 employees, 10–49 employees, 50–249 employees, and 250 or more employees. For a given adjustment cell, the nonresponse adjustment factor is the ratio of the sum of the sampling weights for all companies in the cell to the sum of the sampling weights for all companies in the cell with reported data.
The nonresponse adjustment factor for adjustment cell h was calculated as follows:
where
|
r |
is the respondents, |
|
nr |
is the nonrespondents, |
|
wgt |
is the original sampling weight value, |
|
h |
is the nonresponse adjustment cell, and |
|
NAFh |
is the nonresponse adjustment factor for cell h. |
For the nonresponse adjustment, a business is considered a respondent if it provided the number of owners, number of paid owners, and number of employees. Businesses that responded they ceased operations prior to 2023 are excluded from nonresponse adjustments as out-of-scope.
Tabulation. Although as many firms as possible were identified as out of scope during sampling, additional out-of-scope firms were identified with either response or updated administrative data not available at the time of sampling. These 40,500 firms were removed for tabulations and include the following:
Industry classification. The industry classifications of firms are based on the 2022 NAICS (https://www.census.gov/naics/). Firms with more than one domestic establishment are assigned a single-industry classification using a hierarchal system based on the largest payroll sector, largest payroll 3-digit NAICS (within the largest sector), largest payroll 4-digit NAICS (within the largest 3-digit), and largest payroll 6-digit NAICS (within the largest 4-digit). For tabulation, industry classification was based on administrative data for 2023
Geography. Firms with establishments operating in more than one state are tabulated as unclassified geography and counted only once in state and national totals.
Variance estimation. The particular sample used for this survey is one of a large number of all possible samples of the same size that could have been selected using the same sample design. Estimates derived from the different samples would differ from each other. The relative standard error and standard error are measures of the variability among the estimates from all possible samples. The estimated relative standard errors and estimated standard errors presented in the tables estimate the sampling variability and thus measure the precision with which an estimate from the particular sample selected for this survey approximates the average result of all possible samples. Relative standard errors and standard errors are applicable only to those published cells in which sample cases are tabulated. A relative standard error is an expression of the standard error as a percentage of the quantity being estimated.
The ABS uses the delete-a-group jackknife variance estimator. Note that certainty cases do not contribute to the sampling variance. The delete-a-group jackknife variance estimator requires that every sampling stratum contains at least two sampled firms. Sampling strata that do not meet this requirement are collapsed as needed to create a new set of variance estimation strata that satisfies this requirement.
The sample estimate and an estimate of its relative standard error can be used to estimate the standard error and then construct interval estimates with a prescribed level of confidence that the interval includes the average results of all samples. To illustrate, if all possible samples were surveyed under essentially the same condition, and estimates were calculated from each sample, then
Thus, for a particular sample, one can say with specified confidence that the average of all possible samples is included in the constructed interval.
Example of a confidence interval. Suppose that the estimate is 51,707 and that the estimated relative standard error is 2%. The standard error is then 2% of 51,707 ± 1,034. An approximate 90% confidence interval is found by first multiplying the standard error by 1.6 and then adding and subtracting that result from the estimate to obtain the upper and lower bounds. Since 1.6 × 1,034 = 1,654, the confidence interval in this example is 51,707 ± 1,654 (or the range 50,053–53,361).
Example of a confidence interval for percentage data. Suppose that the estimate is 76.9 and that the estimated standard error is 0.4%. An approximate 90% confidence interval is found by first multiplying the standard error by 1.6 and then adding and subtracting that result from the estimate to obtain the upper and lower bounds. Since 1.6 × 0.4 = 0.64, the confidence interval in this example is 76.9 ± 0.64 (or the range 76.26–77.54).
Detailed relative standard errors are available upon request.
Confidentiality. In accordance with Title 13, United States Code, Section 9, no data are published that would disclose the operations of an individual establishment or business. Data obtained from the IRS, SSA, and other sources are also treated as confidential and can be seen only by those sworn to protect the data from disclosure.
Disclosure avoidance. Disclosure avoidance is the process used to protect the confidentiality of the survey data provided by an individual or firm. Using disclosure avoidance procedures, the Census Bureau modifies or removes the characteristics that may disclose confidential information. Although it may appear that a table shows information about a specific individual or business, the Census Bureau has taken steps to mask or suppress the original data while making sure the results are still useful.
Noise infusion. The ABS uses noise infusion as the primary method of disclosure avoidance. Noise infusion perturbs data values prior to tabulation by applying a random noise multiplier to the data. Disclosure protection is accomplished in a manner that causes the vast majority of cell values to be perturbed by, at most, a few percentage points. For the ABS, the estimated relative standard error for a published cell includes both the estimated sampling error and the amount of perturbation in the estimated cell value due to noise.
The estimates produced from the ABS are subject to both sampling and nonsampling errors.
Sampling error. The sampling error is described above in the “Variance estimation” section.
Coverage error. Coverage error occurs when the frame fails to completely enumerate the population of interest. There can be both undercoverage error, where units are not included in the frame, and overcoverage error, where units included in the frame are actually out of scope for the population of interest. The ABS uses the 2022 Business Register to construct the frame, so any changes in businesses that would change the inclusion or exclusion of the business to the survey scope could be sources of coverage error. Prior to tabulation, survey units’ information is updated with the most recent available Business Register data to mitigate this source of error.
Nonsampling error. All surveys and censuses have nonsampling errors. Nonsampling errors are attributable to various sources, such as the inability to obtain information for all cases in the universe, imputation for missing data, data errors and biases, mistakes in recording or keying data, errors in collection or processing, and coverage problems.
Although explicit measures of the effects of these nonsampling errors are not available, adjustments are made to the published relative standard errors to account for errors associated with imputation of missing data. It is believed that most of the important operational and data errors were detected and corrected through an automated data edit designed to review the data for reasonableness and consistency. Quality control techniques were used to verify that operating procedures were carried out as specified.
Measurement error. The most common source of measurement error was reporting in different units (e.g., reporting whole dollars rather than thousands of dollars).
Some estimates from the 2024 ABS (data year 2023) may not be directly comparable to prior ABS results due to changes in survey methodology. Sources of possible incomparability include changes to questionnaire wording and instructions, changes in reporting procedures or classification, changes to data editing and tabulation, and changes in collection methods.
Changes to questionnaire wording and instructions. The survey section that collected information on R&D from businesses (Section D) had nearly identical question wording and instructions on the questionnaires for both the 2023 ABS (data year 2022) and the 2022 ABS (data year 2021). The 2024 ABS (data year 2023) collected additional detail from businesses on the location of R&D performance and explicitly highlighted the concept of “domestic R&D performance.” For the 2024 ABS, detailed questions about R&D expenditures (types of costs, funding sources, and R&D categories) were tied to domestic R&D performance (a subset of total R&D costs), whereas previous ABS questionnaires asked similar questions tied to total R&D costs.
The following are survey changes in the questionnaire from the 2023 ABS to 2024 ABS; unless otherwise noted, question number references are in reference to the 2024 ABS:
A.13 Moving Production to U.S. in 2022
A.14 Reasons for Moving Production to the U.S. in 2022
A.16 New Credit Applications
A.17 New Credit Sources
A.18 New Credit Received
C.5 Sources of New or Improved Business Processes
C.11 New or Customized Product or Service at the Start of the Business
C.12 Reason New or Customized Product or Service Was Developed
E.3 Innovation and Environmental Benefits During Use of Goods or Services
E.4 New or Improved Goods or Services as a Percent of Total Sales
E.5 Expectations
E.7 Most Important Innovation
E.8 Most Important Innovations and Sales
E.10 Innovation and Environmental Benefits Within This Business
E.17 Activity Costs
E.18 R&D for Activity Costs
E.19 Government Support
E.20 Barriers of Innovation
E.21 Business Strategies
Changes in reporting procedures or classification. There were no changes to reporting procedures or classification for the 2024 ABS (data year 2023).
Changes to data editing and tabulation. For data collected in the R&D section of the ABS, every response with $50,000 or more in R&D costs was reviewed for reasonableness in the 2024 ABS (data year 2023). For the 2024 ABS, all positive R&D cases were reviewed in industries with high rates of false-positive reports. Outside of the review for potential false-positive R&D cases, the editing of R&D data was performed similarly in the 2022 ABS (data year 2021) and 2023 ABS (data year 2022). There have been no major changes to the edits from year to year.
Data collected in the innovation section were edited similarly in the 2022 and 2023 ABS. For the 2017 ABS (data year 2017), a business must have responded positively to both the product innovation question and the subsequent business product innovation question (new to market or new to business) to be considered a product innovator. For the 2023 and 2024 ABS, only a positive response to the question regarding new or improved goods or services was required to be tabulated as a product innovator.
Changes in collection methods. During the 2024 ABS (data year 2023) collection period, a single letter was mailed to respondents using Postal Service Priority Mail. For the 2024 ABS, the third follow-up used First Class Mail.
Affiliated (company or business). An entity that is owned 10% or more (based on voting interest or an equivalent interest) directly or indirectly by your company.
Business processes. Business process includes the following: (1) methods for producing goods or providing services, (2) distribution and logistics, (3) marketing and sales, (4) information and communication systems, (5) administration and management activities, and (6) product and business process development (including activities to identify, develop, or adapt products or a firm’s processes).
Core production activity. This term refers to your primary business activities. For manufacturing companies, core production typically involves production of physical goods. For service companies and other companies, core production refers to the main services or activities provided by your business, such as information and communications technology services and marketing services.
Domestic or U.S. located. Refers to a location in any of the U.S. 50 states and the District of Columbia.
Employment. Paid employment consists of full- and part-time employees, including salaried officers and executives of corporations who were on the payroll during the pay period including March 12. Included are employees on sick leave, holidays, and vacations; not included are proprietors and partners of unincorporated businesses.
Ethnicity. Based on OMB’s guidance, there are two minimum categories for ethnicity: Hispanic or Latino and not Hispanic or Latino. OMB considers race and Hispanic origin to be two separate and distinct concepts. Hispanics and Latinos may be of any race.
Exported goods. Value of goods, including the value of equipment, supplies, and materials. This should equal the amounts reported in the Automated Export System’s Electronic Export Information filed with Customs and Border Protection plus the cost of transporting the goods to customers located in foreign destinations (i.e., outside the United States).
Exported services. An exported service is a service-related product (i.e., services performed, including digital service license agreement) that is sold or transferred to, or performed for, customers (e.g., individual, government, and business establishment) located in foreign destinations (i.e., outside the United States).
Firm. A business organization or entity consisting of one or more domestic establishment locations under common ownership or control.
Foreign affiliate. A foreign affiliate is an entity located outside the United States that is owned at least 10% (based on voting interest or an equivalent interest) directly or indirectly by the U.S. reporter.
Foreign parent (of a U.S.-located business). The first entity outside the United States in an affiliate’s ownership chain that has a direct or indirect investment interest of more than 50% of the affiliate’s voting securities.
Goods. Usually a tangible object (e.g., a smartphone, furniture, or packaged software) but also includes digital goods (e.g., downloadable software, music, and film). Exclude the simple resale of new goods and changes of a solely aesthetic nature.
Imported goods. The value of goods purchased from customers located in foreign destinations (i.e., outside the United States) as indicated in import declarations filed with the Customs and Border Protection.
Imported services. An imported service is a service-related product (i.e., service performed, including digital service license agreement) that is purchased from customers located in foreign destinations (i.e., outside the United States).
Innovation. A business innovation is a new or improved product or business process (or combination thereof) that differs significantly from the firm’s previous products or business processes and that has been introduced on the market or brought into use by the firm.
Intellectual property. Includes patents, processes, and trade secrets; books and music; trademarks; recorded performances and events, such as radio and television programs and motion pictures; broadcast and recorded live performances and events and their content; general use computer software; franchise fees; and other (e.g., digital media).
Noise infusion. A method of disclosure avoidance in which values are perturbed prior to tabulation by applying a random noise multiplier to the magnitude data, such as the sales and receipts for all firms. Disclosure protection is accomplished in a manner that causes the vast majority of cell values to be perturbed by, at most, a few percentage points.
North American Industry Classification System (NAICS). NAICS is the standard used by federal statistical agencies in classifying business establishments for the purpose of collecting, analyzing, and publishing statistical data related to the U.S. business economy. This system is used by the United States, Canada, and Mexico.
Race. The data on race were derived from answers to the race question. Race data are collected in accordance with the guidelines provided by OMB, and these data are based on self-identification. The racial categories included in the questionnaire generally reflect a social definition of race recognized in this country and are not an attempt to define race biologically, anthropologically, or genetically. In addition, it is recognized that the categories of the race question include race and national origin or sociocultural groups. OMB requires that race data be collected for a minimum of five groups: White, Black or African American, American Indian or Alaska Native, Asian, and Native Hawaiian or Other Pacific Islander. Respondents may report more than one race.
Receipts. Includes the total sales, shipments, receipts, revenue, or grants for domestic operations, excluding foreign subsidiaries.
Research and development (R&D). R&D is planned, creative work aimed at discovering new knowledge or devising new applications of available knowledge. This includes (1) activities aimed at acquiring new knowledge or understanding without specific immediate commercial applications or uses (basic research); (2) activities aimed at solving a specific problem or meeting a specific commercial objective (applied research); and (3) systematic use of research and practical experience and resulting in additional knowledge, which is directed to producing new or improved goods, services, or processes (development). R&D includes both direct costs, such as salaries of researchers, and administrative and overhead costs clearly associated with the company’s R&D. However, R&D does not include expenditures for routine product testing, quality control, and technical services unless they are an integral part of an R&D project. R&D also does not include market research; efficiency surveys or management studies; literary, artistic, or historical projects, such as films, music, or books and other publications; and prospecting or exploration for natural resources.
R&D activity in software includes the following:
R&D activity in software excludes the following:
Services. Intangible activities–such as retailing, insurance, educational courses, air travel, consulting—and also includes digital services. (Exclude the simple resale of new services.)
Sex. For the purposes of the ABS, sex refers to a person’s biological sex. The sex question wording very specifically intends to capture a person’s biological sex and not gender.
Unaffiliated (company or business). Entity that is owned less than 10%, directly or indirectly, by your company (i.e., independent contractors and suppliers).
Worldwide sales. Worldwide and domestic sales and operating revenues, including grants.
Recommended data tables
This report provides data from the 2024 Annual Business Survey (ABS) (data year 2023). The ABS is the primary source of data on research and development of for-profit, nonfarm businesses with one to nine employees operating in the 50 U.S. states and the District of Columbia. The ABS also collects data on innovation, technology, intellectual property, and business owner characteristics of businesses of all sizes. The ABS is designed to incorporate new content each survey year based on topics of relevance. The 2024 ABS is the seventh year of the ABS. The ABS is cosponsored by the National Center for Science and Engineering Statistics within the U.S. National Science Foundation and the Census Bureau.
The National Center for Science and Engineering Statistics has reviewed this product for unauthorized disclosure of confidential information and approved its release (NCSES-DRN26-022).
This report is initially published with a selection of tables containing the core data of the survey. The report will be updated with additional tables as more detailed data become available. In some instances, the initial selection of tables may also be updated from a preliminary version to add further data.
The first set of tables in this report, 1–33, released in August 2026.
National Center for Science and Engineering Statistics (NCSES). 2026. Annual Business Survey: 2024 (Data Year 2023). NSF 26-321. Alexandria, VA: U.S. National Science Foundation. Available at https://ncses.nsf.gov/surveys/annual-business-survey/2024.
For additional information about this survey or the methodology, contact