 An official website of the United States government
 Data
Tables
Number
Title
Download
View
NumberTAL-1
TAL-1
Workforce, occupational groups, and examples
TitleWorkforce, occupational groups, and examples
NumberTAL-2
TAL-2
Median earnings of full-time, year-round workers, by educational attainment and occupational group: 2023
TitleMedian earnings of full-time, year-round workers, by educational attainment and occupational group: 2023
NumberTAL-3
TAL-3
Share of STEM workforce, by state: 2013–23
TitleShare of STEM workforce, by state: 2013–23
NumberTAL-4
TAL-4
Workers, by region of birth and occupational group: 2023
TitleWorkers, by region of birth and occupational group: 2023
NumberTAL-5
TAL-5
Foreign-born workers, by selected region, country, or economy of origin and occupational group: 2023
TitleForeign-born workers, by selected region, country, or economy of origin and occupational group: 2023
NumberTAL-6
TAL-6
Citizenship status of foreign-born STEM workers, by selected region, country, or economy of origin: 2023
TitleCitizenship status of foreign-born STEM workers, by selected region, country, or economy of origin: 2023
NumberTAL-7
TAL-7
Measures of population with a bachelor's or an advanced degree, by field of study: 2023
TitleMeasures of population with a bachelor's or an advanced degree, by field of study: 2023
NumberTAL-8
TAL-8
Workers in major industries, by occupational group: 2023
TitleWorkers in major industries, by occupational group: 2023
NumberTAL-9
TAL-9
STEM workforce and the educational attainment, citizenship status, and country or economy of the foreign-born STEM workforce, by major industry: 2023
TitleSTEM workforce and the educational attainment, citizenship status, and country or economy of the foreign-born STEM workforce, by major industry: 2023
NumberTAL-10
TAL-10
Average scores of students in grades 4, 8, and 12 on the main NAEP mathematics assessment, by race or ethnicity: 2024
TitleAverage scores of students in grades 4, 8, and 12 on the main NAEP mathematics assessment, by race or ethnicity: 2024
NumberTAL-11
TAL-11
S&E-related degrees awarded, by degree level and field: 2013 and 2023
TitleS&E-related degrees awarded, by degree level and field: 2013 and 2023
NumberTAL-12
TAL-12
Recent recipients of their first bachelor's degrees who reported attending community college, by timing of attendance and broad field area: 2023
TitleRecent recipients of their first bachelor's degrees who reported attending community college, by timing of attendance and broad field area: 2023
NumberTAL-13
TAL-13
Degrees awarded by HBCUs and TCCUs, by degree level and field area: 2023
TitleDegrees awarded by HBCUs and TCCUs, by degree level and field area: 2023
NumberTAL-14
TAL-14
Among fall 2009 ninth graders who started as a STEM major and completed a postsecondary degree by 2021, percentage who completed a STEM degree, by student characteristics
TitleAmong fall 2009 ninth graders who started as a STEM major and completed a postsecondary degree by 2021, percentage who completed a STEM degree, by student characteristics
NumberTAL-15
TAL-15
S&E doctorate recipients with definite postgraduation commitments, by location of commitments, citizenship status, and field of doctorate: 2023
TitleS&E doctorate recipients with definite postgraduation commitments, by location of commitments, citizenship status, and field of doctorate: 2023
NumberTAL-16
TAL-16
Average CIL and CT scores of U.S. students in grade 8, by race or ethnicity and school poverty level: 2023
TitleAverage CIL and CT scores of U.S. students in grade 8, by race or ethnicity and school poverty level: 2023
NumberTAL-17
TAL-17
Postgraduation plans of U.S. S&E doctorates on temporary resident visas to stay in the United States, by broad field of doctorate and country or economy of origin: 2012–23
TitlePostgraduation plans of U.S. S&E doctorates on temporary resident visas to stay in the United States, by broad field of doctorate and country or economy of origin: 2012–23
NumberTAL-18
TAL-18
U.S. stay rates for S&E doctorates holding temporary U.S. visas at doctoral graduation, by key characteristics: 2023
TitleU.S. stay rates for S&E doctorates holding temporary U.S. visas at doctoral graduation, by key characteristics: 2023
NumberTAL-19
TAL-19
Internationally mobile students enrolled in tertiary education, by selected country of destination: 2017–23
TitleInternationally mobile students enrolled in tertiary education, by selected country of destination: 2017–23
NumberSTAL-1
STAL-1
Workers, by occupational group, race and ethnicity, educational attainment, geography, and major industries: 2023
TitleWorkers, by occupational group, race and ethnicity, educational attainment, geography, and major industries: 2023
NumberSTAL-2
STAL-2
Working-age individuals, by occupational group and employment status: 2013–23
TitleWorking-age individuals, by occupational group and employment status: 2013–23
NumberSTAL-3
STAL-3
Representation of STEM workers, by occupational group, across states: 2023
TitleRepresentation of STEM workers, by occupational group, across states: 2023
NumberSTAL-4
STAL-4
Workers, by state, occupational group, and educational attainment: 2023
TitleWorkers, by state, occupational group, and educational attainment: 2023
NumberSTAL-5
STAL-5
Participation in the workforce, by state and occupational group: 2023
TitleParticipation in the workforce, by state and occupational group: 2023
NumberSTAL-6
STAL-6
STEM workforce, by state, occupational group, and education level: 2023
TitleSTEM workforce, by state, occupational group, and education level: 2023
NumberSTAL-7
STAL-7
Workers, by rural-urban classification, occupational group, and educational attainment: Five-year sample, 2019–23
TitleWorkers, by rural-urban classification, occupational group, and educational attainment: Five-year sample, 2019–23
NumberSTAL-8
STAL-8
Workers, by state and occupational group: 2013–23
TitleWorkers, by state and occupational group: 2013–23
NumberSTAL-10
STAL-10
STEM workers, by occupational group, credential type, credential attainment, and educational attainment: 2024
TitleSTEM workers, by occupational group, credential type, credential attainment, and educational attainment: 2024
NumberSTAL-11
STAL-11
Measures of population with a bachelor's or an advanced degree, by field of study, race and ethnicity, and sex: 2023
TitleMeasures of population with a bachelor's or an advanced degree, by field of study, race and ethnicity, and sex: 2023
NumberSTAL-12
STAL-12
Workforce, STEM workforce by place of birth, and the educational attainment and citizenship status of the foreign-born STEM workforce, by major industry: 2023
TitleWorkforce, STEM workforce by place of birth, and the educational attainment and citizenship status of the foreign-born STEM workforce, by major industry: 2023
NumberSTAL-13
STAL-13
Industries with R&D intensity higher than the average across industries: 2022
TitleIndustries with R&D intensity higher than the average across industries: 2022
NumberSTAL-14
STAL-14
Workers, by occupational group, educational level, and industry: 2017 and 2022
TitleWorkers, by occupational group, educational level, and industry: 2017 and 2022
NumberSTAL-15
STAL-15
Average scores of students in grades 4 and 8 on the NAEP mathematics assessment, by student grade and characteristic: 1990–2024
TitleAverage scores of students in grades 4 and 8 on the NAEP mathematics assessment, by student grade and characteristic: 1990–2024
NumberSTAL-16
STAL-16
Percentile scores of students in grades 4, 8, and 12 on the NAEP mathematics assessment: 1990–2024
TitlePercentile scores of students in grades 4, 8, and 12 on the NAEP mathematics assessment: 1990–2024
NumberSTAL-17
STAL-17
Average scores of students in grade 8 on the main NAEP mathematics assessment, by school enrichment offerings: 2024
TitleAverage scores of students in grade 8 on the main NAEP mathematics assessment, by school enrichment offerings: 2024
NumberSTAL-18
STAL-18
Average scores of students in grades 4 and 8 on the NAEP mathematics assessment, by region and school location: 2003–24
TitleAverage scores of students in grades 4 and 8 on the NAEP mathematics assessment, by region and school location: 2003–24
NumberSTAL-19
STAL-19
Average scores of students in grade 12 on the NAEP mathematics assessment, by student characteristic: 2005–24
TitleAverage scores of students in grade 12 on the NAEP mathematics assessment, by student characteristic: 2005–24
NumberSTAL-20
STAL-20
Degrees awarded, by degree level, citizenship status, and field: 2023
TitleDegrees awarded, by degree level, citizenship status, and field: 2023
NumberSTAL-21
STAL-21
Among fall 2009 ninth graders who enrolled in a postsecondary major by December 2017, number who completed a STEM degree, non-STEM degree or no degree: June 2021
TitleAmong fall 2009 ninth graders who enrolled in a postsecondary major by December 2017, number who completed a STEM degree, non-STEM degree or no degree: June 2021
NumberSTAL-22
STAL-22
Average scores of 15-year-old students on the PISA mathematics and science literacy scales, by OECD education system: 2022
TitleAverage scores of 15-year-old students on the PISA mathematics and science literacy scales, by OECD education system: 2022
NumberSTAL-23
STAL-23
Average CIL and CT scores of students in grade 8 on the ICILS computer science assessment, by education system: 2023
TitleAverage CIL and CT scores of students in grade 8 on the ICILS computer science assessment, by education system: 2023
NumberSTAL-24
STAL-24
Average scores of students in grade 8 on the TIMSS mathematics and science scales among participating economies, by education system: 2023
TitleAverage scores of students in grade 8 on the TIMSS mathematics and science scales among participating economies, by education system: 2023
Figures
Thumbnail
Number & Title
Download
View
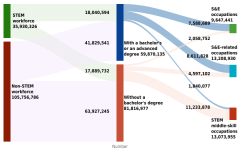
Figure TAL-1.
Size of the workforce, by occupational group and education level: 2023
Size of the workforce, by occupational group and education level: 2023

Figure TAL-2.
Workforce, by occupational group and sex: 2023
Workforce, by occupational group and sex: 2023

Figure TAL-3.
Share of workers of each racial or ethnic group employed in STEM occupations, by race or ethnicity: 2023
Share of workers of each racial or ethnic group employed in STEM occupations, by race or ethnicity: 2023

Figure TAL-4.
Workforce, by occupational group and educational attainment: 2023
Workforce, by occupational group and educational attainment: 2023

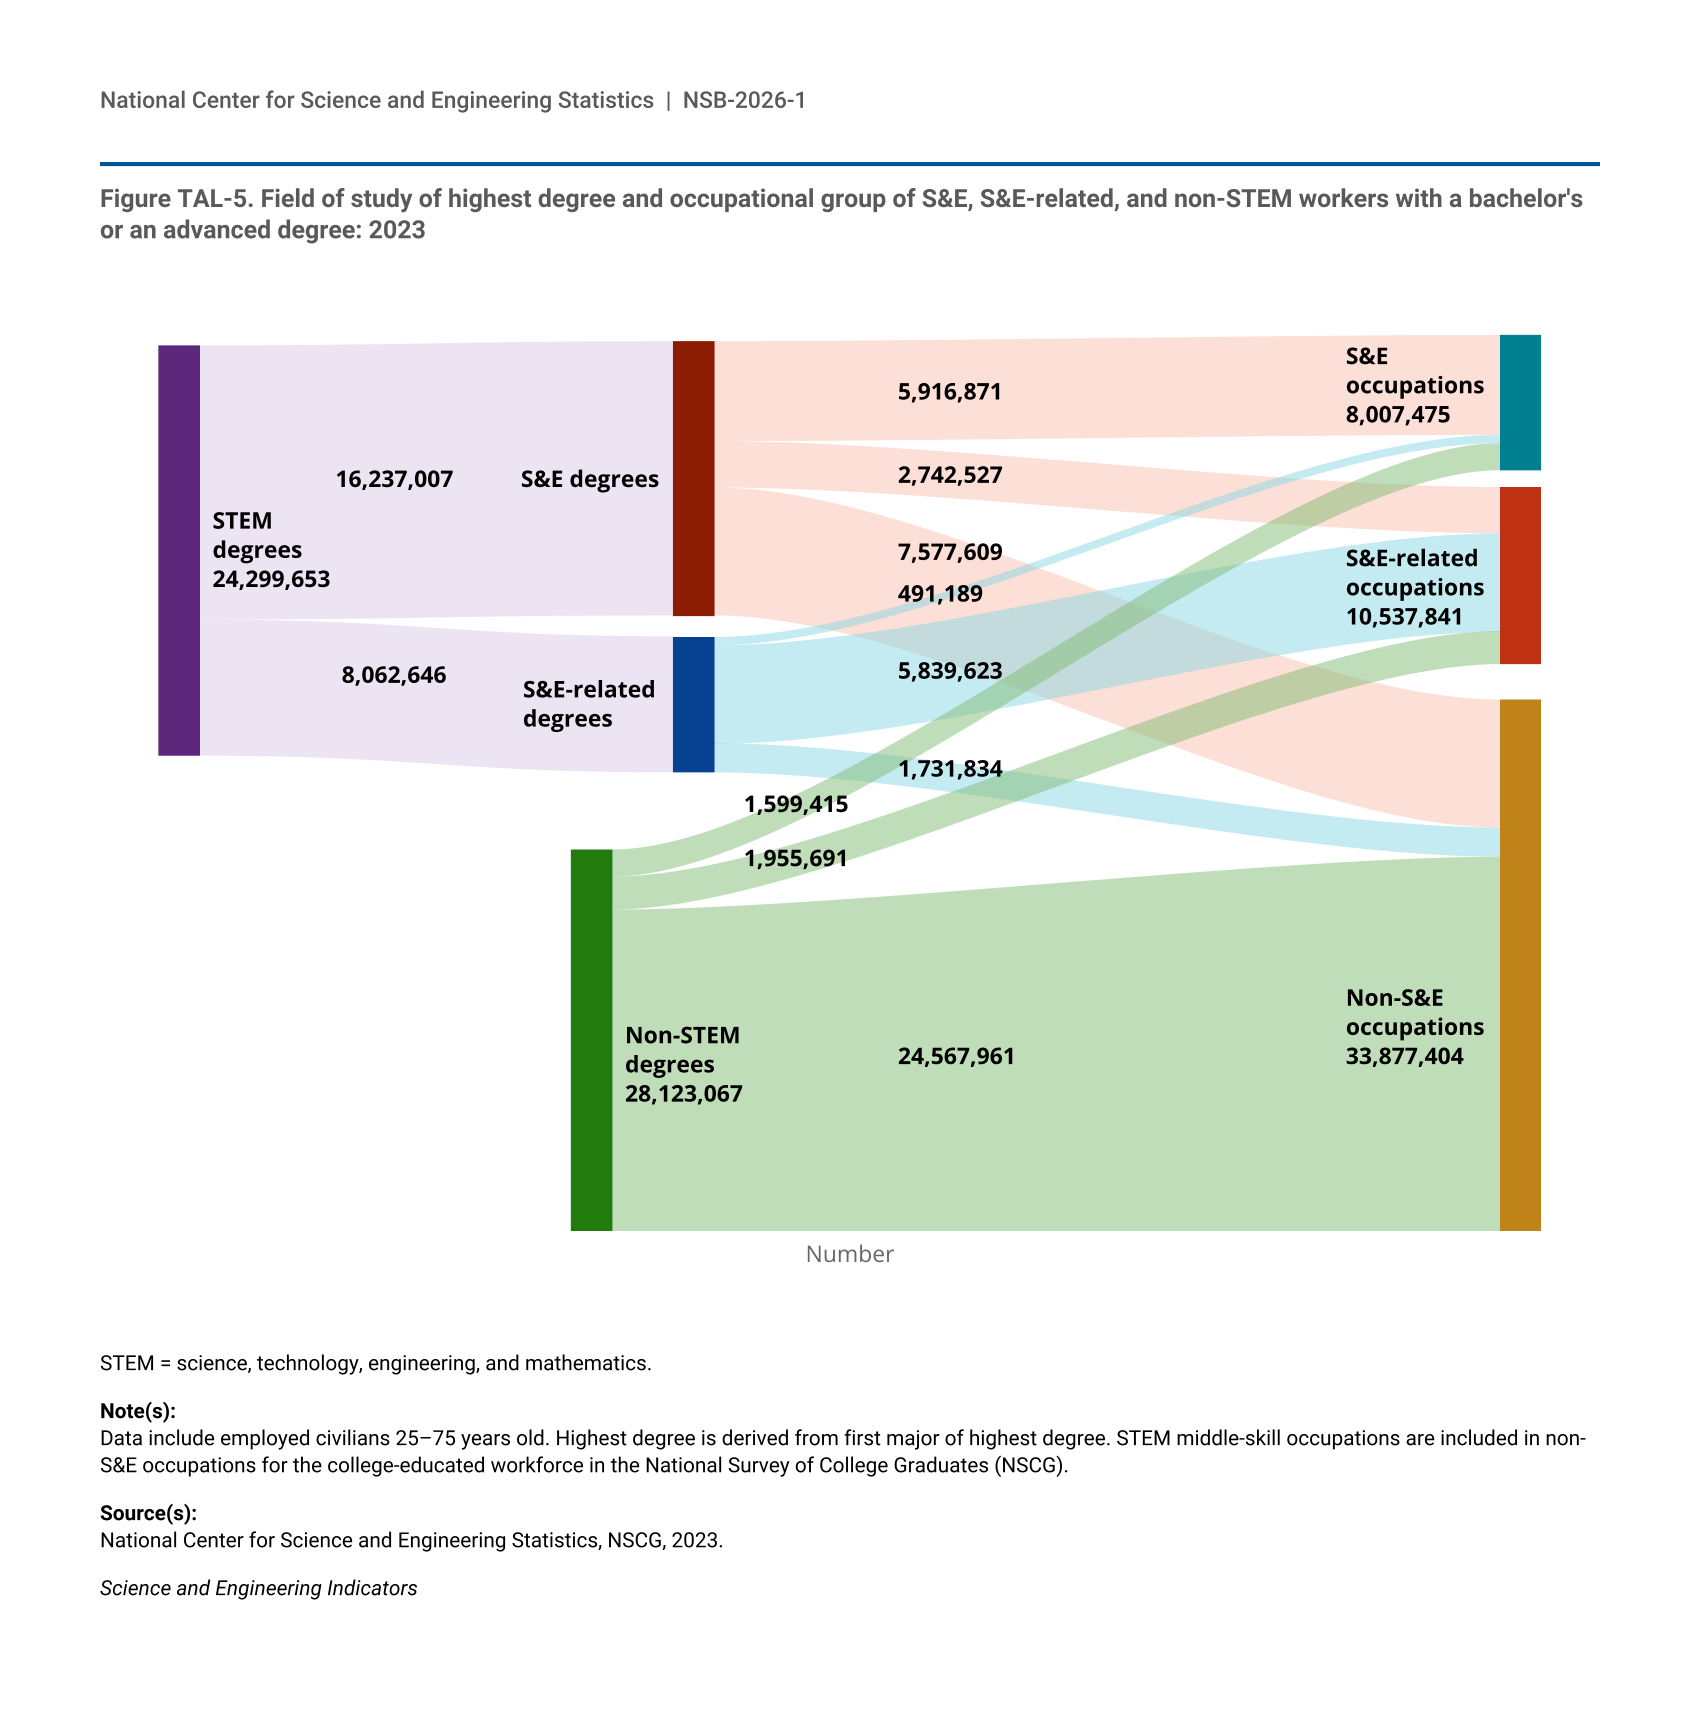
Figure TAL-5.
Field of study of highest degree and occupational group of S&E, S&E-related, and non-STEM workers with a bachelor's or an advanced degree: 2023
Field of study of highest degree and occupational group of S&E, S&E-related, and non-STEM workers with a bachelor's or an advanced degree: 2023

Figure TAL-6.
Unemployment rate, by occupational group: 2013–23
Unemployment rate, by occupational group: 2013–23

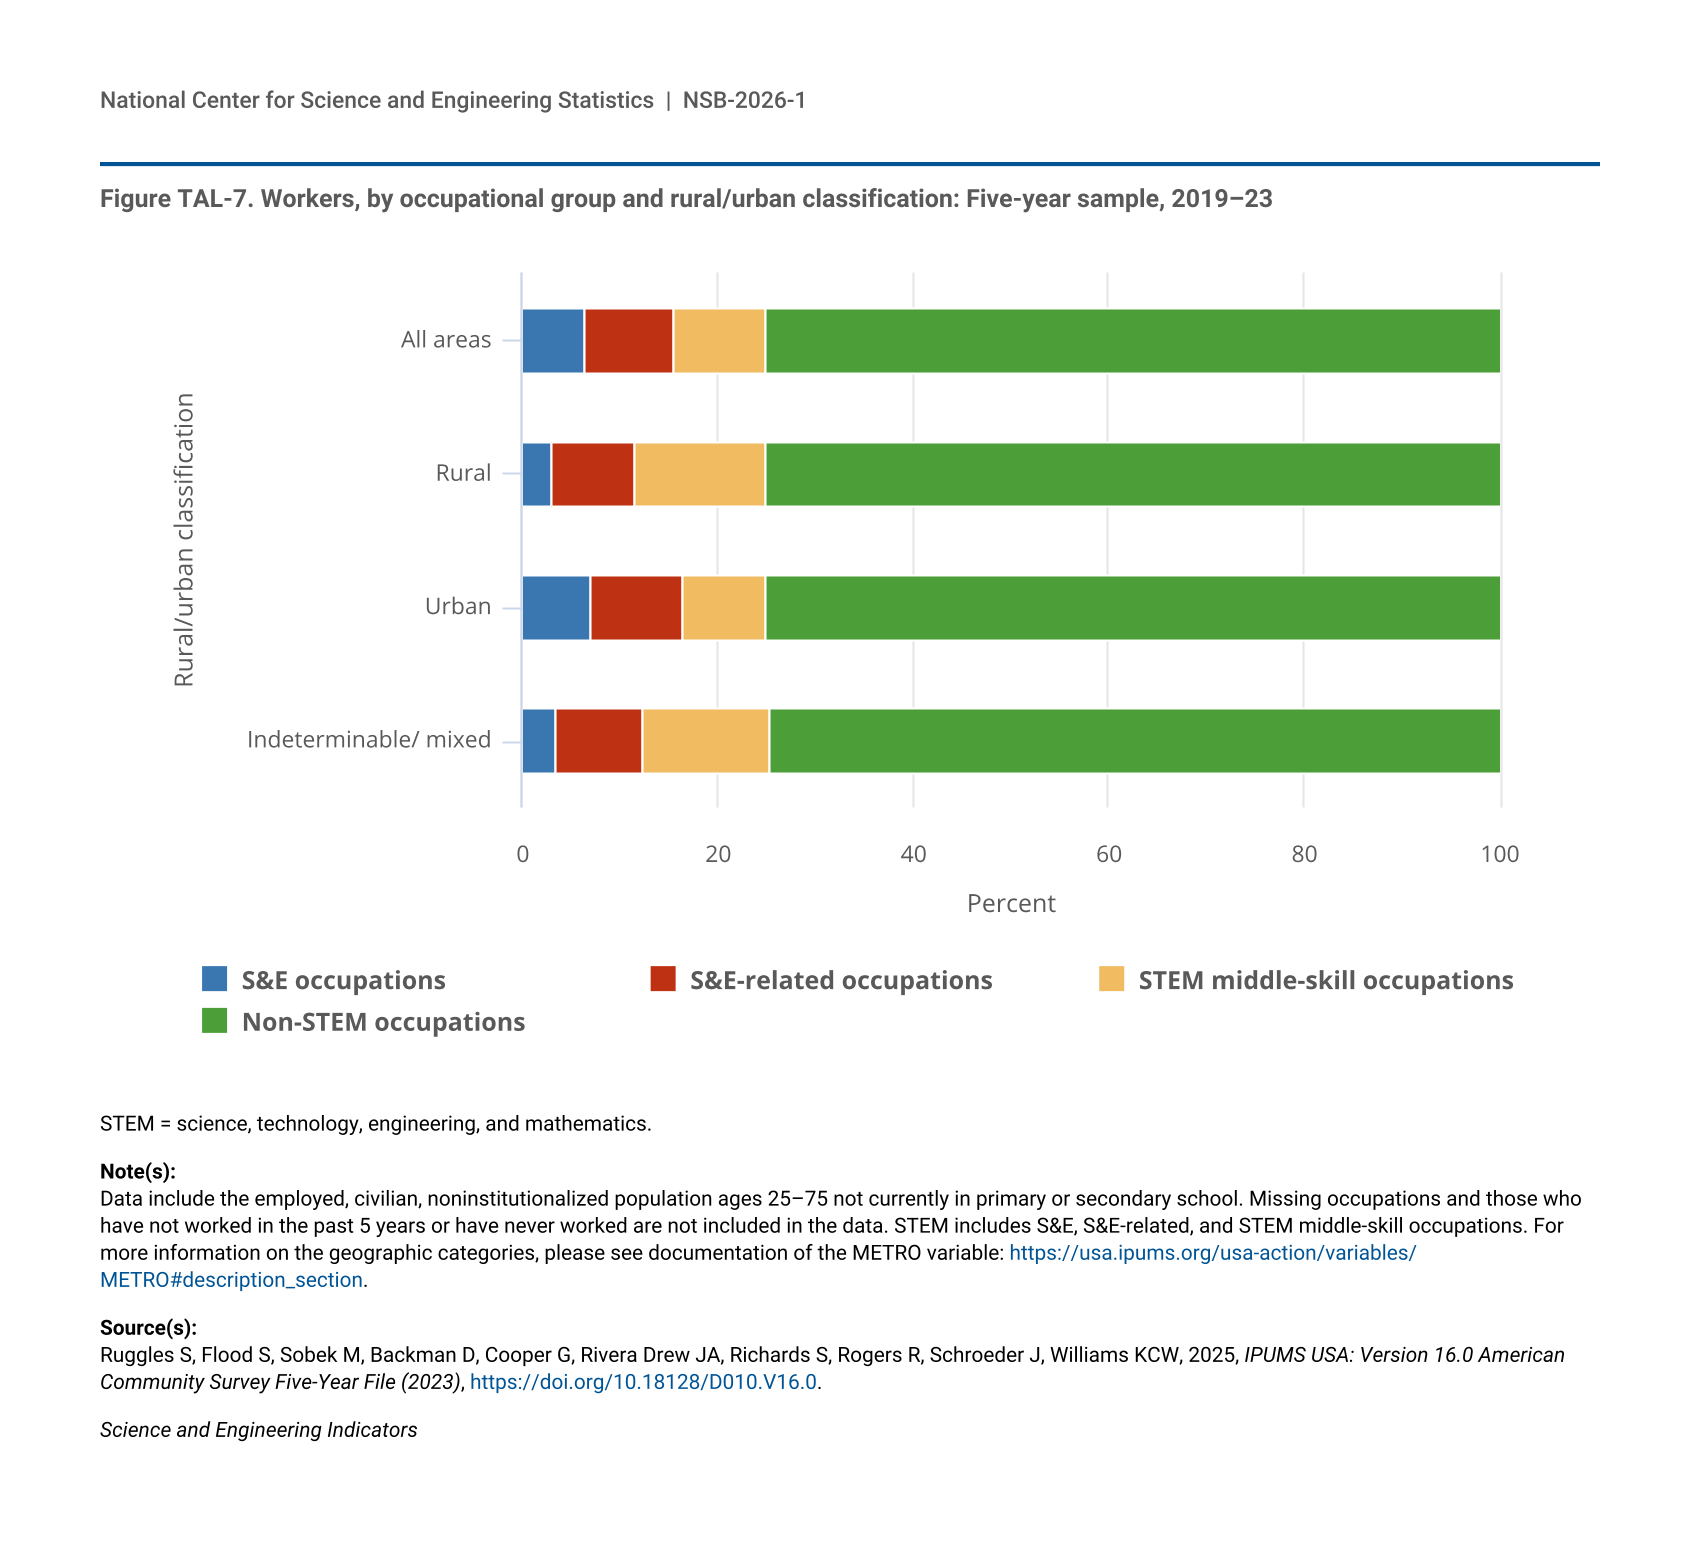
Figure TAL-7.
Workers, by occupational group and rural/urban classification: Five-year sample, 2019–23
Workers, by occupational group and rural/urban classification: Five-year sample, 2019–23

Figure TAL-8.
Workers, by occupational group, rural/urban classification, and educational attainment: Five-year sample, 2019–23
Workers, by occupational group, rural/urban classification, and educational attainment: Five-year sample, 2019–23

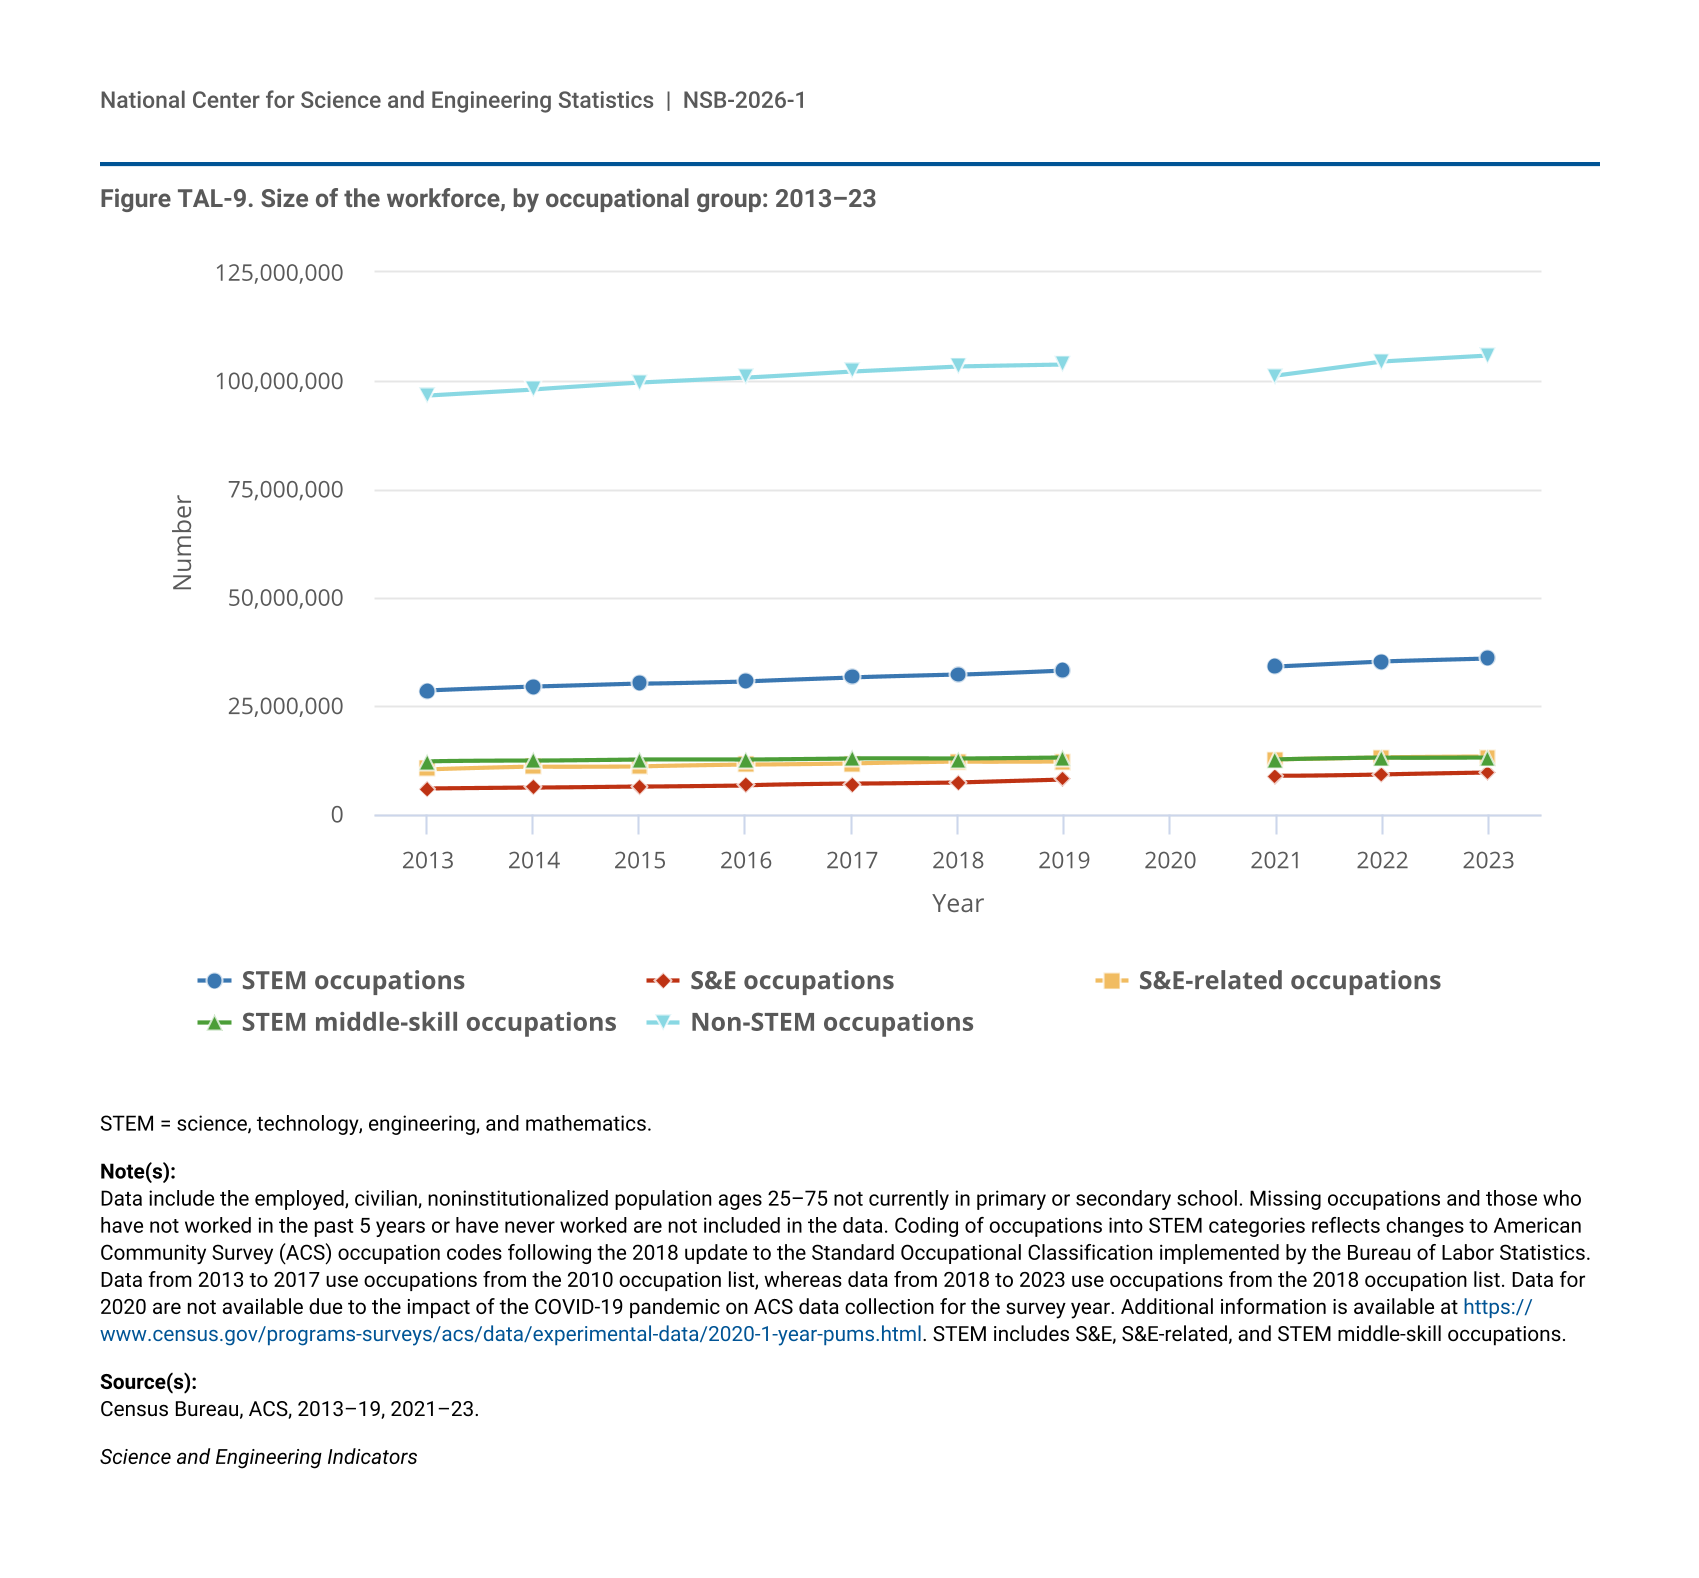
Figure TAL-9.
Size of the workforce, by occupational group: 2013–23
Size of the workforce, by occupational group: 2013–23

Figure TAL-10.
Projected employment size, by occupational group: 2024 and 2034
Projected employment size, by occupational group: 2024 and 2034
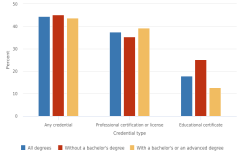
Figure TAL-11.
Share of STEM workers with credentials, by credential type and educational attainment: 2024
Share of STEM workers with credentials, by credential type and educational attainment: 2024

Figure TAL-12.
Measures of population with a bachelor's or an advanced degree, by field of study, sex, and race and ethnicity: 2023
Measures of population with a bachelor's or an advanced degree, by field of study, sex, and race and ethnicity: 2023

Figure TAL-13.
Share of workers in R&D-intensive industries, by occupational group: 2017 and 2022
Share of workers in R&D-intensive industries, by occupational group: 2017 and 2022

Figure TAL-14.
Share of workers in occupational groups, by R&D intensity: 2022
Share of workers in occupational groups, by R&D intensity: 2022
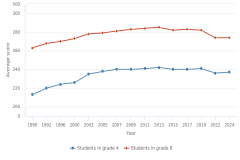
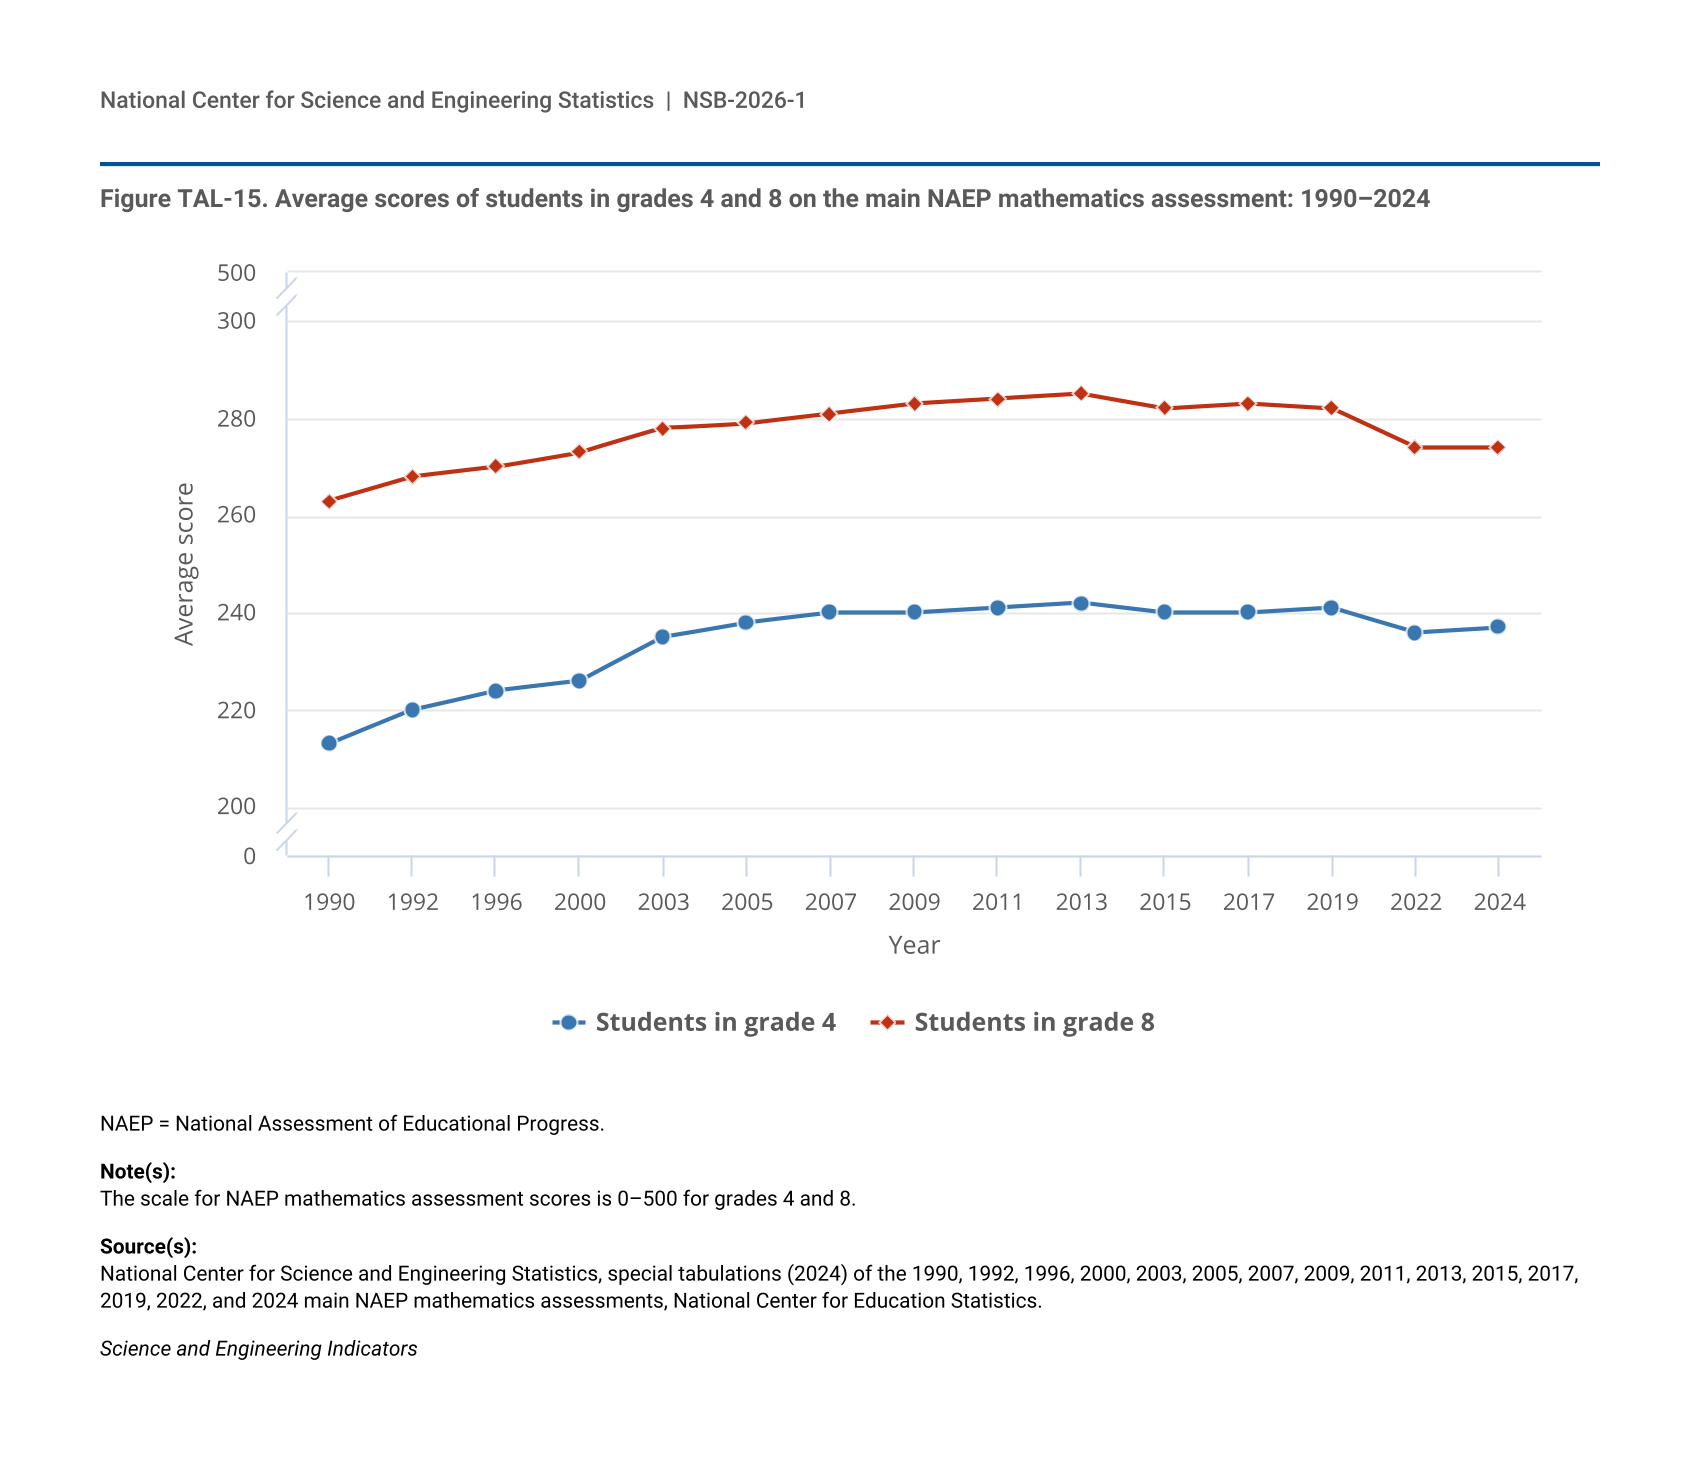
Figure TAL-15.
Average scores of students in grades 4 and 8 on the main NAEP mathematics assessment: 1990–2024
Average scores of students in grades 4 and 8 on the main NAEP mathematics assessment: 1990–2024
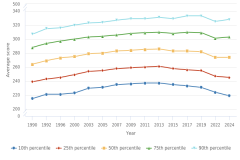
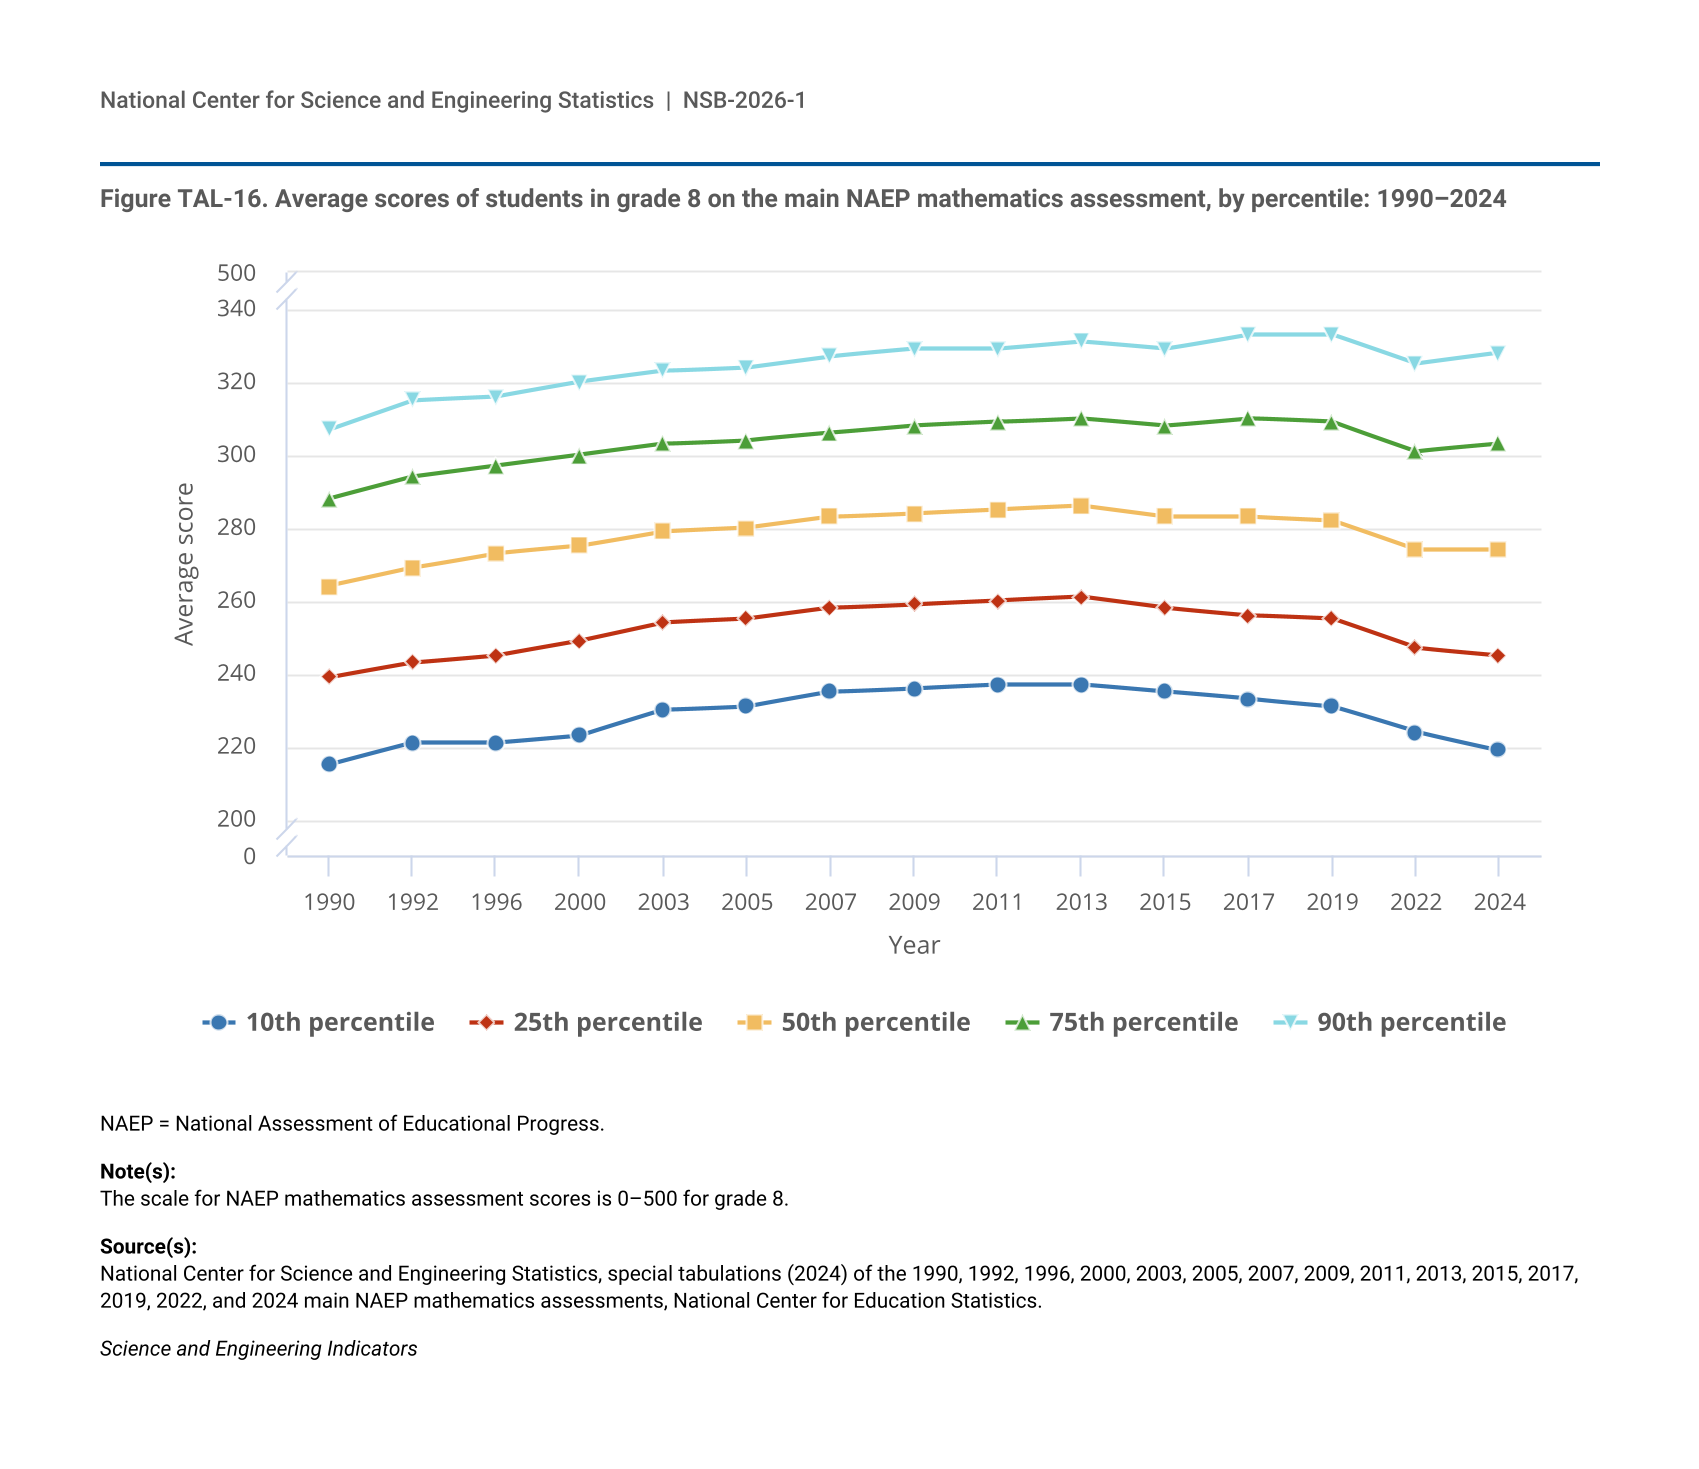
Figure TAL-16.
Average scores of students in grade 8 on the main NAEP mathematics assessment, by percentile: 1990–2024
Average scores of students in grade 8 on the main NAEP mathematics assessment, by percentile: 1990–2024
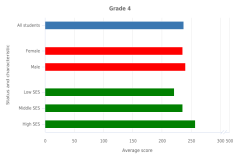
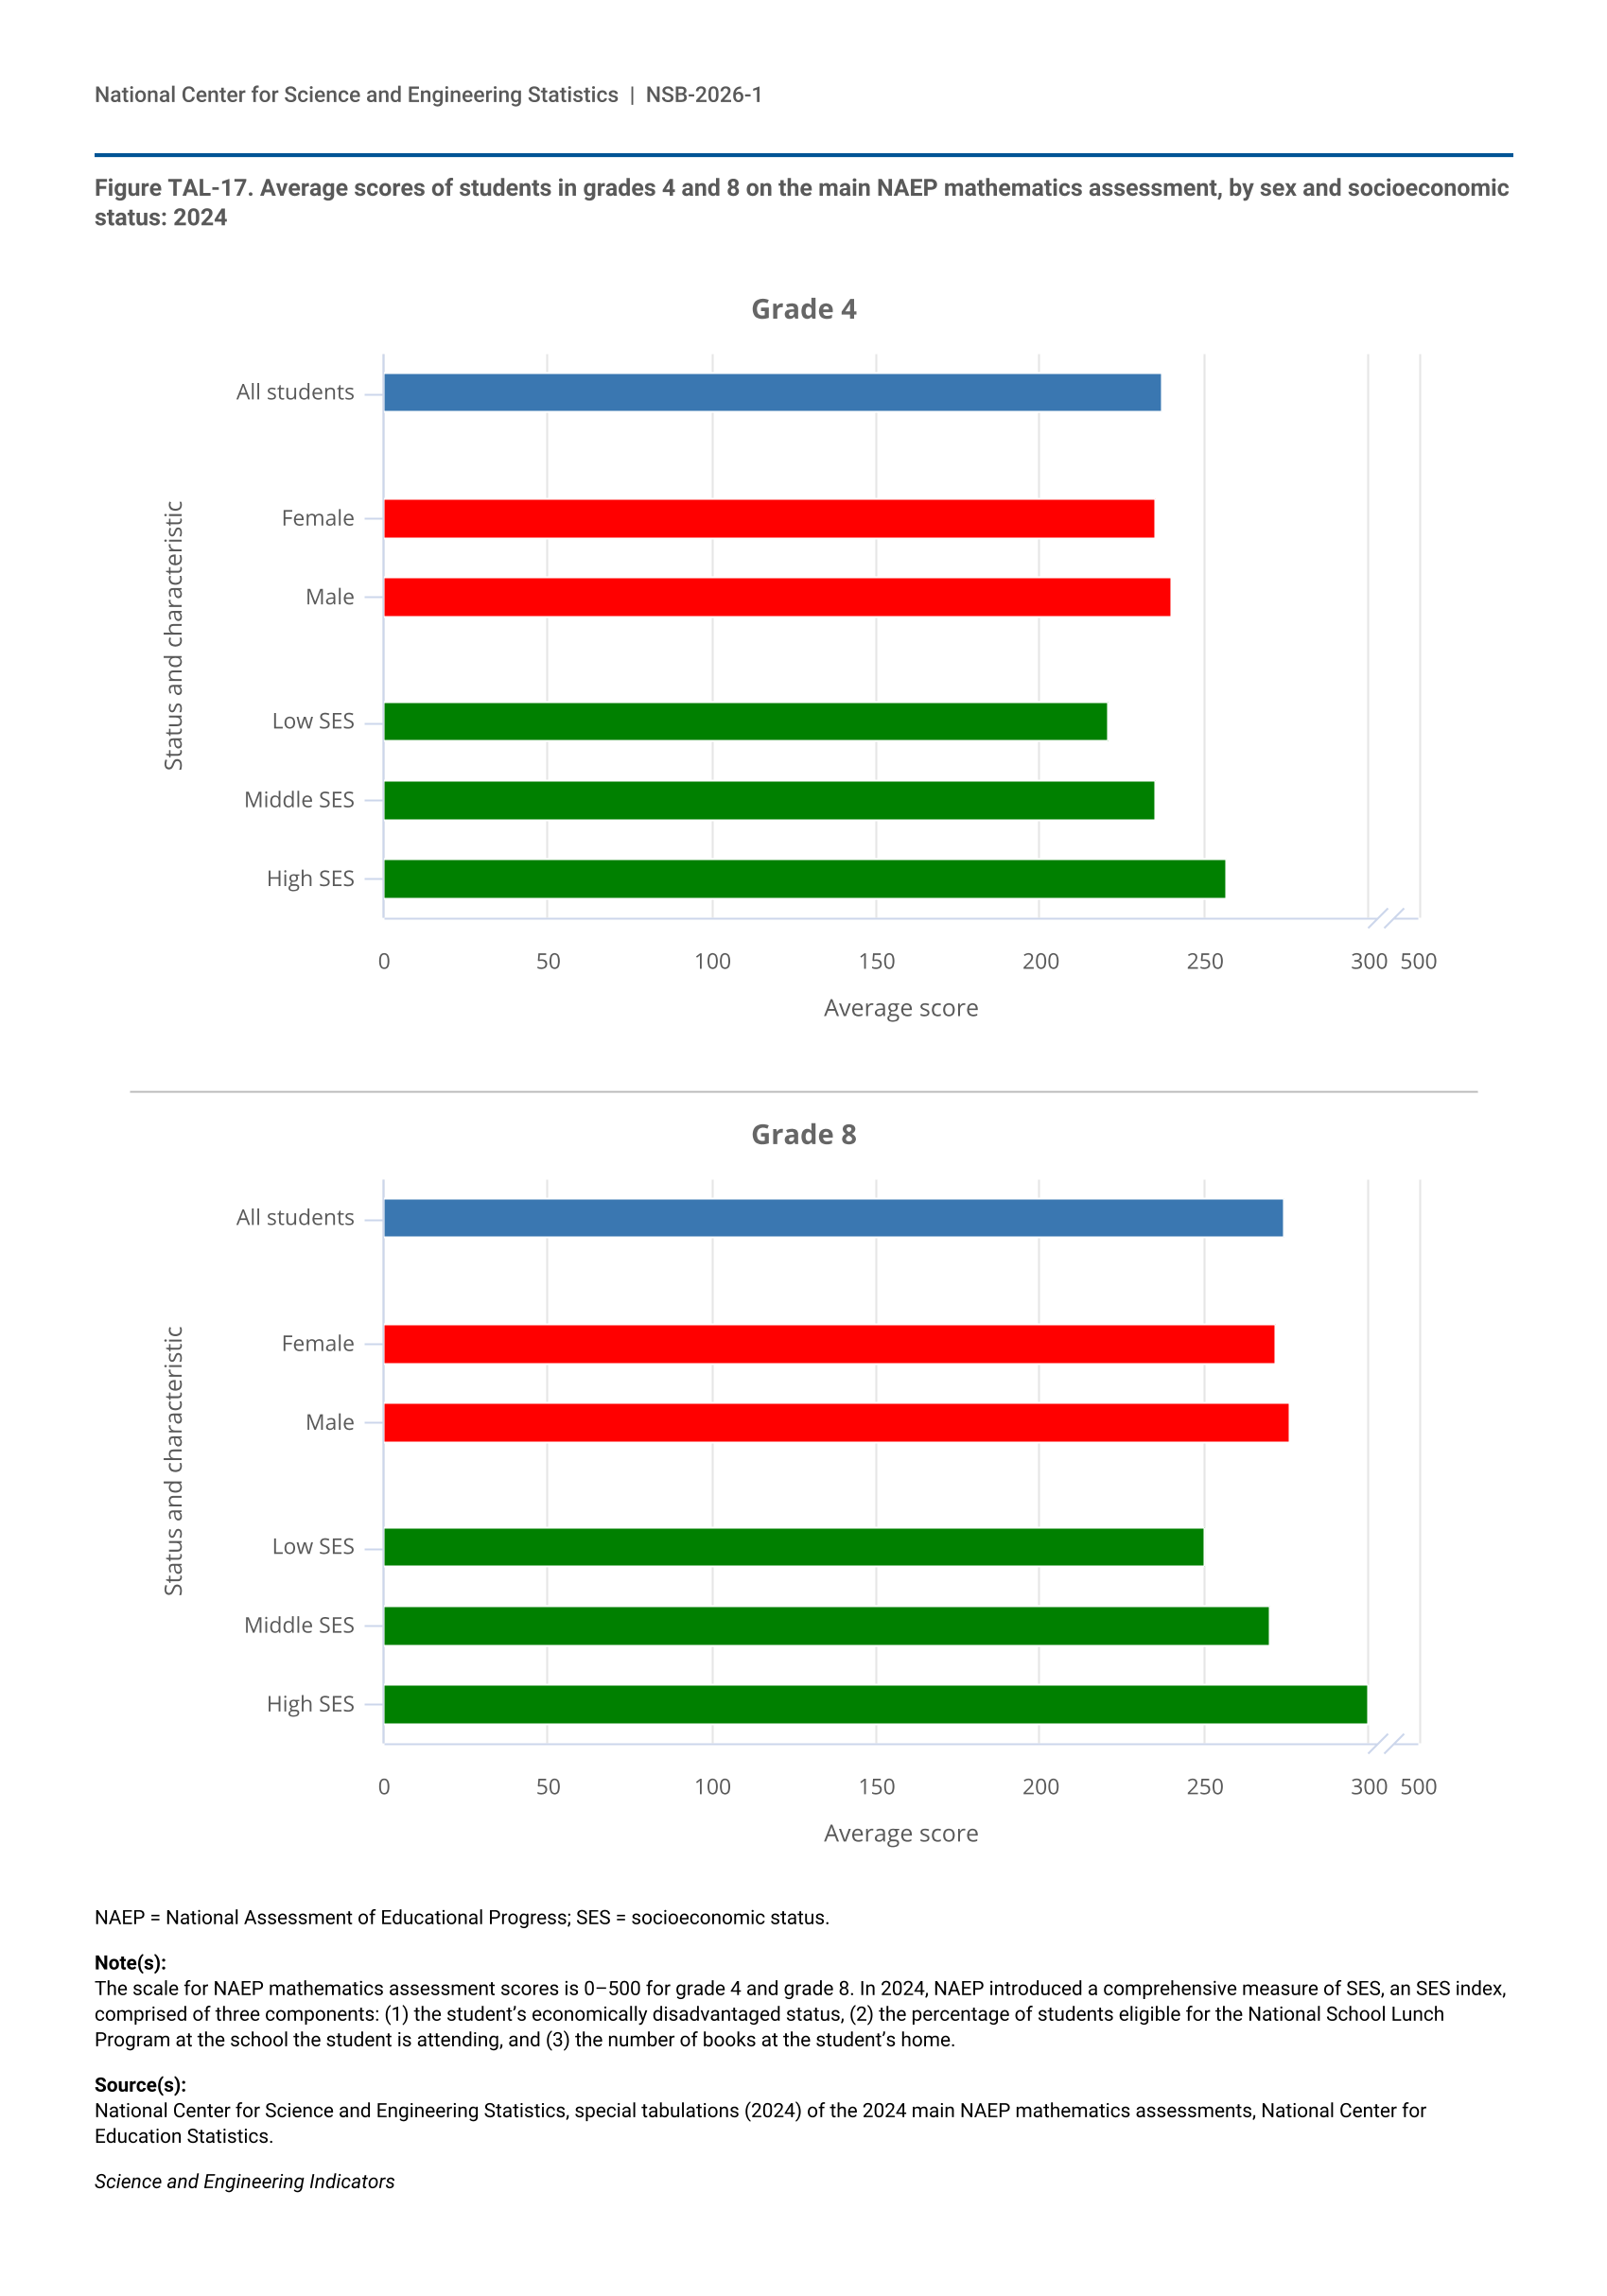
Figure TAL-17.
Average scores of students in grades 4 and 8 on the main NAEP mathematics assessment, by sex and socioeconomic status: 2024
Average scores of students in grades 4 and 8 on the main NAEP mathematics assessment, by sex and socioeconomic status: 2024
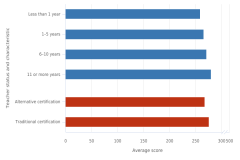
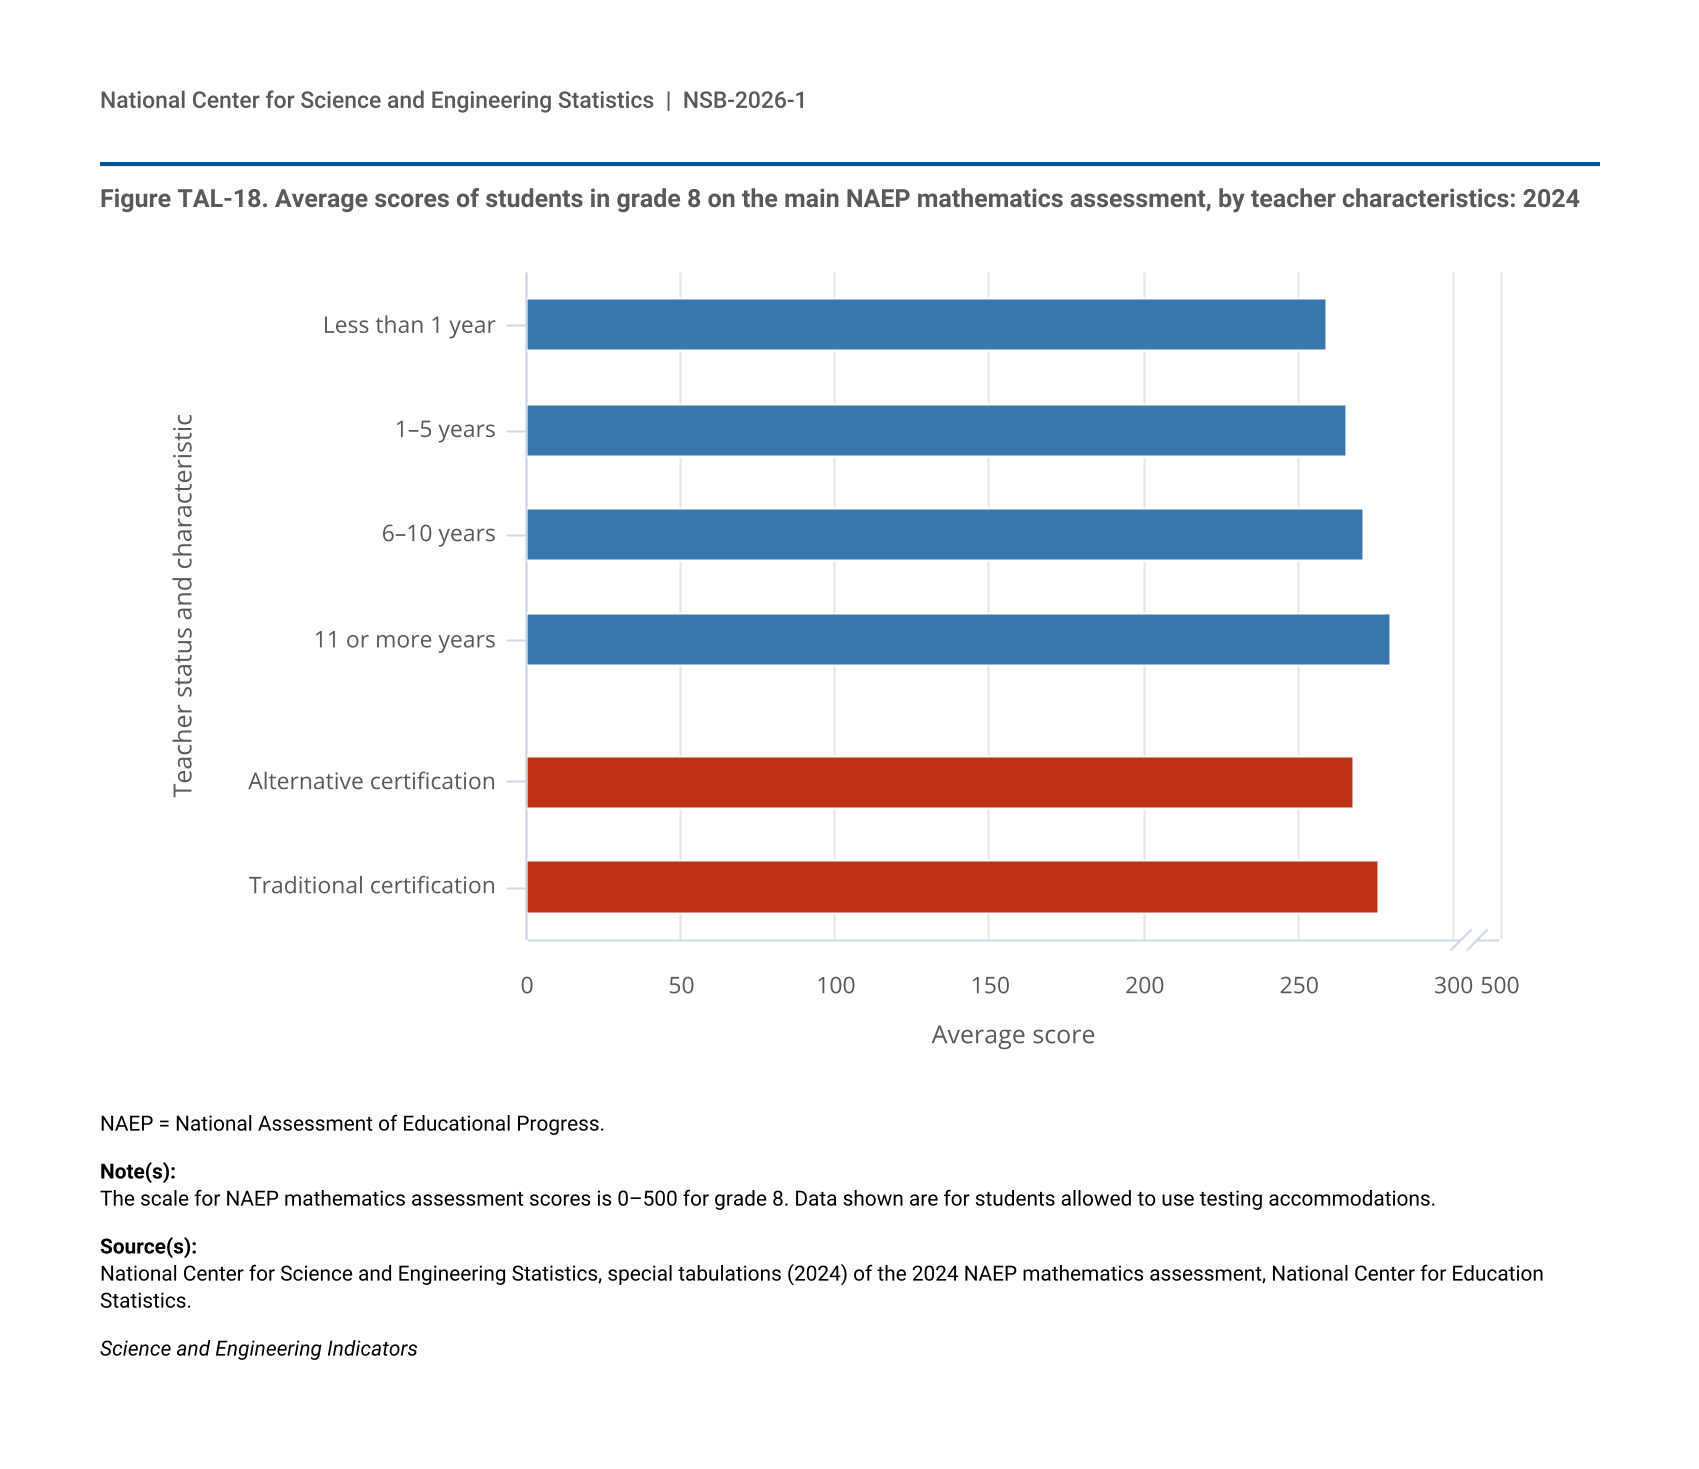
Figure TAL-18.
Average scores of students in grade 8 on the main NAEP mathematics assessment, by teacher characteristics: 2024
Average scores of students in grade 8 on the main NAEP mathematics assessment, by teacher characteristics: 2024
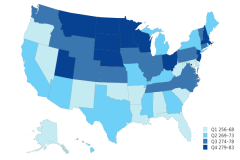
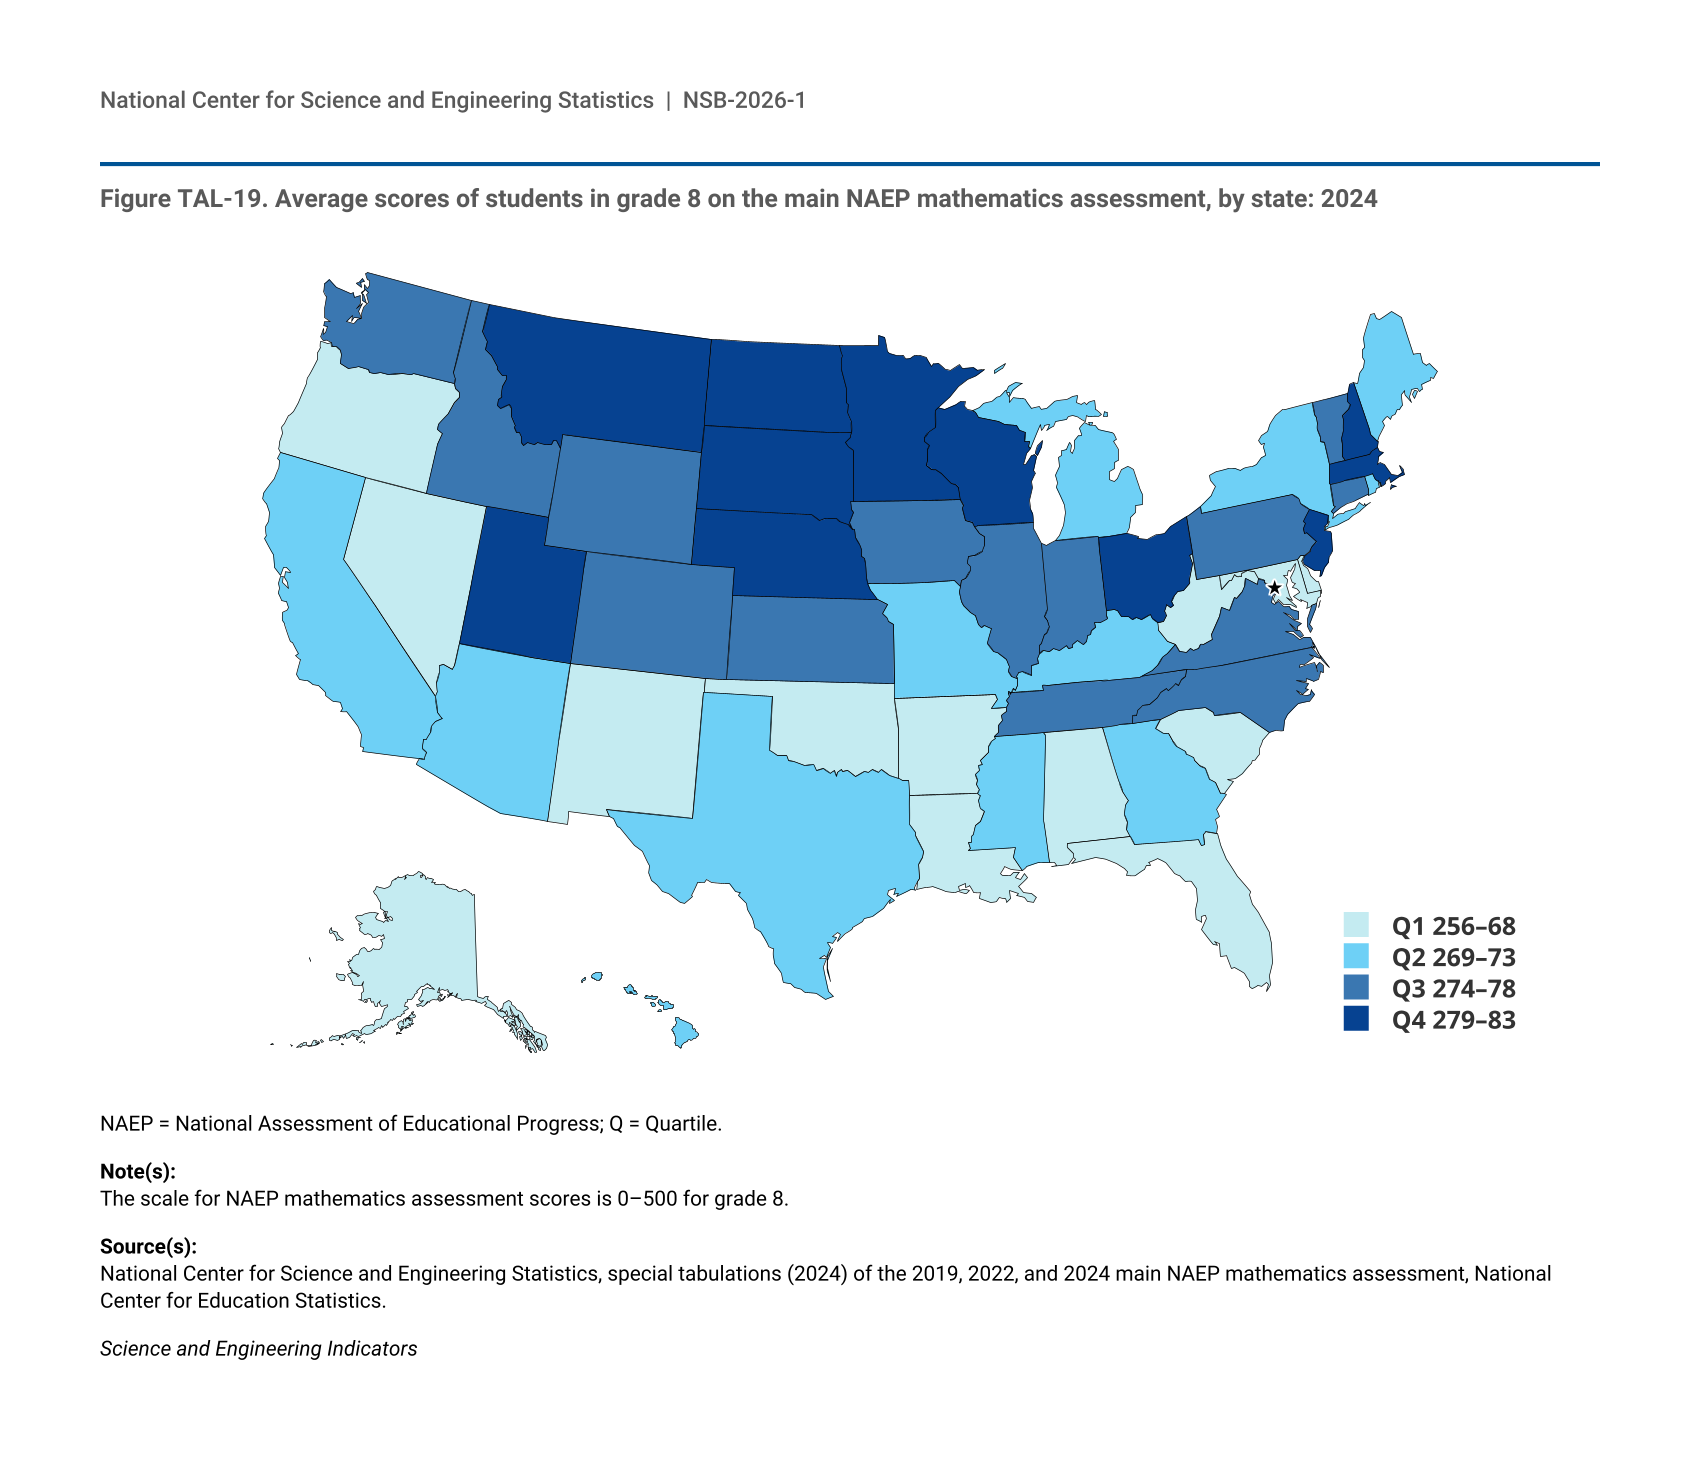
Figure TAL-19.
Average scores of students in grade 8 on the main NAEP mathematics assessment, by state: 2024
Average scores of students in grade 8 on the main NAEP mathematics assessment, by state: 2024
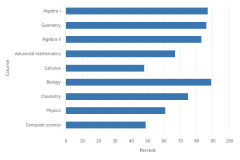
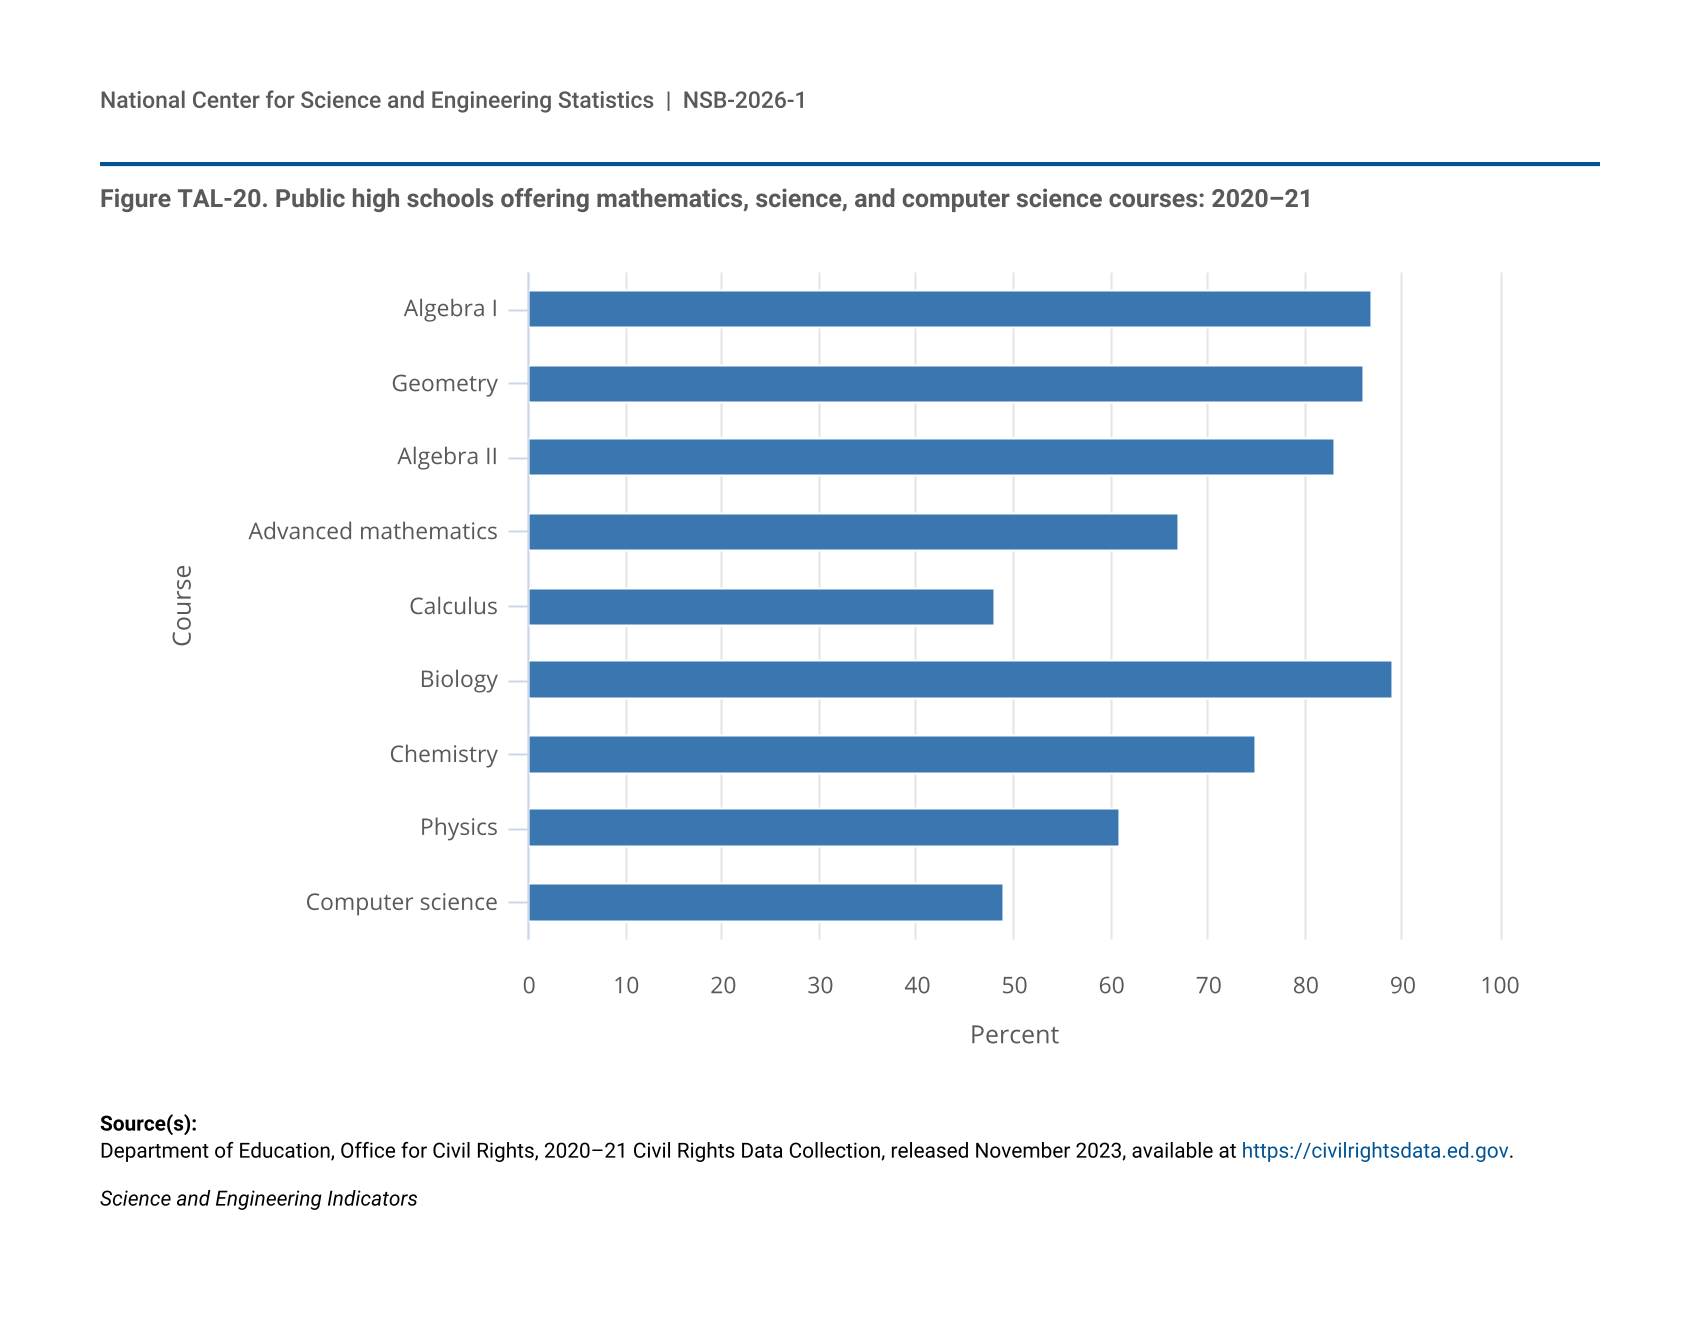
Figure TAL-20.
Public high schools offering mathematics, science, and computer science courses: 2020–21
Public high schools offering mathematics, science, and computer science courses: 2020–21
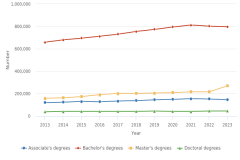
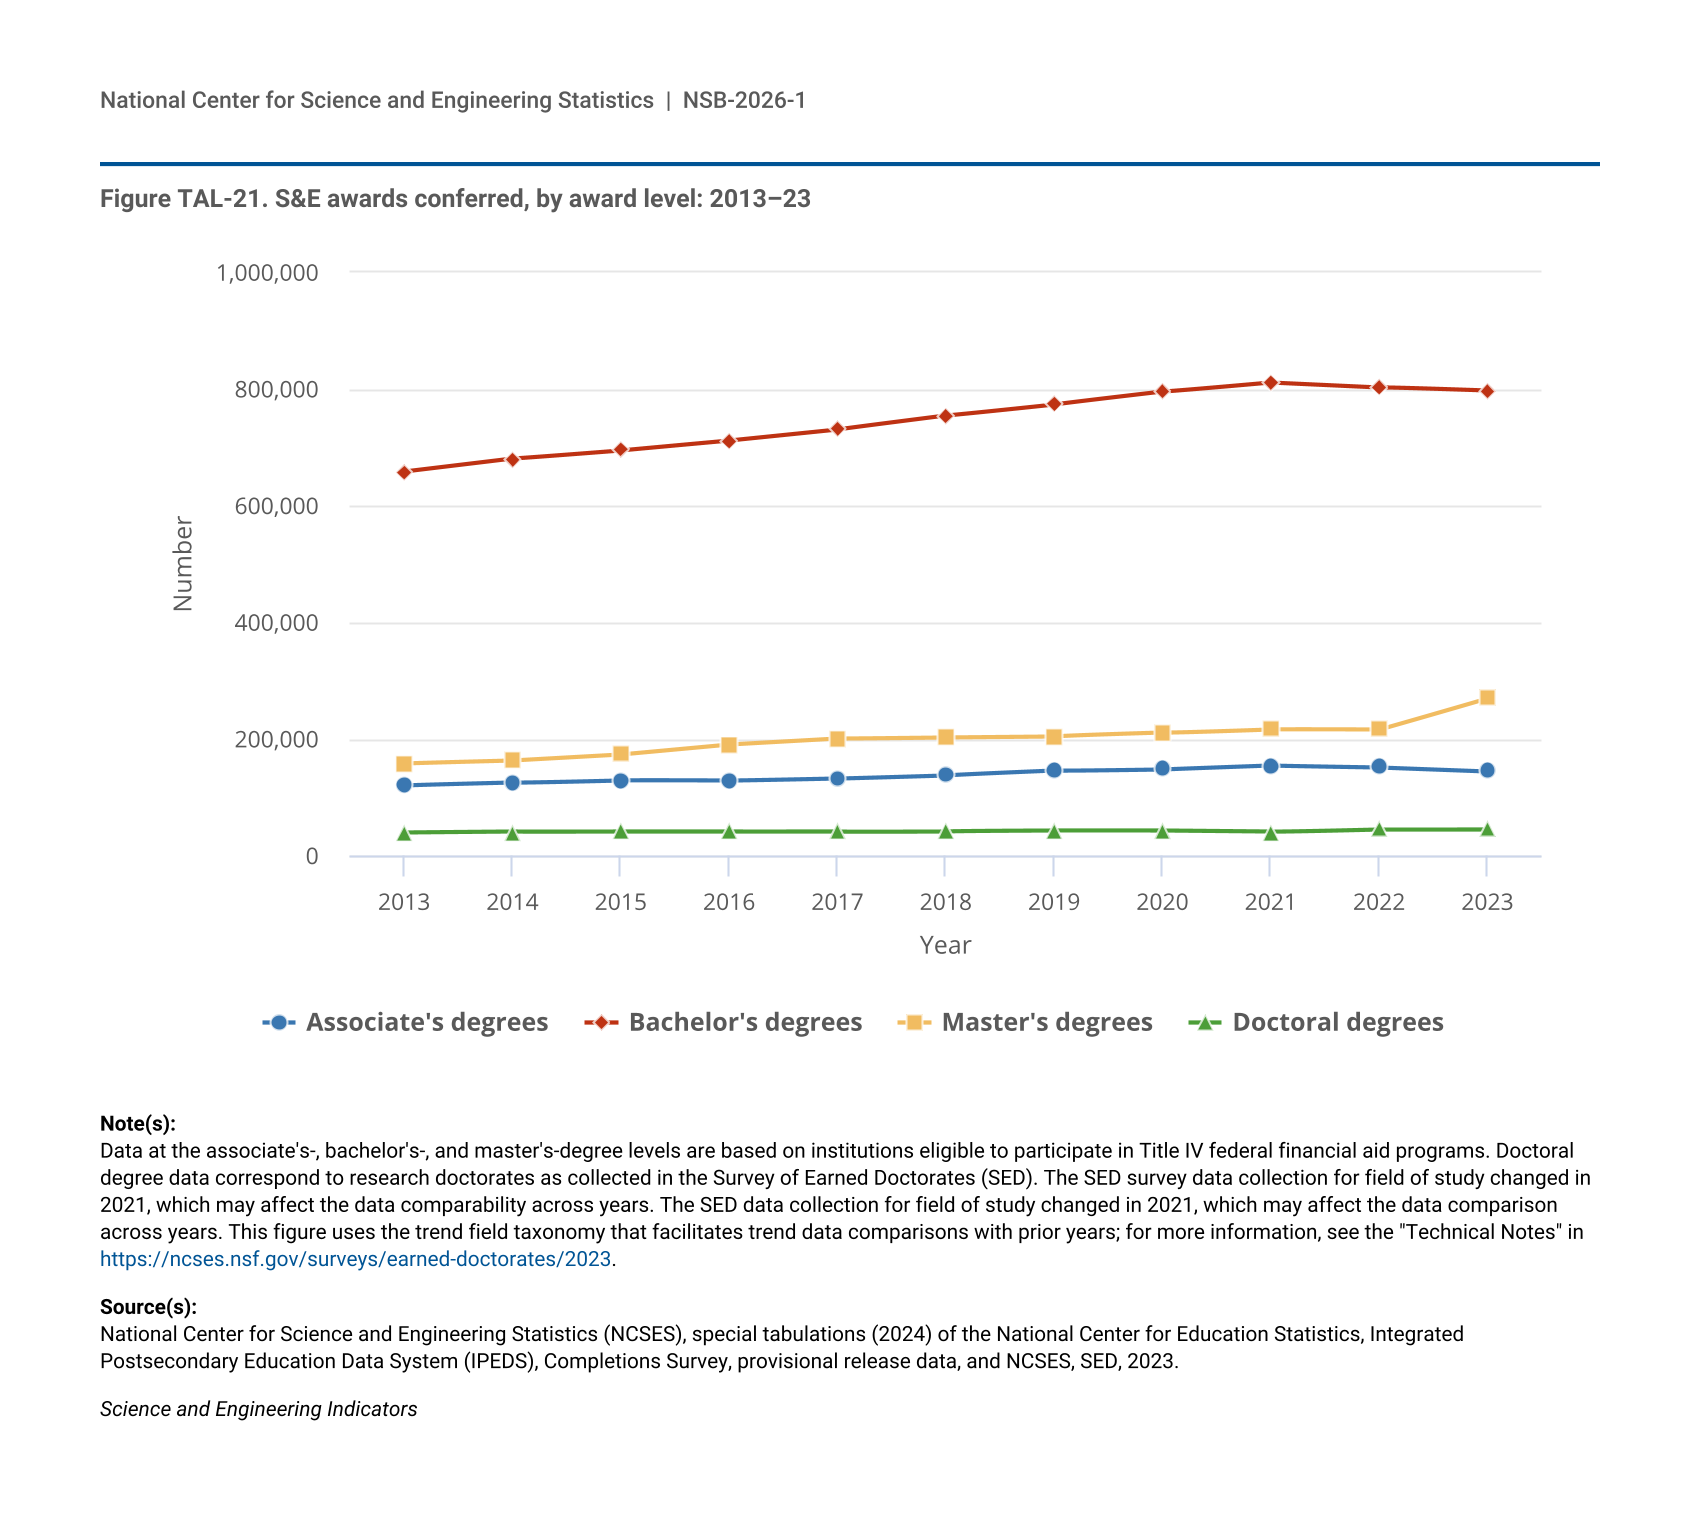
Figure TAL-21.
S&E awards conferred, by award level: 2013–23
S&E awards conferred, by award level: 2013–23
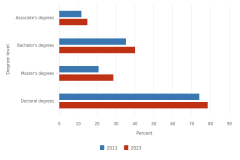
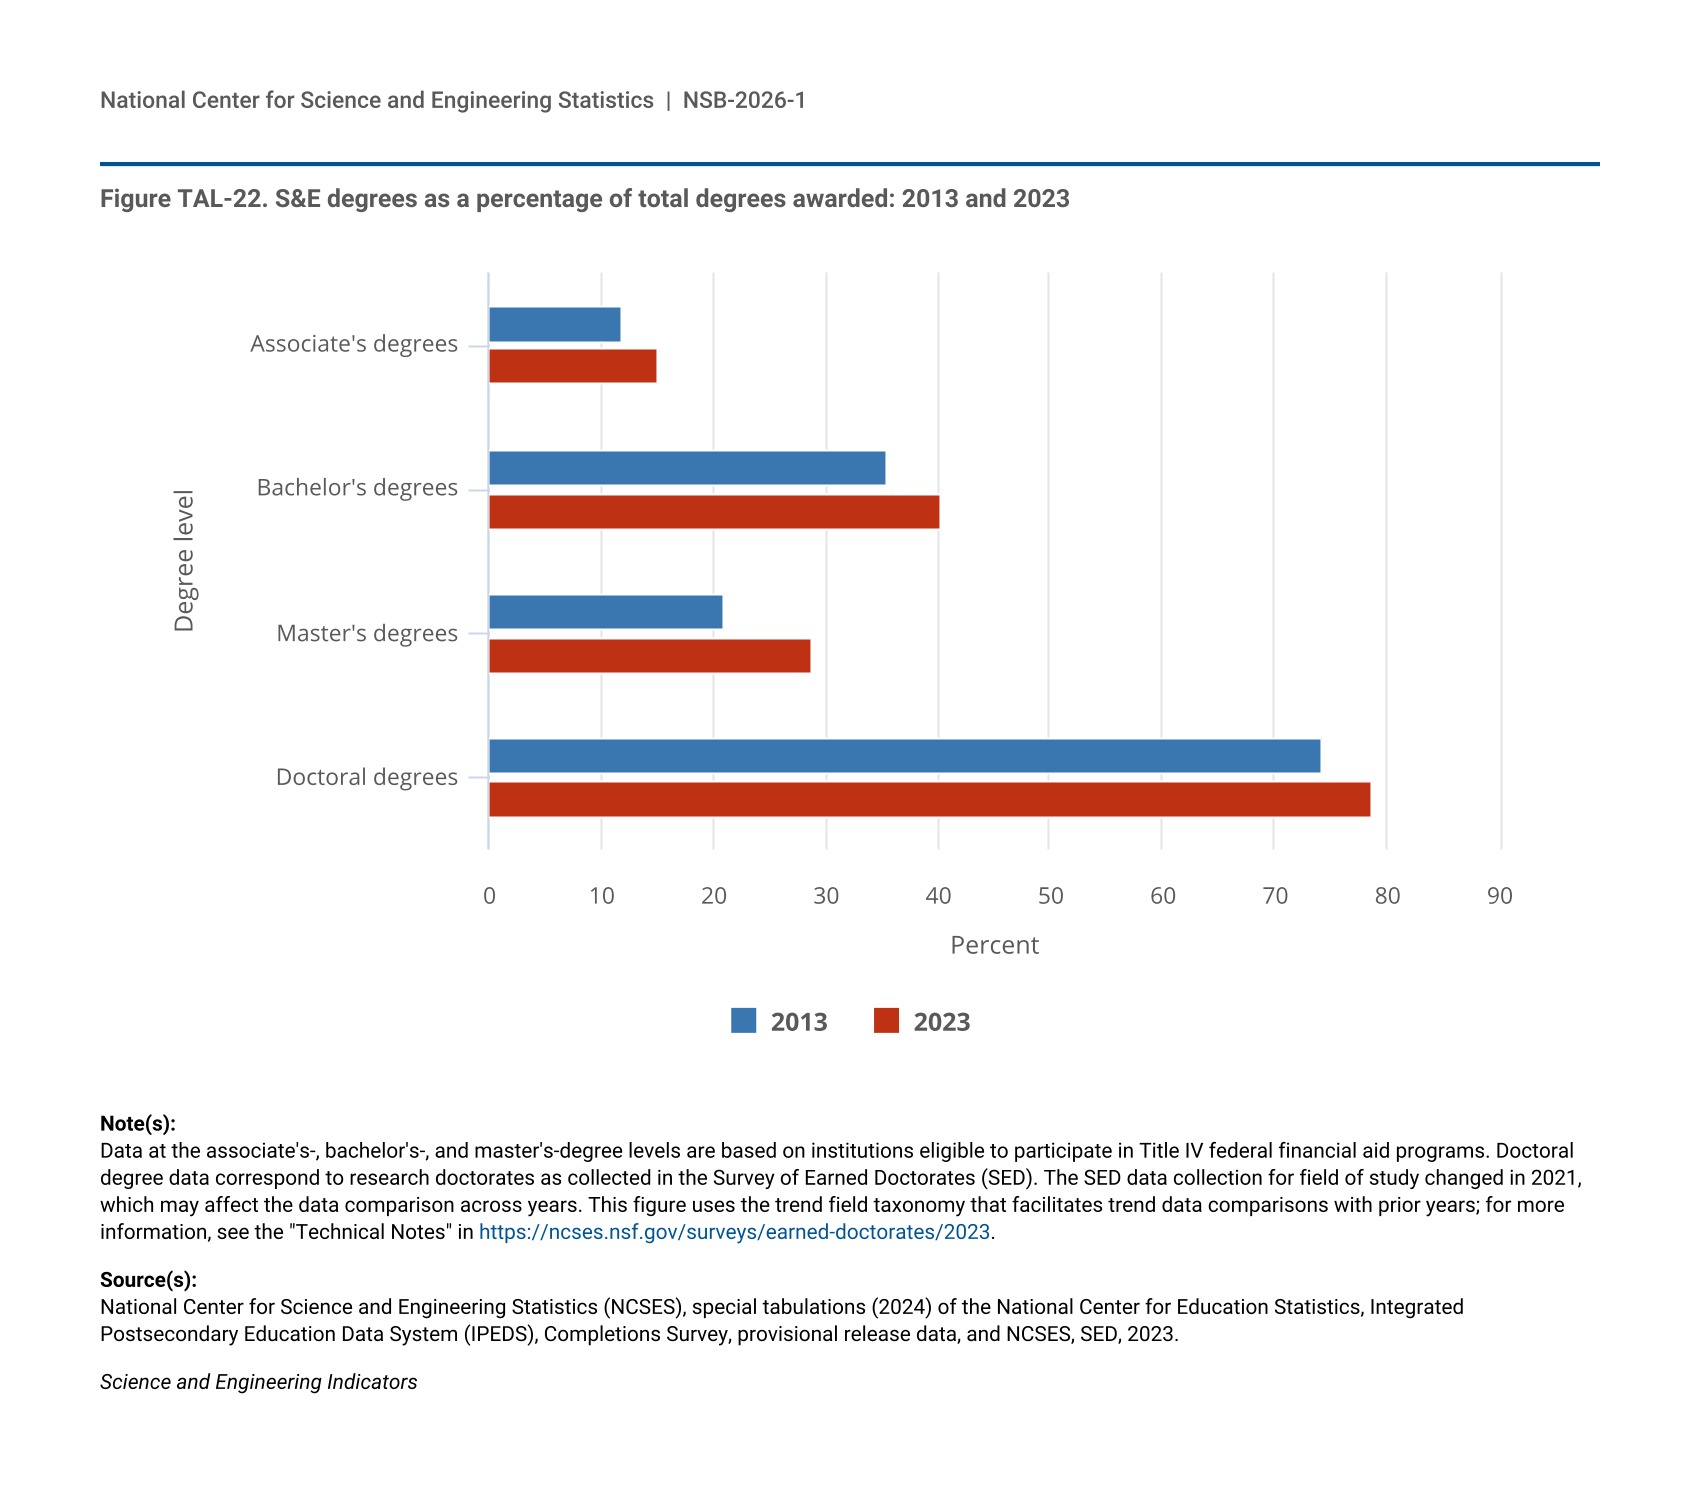
Figure TAL-22.
S&E degrees as a percentage of total degrees awarded: 2013 and 2023
S&E degrees as a percentage of total degrees awarded: 2013 and 2023
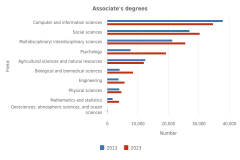
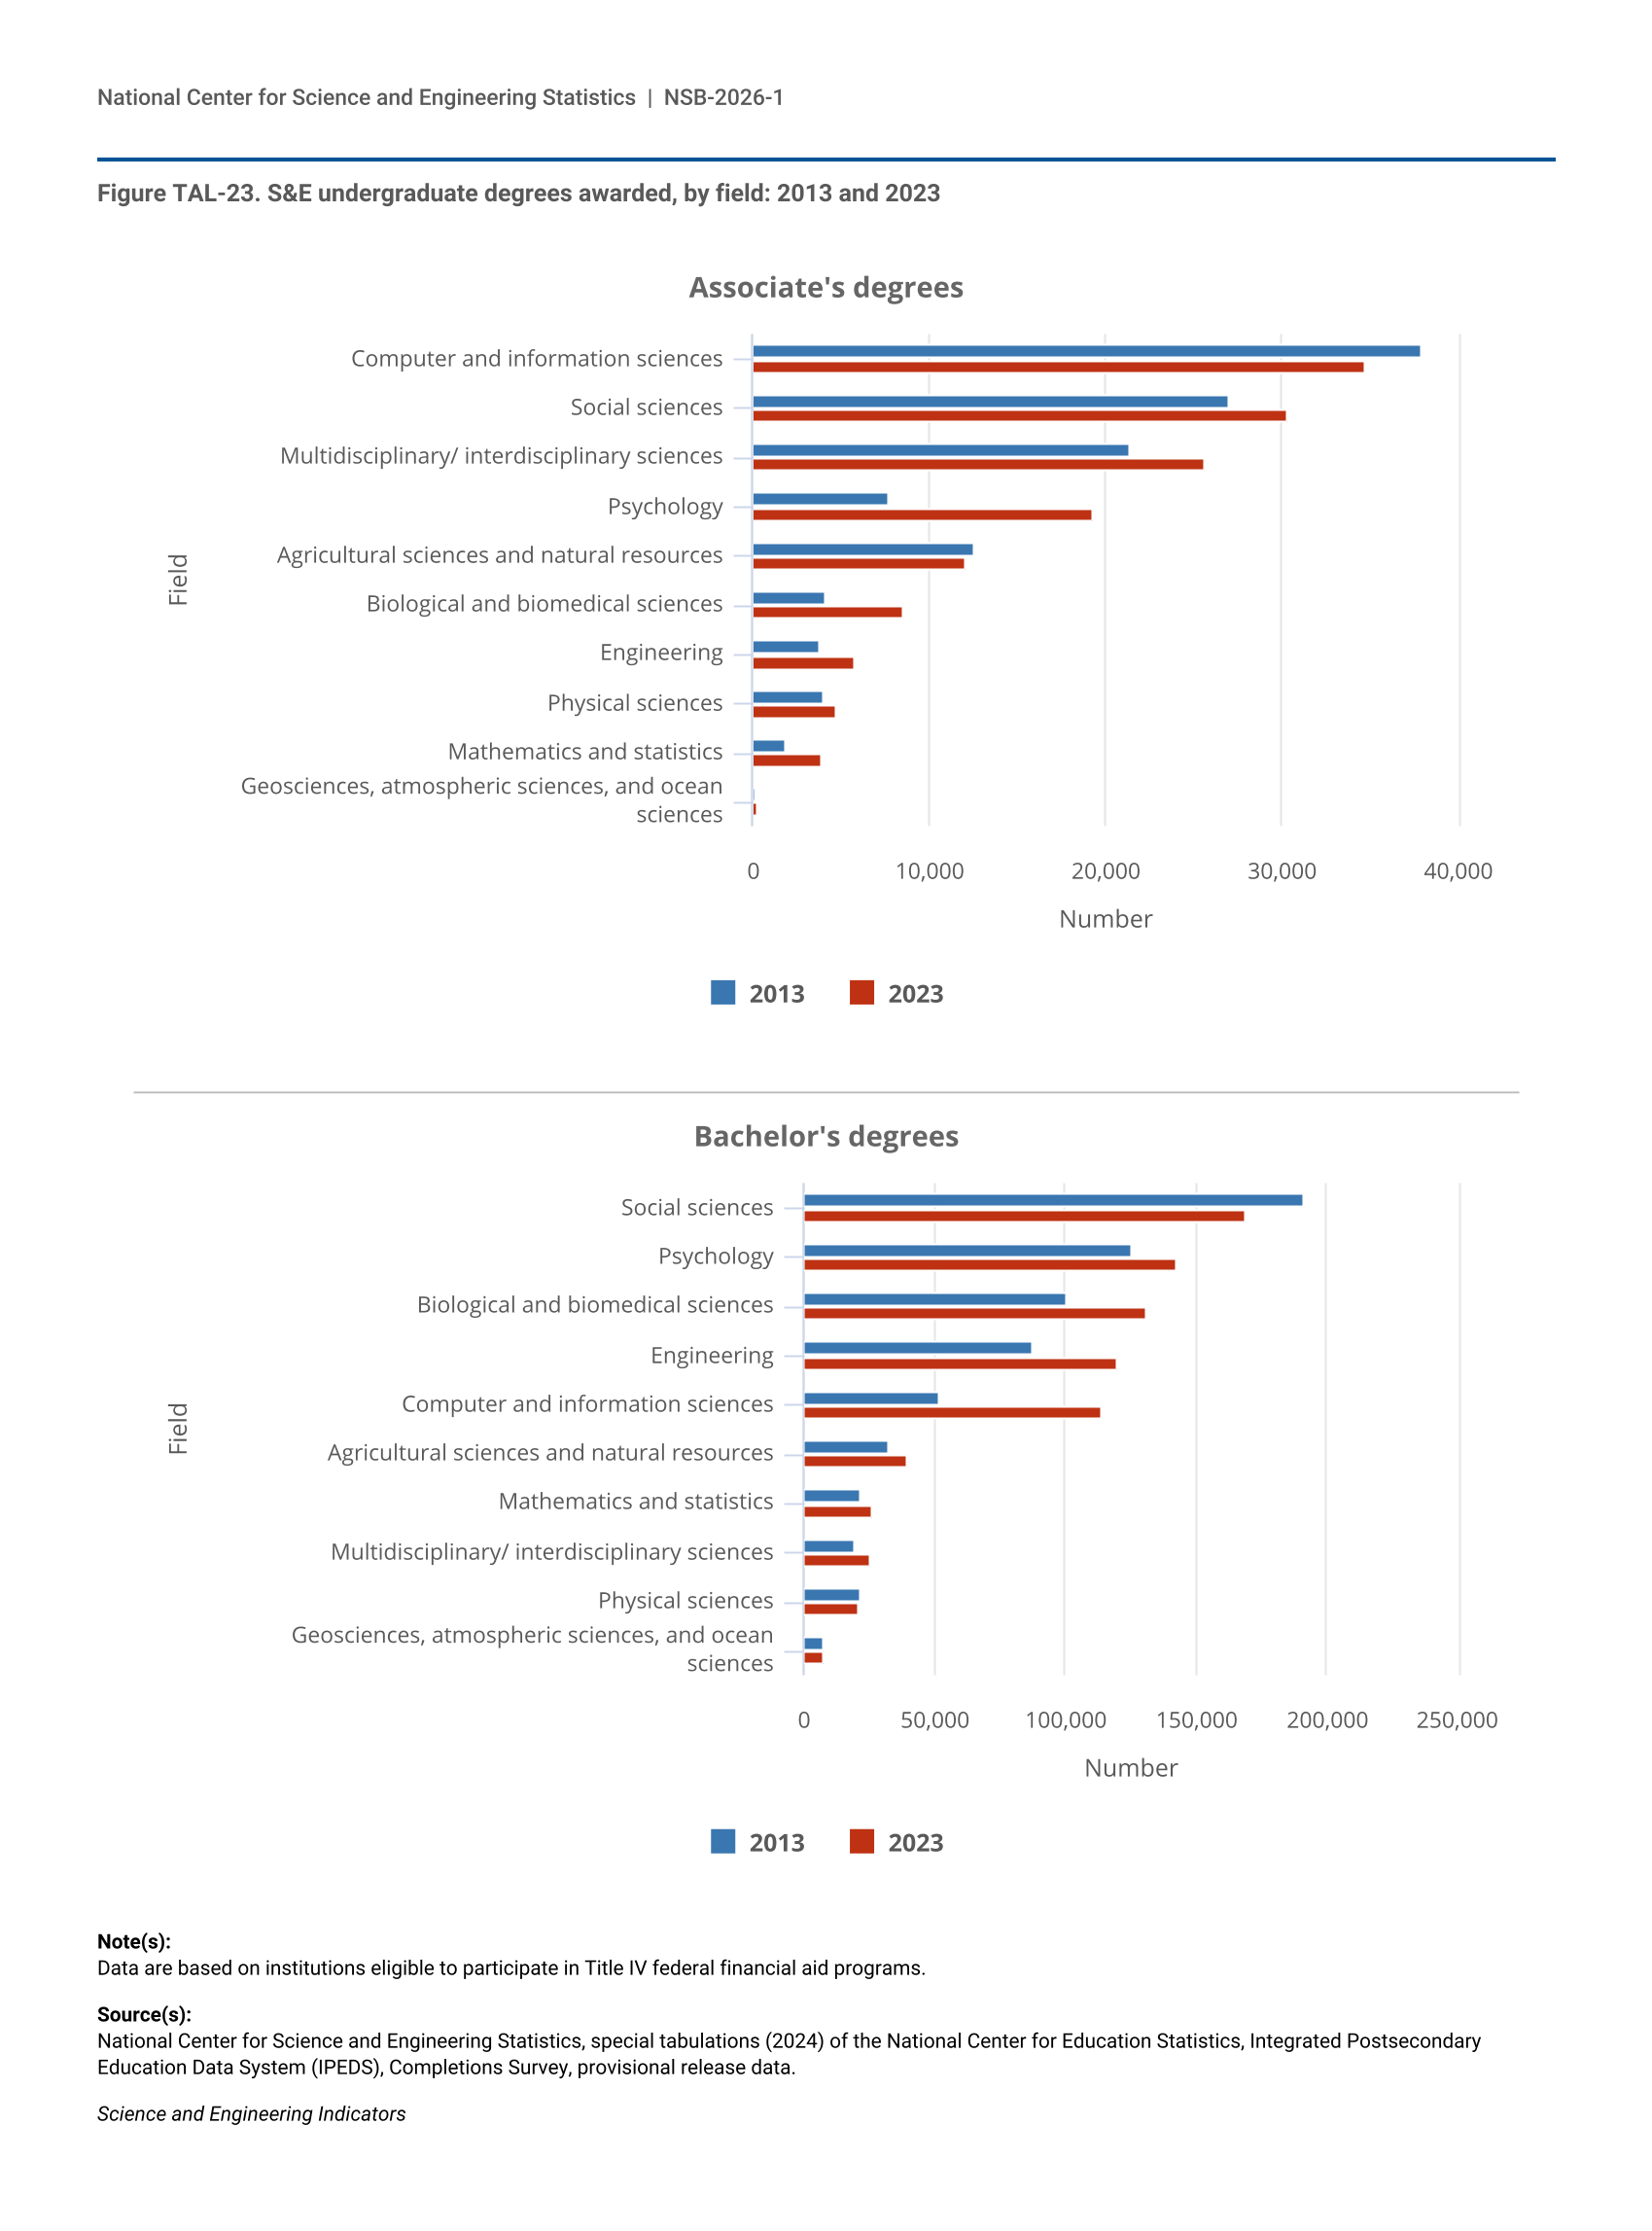
Figure TAL-23.
S&E undergraduate degrees awarded, by field: 2013 and 2023
S&E undergraduate degrees awarded, by field: 2013 and 2023
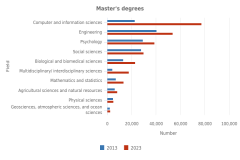
Figure TAL-24.
S&E graduate degrees awarded, by field: 2013 and 2023
S&E graduate degrees awarded, by field: 2013 and 2023
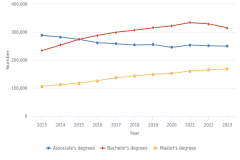
Figure TAL-25.
S&E-related awards conferred, by award level: 2013–23
S&E-related awards conferred, by award level: 2013–23
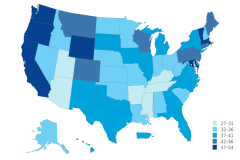
Figure TAL-26.
Share of bachelor's degrees awarded in S&E fields, by state: 2023
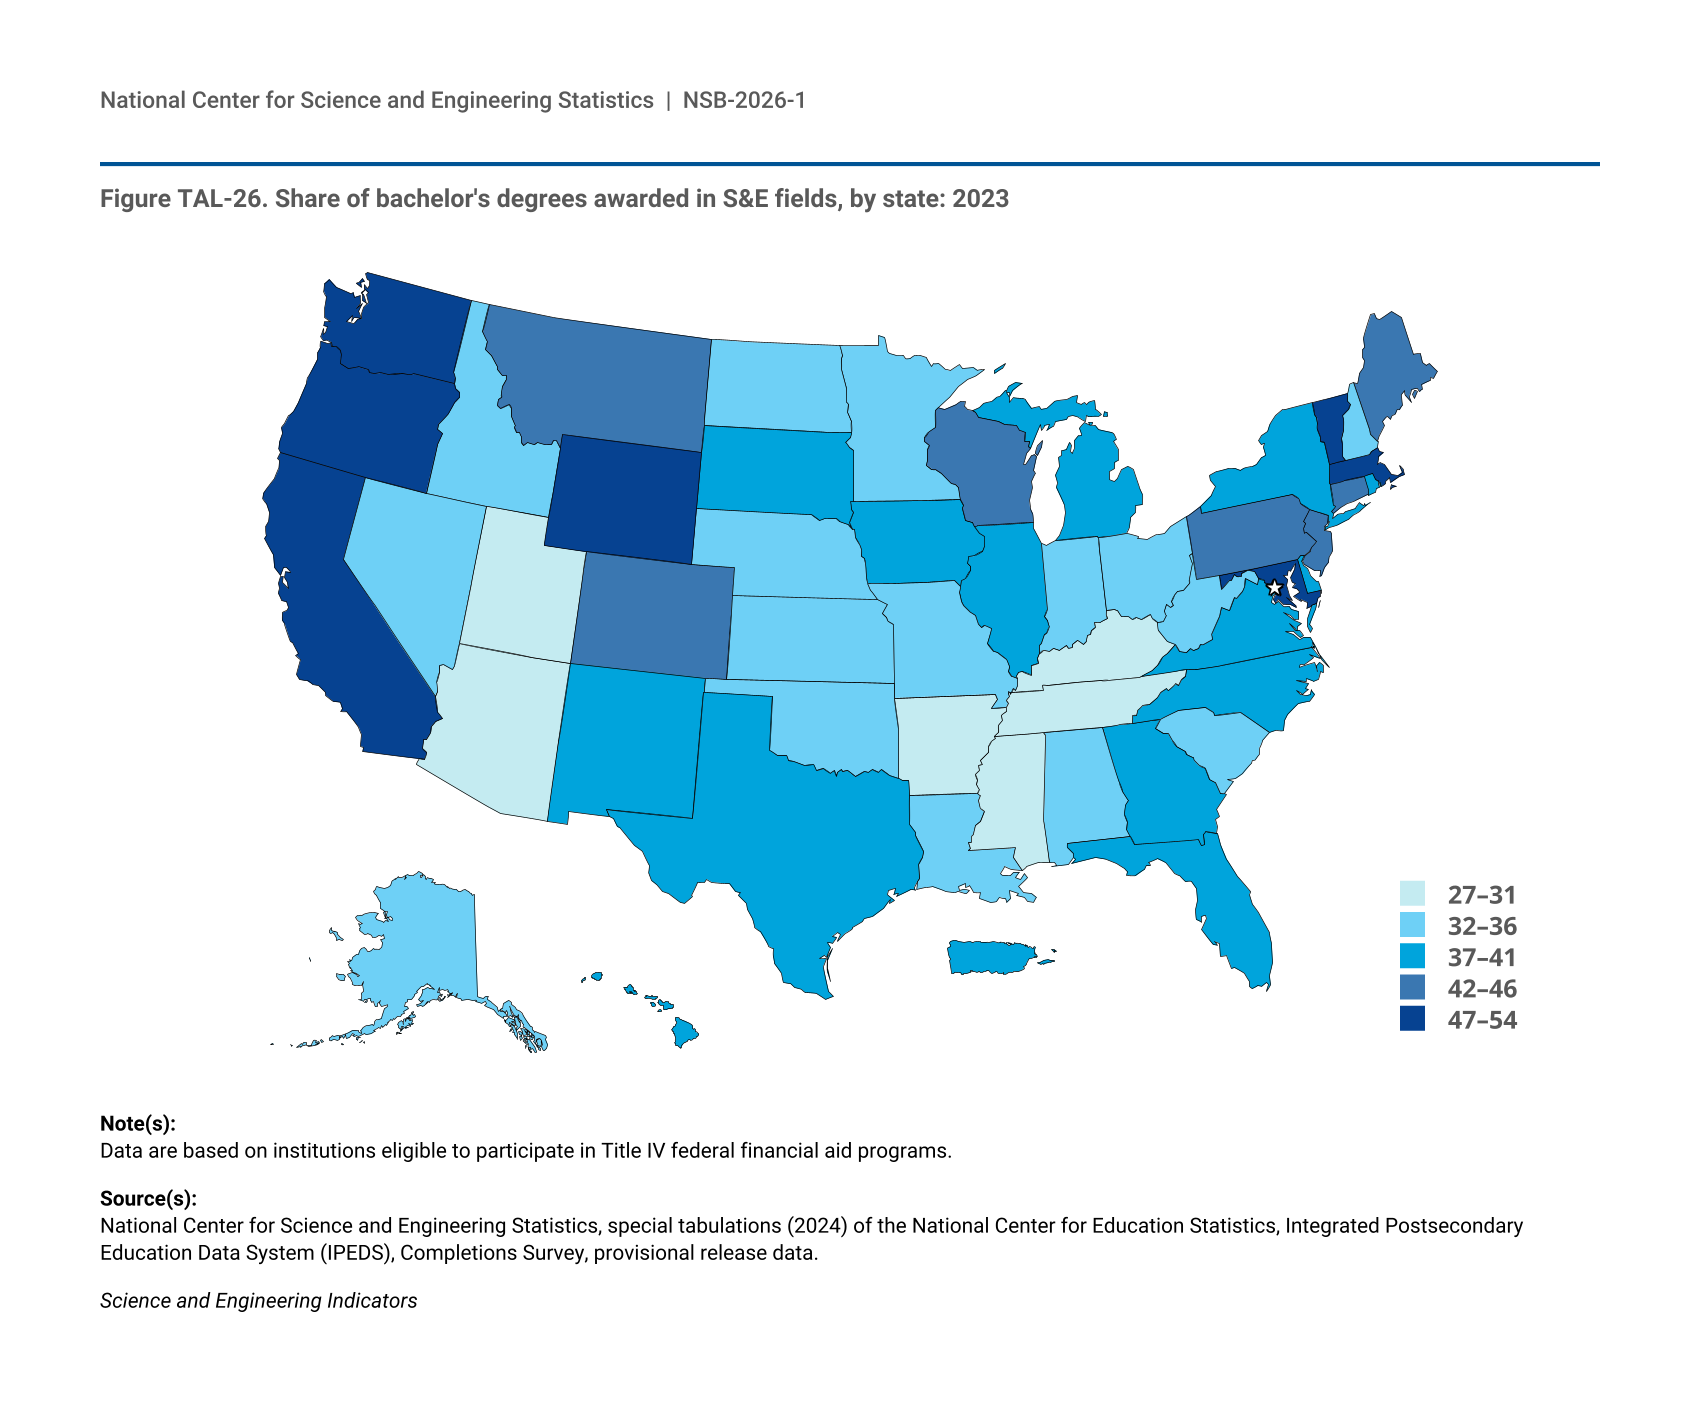
Share of bachelor's degrees awarded in S&E fields, by state: 2023
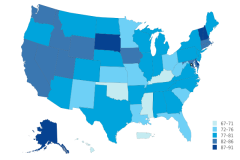
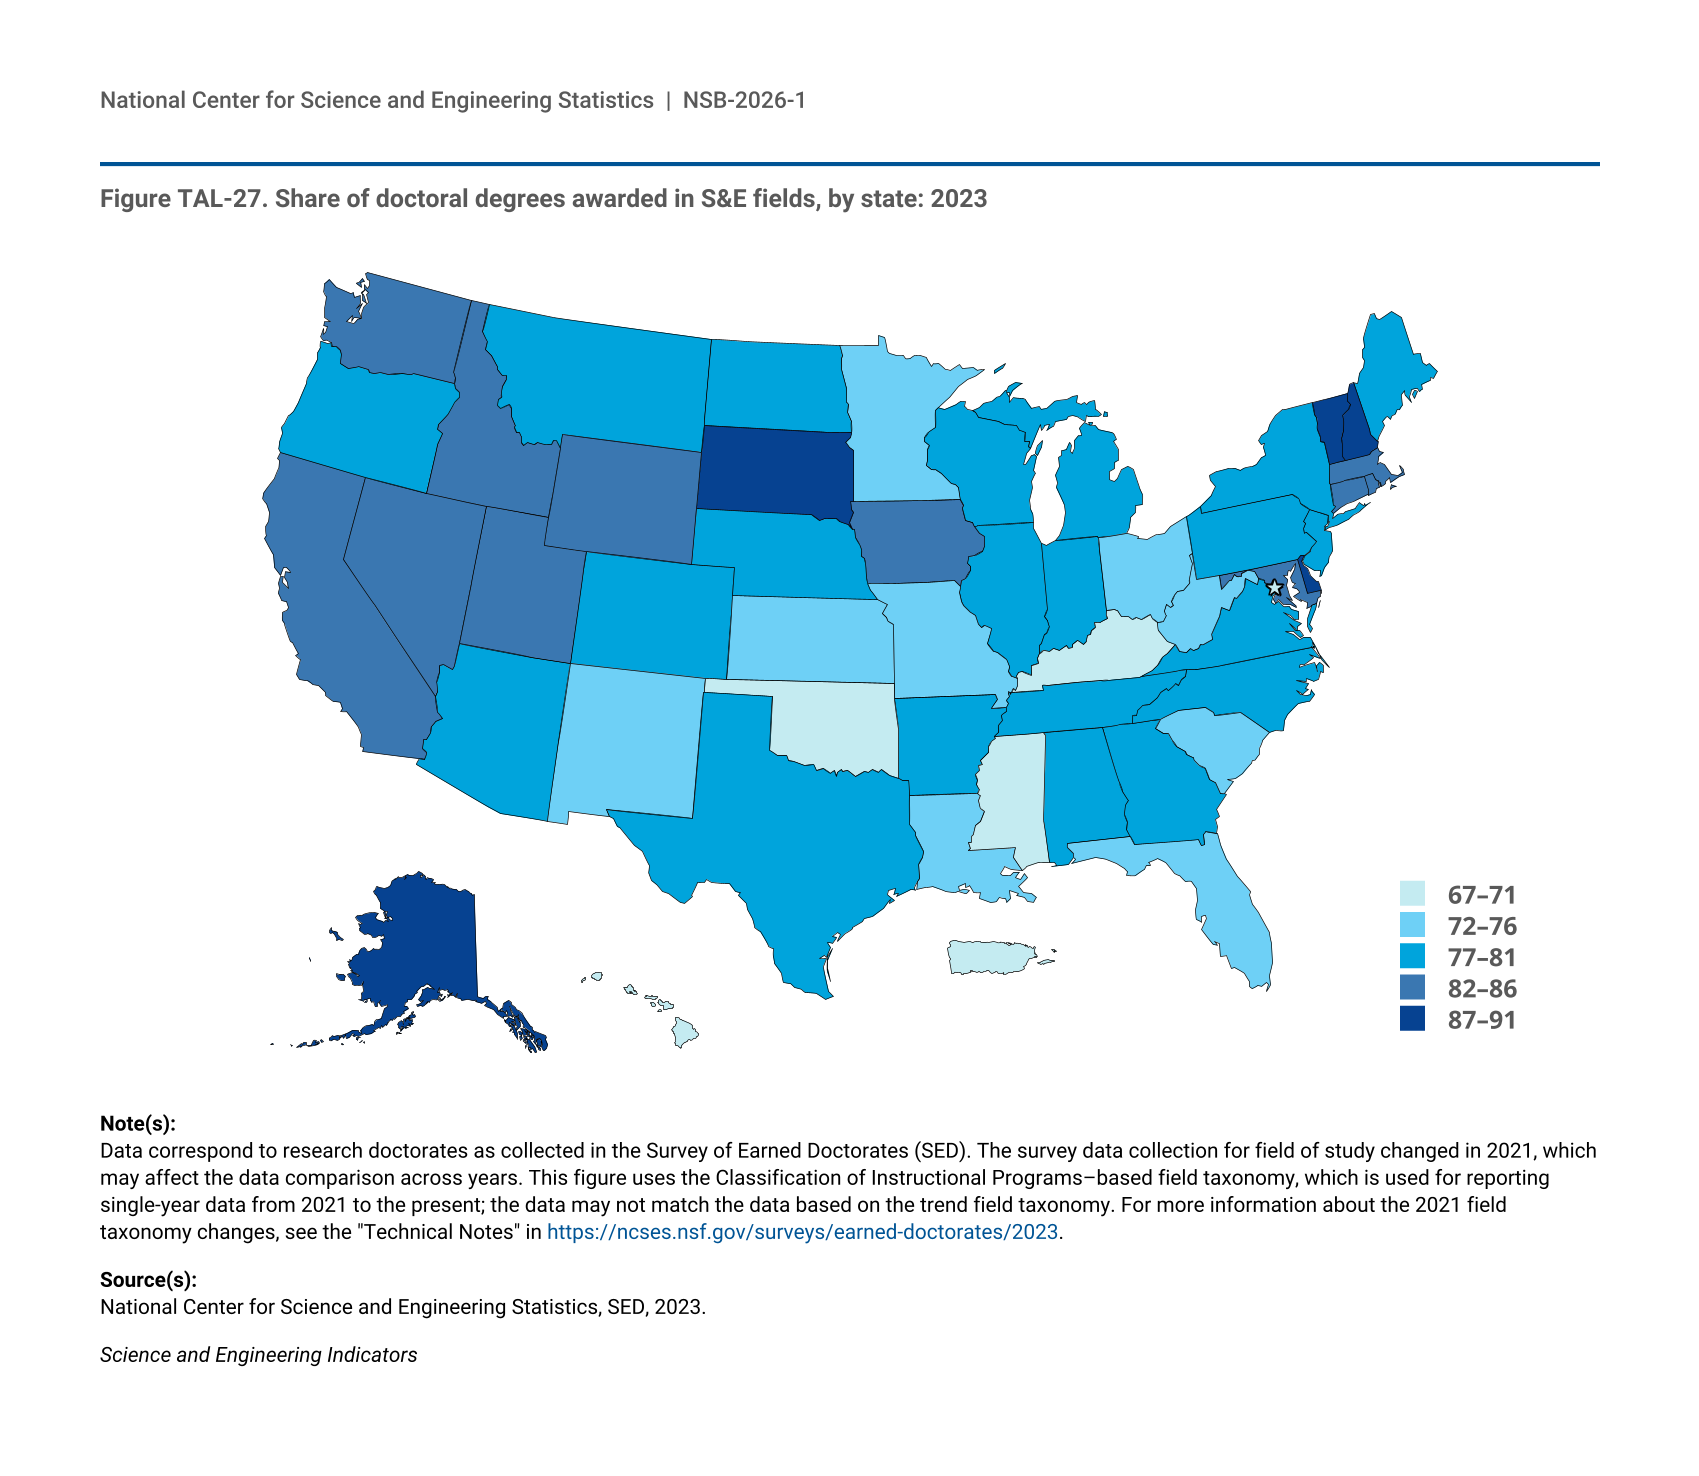
Figure TAL-27.
Share of doctoral degrees awarded in S&E fields, by state: 2023
Share of doctoral degrees awarded in S&E fields, by state: 2023
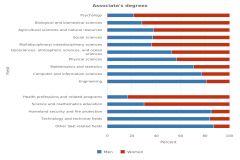
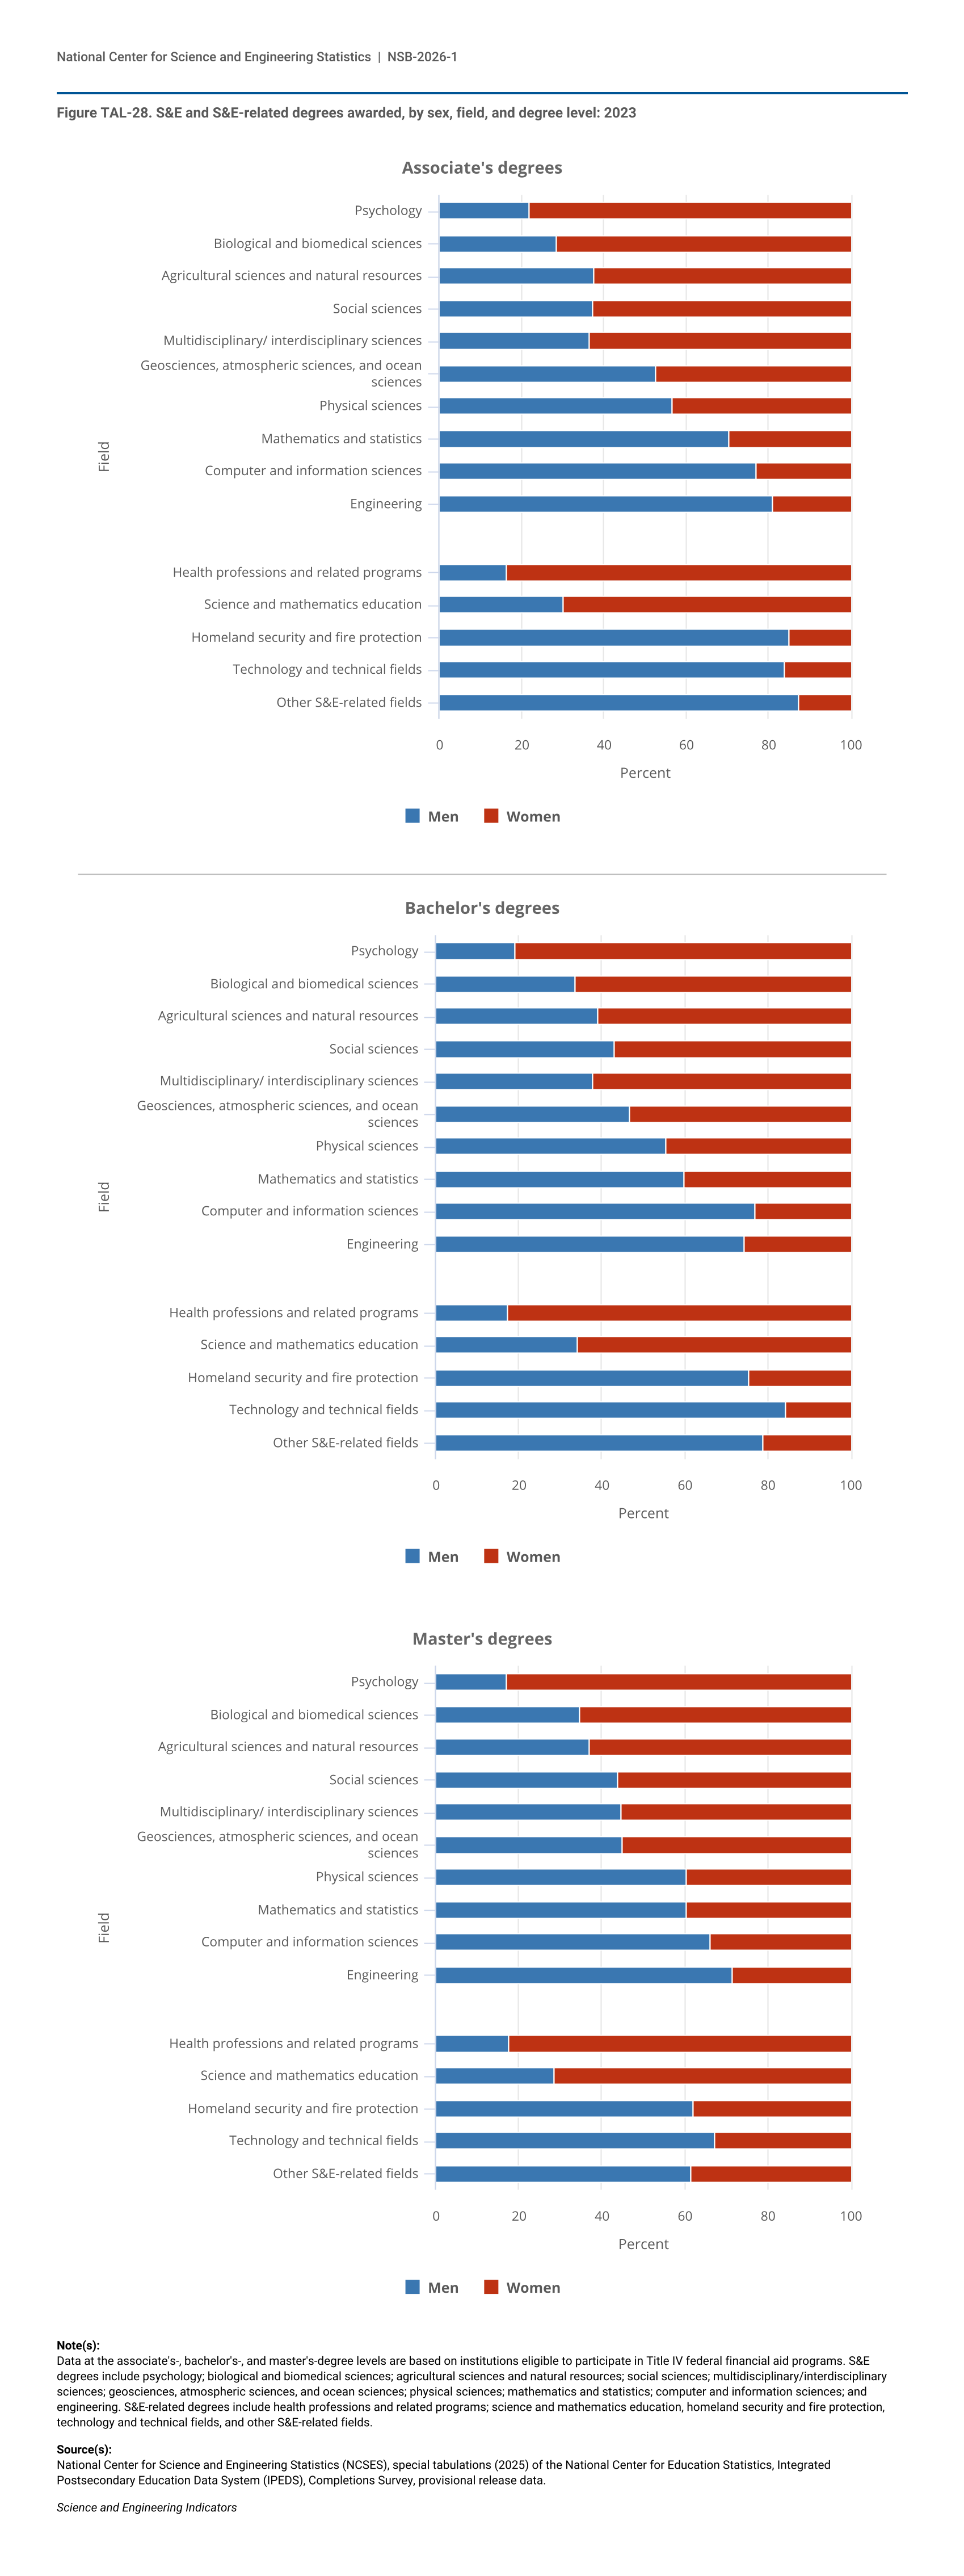
Figure TAL-28.
S&E and S&E-related degrees awarded, by sex, field, and degree level: 2023
S&E and S&E-related degrees awarded, by sex, field, and degree level: 2023
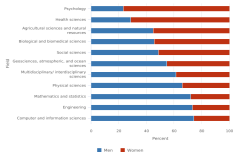
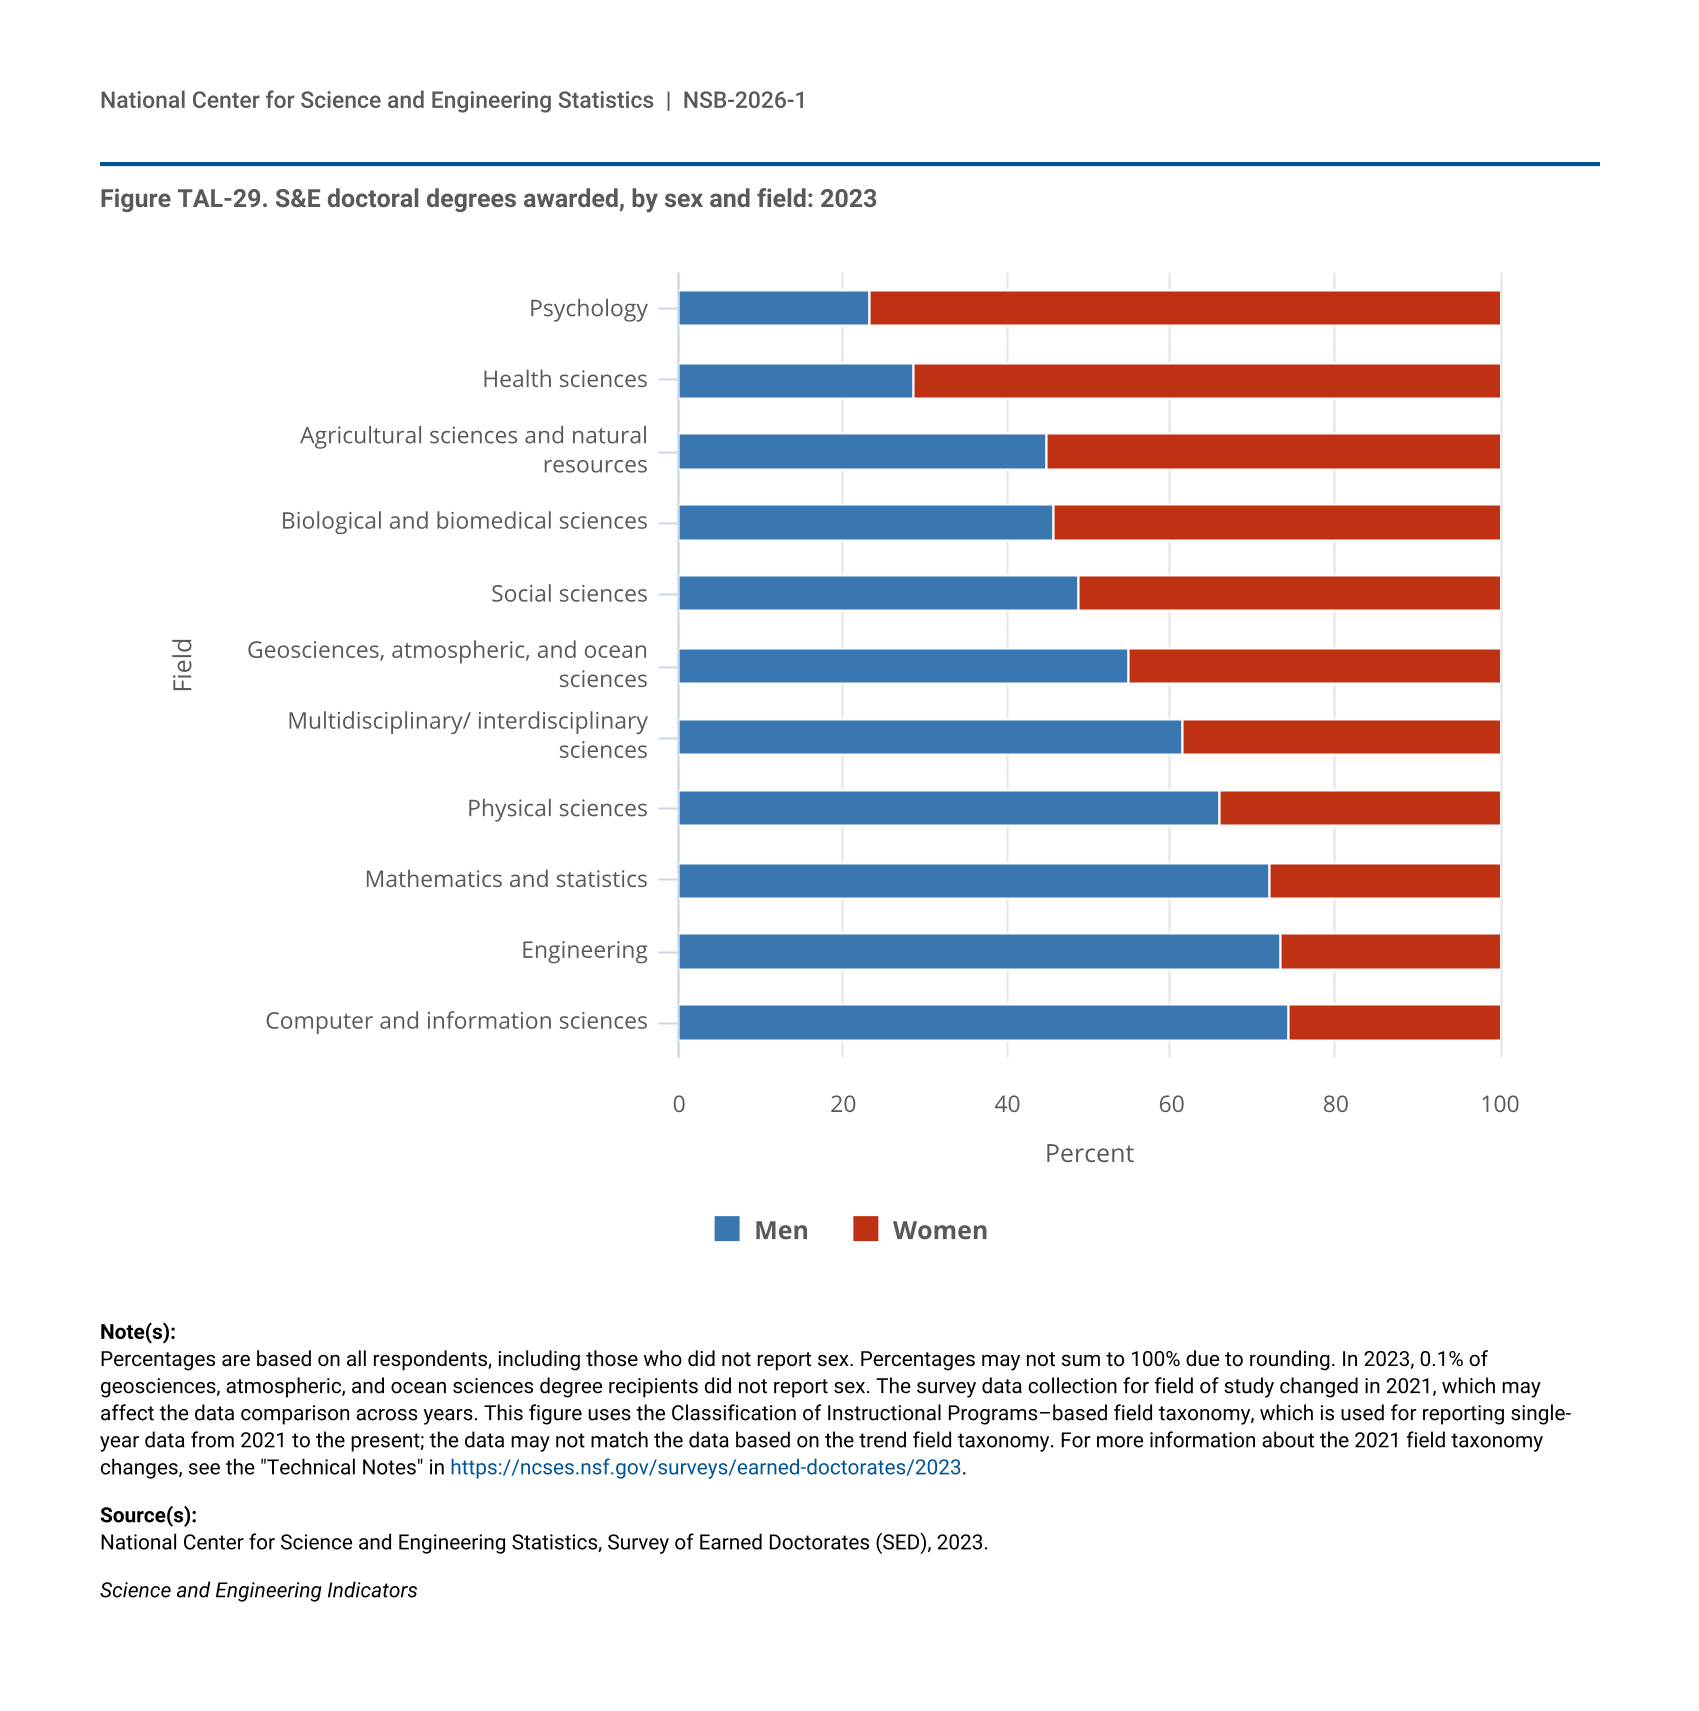
Figure TAL-29.
S&E doctoral degrees awarded, by sex and field: 2023
S&E doctoral degrees awarded, by sex and field: 2023
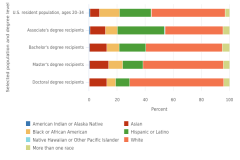
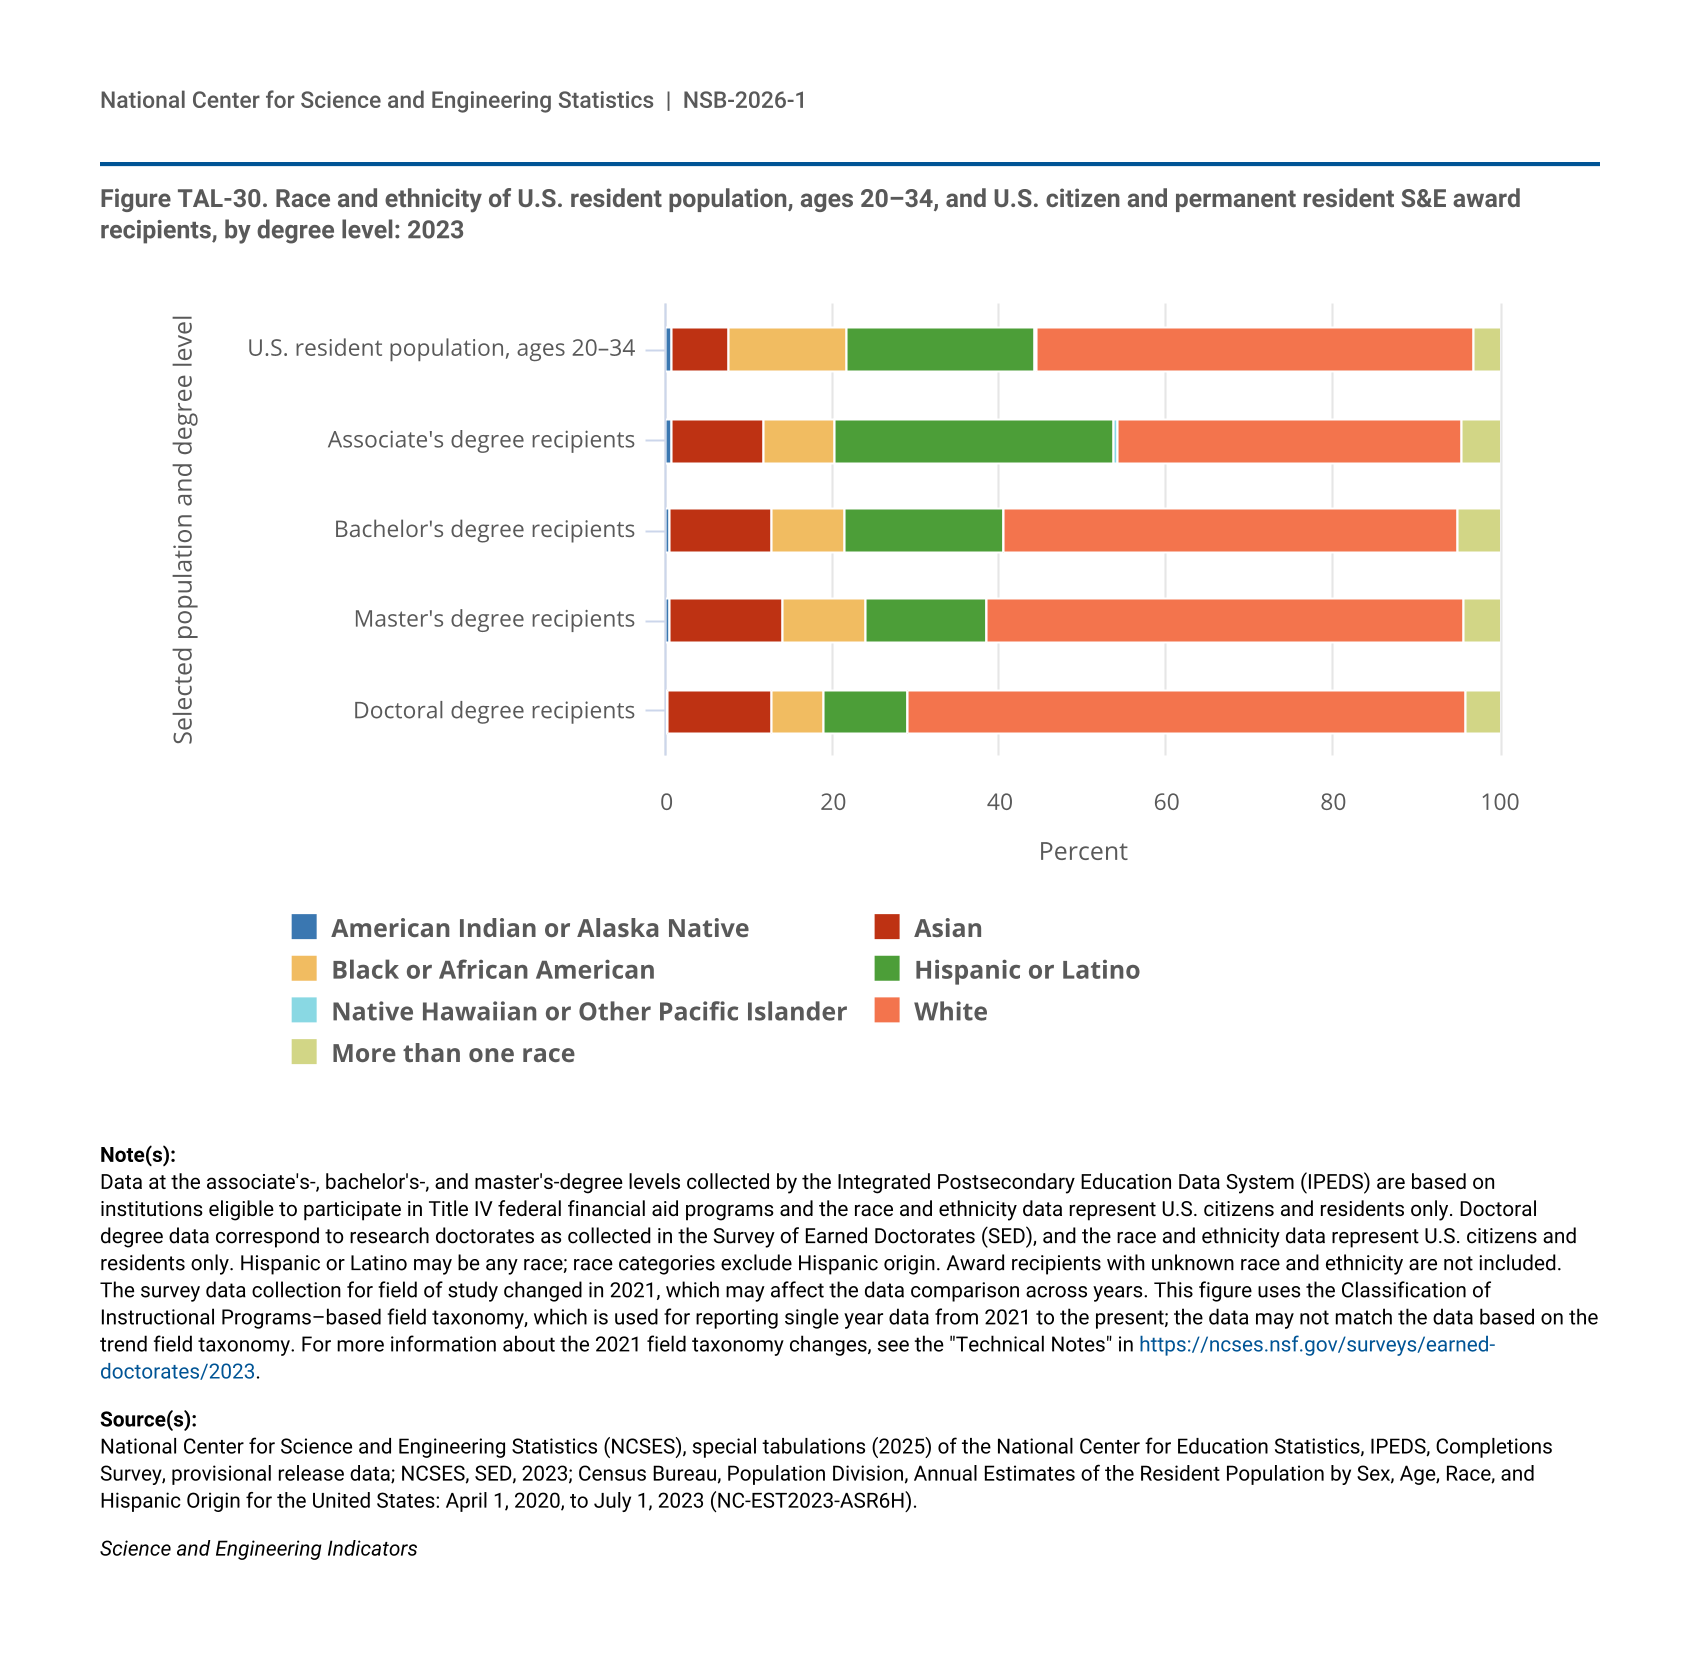
Figure TAL-30.
Race and ethnicity of U.S. resident population, ages 20–34, and U.S. citizen and permanent resident S&E award recipients, by degree level: 2023
Race and ethnicity of U.S. resident population, ages 20–34, and U.S. citizen and permanent resident S&E award recipients, by degree level: 2023
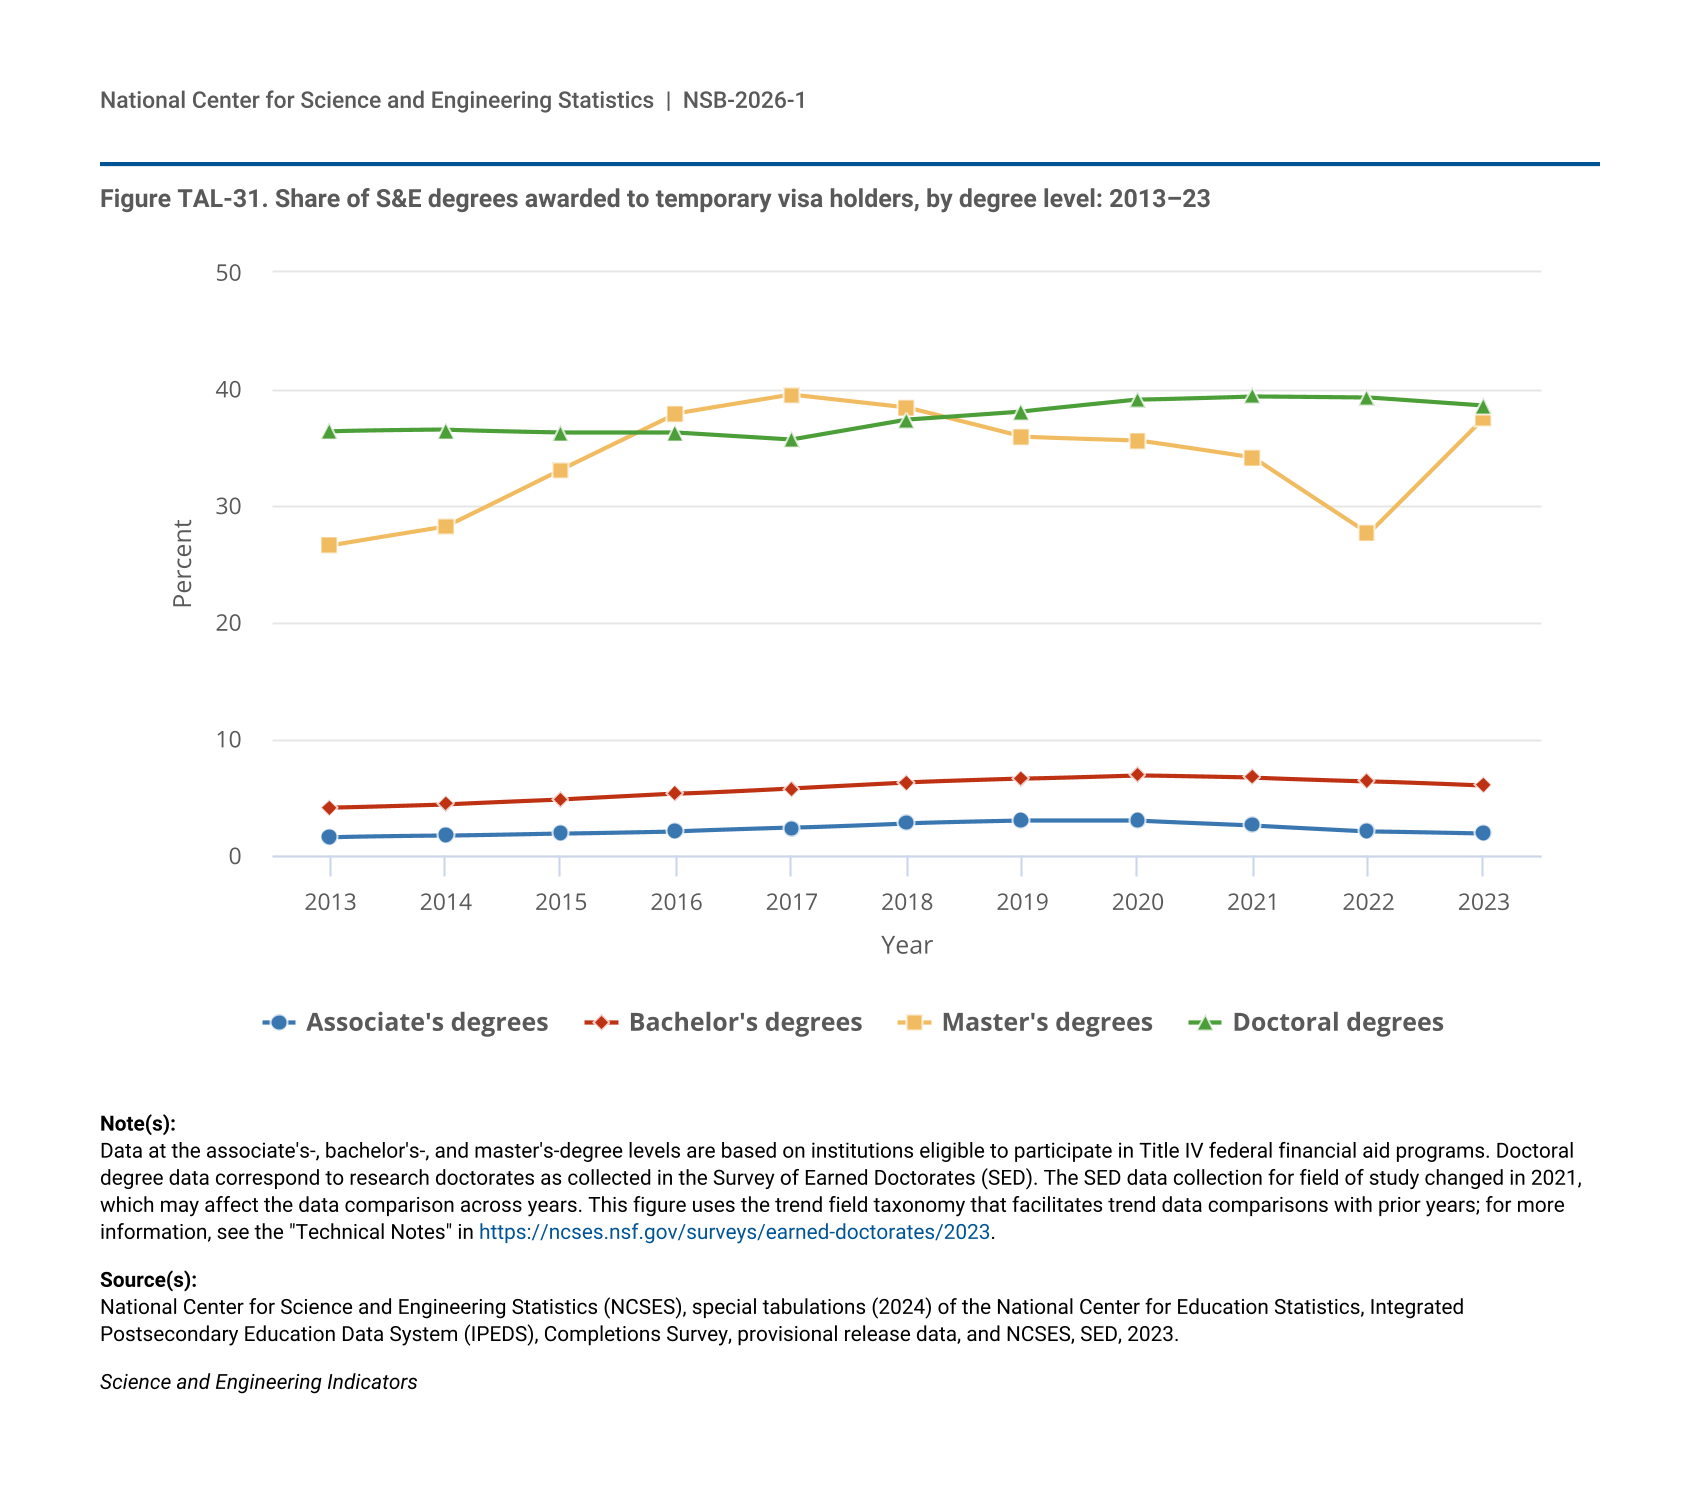
Figure TAL-31.
Share of S&E degrees awarded to temporary visa holders, by degree level: 2013–23
Share of S&E degrees awarded to temporary visa holders, by degree level: 2013–23
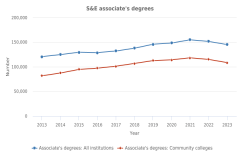
Figure TAL-32.
S&E and S&E-related associate's degrees awarded, by institution type: 2013–23
S&E and S&E-related associate's degrees awarded, by institution type: 2013–23
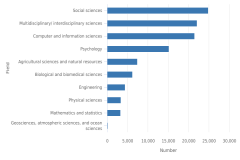
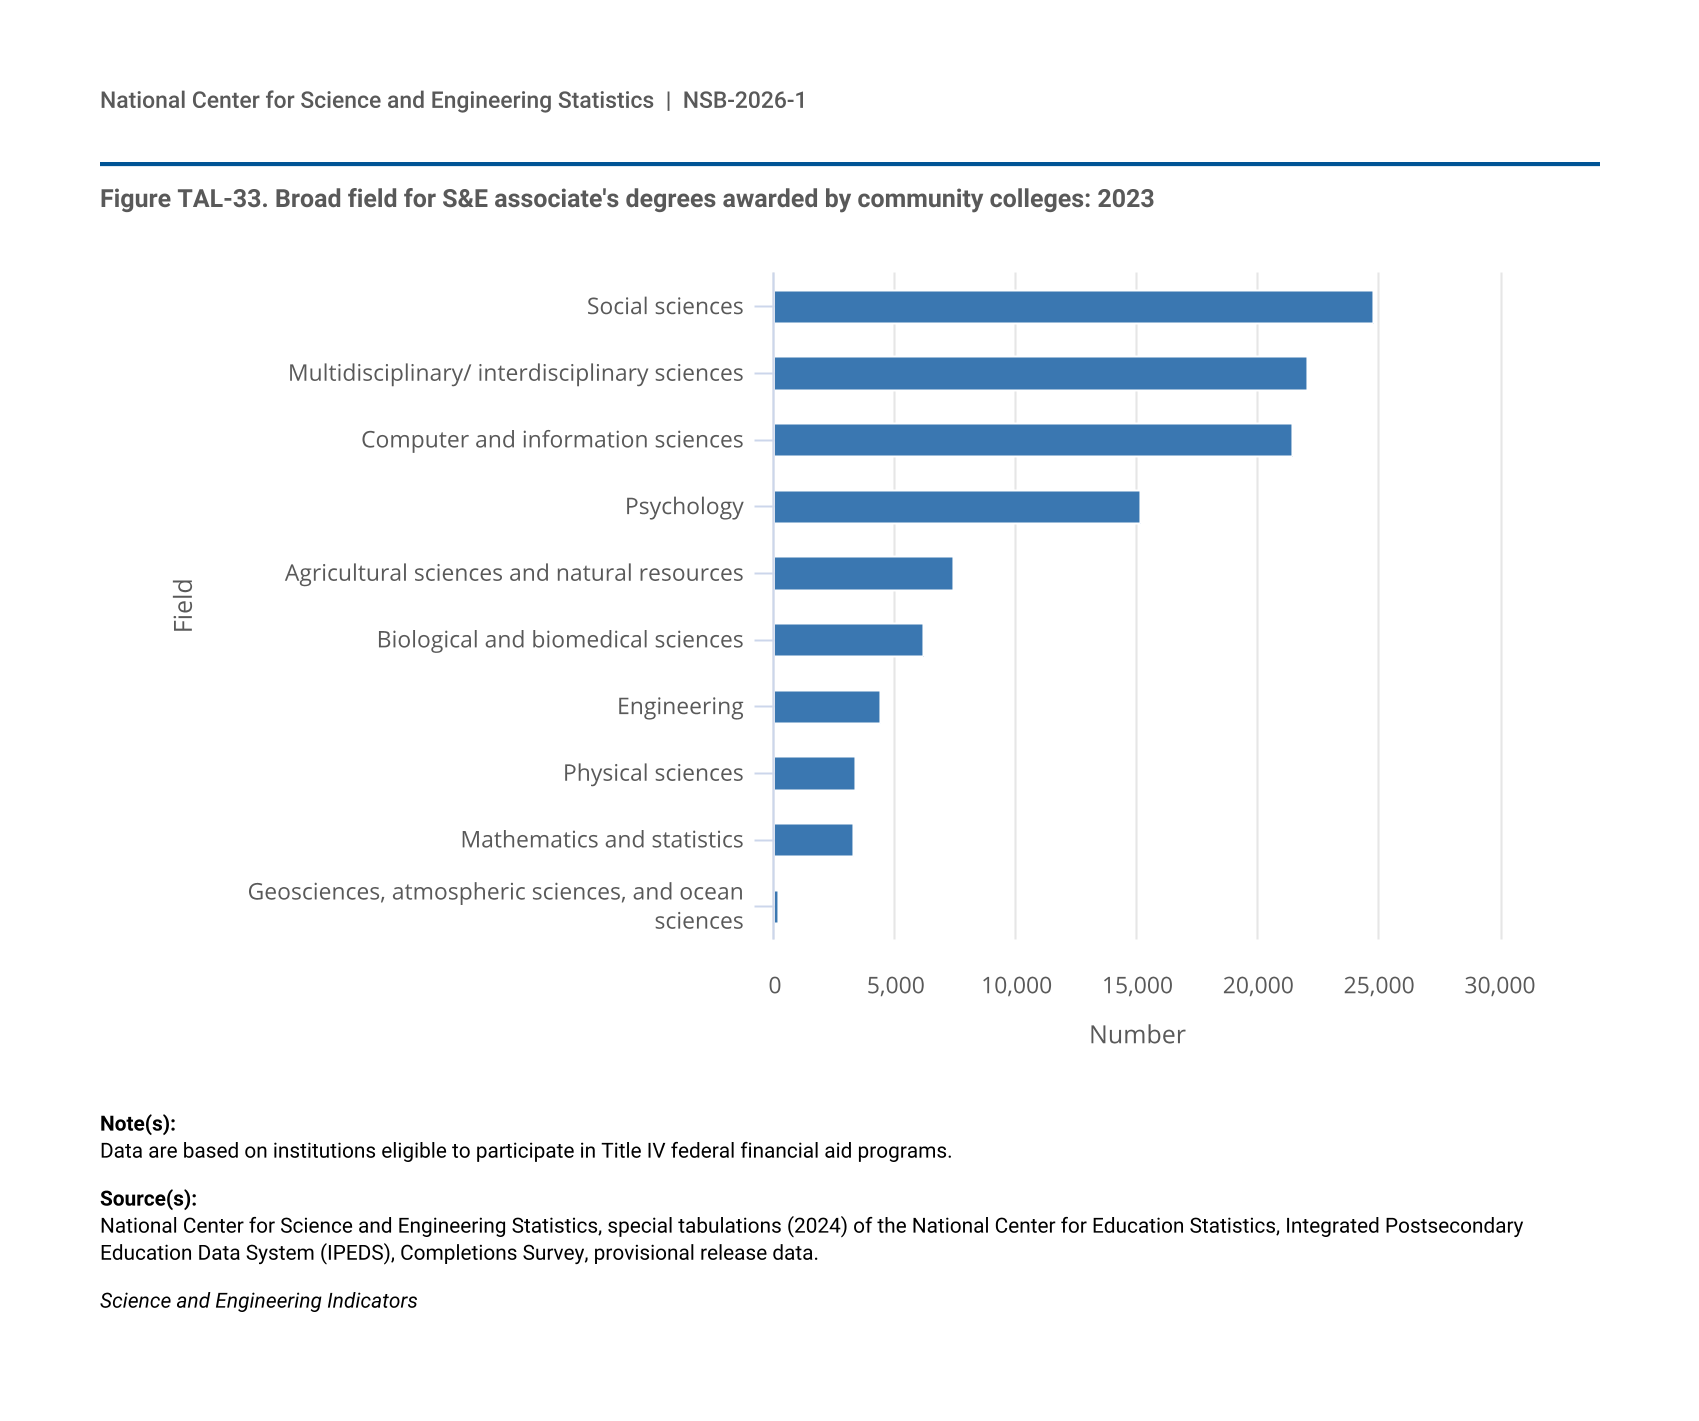
Figure TAL-33.
Broad field for S&E associate's degrees awarded by community colleges: 2023
Broad field for S&E associate's degrees awarded by community colleges: 2023
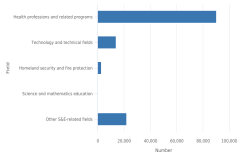
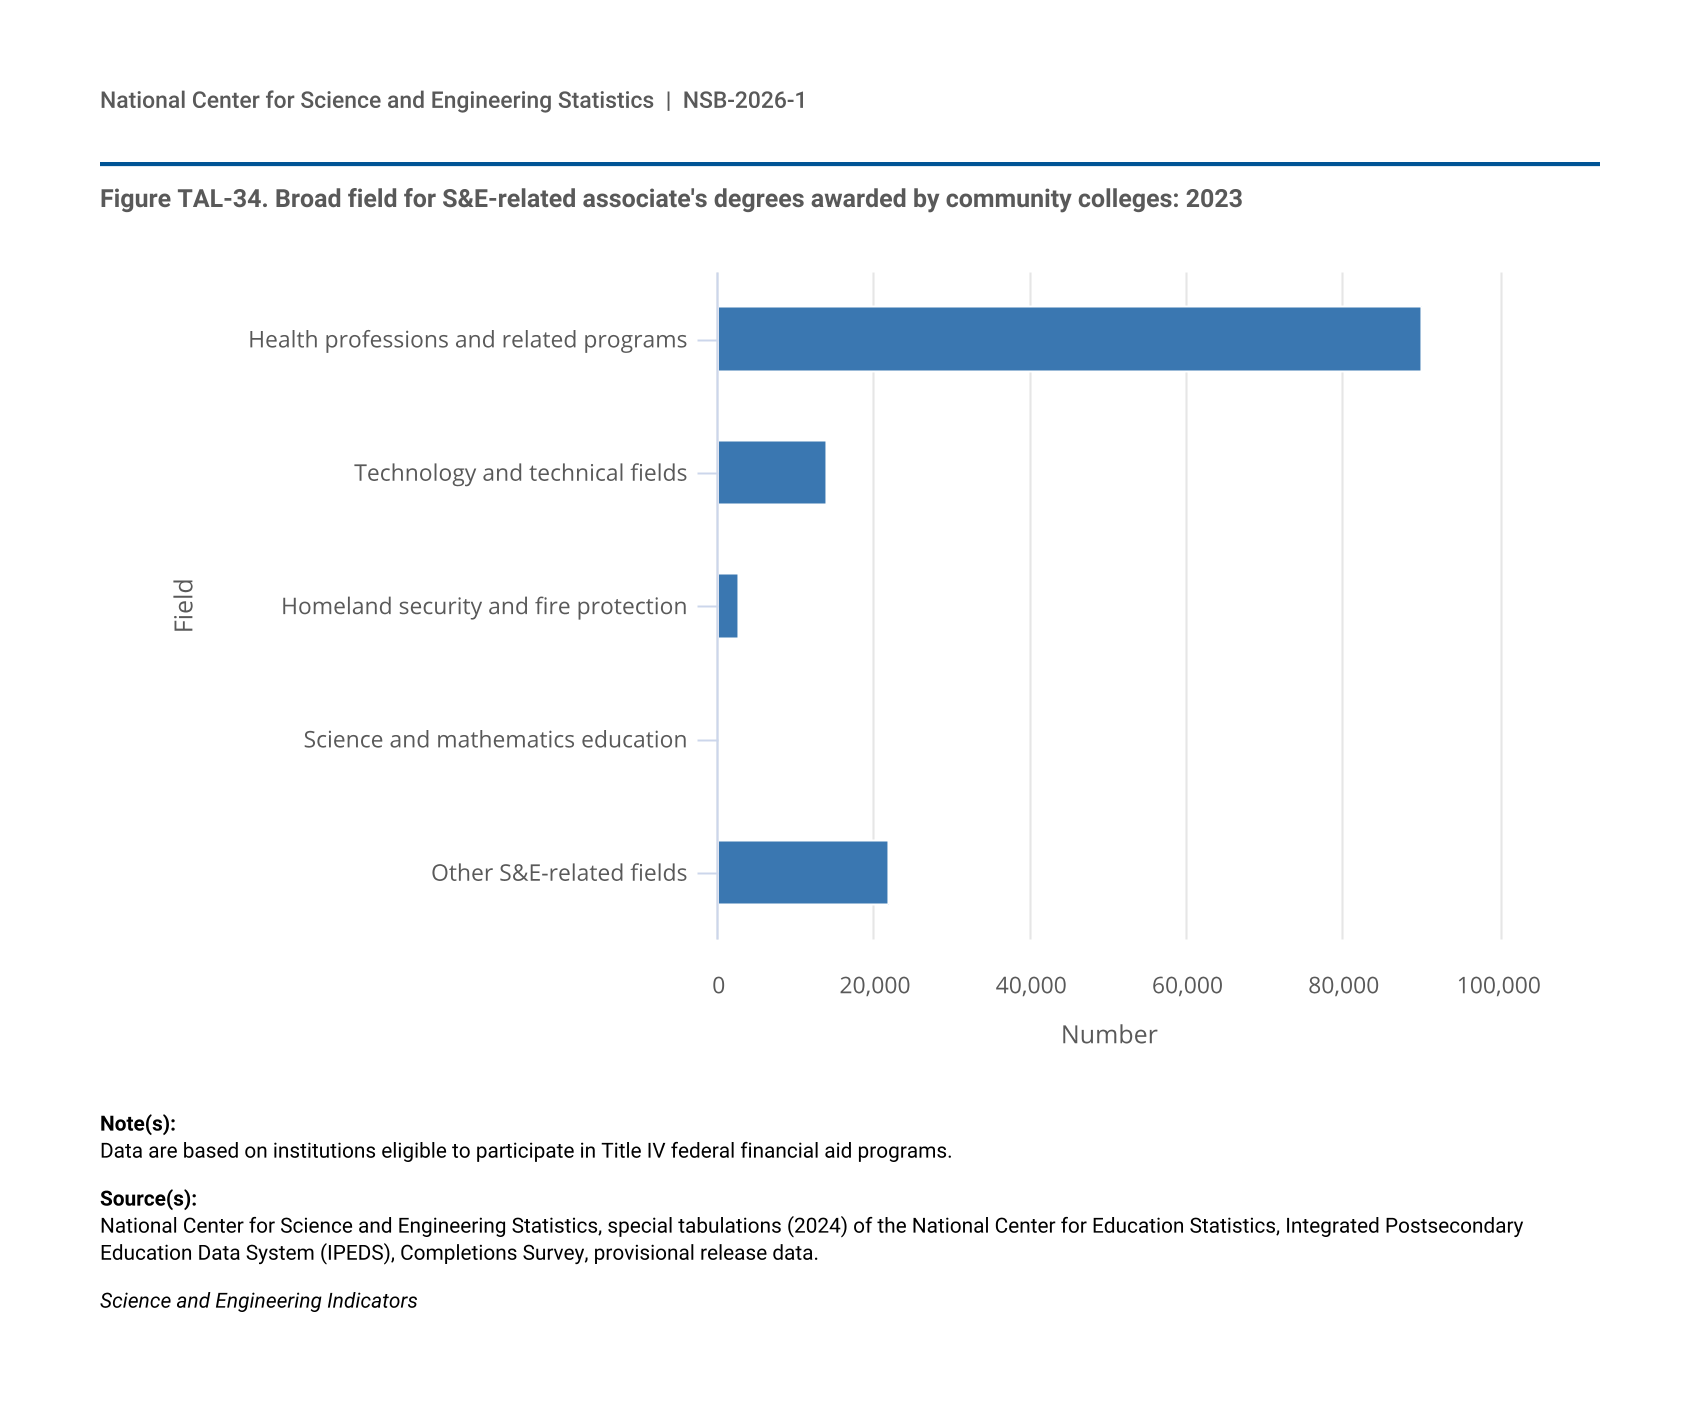
Figure TAL-34.
Broad field for S&E-related associate's degrees awarded by community colleges: 2023
Broad field for S&E-related associate's degrees awarded by community colleges: 2023
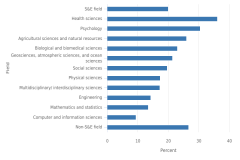
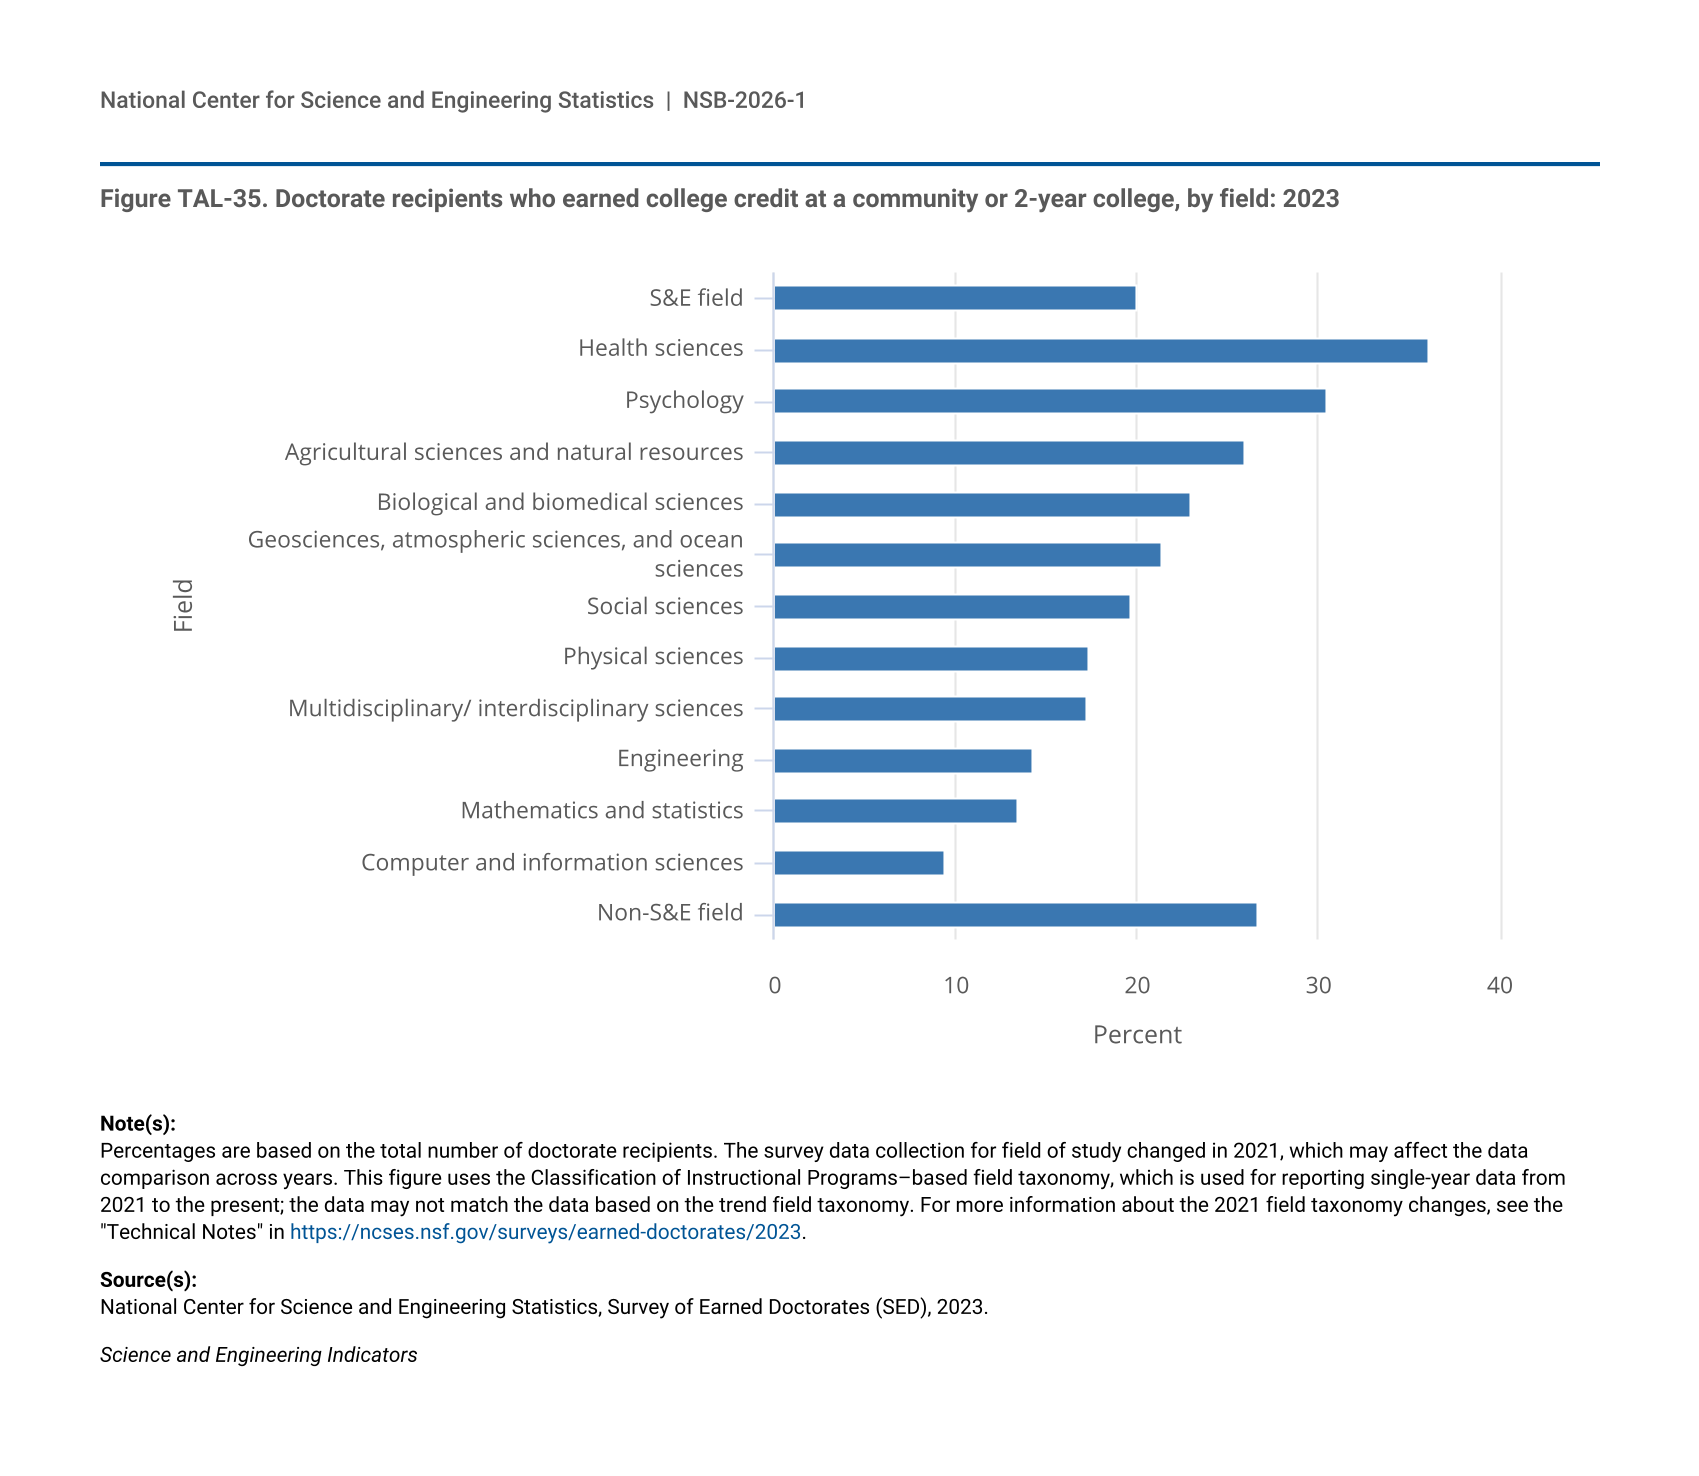
Figure TAL-35.
Doctorate recipients who earned college credit at a community or 2-year college, by field: 2023
Doctorate recipients who earned college credit at a community or 2-year college, by field: 2023
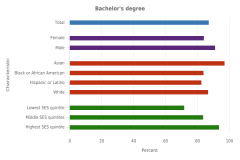
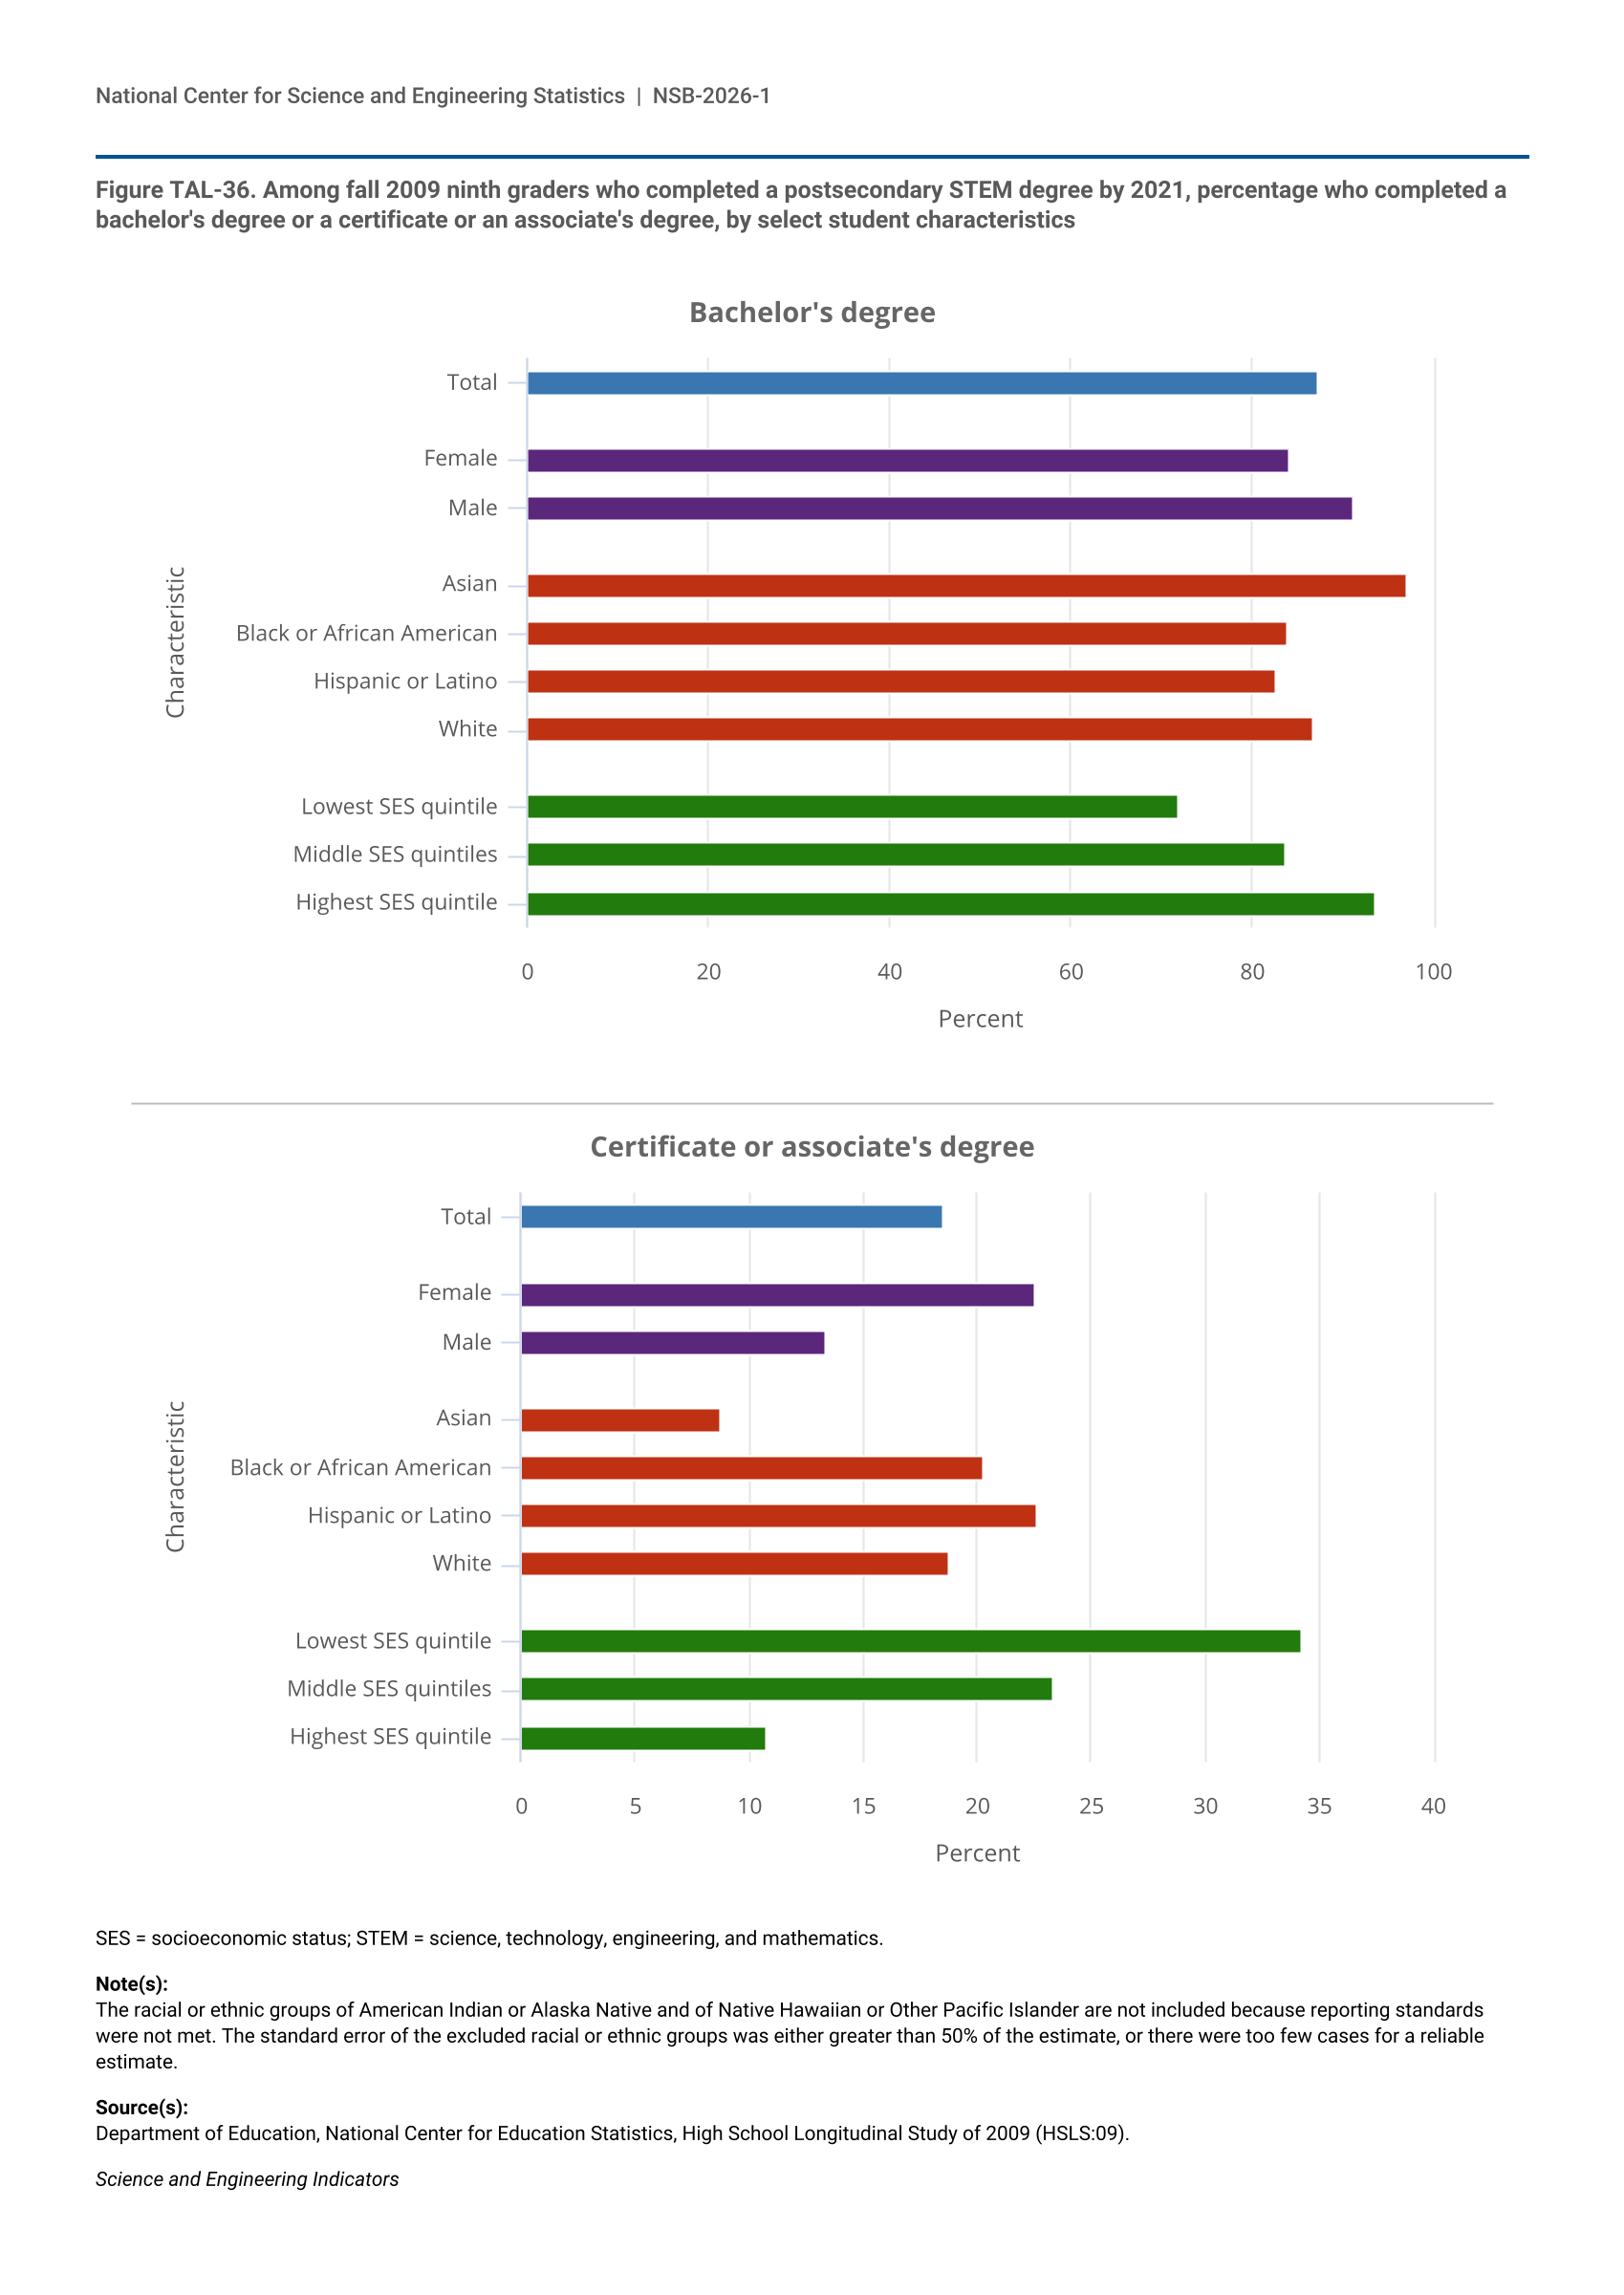
Figure TAL-36.
Among fall 2009 ninth graders who completed a postsecondary STEM degree by 2021, percentage who completed a bachelor's degree or a certificate or an associate's degree, by select student characteristics
Among fall 2009 ninth graders who completed a postsecondary STEM degree by 2021, percentage who completed a bachelor's degree or a certificate or an associate's degree, by select student characteristics
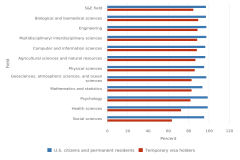
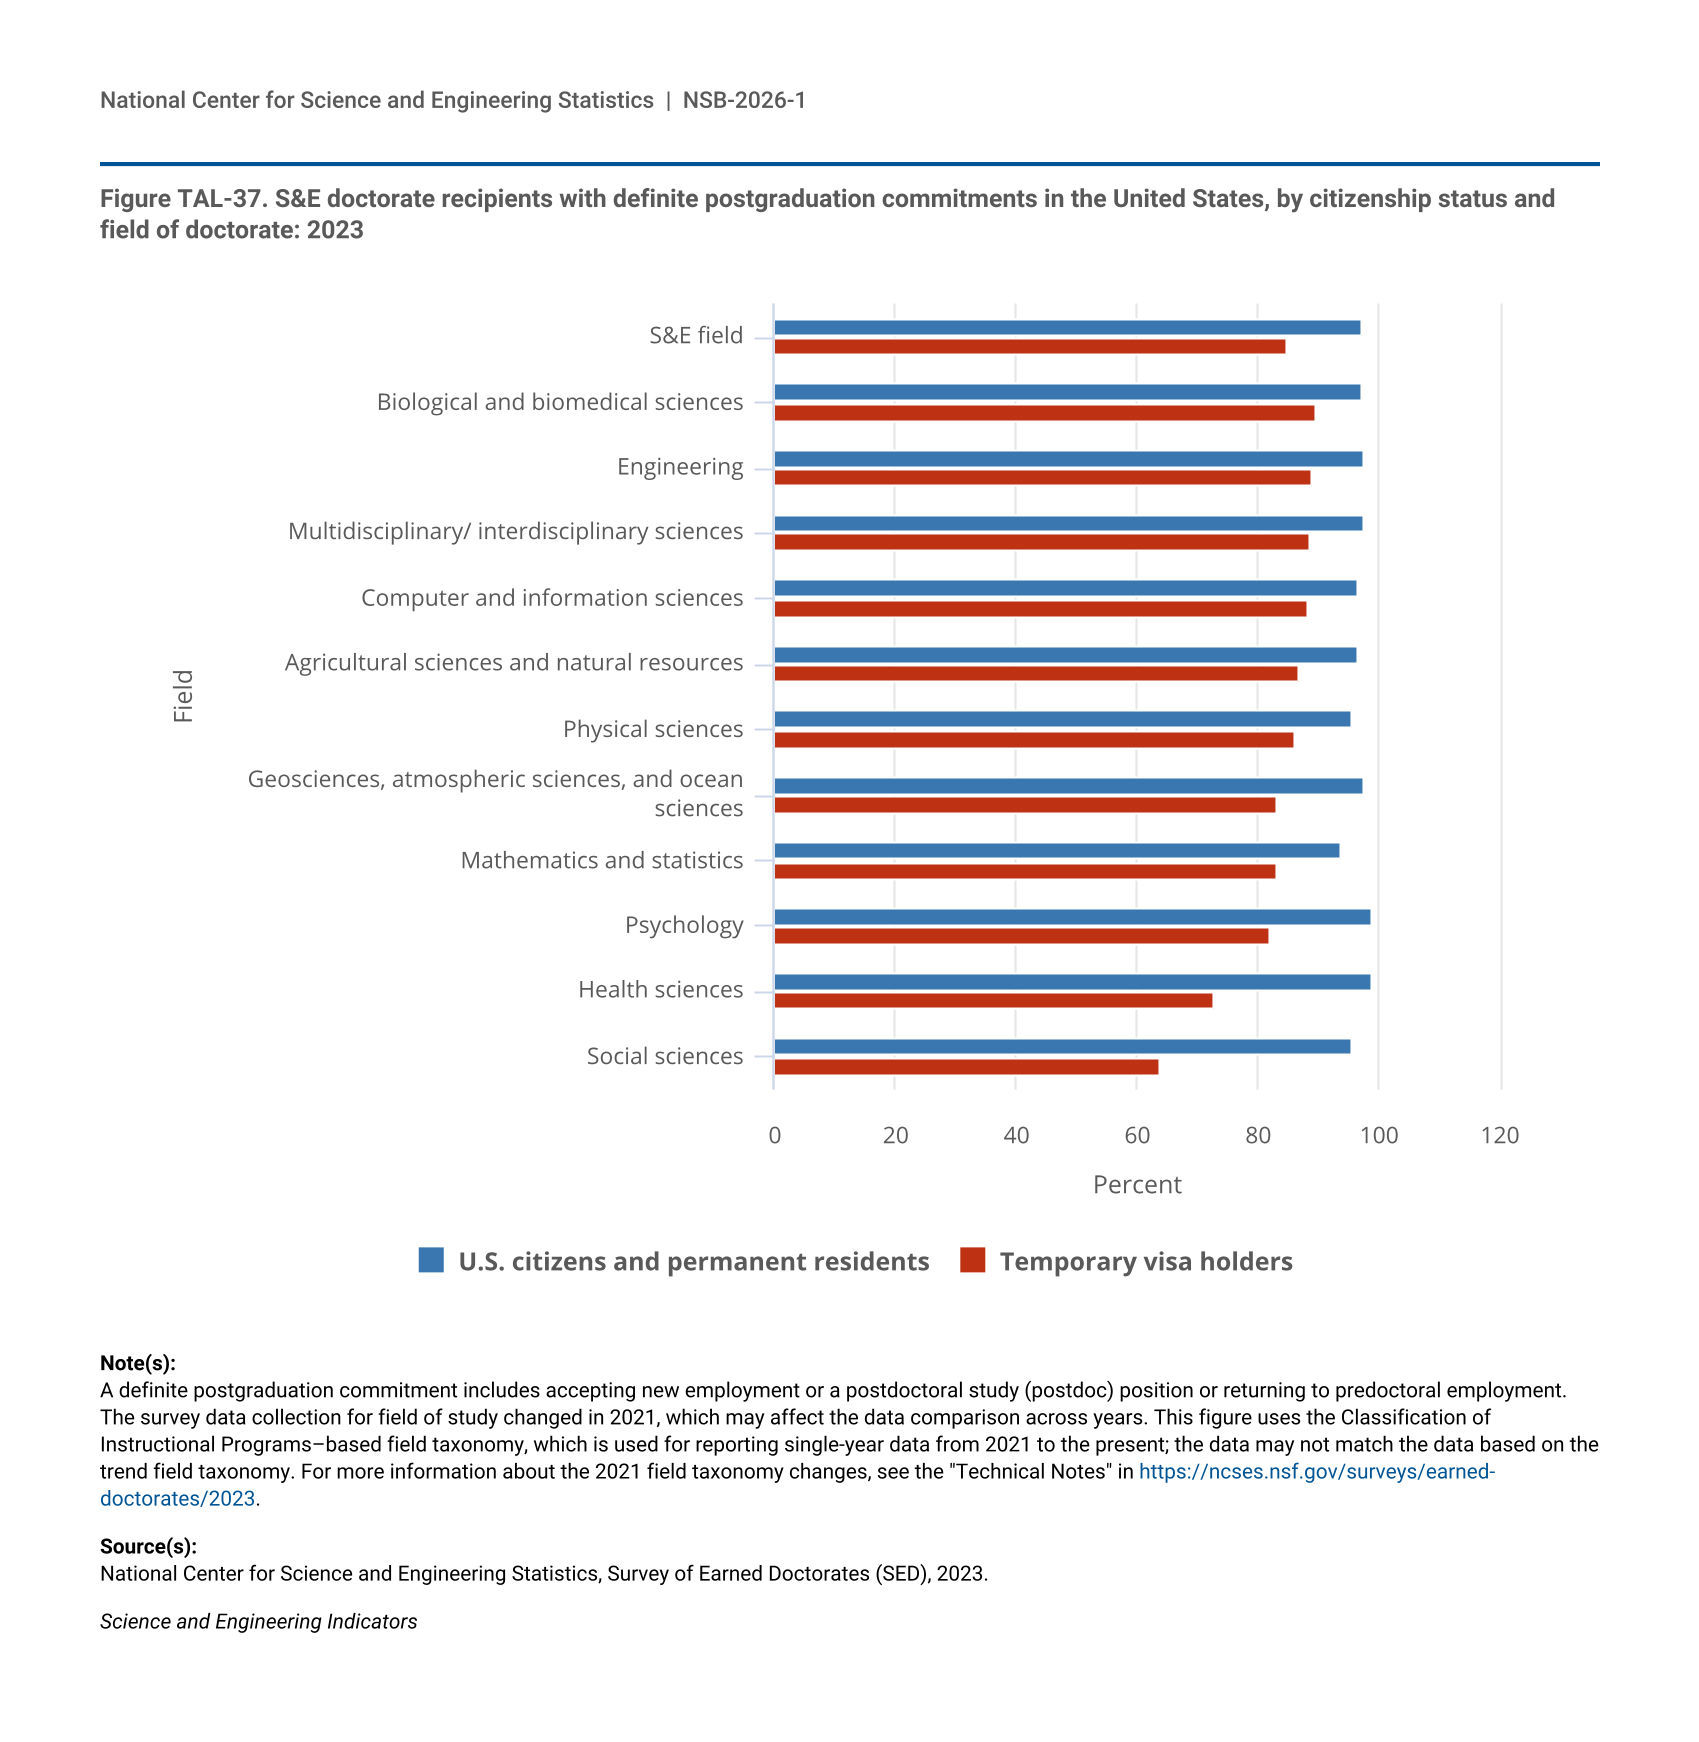
Figure TAL-37.
S&E doctorate recipients with definite postgraduation commitments in the United States, by citizenship status and field of doctorate: 2023
S&E doctorate recipients with definite postgraduation commitments in the United States, by citizenship status and field of doctorate: 2023
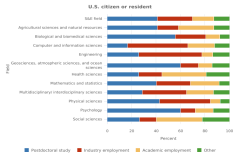
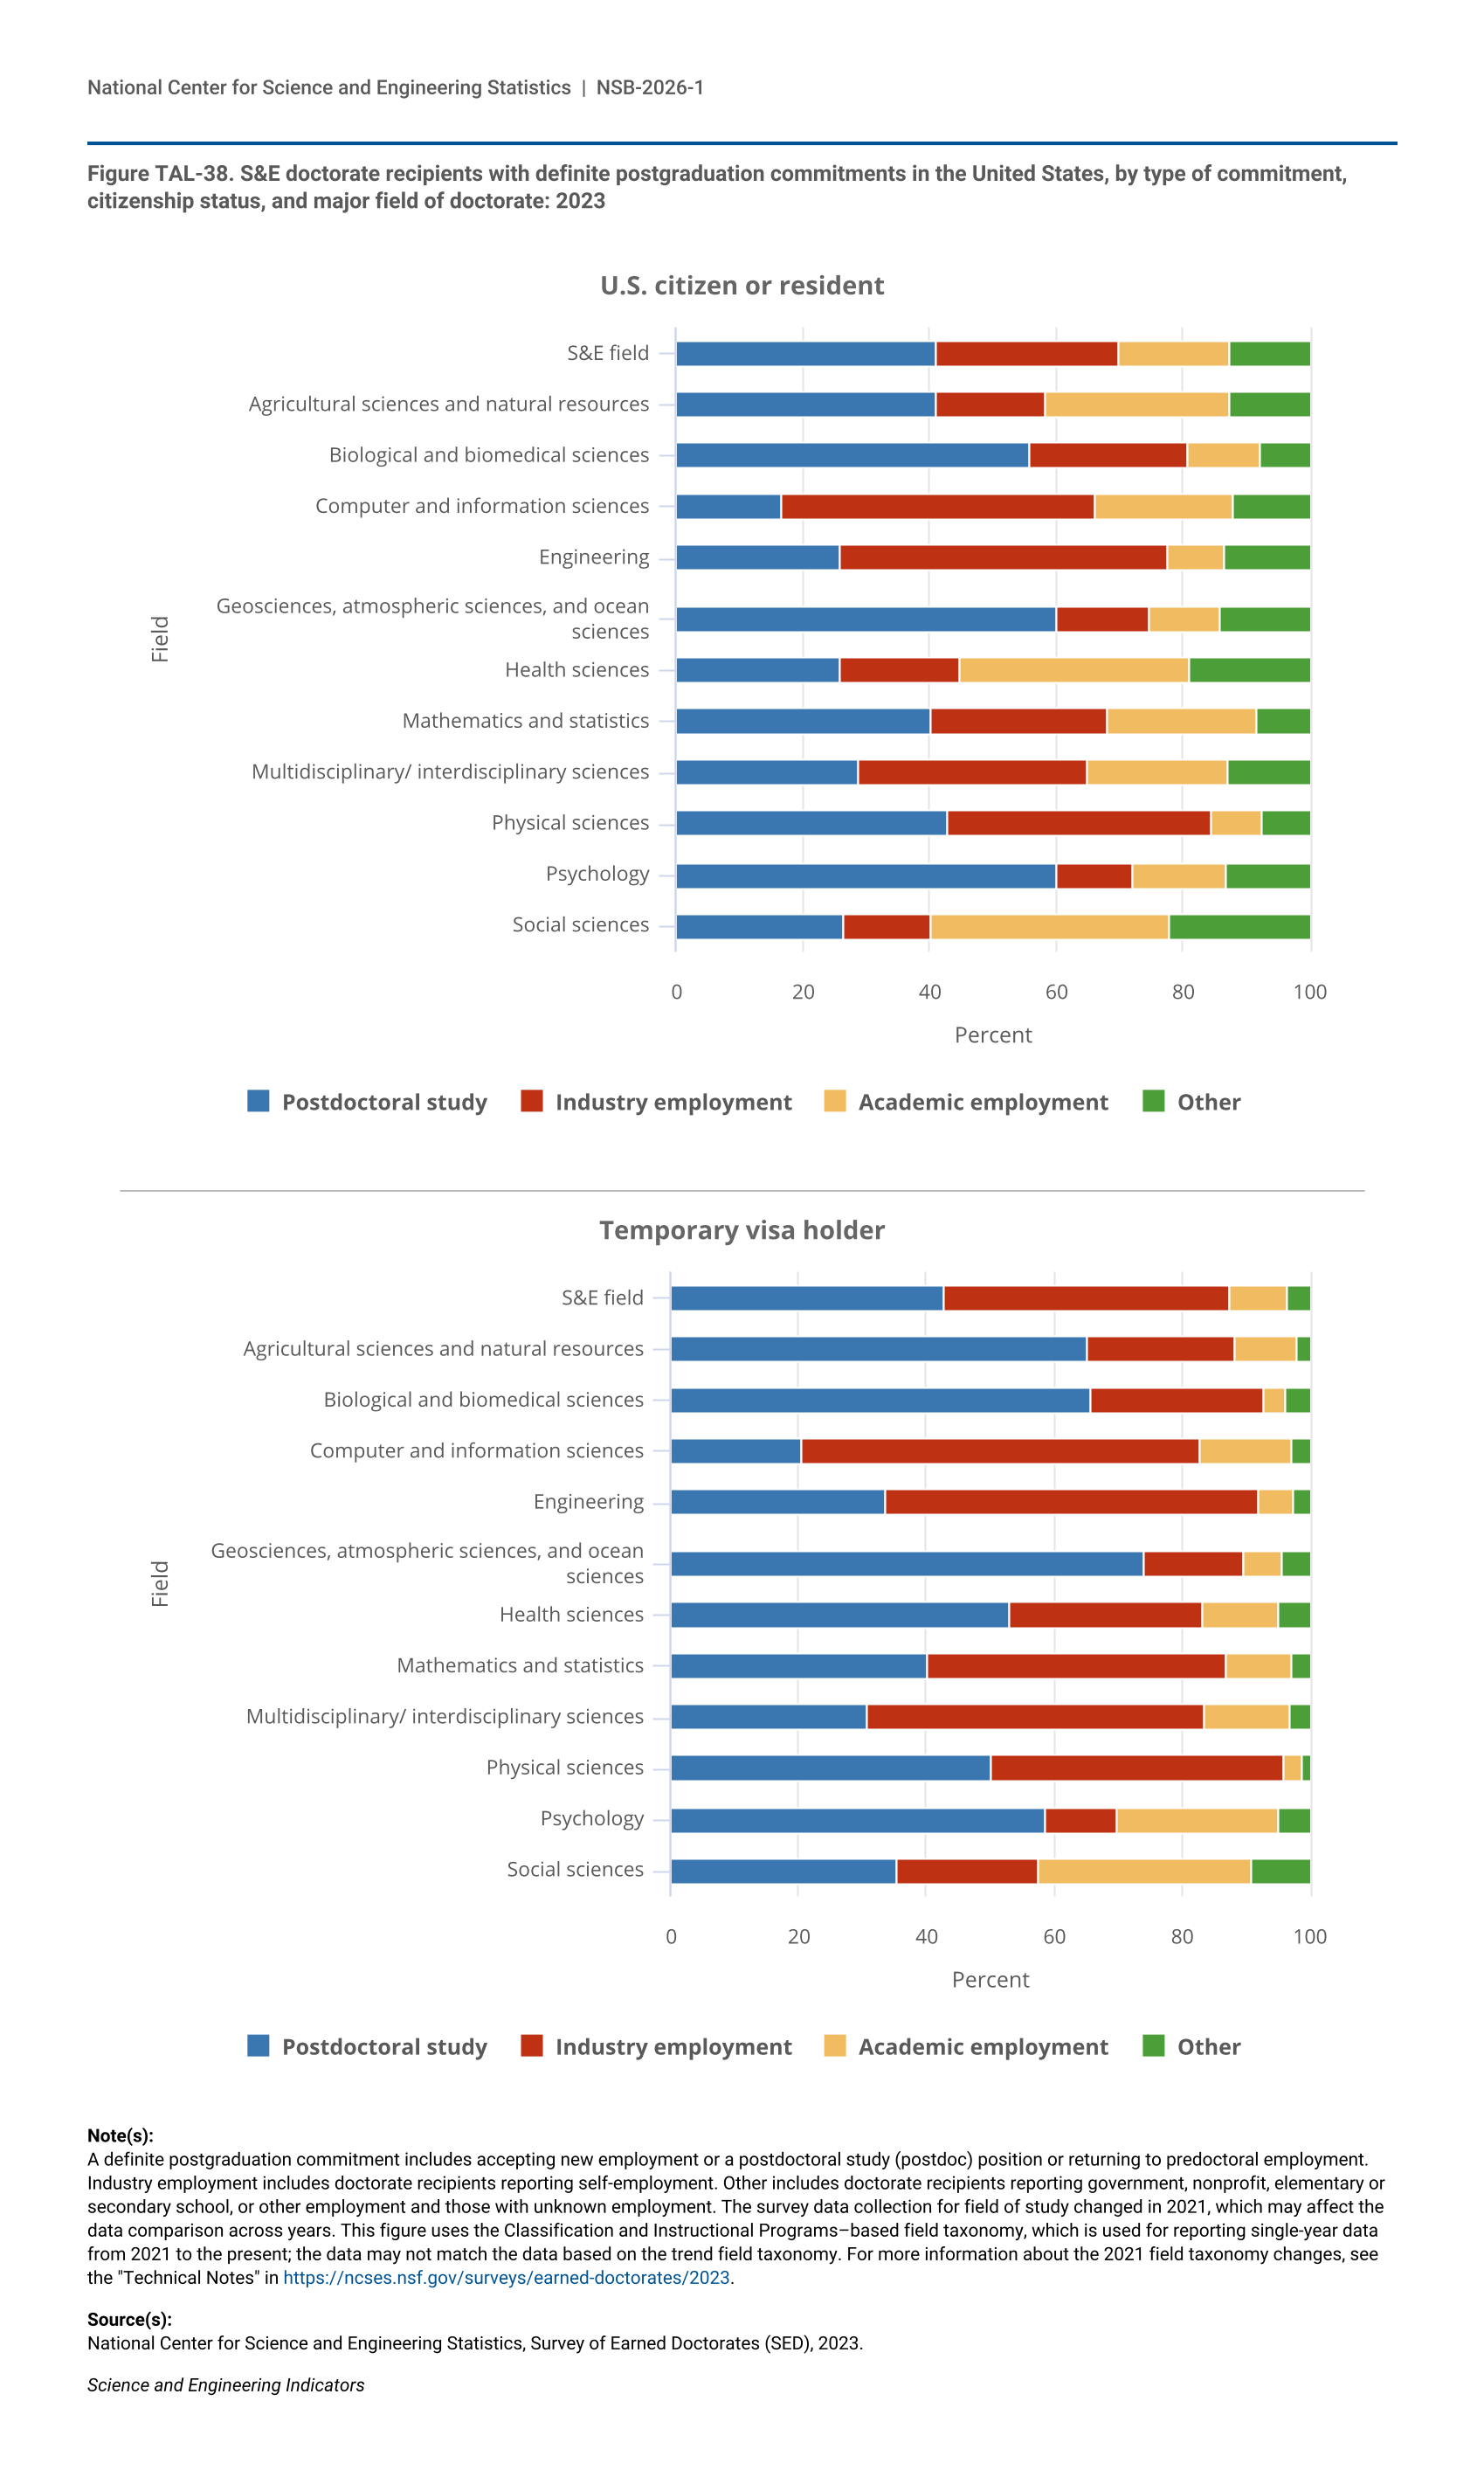
Figure TAL-38.
S&E doctorate recipients with definite postgraduation commitments in the United States, by type of commitment, citizenship status, and major field of doctorate: 2023
S&E doctorate recipients with definite postgraduation commitments in the United States, by type of commitment, citizenship status, and major field of doctorate: 2023
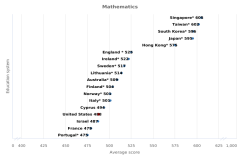
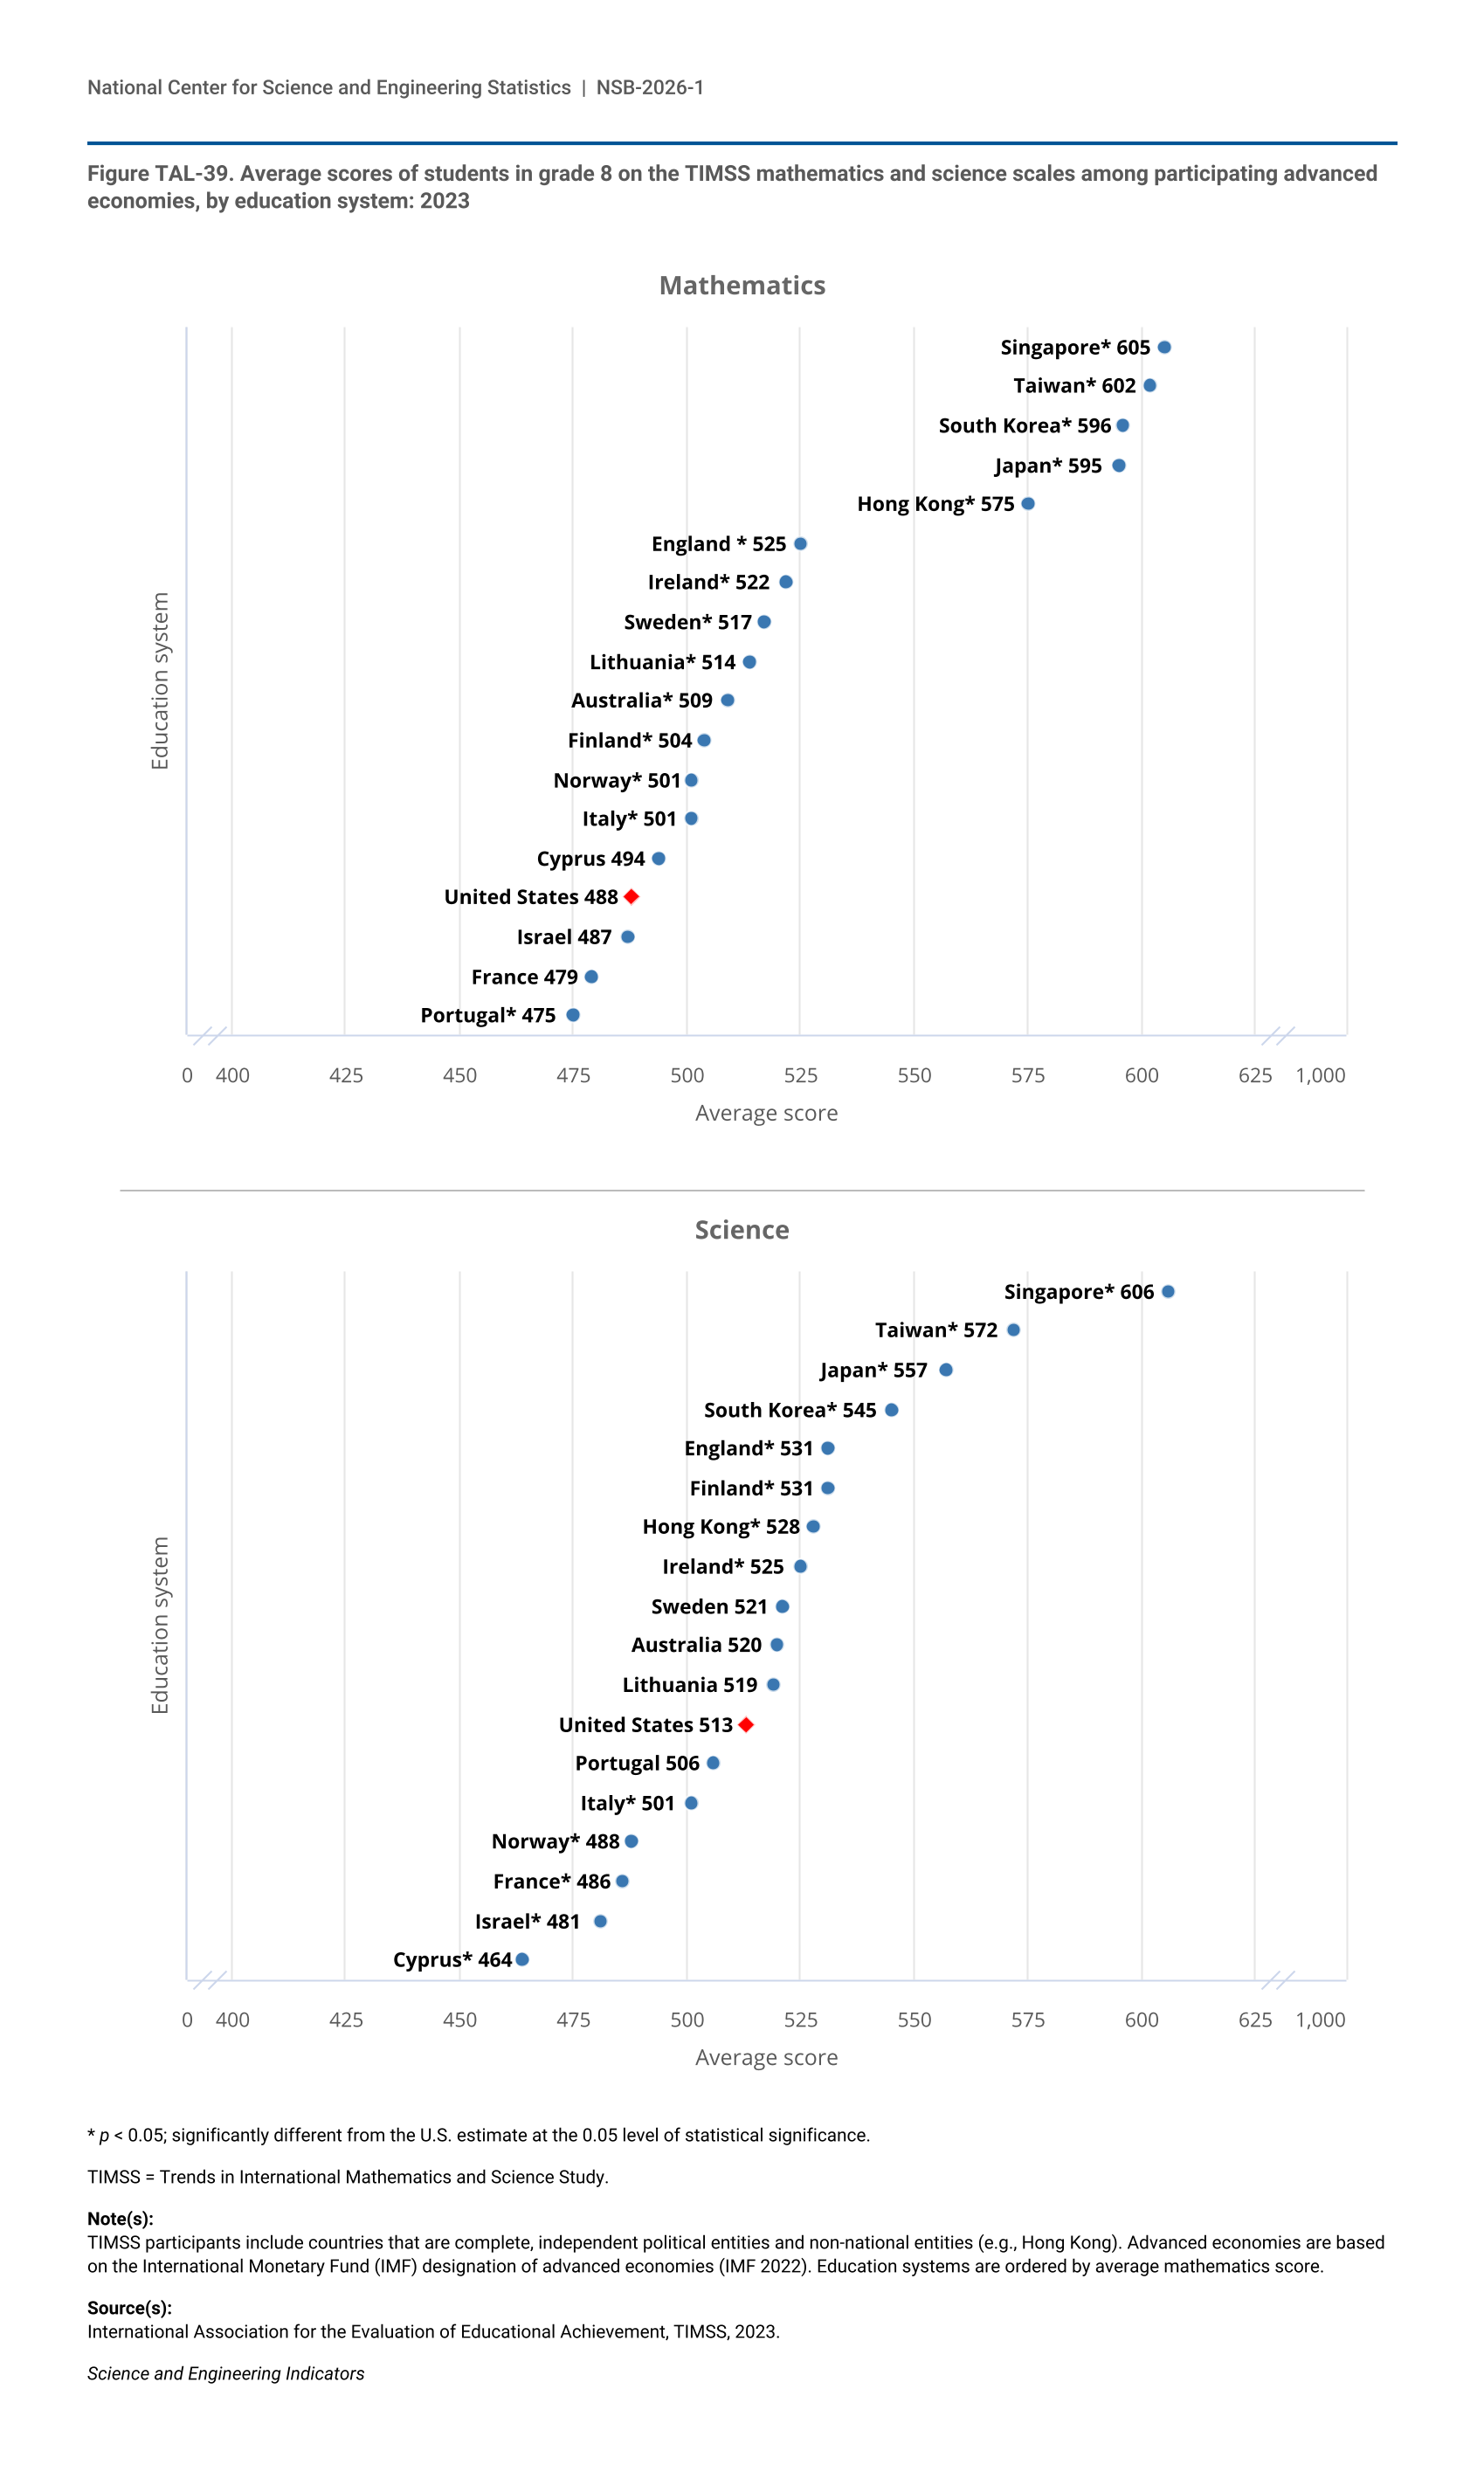
Figure TAL-39.
Average scores of students in grade 8 on the TIMSS mathematics and science scales among participating advanced economies, by education system: 2023
Average scores of students in grade 8 on the TIMSS mathematics and science scales among participating advanced economies, by education system: 2023
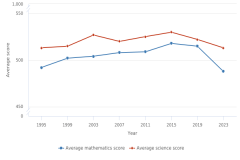
Figure TAL-40.
Average scores of U.S. students in grade 8 on the TIMSS mathematics and science scales: 1995–2023
Average scores of U.S. students in grade 8 on the TIMSS mathematics and science scales: 1995–2023
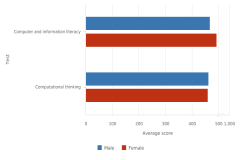
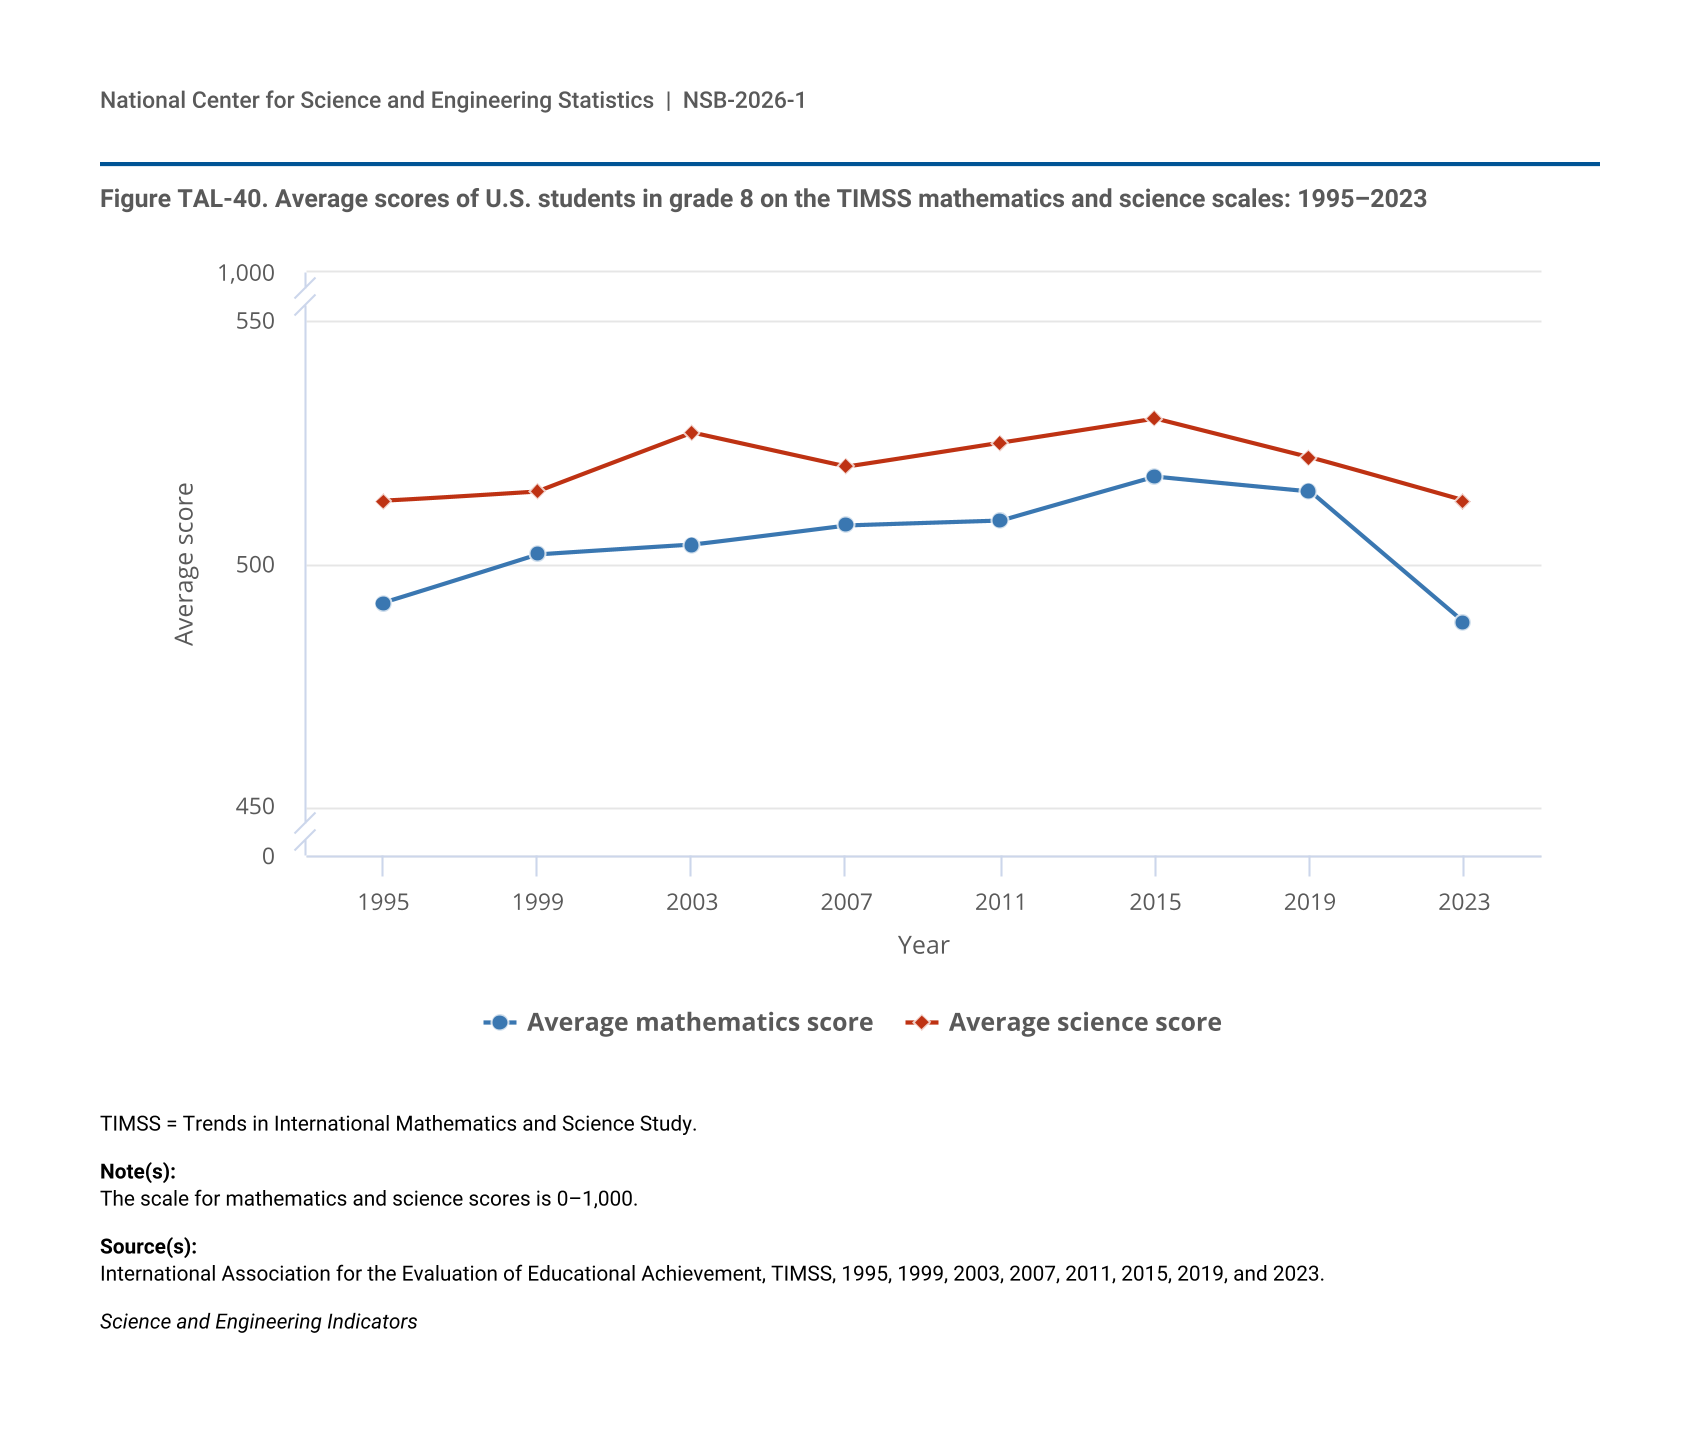
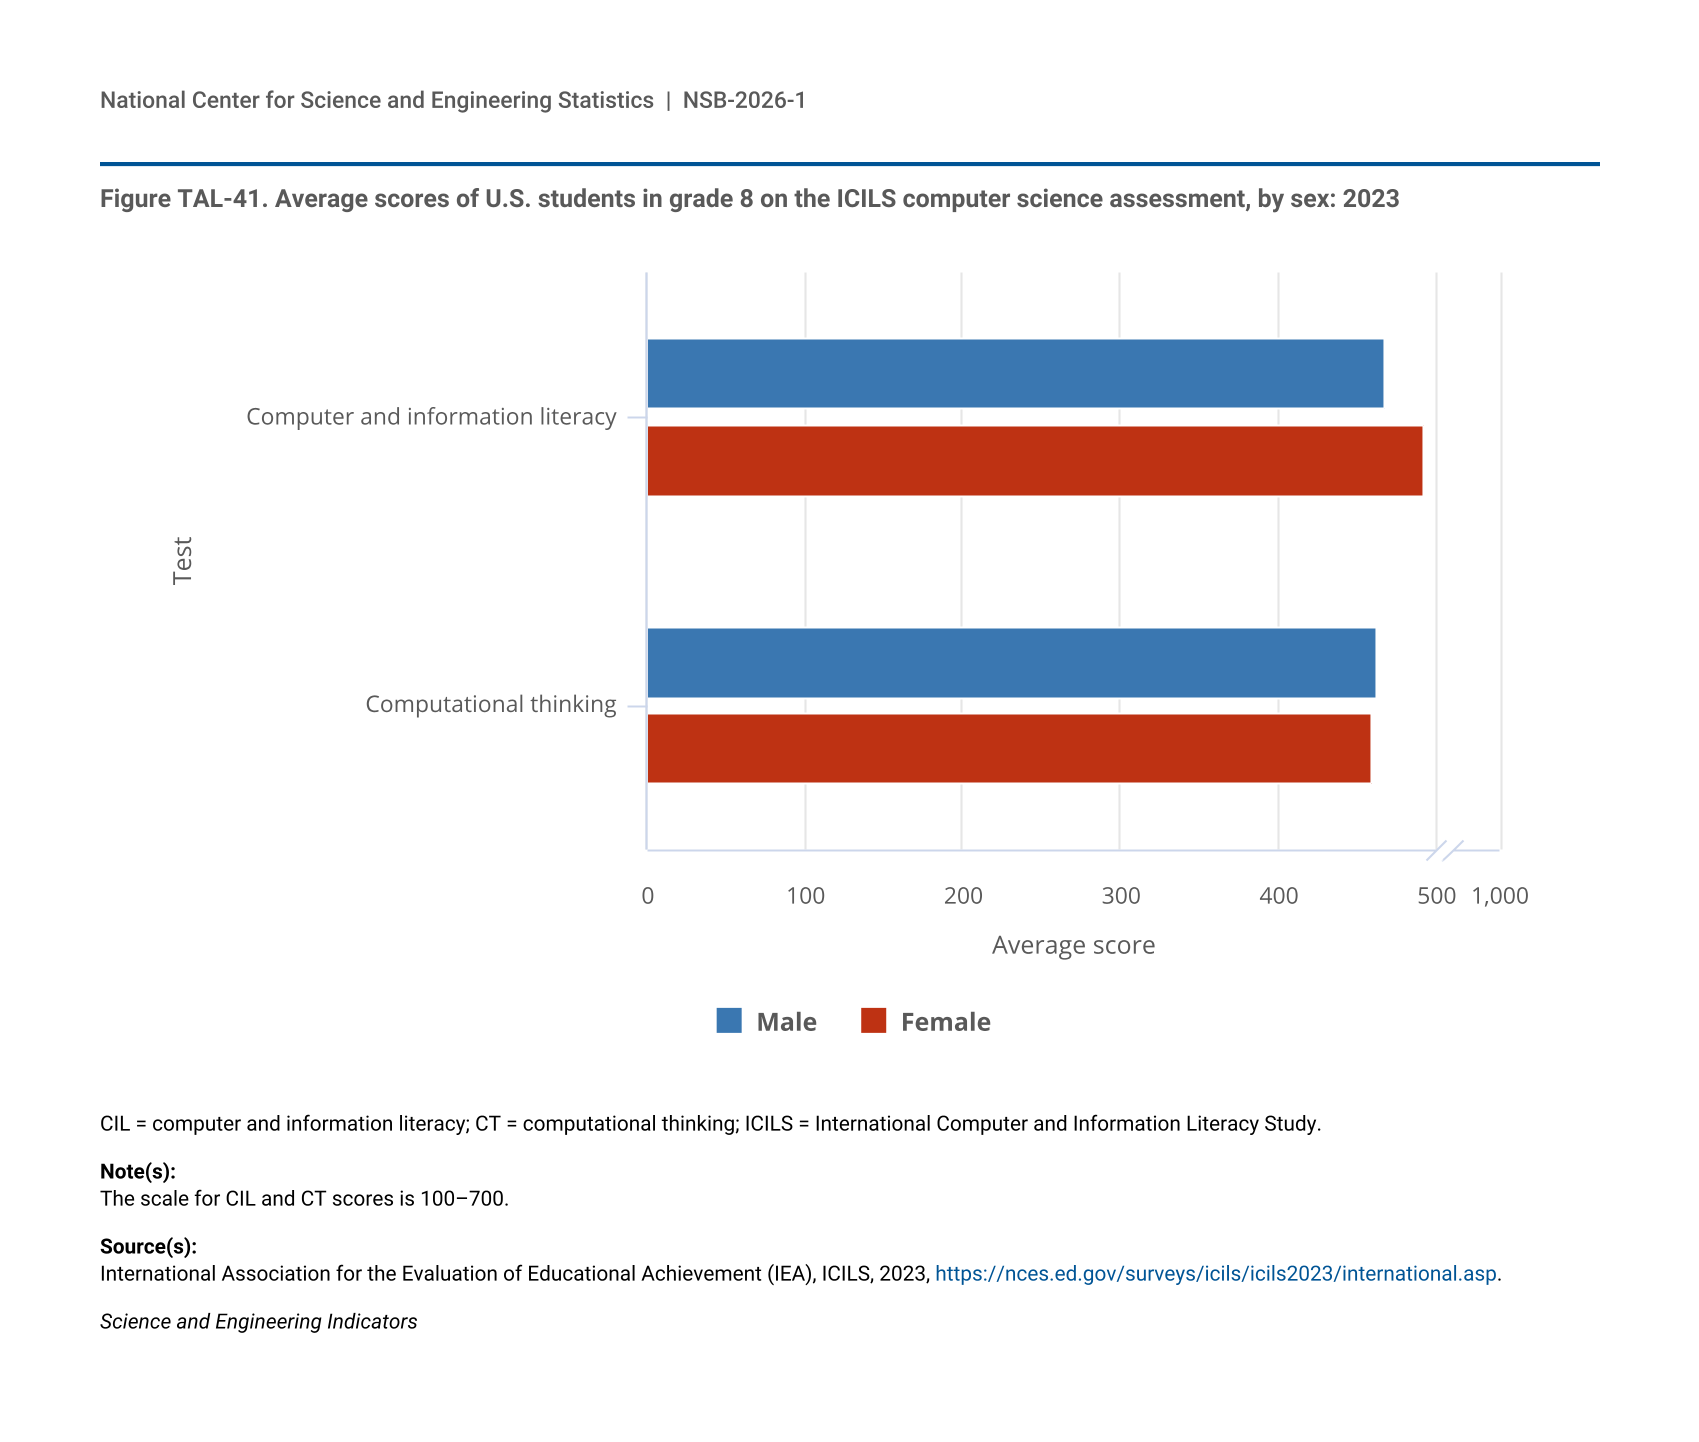
Figure TAL-41.
Average scores of U.S. students in grade 8 on the ICILS computer science assessment, by sex: 2023
Average scores of U.S. students in grade 8 on the ICILS computer science assessment, by sex: 2023
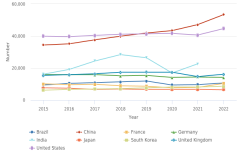
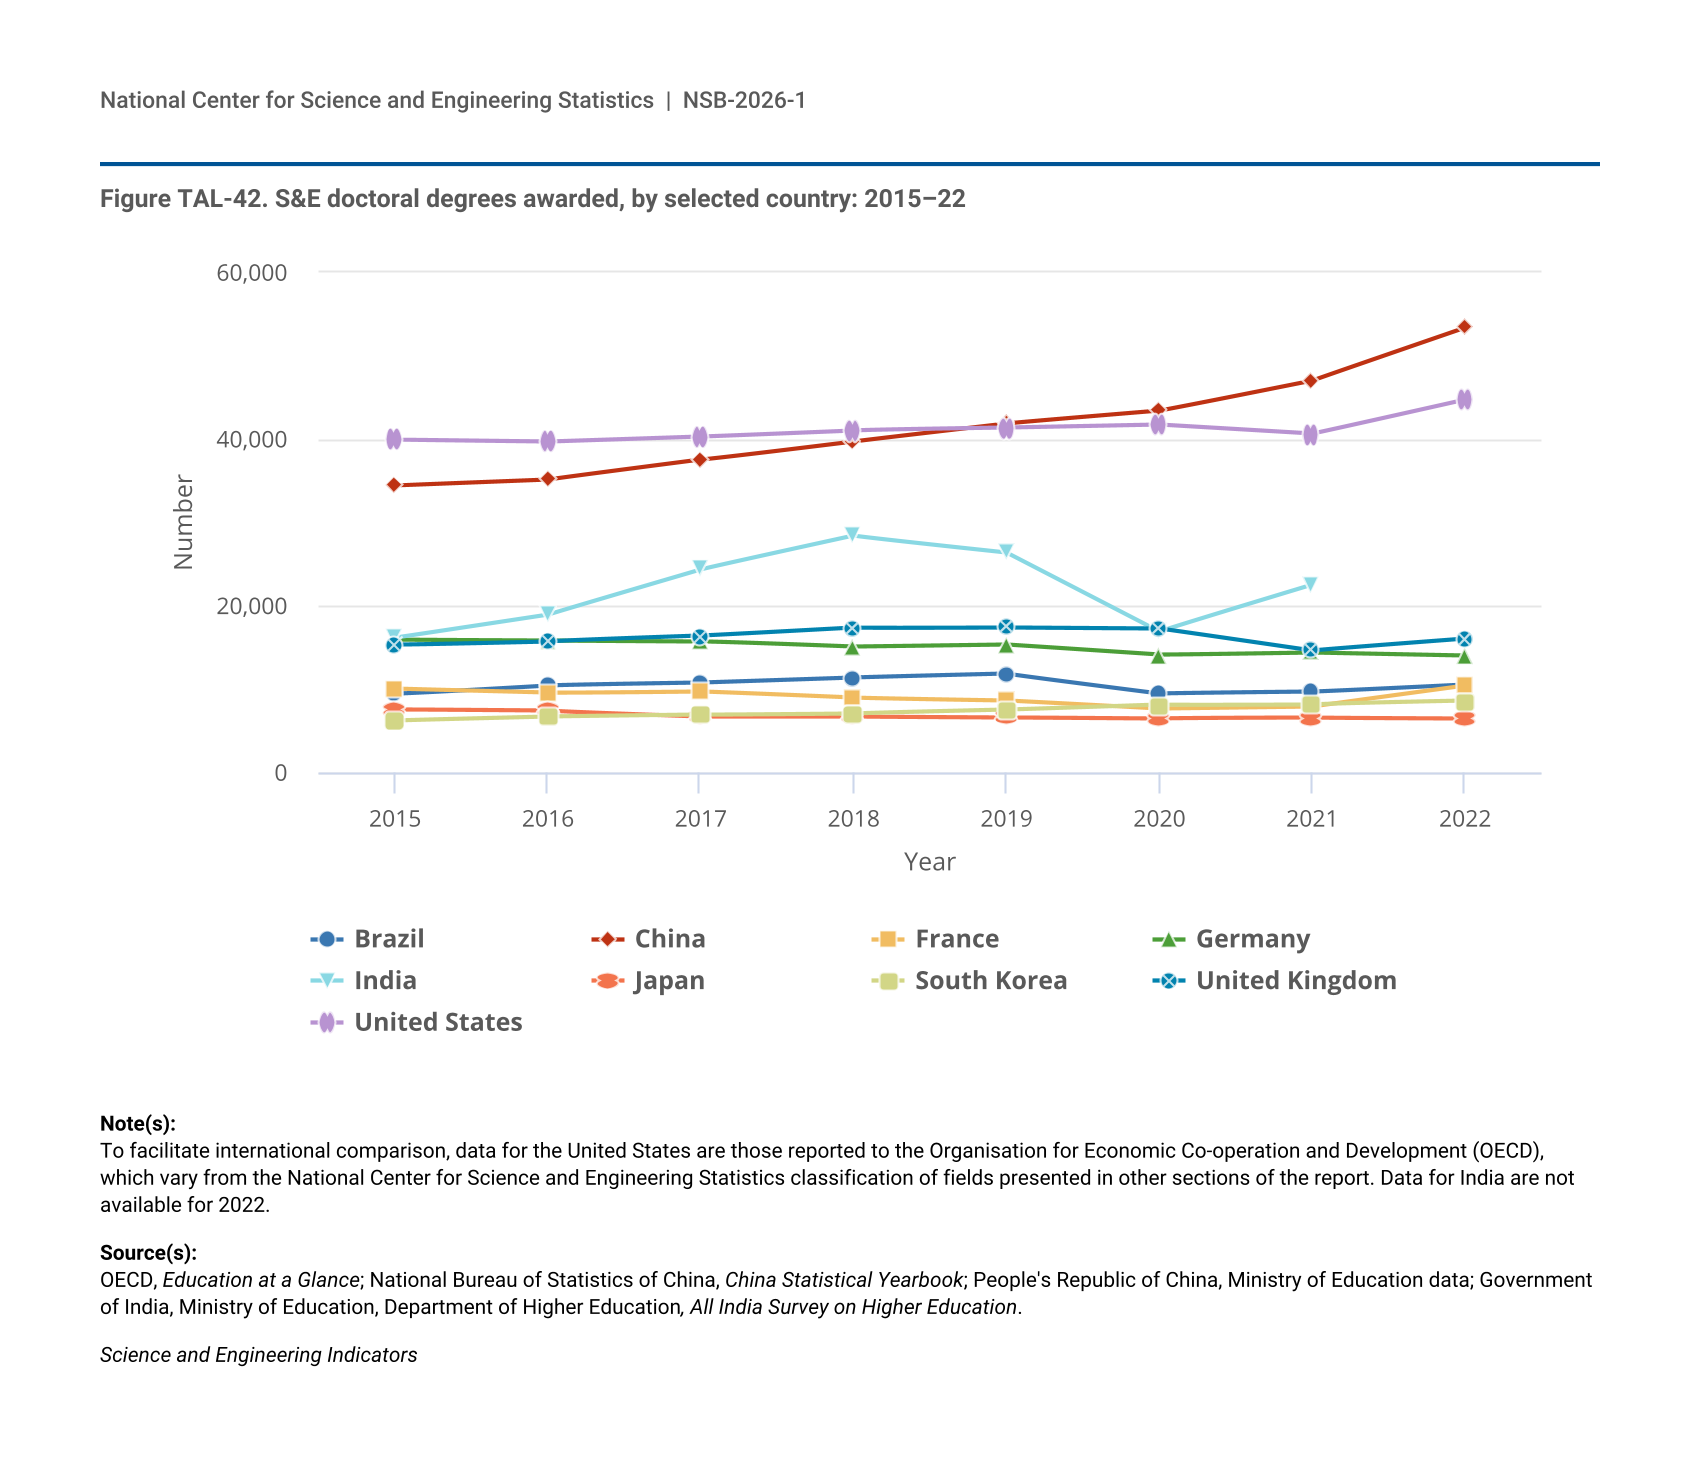
Figure TAL-42.
S&E doctoral degrees awarded, by selected country: 2015–22
S&E doctoral degrees awarded, by selected country: 2015–22
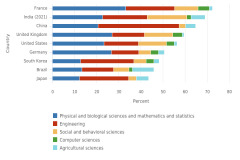
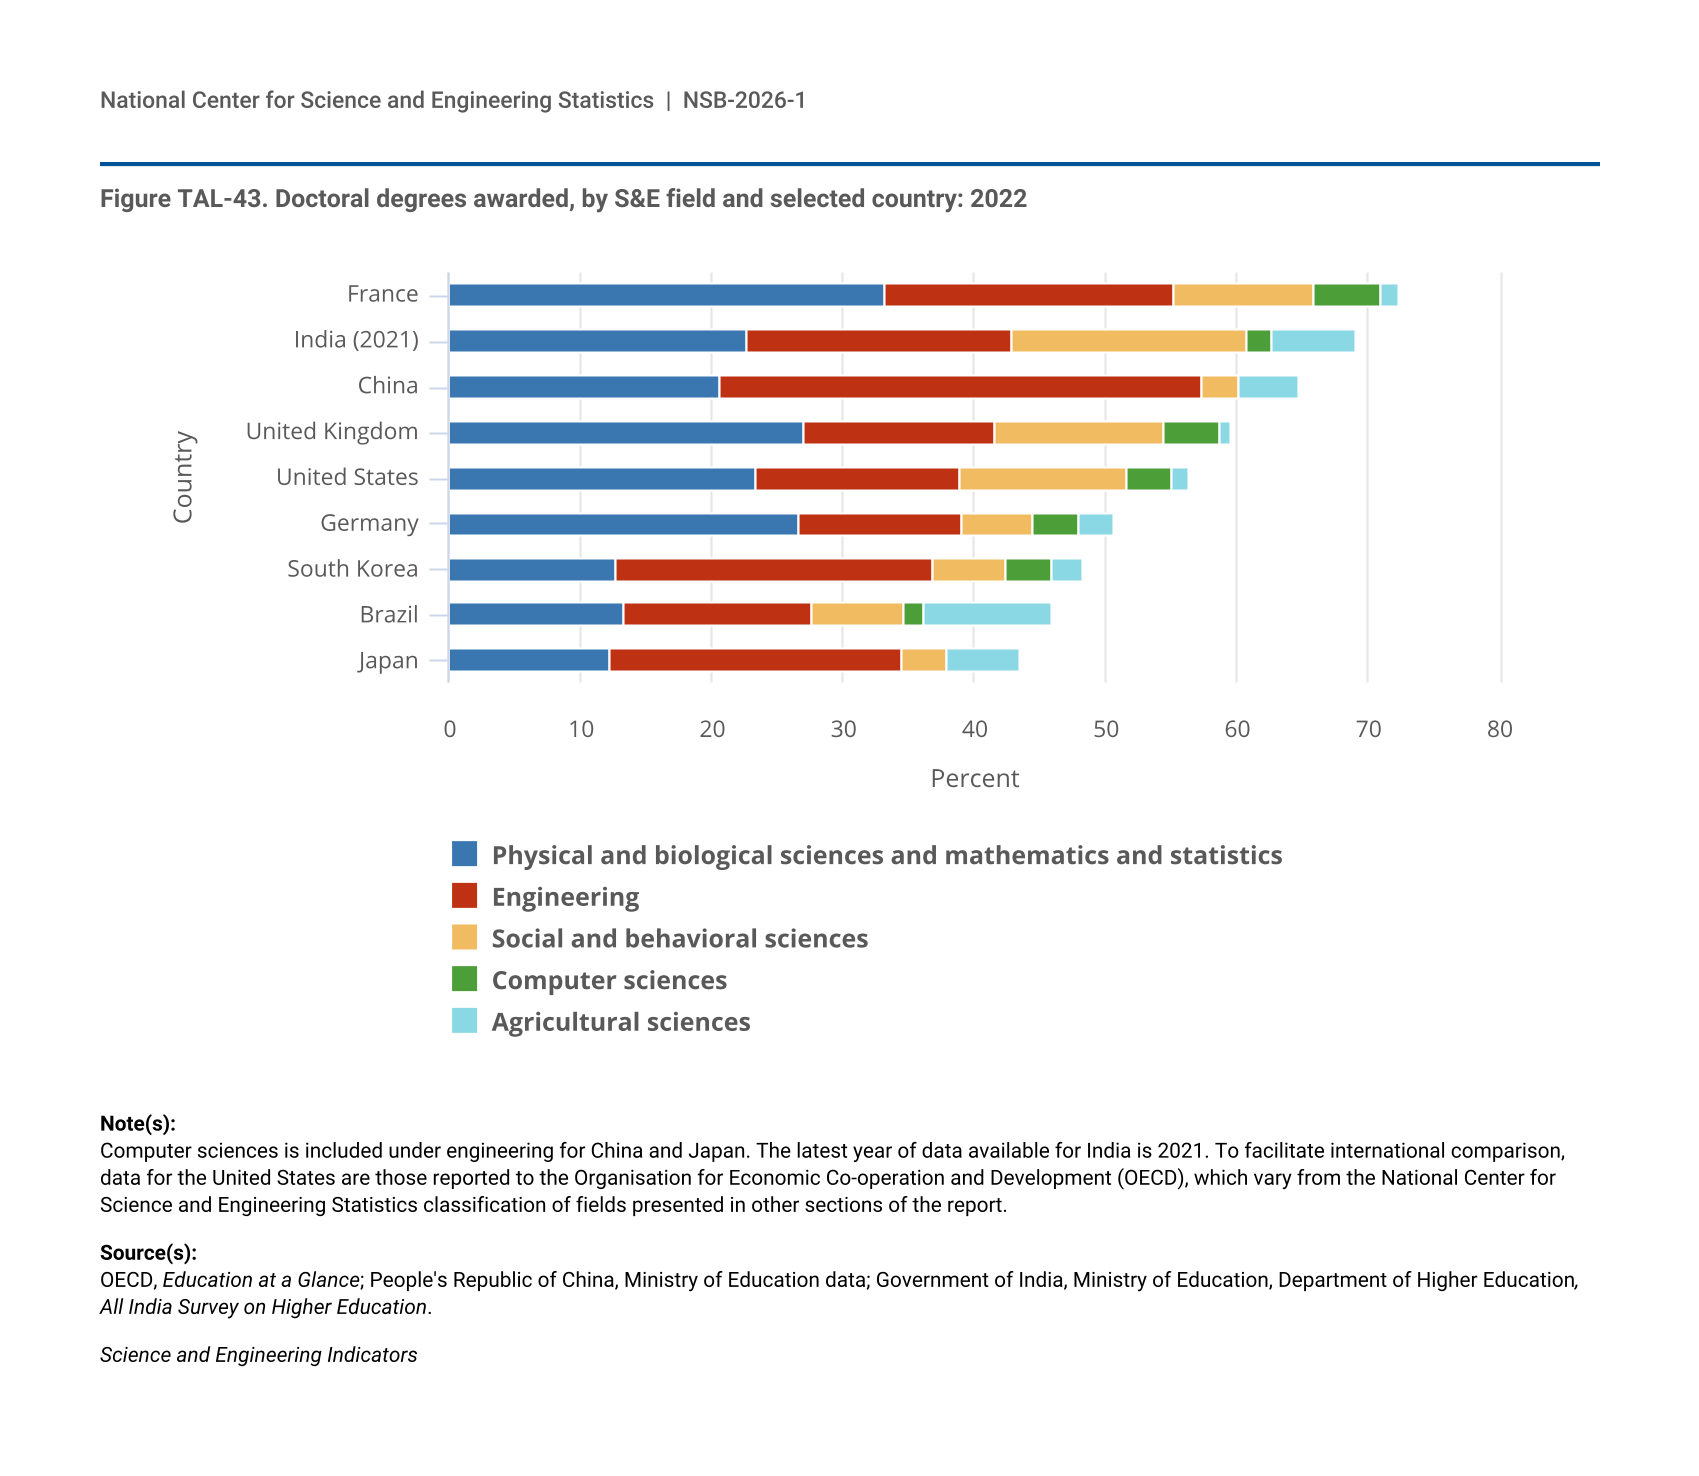
Figure TAL-43.
Doctoral degrees awarded, by S&E field and selected country: 2022
Doctoral degrees awarded, by S&E field and selected country: 2022
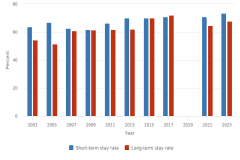
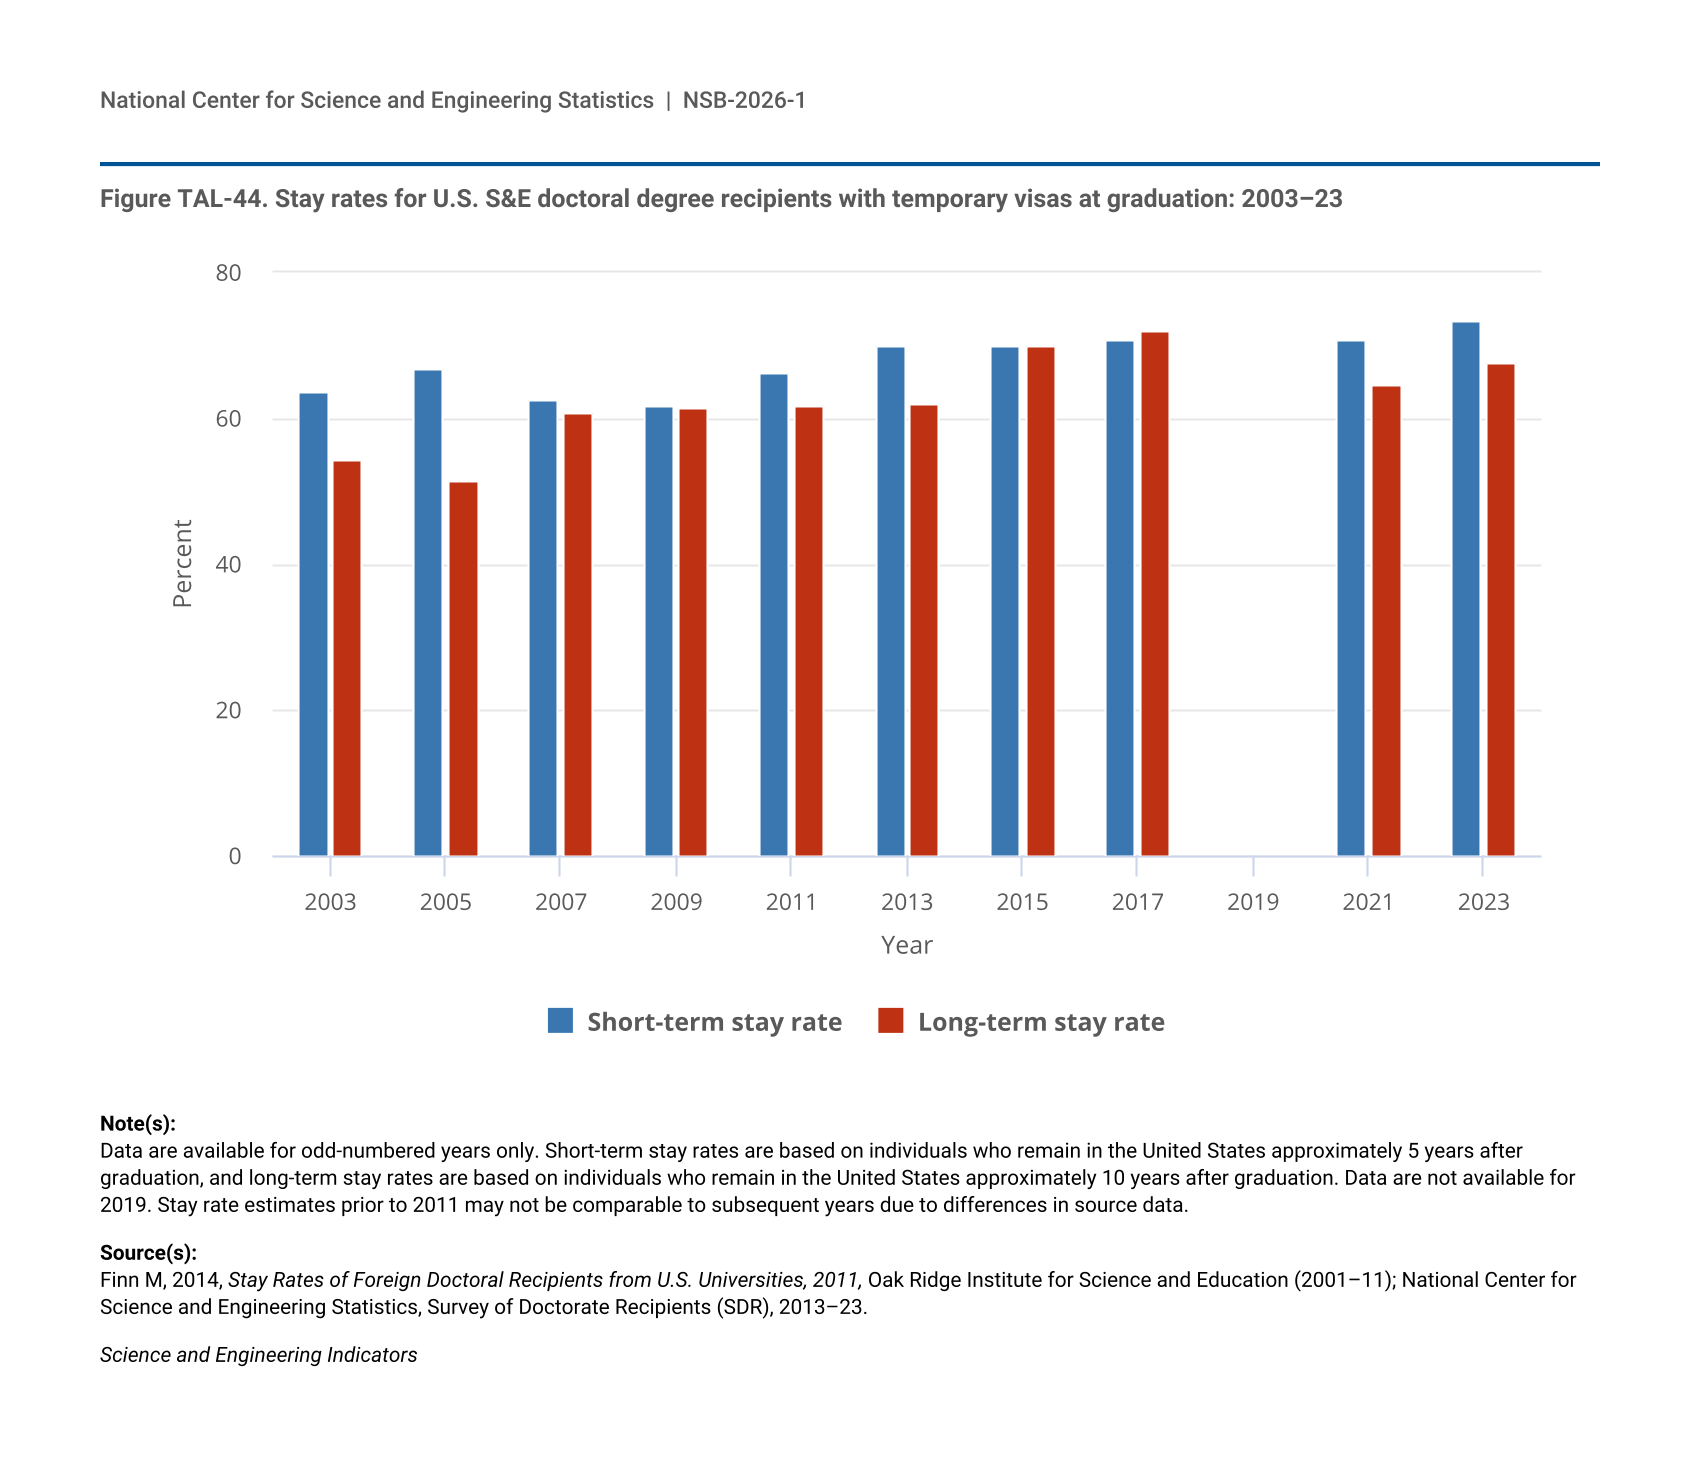
Figure TAL-44.
Stay rates for U.S. S&E doctoral degree recipients with temporary visas at graduation: 2003–23
Stay rates for U.S. S&E doctoral degree recipients with temporary visas at graduation: 2003–23
Data Sources
Item
Title
Provider
Product
Figure TAL-1
Size of the workforce, by occupational group and education level: 2023
U.S. Census Bureau
American Community Survey
Figure TAL-2
Workforce, by occupational group and sex: 2023
U.S. Census Bureau
American Community Survey
Figure TAL-3
Share of workers of each racial or ethnic group employed in STEM occupations, by race or ethnicity: 2023
U.S. Census Bureau
American Community Survey
Figure TAL-4
Workforce, by occupational group and educational attainment: 2023
U.S. Census Bureau
American Community Survey
Figure TAL-5
Field of study of highest degree and occupational group of S&E, S&E-related, and non-STEM workers with a bachelor's or an advanced degree: 2023
National Center for Science and Engineering Statistics
National Survey of College Graduates
Figure TAL-6
Unemployment rate, by occupational group: 2013–23
U.S. Census Bureau
American Community Survey
Figure TAL-7
Workers, by occupational group and rural/urban classification: Five-year sample, 2019–23
U.S. Census Bureau
American Community Survey
Figure TAL-8
Workers, by occupational group, rural/urban classification, and educational attainment: Five-year sample, 2019–23
U.S. Census Bureau
American Community Survey
Figure TAL-9
Size of the workforce, by occupational group: 2013–23
U.S. Census Bureau
American Community Survey
Figure TAL-10
Projected employment size, by occupational group: 2024 and 2034
Bureau of Labor Statistics
Employment Projections
Figure TAL-11
Share of STEM workers with credentials, by credential type and educational attainment: 2024
U.S. Census Bureau
Survey of Income and Program Participation
Figure TAL-12
Measures of population with a bachelor's or an advanced degree, by field of study, sex, and race and ethnicity: 2023
National Center for Science and Engineering Statistics
National Survey of College Graduates
Figure TAL-13
Share of workers in R&D-intensive industries, by occupational group: 2017 and 2022
U.S. Census Bureau
American Community Survey
Figure TAL-14
Share of workers in occupational groups, by R&D intensity: 2022
U.S. Census Bureau
American Community Survey
Figure TAL-15
Average scores of students in grades 4 and 8 on the main NAEP mathematics assessment: 1990–2024
National Center for Education Statistics
National Assessment of Educational Progress
Figure TAL-16
Average scores of students in grade 8 on the main NAEP mathematics assessment, by percentile: 1990–2024
National Center for Education Statistics
National Assessment of Educational Progress
Figure TAL-17
Average scores of students in grades 4 and 8 on the main NAEP mathematics assessment, by sex and socioeconomic status: 2024
National Center for Education Statistics
National Assessment of Educational Progress
Figure TAL-18
Average scores of students in grade 8 on the main NAEP mathematics assessment, by teacher characteristics: 2024
National Center for Education Statistics
National Assessment of Educational Progress
Figure TAL-19
Average scores of students in grade 8 on the main NAEP mathematics assessment, by state: 2024
National Center for Education Statistics
National Assessment of Educational Progress
Figure TAL-21
S&E awards conferred, by award level: 2013–23
National Center for Education Statistics
Integrated Postsecondary Education Data System (IPEDS), Completions Survey
Figure TAL-22
S&E degrees as a percentage of total degrees awarded: 2013 and 2023
National Center for Education Statistics
Integrated Postsecondary Education Data System (IPEDS), Completions Survey
Figure TAL-23
S&E undergraduate degrees awarded, by field: 2013 and 2023
National Center for Education Statistics
Integrated Postsecondary Education Data System (IPEDS), Completions Survey
Figure TAL-24
S&E graduate degrees awarded, by field: 2013 and 2023
National Center for Education Statistics
Integrated Postsecondary Education Data System (IPEDS), Completions Survey
Figure TAL-25
S&E-related awards conferred, by award level: 2013–23
National Center for Education Statistics
Integrated Postsecondary Education Data System (IPEDS), Completions Survey
Figure TAL-26
Share of bachelor's degrees awarded in S&E fields, by state: 2023
National Center for Education Statistics
Integrated Postsecondary Education Data System (IPEDS), Completions Survey
Figure TAL-27
Share of doctoral degrees awarded in S&E fields, by state: 2023
National Center for Science and Engineering Statistics
Survey of Earned Doctorates
Figure TAL-28
S&E and S&E-related degrees awarded, by sex, field, and degree level: 2023
National Center for Education Statistics
Integrated Postsecondary Education Data System (IPEDS), Completions Survey
Figure TAL-29
S&E doctoral degrees awarded, by sex and field: 2023
National Center for Education Statistics
Integrated Postsecondary Education Data System (IPEDS), Completions Survey
Figure TAL-30
Race and ethnicity of U.S. resident population, ages 20–34, and U.S. citizen and permanent resident S&E award recipients, by degree level: 2023
National Center for Education Statistics
Integrated Postsecondary Education Data System (IPEDS), Completions Survey
Figure TAL-30
Race and ethnicity of U.S. resident population, ages 20–34, and U.S. citizen and permanent resident S&E award recipients, by degree level: 2023
U.S. Census Bureau
Population Estimates Program
Figure TAL-31
Share of S&E degrees awarded to temporary visa holders, by degree level: 2013–23
National Center for Education Statistics
Integrated Postsecondary Education Data System (IPEDS), Completions Survey
Figure TAL-32
S&E and S&E-related associate's degrees awarded, by institution type: 2013–23
National Center for Education Statistics
Integrated Postsecondary Education Data System (IPEDS), Completions Survey
Figure TAL-33
Broad field for S&E associate's degrees awarded by community colleges: 2023
National Center for Education Statistics
Integrated Postsecondary Education Data System (IPEDS), Completions Survey
Figure TAL-34
Broad field for S&E-related associate's degrees awarded by community colleges: 2023
National Center for Education Statistics
Integrated Postsecondary Education Data System (IPEDS), Completions Survey
Figure TAL-35
Doctorate recipients who earned college credit at a community or 2-year college, by field: 2023
National Center for Science and Engineering Statistics
Survey of Earned Doctorates
Figure TAL-36
Among fall 2009 ninth graders who completed a postsecondary STEM degree by 2021, percentage who completed a bachelor's degree or a certificate or an associate's degree, by select student characteristics
National Center for Education Statistics
High School Longitudinal Study of 2009
Figure TAL-37
S&E doctorate recipients with definite postgraduation commitments in the United States, by citizenship status and field of doctorate: 2023
National Center for Science and Engineering Statistics
Survey of Earned Doctorates
Figure TAL-38
S&E doctorate recipients with definite postgraduation commitments in the United States, by type of commitment, citizenship status, and major field of doctorate: 2023
National Center for Science and Engineering Statistics
Survey of Earned Doctorates
Figure TAL-39
Average scores of students in grade 8 on the TIMSS mathematics and science scales among participating advanced economies, by education system: 2023
International Association for the Evaluation of Educational Achievement
Trends in International Mathematics and Science Study
Figure TAL-40
Average scores of U.S. students in grade 8 on the TIMSS mathematics and science scales: 1995–2023
International Association for the Evaluation of Educational Achievement
Trends in International Mathematics and Science Study
Figure TAL-41
Average scores of U.S. students in grade 8 on the ICILS computer science assessment, by sex: 2023
International Association for the Evaluation of Educational Achievement
International Computer and Information Literacy Study
Figure TAL-42
S&E doctoral degrees awarded, by selected country: 2015–22
Government of India, Ministry of Education, Department of Higher Education
All India Survey on Higher Education
Figure TAL-42
S&E doctoral degrees awarded, by selected country: 2015–22
Ministry of Education, People's Republic of China
Higher Education Data
Figure TAL-42
S&E doctoral degrees awarded, by selected country: 2015–22
National Bureau of Statistics of China
China Statistical Yearbook
Figure TAL-42
S&E doctoral degrees awarded, by selected country: 2015–22
Organisation for Economic Co-operation and Development
Education at a Glance
Figure TAL-43
Doctoral degrees awarded, by S&E field and selected country: 2022
Government of India, Ministry of Education, Department of Higher Education
All India Survey on Higher Education
Figure TAL-43
Doctoral degrees awarded, by S&E field and selected country: 2022
Ministry of Education, People's Republic of China
Higher Education Data
Figure TAL-43
Doctoral degrees awarded, by S&E field and selected country: 2022
Organisation for Economic Co-operation and Development
Education at a Glance
Figure TAL-44
Stay rates for U.S. S&E doctoral degree recipients with temporary visas at graduation: 2003–23
National Center for Science and Engineering Statistics
Survey of Doctorate Recipients
Table STAL-1
Workers, by occupational group, race and ethnicity, educational attainment, geography, and major industries: 2023
U.S. Census Bureau
American Community Survey
Table STAL-2
Working-age individuals, by occupational group and employment status: 2013–23
U.S. Census Bureau
American Community Survey
Table STAL-3
Representation of STEM workers, by occupational group, across states: 2023
U.S. Census Bureau
American Community Survey
Table STAL-4
Workers, by state, occupational group, and educational attainment: 2023
U.S. Census Bureau
American Community Survey
Table STAL-5
Participation in the workforce, by state and occupational group: 2023
U.S. Census Bureau
American Community Survey
Table STAL-6
STEM workforce, by state, occupational group, and education level: 2023
U.S. Census Bureau
American Community Survey
Table STAL-7
Workers, by rural-urban classification, occupational group, and educational attainment: Five-year sample, 2019–23
U.S. Census Bureau
American Community Survey
Table STAL-8
Workers, by state and occupational group: 2013–23
U.S. Census Bureau
American Community Survey
Table STAL-10
STEM workers, by occupational group, credential type, credential attainment, and educational attainment: 2024
U.S. Census Bureau
Survey of Income and Program Participation
Table STAL-11
Measures of population with a bachelor's or an advanced degree, by field of study, race and ethnicity, and sex: 2023
National Center for Science and Engineering Statistics
National Survey of College Graduates
Table STAL-12
Workforce, STEM workforce by place of birth, and the educational attainment and citizenship status of the foreign-born STEM workforce, by major industry: 2023
U.S. Census Bureau
American Community Survey
Table STAL-13
Industries with R&D intensity higher than the average across industries: 2022
U.S. Census Bureau
American Community Survey
Table STAL-14
Workers, by occupational group, educational level, and industry: 2017 and 2022
U.S. Census Bureau
American Community Survey
Table STAL-15
Average scores of students in grades 4 and 8 on the NAEP mathematics assessment, by student grade and characteristic: 1990–2024
National Center for Education Statistics
National Assessment of Educational Progress
Table STAL-16
Percentile scores of students in grades 4, 8, and 12 on the NAEP mathematics assessment: 1990–2024
National Center for Education Statistics
National Assessment of Educational Progress
Table STAL-17
Average scores of students in grade 8 on the main NAEP mathematics assessment, by school enrichment offerings: 2024
National Center for Education Statistics
National Assessment of Educational Progress
Table STAL-18
Average scores of students in grades 4 and 8 on the NAEP mathematics assessment, by region and school location: 2003–24
National Center for Education Statistics
National Assessment of Educational Progress
Table STAL-19
Average scores of students in grade 12 on the NAEP mathematics assessment, by student characteristic: 2005–24
National Center for Education Statistics
National Assessment of Educational Progress
Table STAL-20
Degrees awarded, by degree level, citizenship status, and field: 2023
National Center for Education Statistics
Integrated Postsecondary Education Data System (IPEDS), Completions Survey
Table STAL-21
Among fall 2009 ninth graders who enrolled in a postsecondary major by December 2017, number who completed a STEM degree, non-STEM degree or no degree: June 2021
National Center for Education Statistics
High School Longitudinal Study of 2009
Table STAL-22
Average scores of 15-year-old students on the PISA mathematics and science literacy scales, by OECD education system: 2022
Organisation for Economic Co-operation and Development
Program for International Student Assessment
Table STAL-23
Average CIL and CT scores of students in grade 8 on the ICILS computer science assessment, by education system: 2023
International Association for the Evaluation of Educational Achievement
International Computer and Information Literacy Study
Table STAL-24
Average scores of students in grade 8 on the TIMSS mathematics and science scales among participating economies, by education system: 2023
International Association for the Evaluation of Educational Achievement
Trends in International Mathematics and Science Study
Table TAL-2
Median earnings of full-time, year-round workers, by educational attainment and occupational group: 2023
U.S. Census Bureau
American Community Survey
Table TAL-4
Workers, by region of birth and occupational group: 2023
U.S. Census Bureau
American Community Survey
Table TAL-5
Foreign-born workers, by selected region, country, or economy of origin and occupational group: 2023
U.S. Census Bureau
American Community Survey
Table TAL-6
Citizenship status of foreign-born STEM workers, by selected region, country, or economy of origin: 2023
U.S. Census Bureau
American Community Survey
Table TAL-7
Measures of population with a bachelor's or an advanced degree, by field of study: 2023
National Center for Science and Engineering Statistics
National Survey of College Graduates
Table TAL-8
Workers in major industries, by occupational group: 2023
U.S. Census Bureau
American Community Survey
Table TAL-9
STEM workforce and the educational attainment, citizenship status, and country or economy of the foreign-born STEM workforce, by major industry: 2023
U.S. Census Bureau
American Community Survey
Table TAL-10
Average scores of students in grades 4, 8, and 12 on the main NAEP mathematics assessment, by race or ethnicity: 2024
National Center for Education Statistics
National Assessment of Educational Progress
Table TAL-11
S&E-related degrees awarded, by degree level and field: 2013 and 2023
National Center for Education Statistics
Integrated Postsecondary Education Data System (IPEDS), Completions Survey
Table TAL-12
Recent recipients of their first bachelor's degrees who reported attending community college, by timing of attendance and broad field area: 2023
National Center for Science and Engineering Statistics
National Survey of College Graduates
Table TAL-13
Degrees awarded by HBCUs and TCCUs, by degree level and field area: 2023
National Center for Education Statistics
Integrated Postsecondary Education Data System (IPEDS), Completions Survey
Table TAL-14
Among fall 2009 ninth graders who started as a STEM major and completed a postsecondary degree by 2021, percentage who completed a STEM degree, by student characteristics
National Center for Education Statistics
High School Longitudinal Study of 2009
Table TAL-15
S&E doctorate recipients with definite postgraduation commitments, by location of commitments, citizenship status, and field of doctorate: 2023
National Center for Science and Engineering Statistics
Survey of Earned Doctorates
Table TAL-16
Average CIL and CT scores of U.S. students in grade 8, by race or ethnicity and school poverty level: 2023
International Association for the Evaluation of Educational Achievement
International Computer and Information Literacy Study
Table TAL-17
Postgraduation plans of U.S. S&E doctorates on temporary resident visas to stay in the United States, by broad field of doctorate and country or economy of origin: 2012–23
National Center for Science and Engineering Statistics
Survey of Earned Doctorates
Table TAL-18
U.S. stay rates for S&E doctorates holding temporary U.S. visas at doctoral graduation, by key characteristics: 2023
National Center for Science and Engineering Statistics
Survey of Doctorate Recipients
Table TAL-19
Internationally mobile students enrolled in tertiary education, by selected country of destination: 2017–23
UNESCO Institute for Statistics
UIS.Stat database